EP0120229B1 - System and method for resist defect measurement on semiconductors - Google Patents
System and method for resist defect measurement on semiconductors Download PDFInfo
- Publication number
- EP0120229B1 EP0120229B1 EP84101099A EP84101099A EP0120229B1 EP 0120229 B1 EP0120229 B1 EP 0120229B1 EP 84101099 A EP84101099 A EP 84101099A EP 84101099 A EP84101099 A EP 84101099A EP 0120229 B1 EP0120229 B1 EP 0120229B1
- Authority
- EP
- European Patent Office
- Prior art keywords
- electrolyte
- light
- substrate
- spot
- coating
- Prior art date
- Legal status (The legal status is an assumption and is not a legal conclusion. Google has not performed a legal analysis and makes no representation as to the accuracy of the status listed.)
- Expired
Links
- 230000007547 defect Effects 0.000 title claims description 78
- 238000000034 method Methods 0.000 title claims description 49
- 239000004065 semiconductor Substances 0.000 title claims description 36
- 238000005259 measurement Methods 0.000 title description 3
- 239000003792 electrolyte Substances 0.000 claims description 45
- 238000012360 testing method Methods 0.000 claims description 30
- 238000000576 coating method Methods 0.000 claims description 28
- 239000000758 substrate Substances 0.000 claims description 26
- 230000003287 optical effect Effects 0.000 claims description 17
- 239000011248 coating agent Substances 0.000 claims description 14
- XUIMIQQOPSSXEZ-UHFFFAOYSA-N Silicon Chemical compound [Si] XUIMIQQOPSSXEZ-UHFFFAOYSA-N 0.000 claims description 11
- 229910052710 silicon Inorganic materials 0.000 claims description 11
- 239000010703 silicon Substances 0.000 claims description 11
- 230000033001 locomotion Effects 0.000 claims description 6
- 230000014759 maintenance of location Effects 0.000 claims description 6
- 229910052751 metal Inorganic materials 0.000 claims description 6
- 239000002184 metal Substances 0.000 claims description 6
- QAOWNCQODCNURD-UHFFFAOYSA-N Sulfuric acid Chemical compound OS(O)(=O)=O QAOWNCQODCNURD-UHFFFAOYSA-N 0.000 claims description 5
- 238000013507 mapping Methods 0.000 claims description 5
- 239000000463 material Substances 0.000 claims description 5
- 239000000835 fiber Substances 0.000 claims description 4
- 239000004033 plastic Substances 0.000 claims description 4
- 239000012212 insulator Substances 0.000 claims description 3
- HFMDLUQUEXNBOP-UHFFFAOYSA-N n-[4-amino-1-[[1-[[4-amino-1-oxo-1-[[6,9,18-tris(2-aminoethyl)-15-benzyl-3-(1-hydroxyethyl)-12-(2-methylpropyl)-2,5,8,11,14,17,20-heptaoxo-1,4,7,10,13,16,19-heptazacyclotricos-21-yl]amino]butan-2-yl]amino]-3-hydroxy-1-oxobutan-2-yl]amino]-1-oxobutan-2-yl] Chemical compound OS(O)(=O)=O.N1C(=O)C(CCN)NC(=O)C(NC(=O)C(CCN)NC(=O)C(C(C)O)NC(=O)C(CCN)NC(=O)CCCCC(C)CC)CCNC(=O)C(C(C)O)NC(=O)C(CCN)NC(=O)C(CCN)NC(=O)C(CC(C)C)NC(=O)C1CC1=CC=CC=C1 HFMDLUQUEXNBOP-UHFFFAOYSA-N 0.000 claims 1
- 235000012431 wafers Nutrition 0.000 description 24
- 230000008569 process Effects 0.000 description 12
- BASFCYQUMIYNBI-UHFFFAOYSA-N platinum Chemical compound [Pt] BASFCYQUMIYNBI-UHFFFAOYSA-N 0.000 description 10
- 230000001066 destructive effect Effects 0.000 description 9
- 230000035945 sensitivity Effects 0.000 description 8
- VYPSYNLAJGMNEJ-UHFFFAOYSA-N silicon dioxide Inorganic materials O=[Si]=O VYPSYNLAJGMNEJ-UHFFFAOYSA-N 0.000 description 6
- 239000003990 capacitor Substances 0.000 description 5
- 230000007812 deficiency Effects 0.000 description 5
- 230000001419 dependent effect Effects 0.000 description 5
- 238000005286 illumination Methods 0.000 description 4
- 238000004519 manufacturing process Methods 0.000 description 4
- 239000013307 optical fiber Substances 0.000 description 4
- 229910052697 platinum Inorganic materials 0.000 description 4
- KFZMGEQAYNKOFK-UHFFFAOYSA-N Isopropanol Chemical compound CC(C)O KFZMGEQAYNKOFK-UHFFFAOYSA-N 0.000 description 3
- 230000009471 action Effects 0.000 description 3
- 238000006243 chemical reaction Methods 0.000 description 3
- 229910052681 coesite Inorganic materials 0.000 description 3
- 230000000052 comparative effect Effects 0.000 description 3
- 229910052906 cristobalite Inorganic materials 0.000 description 3
- 230000000694 effects Effects 0.000 description 3
- 239000008151 electrolyte solution Substances 0.000 description 3
- 238000005530 etching Methods 0.000 description 3
- 229920000642 polymer Polymers 0.000 description 3
- 238000012545 processing Methods 0.000 description 3
- 238000003908 quality control method Methods 0.000 description 3
- 239000010453 quartz Substances 0.000 description 3
- 229910052682 stishovite Inorganic materials 0.000 description 3
- 238000010998 test method Methods 0.000 description 3
- 229910052905 tridymite Inorganic materials 0.000 description 3
- UFHFLCQGNIYNRP-UHFFFAOYSA-N Hydrogen Chemical compound [H][H] UFHFLCQGNIYNRP-UHFFFAOYSA-N 0.000 description 2
- FAPWRFPIFSIZLT-UHFFFAOYSA-M Sodium chloride Chemical compound [Na+].[Cl-] FAPWRFPIFSIZLT-UHFFFAOYSA-M 0.000 description 2
- 238000010420 art technique Methods 0.000 description 2
- 238000005452 bending Methods 0.000 description 2
- 239000002800 charge carrier Substances 0.000 description 2
- 230000000875 corresponding effect Effects 0.000 description 2
- 238000001514 detection method Methods 0.000 description 2
- 238000010586 diagram Methods 0.000 description 2
- 238000009826 distribution Methods 0.000 description 2
- 238000000609 electron-beam lithography Methods 0.000 description 2
- 238000005516 engineering process Methods 0.000 description 2
- 238000011156 evaluation Methods 0.000 description 2
- 239000001257 hydrogen Substances 0.000 description 2
- 229910052739 hydrogen Inorganic materials 0.000 description 2
- -1 hydrogen ions Chemical class 0.000 description 2
- 230000009467 reduction Effects 0.000 description 2
- 230000004044 response Effects 0.000 description 2
- 239000000243 solution Substances 0.000 description 2
- 229910001220 stainless steel Inorganic materials 0.000 description 2
- 239000010935 stainless steel Substances 0.000 description 2
- 239000000126 substance Substances 0.000 description 2
- XLYOFNOQVPJJNP-UHFFFAOYSA-N water Substances O XLYOFNOQVPJJNP-UHFFFAOYSA-N 0.000 description 2
- 238000001039 wet etching Methods 0.000 description 2
- 238000009736 wetting Methods 0.000 description 2
- JQGTUBOVBYKKQQ-UHFFFAOYSA-N CCC(CC)N=C Chemical compound CCC(CC)N=C JQGTUBOVBYKKQQ-UHFFFAOYSA-N 0.000 description 1
- 208000033999 Device damage Diseases 0.000 description 1
- 230000003321 amplification Effects 0.000 description 1
- 238000013459 approach Methods 0.000 description 1
- 230000015556 catabolic process Effects 0.000 description 1
- 238000012512 characterization method Methods 0.000 description 1
- 238000001311 chemical methods and process Methods 0.000 description 1
- 230000002596 correlated effect Effects 0.000 description 1
- 230000003247 decreasing effect Effects 0.000 description 1
- 239000008367 deionised water Substances 0.000 description 1
- 238000011161 development Methods 0.000 description 1
- 239000003989 dielectric material Substances 0.000 description 1
- 238000003487 electrochemical reaction Methods 0.000 description 1
- 239000007888 film coating Substances 0.000 description 1
- 238000009501 film coating Methods 0.000 description 1
- 239000003574 free electron Substances 0.000 description 1
- 239000004973 liquid crystal related substance Substances 0.000 description 1
- 238000001459 lithography Methods 0.000 description 1
- 238000001883 metal evaporation Methods 0.000 description 1
- 238000012544 monitoring process Methods 0.000 description 1
- 238000009659 non-destructive testing Methods 0.000 description 1
- 238000003199 nucleic acid amplification method Methods 0.000 description 1
- 230000003647 oxidation Effects 0.000 description 1
- 238000007254 oxidation reaction Methods 0.000 description 1
- 229920002120 photoresistant polymer Polymers 0.000 description 1
- 238000007747 plating Methods 0.000 description 1
- 230000010287 polarization Effects 0.000 description 1
- 230000006798 recombination Effects 0.000 description 1
- 238000005215 recombination Methods 0.000 description 1
- 230000001105 regulatory effect Effects 0.000 description 1
- 239000000523 sample Substances 0.000 description 1
- 238000005070 sampling Methods 0.000 description 1
- 239000011780 sodium chloride Substances 0.000 description 1
- 238000009987 spinning Methods 0.000 description 1
- WFKWXMTUELFFGS-UHFFFAOYSA-N tungsten Chemical compound [W] WFKWXMTUELFFGS-UHFFFAOYSA-N 0.000 description 1
- 229910052721 tungsten Inorganic materials 0.000 description 1
- 239000010937 tungsten Substances 0.000 description 1
- 230000000007 visual effect Effects 0.000 description 1
Images


Classifications
-
- G—PHYSICS
- G01—MEASURING; TESTING
- G01R—MEASURING ELECTRIC VARIABLES; MEASURING MAGNETIC VARIABLES
- G01R31/00—Arrangements for testing electric properties; Arrangements for locating electric faults; Arrangements for electrical testing characterised by what is being tested not provided for elsewhere
- G01R31/26—Testing of individual semiconductor devices
- G01R31/265—Contactless testing
- G01R31/2656—Contactless testing using non-ionising electromagnetic radiation, e.g. optical radiation
Definitions
- This invention relates to systems for the non-destructive detection of damage or imperfections in insulative coatings on the surface of a semiconductor substrate.
- it relates to a test method and apparatus for determining defect density, location, and size in insulative coatings.
- VLSI devices require lithographic fabrication steps having characteristic features in the order of 1 micron (pm) or less.
- E-beam lithography together with deep UV resist techniques are necessary to provide both high sensitivity and high resolution. This is accomplished utilizing E-beam resists which are employed at a thickness over the substrate which approaches the smallest dimension of the exposed pattern.
- Such an exceptionally thin layer of resist is necessary since, at a given exposure dose, the thickness of the resist is a primary factor in determining its resolution.
- a more sensitive technique has been established to accurately distinguish defect densities in high and low defect resists of the type employed in optical quality control test systems.
- This more sensitive method involves transporting resist defects into a thermal oxide film by wet etching. This is followed by measuring dielectric breakdown voltage of the remaining oxide utilizing approximately 250 metal-oxide- semiconductor (MOS) capacitors fabricated on the wafer.
- MOS metal-oxide- semiconductor
- the MOS technique realistically therefore reflects the effective defect density of a test resist since device (capacitor) yield is actually measured. It is applicable to determine defects in the order of less than 1 um finding application in 50 nm (500 A) inorganic dielectrics.
- this test method does not provide information concerning defect size or other salient characteristics such as location. Such information is key in providing a complete envelope of defect yield data vis-a-vis resist materials or process problems related to such defects.
- MOS capacitor test is an excellent method for evaluating resist defects per se, it is logistically impractical for routine monitoring of resist quality.
- defect detector for use in insulative coatings employing an electrolyte system for purposes of mapping, that is, to outline a distribution of defects in addition to determining pinhole size, is disclosed in IBM TDB, Vol. 20, No. 1, June 1977, pp. 432-433.
- defects in an insulative layer on a silicon wafer are detected by determining current-voltage characteristics of a signal which is applied across the insulative layer and its substrate utilizing a platinum electrode immersed in a NaCl solution together with an electrical contacting pin contacting the substrate.
- the pinholes themselves are rendered visible, vis-a-vis a plating effect which decorates the defects when, if NaCI is used as the electrolyte, a white film outlines the defect or distribution thereof optical evaluation follows.
- a technique for measuring the thickness of a dielectric layer on a conductive substrate is disclosed in U.S. Patent 3 975 681 utilizing an electrode pair wherein an electrode is placed in a tube with one electrode having a capillary opening contacting the surface of the dielectric layer whose thickness is to be measured.
- the circuit is complete by utilizing this conductive substrate as the anode such that the thickness of the dielectric is measured as a function of the highest applied voltage which does not produce an increase in current flow in the system.
- Such a technique is not readily applicable for a determination of defect densities and sizes.
- a hallmark deficiency of the prior art is that it does not provide comprehensive data for determining the number, size, and location of pinhole defects in very thin insulator coatings.
- Various optical mapping techniques are either time-consuming and/or destructive and therefore incapable of precisely locating pinhole defects in the surface of such coatings.
- Other techniques while providing the necessary sensitivity, do not afford turn-around time commensurate with processing requirements.
- Still other techniques primarily chemical, do not provide the necessary sensitivity for use over a broad range of insulative coating applications, such as resist or other inorganic films typified by Si0 2 , quartz, Si 3 0 4 , and various polymer coatings.
- Other known techniques such as bubble trail, liquid crystal techniques and the like, suffer from the same disadvantages of the prior art discussed herein.
- Yet another object of this invention is to define a non-destructive test system providing the necessary sensitivity and accuracy for defect detection in sub-micron film coatings.
- a still further object of this invention is to define a single test system for providing comprehensive defect data relative to pinholes in insulative coatings to overcome the deficiencies of the prior art.
- a non-destructive test system as set out in claim 1 that determines the number, size, and location of pinhole defects in insulative coatings in a single test mode. While finding primary application in submicron resists, the invention is also applicable to other insulative coatings, such as Si0 2 , quartz, Si 3 0 4 and various polymer coatings.
- a photocathodic current measurement at the semiconductor surface takes place with the current produced by contacting the coated semiconductor with an aqueous electrolyte and applying a small electrical bias with respect to a metal electrode.
- a small surface of the semiconductor is scanned utilizing a narrow focused beam of white light to allow current to flow through the electrolyte whenever the beam falls on a portion of the semiconductor contacting the electrolyte due to a pinhole in the coating.
- This current is detected utilizing conventional current measuring techniques.
- the frequency of the maximum current thus produced is dependent on the density of the pinholes in the coating.
- the position of the light beam at any given maximum current indicates the location of that corresponding pinhole.
- the magnitude of the maximum current is a function of the amount of semiconductor in contact with the electrolyte and therefore is a finite measure of pinhole size.
- the invention also refers to a respective method, which is set out in claim 12.
- FIG. 1 the principles of the present invention will be discussed.
- This invention relies on the principle that electrical current flow between a_ polarized semiconductor and a metal electrode pair separated by an electrolyte can, under proper conditions, be enhanced by exposing the semiconductor to light energy.
- the polarized semiconductor a P-type Si wafer 10
- the electrolyte 18 typically H 2 S0 4 covers the processed resist 12.
- a metal electrode pair is defined by a platinum electrode 20 immersed in the electrolyte 18 and a second electrode 22 in contact with the wafer 10.
- the circuit is completed by a DC power source 24 and an ammeter 26.
- irradiation 28 supplied from a scanning light beam provides light energy in excess of the semiconductor band-gap and produces separated electron-hole charge carriers within the space-charge region present at the semiconductor-electrolyte interface.
- excess holes generated by irradiation are drawn into an external circuit defined by the electrodes 20, 22, source 24, and meter 26 by cathodic polarization of the semiconductor 10. Excess electrons are driven toward the electrolyte solution where they can facilitate the electrochemical reduction of an electro-active solute. This electrochemical reduction results in a current flow in the circuit thus described between the semiconductor and the metal electrode 20.
- the current density is proportional to the light intensity.
- FIG. 2 a schematic illustration of a complete system for practicing the present invention is depicted.
- a resist coated P-type silicon wafer 10 is mounted on a vacuum chuck 30.
- a source of vacuum 32 coupled to the chuck via a hose 34 provides the necessary hold-down action to maintain the wafer 10 in a stationary position on the chuck 30.
- the temperature of the chuck and therefore that of the wafer is maintained at a constant level, preferably near ambient, by means of a circulating constant temperature bath.
- This bath comprises a circulating water unit 36 having conduits 38, 40 defining a feed and return path to the chuck 30.
- the chuck is mounted on a microscope stage 42 having thereon an X-Y table 44.
- the table moves the chuck 30 at a known rate, for example, 0.5 mm/sec. by means of servos in either the X or Y direction.
- the microscope stage 42 could be directly driven by external servos to achieve the same X-Y motion. Movement of the chuck is controlled so that preselected areas of the wafer 10 are scanned beneath a microscope objective 60.
- the microscope 50 may typically have a 40x objective wherein light from a source 52 is focused by lens 54 and reflected by prism 56 through the body 58 of the microscope. It is brought into focus on the wafer surface via the objective 60.
- light from source 52 is directed through the microscope to illuminate a circular area generally 0.5-5 mm in diameter with the size dependent on the objective power and numerical aperture.
- the narrow gap between the objective and the wafer is bridged with a fixed, microliter range volume of an electrolyte solution containing a reducable solute 62.
- the electrolyte is typically dilute aqueous H Z SO 4 .
- Electrical contact to the solution is made with a platinum wire secured to the objective 60.
- the wire is looped beneath the objective forming open loops 64 and 66 with a second contact point 68 on the objective 60.
- the wire loops 64 and 66 of the platinum wire in addition to providing electrical contact, support an electrolyte droplet of solute 62 by surface tension.
- This technique of surface tension support is important to keep the droplet stationary with respect to the objective given relative movement of the wafer 10, vis-a-vis the objective. Consequently, movement of the wafer is facilitated while, at the same time, maintaining electrolyte contact and droplet configuration.
- a suitable potential produced by DC source 24 is 2V placed across the wafer 10 and the platinum electrode such that the wafer is negatively biased.
- Current flows through the electrolyte droplet 62 and is measured as the voltage drop across a 1000 ⁇ resistor 70.
- the voltage may also be displayed on a recorder or supplied to a signal processing unit 72.
- e v and e c are respectively valence and conductive band electrons. Consumption of conductive band electrons as indicated in equation (3) produces a current flow which is proportional to the area of the reaction surface. Consequently, the steady state current thus produced is proportional to defect size.
- each resist defect passing through the field of illumination produces a current peak on a recorder or data processing unit 72.
- the position of a given peak is indicative of the exact location of the corresponding resist defect.
- exact defect position can be correlated by determining current peaks.
- Current peak amplitude is proportional to defect size.
- scan parameters the entire resist surface can be sampled by the light beam providing a map of all defect locations.
- various raster scan patterns may be utilized to insure that the entire surface is sampled.
- smaller discrete representative sites may be sampled to produce a cross-section of resist defect levels.
- the choice of light beam diameter produced by the objective 60 is dependent on resist defect density.
- a larger defect density requires a smaller light beam to resolve adjacent defects. That is, as shown in Figure 1, if the spacing between defects 14 and 16 is relatively small, then a smaller light beam diameter 28 is required to provide data for only one defect at a time, that is, not overlapping two adjacent defect sites.
- the selection of scan rate is dependent on several factors including defect density, resist wetting properties, and electronic response time. This parameter is optimized by calibration techniques well established in this technology.
- Figure 3 shows current and voltage as a function of distance in a photo-assisted reaction shown in equation (3) herein.
- a platinum anode 20 and electrolyte droplet 62 are shown together with the interface of the resist 12 on top of the silicon wafer forming the photocathode.
- the relationships of electron energy and hole energy to the current and voltage curves are shown at the bottom of the figure.
- FIG. 3 represents a band model for the electrode process; this figure depicts the energetics involved in the photoconduction of charge at the semiconductor/electrolyte interface.
- the lines labeled CB and VB are, respectively, representations of allowed energy levels for electrons which are free to conduct charge (conduction band) and those which are involved in lattice bonding and cannot conduct charge (valence band).
- CB and VB are, respectively, representations of allowed energy levels for electrons which are free to conduct charge (conduction band) and those which are involved in lattice bonding and cannot conduct charge (valence band).
- conduction band conduction band
- valence band valence band
- FIG. 4 A second preferred embodiment of the photoelectrochemical defect detector (PED) is shown in Fig. 4
- the enhancements of this embodiment result basically from use of a more sensitive electronics and more effective wafer illumination methodology.
- Common structure is identified by the same number as in the first embodiment.
- the operating principle in both embodiments is the same: a silicon wafer 10 is made to behave as a photodiode in a liquid-junction cell arrangement.
- photo-current is modulated (turned on and off rapidly) by illuminating the wafer with chopped light, as shown in Fig. 4. This is effected by interposing a spinning metal disk 80 having evenly spaced holes about its outer edge in the light path.
- the chopper is driven by a motor 82.
- the size of the disk, its angular velocity and the spacing of the holes are arranged such that the light is effectively turned on and off -900 times per second.
- the duration of the on (light) period is equal to that of the off (dark) period.
- the light beam thus modulated from a source 84 is focused on the entrance aperture of a bifurcated optical fiber bundle 86 having a bundle diameter of about 2 mm.
- the optical connectors shown for the fiber bundle are well known in the art.
- One-half of this incident light is diverted through one leg of the bundle and allowed to illuminate a solid-state silicon photodiode 88.
- This photo diode together with its associated biasing voltage and load resistor (not shown) produces an alternating current voltage in response to the incident modulated light.
- This AC voltage signal 89 drives the reference channel of a phase-lock (lock-in) amplifier 90.
- the second half of the light beam is brought into close proximity with the test substrate via the second leg 92 of the optical fiber bundle 86.
- the substrate is thereby illuminated with a circular spot of light which is slightly larger than the diameter of the bundle.
- Signals produced by pinholes in the substrate coating are detected by the stainless steel anode 94 which is concentric with the optical fiber bundle. These signals take the form of an AC voltage across the voltage divider-load resistor 96, with a frequency equivalent to the light chopping rate (900 Hz).
- This AC voltage having the same frequency and phase as the reference signal (produced by the solid-state photodiode) is selectively amplified by the phase-lock amplifier 90, producing a DC output 98. which is proportional to the magnitude of the AC input.
- This selective amplification scheme provides much greater signal-to-noise (S/N) ratio, allowing faster scanning rates (up to about 25 mm/sec) and improved resolution over the former system. Greater S/N ratio also permits use of low conductivity electrolytes for sensitive coating which might otherwise degrade in contact with H 2 SO 4 .
- plain de-ionized water containing from 1-5% isopropyl alcohol for wetting action
- Figure 4 also illustrates another important difference between this embodiment and Figure 2.
- the electrolyte confinement system is different utilizing the inverted plastic sleeve 100 cylindrical with the anode 94.
- the anode 94 typically stainless steel, receives at its upper end the second leg 92 of optical fiber bundle 86 which extends concentrically inside the anode to the bottom edge.
- the bottom edge is positioned about 0.5 mm above the surface of the substrate 10.
- the electrolyte retention cup as shown in Figure 4 is sealed at its upper end to the anode 94. It then flares outward to define a chamber 102 for confining electrolyte solute 62 deposited therein by capillary action.
- the chamber is typically about 6 mm in diameter. As shown, when the probe is positioned over the substrate 10, the electrolyte bridges the gap downward to the substrate surface by surface tension.
- the anode 94 is in electrical contact with the electrolyte 62 and the retention cup is a plastic dielectric.
- the anode replaces the wire loops 64 and 66 of the Figure 2 embodiment.
- the plastic retention cup produces a stable electrolyte containing medium for uniform droplet definition and retention.
- Typical defect density results for positive resist lots A (high defect) and B (low defect) were obtained utilizing optical, MOS, and photoelectrolysis methods of the present invention. These are categorized as follows:
- Figure 5 is a graph showing comparative data of the sensitivity of this invention versus the known MOS technique. Twenty-five examples were tested using resist type and procedures set forth herein in Tables I and II. The similarity in pinhole density values are clearly illustrated in Figure 5.
- the photoelectrolysis process of the present invention has a sufficient sensitivity to predict the defect behavior of a resist especially in the high defect regions.
- this invention offers significant advantages over available techniques.
- the invention provides in addition to sensitivity, quantitative defect size data following calibration with artificial defects produced by electron beam lithography.
- the test system measures defects directly through the resist film; transportation to an oxide film by etching is therefore not required. Consequently, oxide defects do not contribute to the final result as they do in prior art test regimes. Since defect features are not obscured by transportation, better defect characterization is achieved.
- test is non-destructive. This enables testing of the result at various points in the process, for example, before and after resist development, then once again after postbake and/or etching. While the invention has been described relative to defect determination on a resist, it is also applicable for other insulative coatings, such as Si0 2 , Si 3 0 4 , quartz, or polymer coatings.
- the present invention produces a non-destructive test that determines not only size but also number and location of pinhole defects in insulative films. It does not require an optical recording or visual counting techniques which are cumbersome and hallmark deficiencies of the prior art.
Landscapes
- Physics & Mathematics (AREA)
- Health & Medical Sciences (AREA)
- Electromagnetism (AREA)
- Toxicology (AREA)
- General Physics & Mathematics (AREA)
- Investigating Materials By The Use Of Optical Means Adapted For Particular Applications (AREA)
- Testing Or Measuring Of Semiconductors Or The Like (AREA)
Description
- This invention relates to systems for the non-destructive detection of damage or imperfections in insulative coatings on the surface of a semiconductor substrate. In particular, it relates to a test method and apparatus for determining defect density, location, and size in insulative coatings.
- The manufacture of VLSI devices requires lithographic fabrication steps having characteristic features in the order of 1 micron (pm) or less. In order to achieve these exceptionally small dimensional tolerances, E-beam lithography together with deep UV resist techniques are necessary to provide both high sensitivity and high resolution. This is accomplished utilizing E-beam resists which are employed at a thickness over the substrate which approaches the smallest dimension of the exposed pattern. Such an exceptionally thin layer of resist is necessary since, at a given exposure dose, the thickness of the resist is a primary factor in determining its resolution.
- In contrast to known contemporary processes which use a resist thickness in excess of 1.5 microns (lim), future submicron process yields are highly dependent on resist defect levels. This dependency occurs due to a dramatic increase in defect density as a function of decreasing resist thickness. Moreover, the probability of device damage increases exponentially with increasing defect density. Therefore, it is apparent that final device yield is strongly related to resist defect levels. Given this requirement, users and manufacturers of resist in a submicron process have a standing requirement for a non-destructive test method of evaluating resist defect behavior. Users could employ such a test to diagnose process problems relating to defects without actually fabricating and testing devices. Resist manufacturers have a compatible need for such a test as a routine quality control technique.
- Within the prior art, various techniques are currently employed for evaluating defects in various resist coatings. One known quality control system relies on the transportation of defects into a thermal oxide film by wet etching. A second etching produces pits in the underlying silicon substrate. The etched pits are visually counted with the aid of a microscope in order to determine defect density. It has been established by empirical data and actual experience that this procedure is unsatisfactory for distinguishing high and low defect levels in various types of resist which are used for semiconductor lithography. The inability of this optical test process for judging resist quality is demonstrated by the fact that commonly one resist lot produces acceptable semiconductor yields while another resist lot produces very low yields yet, both upon optical evaluation, tested to have equivalent defect densities.
- A more sensitive technique has been established to accurately distinguish defect densities in high and low defect resists of the type employed in optical quality control test systems. This more sensitive method involves transporting resist defects into a thermal oxide film by wet etching. This is followed by measuring dielectric breakdown voltage of the remaining oxide utilizing approximately 250 metal-oxide- semiconductor (MOS) capacitors fabricated on the wafer. The MOS technique realistically therefore reflects the effective defect density of a test resist since device (capacitor) yield is actually measured. It is applicable to determine defects in the order of less than 1 um finding application in 50 nm (500 A) inorganic dielectrics. However, this test method does not provide information concerning defect size or other salient characteristics such as location. Such information is key in providing a complete envelope of defect yield data vis-a-vis resist materials or process problems related to such defects.
- A more significant deficiency of the MOS capacitor technique is that it requires access to the actual device manufacturing area since the test relies on availability of oxidation furnaces, clean process stations, metal evaporation, etc. Accordingly, while the MOS capacitor test is an excellent method for evaluating resist defects per se, it is logistically impractical for routine monitoring of resist quality.
- Techniques of mapping semiconductor wafers in a non-destructive manner using chemical techniques are known in the prior art. In the closest prior art for the present invention, IBM Technical Disclosure Bulletin (TDB), Vol. 18, No. 12, May 1976, p. 4012, a system is described in which an array of light-emitting diodes is employed in order to illuminate different areas of the wafers so that cathodic current information is obtained on different segments of the wafer. The system described in IBM TDB, Vol. 18, No. 11, April 1976, p. 3623 utilizes a laser to scan the semiconductor material in order to map the depletion region. In this system, defect regions produce a decrease in current so that a map of semiconductor quality can be obtained. A determination of actual pinhole size is not made using these techniques.
- Another technique of non-destructive testing of semiconductor articles is described in U.S.
Patent 4 125 440 wherein the semiconductor substrate is immersed in electrolyte solution which is held on a test stand by means of a vacuum holder. The surface is uniformly illuminated at a light density in the range of 538-808 Ix (50-75 foot candles) and the substrate is negatively biased with respect to the electrolyte at a voltage level in the range of 50-65 V. This produces hydrogen gas bubbles at electrically active damage sites indicative of defect density per se. Thus, this prior art technique also maps but does not actually measure pinhole-type defects. - Other prior art of less significance utilizing electrolytic cells for determining the integrity of semiconductor materials is disclosed in
U.S. Patents 2 805 347; 3 628 017; 3755026; 4 028 207; and 4 188 267. These various techniques relate to test systems for determining pinhole locations or density and do not provide comprehensive data concerning pinhole density pinhole location and pinhole size in a single test. - The application of a defect detector for use in insulative coatings employing an electrolyte system for purposes of mapping, that is, to outline a distribution of defects in addition to determining pinhole size, is disclosed in IBM TDB, Vol. 20, No. 1, June 1977, pp. 432-433. As disclosed therein, defects in an insulative layer on a silicon wafer are detected by determining current-voltage characteristics of a signal which is applied across the insulative layer and its substrate utilizing a platinum electrode immersed in a NaCl solution together with an electrical contacting pin contacting the substrate. The pinholes themselves are rendered visible, vis-a-vis a plating effect which decorates the defects when, if NaCI is used as the electrolyte, a white film outlines the defect or distribution thereof optical evaluation follows.
- A technique for measuring the thickness of a dielectric layer on a conductive substrate is disclosed in U.S. Patent 3 975 681 utilizing an electrode pair wherein an electrode is placed in a tube with one electrode having a capillary opening contacting the surface of the dielectric layer whose thickness is to be measured. The circuit is complete by utilizing this conductive substrate as the anode such that the thickness of the dielectric is measured as a function of the highest applied voltage which does not produce an increase in current flow in the system. Such a technique, however, is not readily applicable for a determination of defect densities and sizes.
- Other prior art considered to be less significant than that discussed herein, vis-a-vis the present invention, comprises technology directed to other electrolytic techniques for measuring semiconductor imperfections as typified by U.S. Patents 3 129 148; 3 366 554; 3 379 625; 3 384 556; 3408270; and 3 366 040. Finally, other electrolytic techniques for the manufacture of semiconductor components but not specifically directed to measuring and testing systems per se that have been considered are typified by U.S. Patents 3 265 599; 3267014; 3738917; and 3890215.
- A hallmark deficiency of the prior art is that it does not provide comprehensive data for determining the number, size, and location of pinhole defects in very thin insulator coatings. Various optical mapping techniques are either time-consuming and/or destructive and therefore incapable of precisely locating pinhole defects in the surface of such coatings. Other techniques, while providing the necessary sensitivity, do not afford turn-around time commensurate with processing requirements. Still other techniques, primarily chemical, do not provide the necessary sensitivity for use over a broad range of insulative coating applications, such as resist or other inorganic films typified by Si02, quartz,
Si 304, and various polymer coatings. Other known techniques, such as bubble trail, liquid crystal techniques and the like, suffer from the same disadvantages of the prior art discussed herein. - It is therefore an object of the present invention to define a non-destructive test system for the determination of the number, size, and location of pinhole defects in insulative coatings on a semiconductor substrate.
- Yet another object of this invention is to define a non-destructive test system providing the necessary sensitivity and accuracy for defect detection in sub-micron film coatings.
- A still further object of this invention is to define a single test system for providing comprehensive defect data relative to pinholes in insulative coatings to overcome the deficiencies of the prior art.
- These and other objects of this invention are attained in a non-destructive test system as set out in claim 1 that determines the number, size, and location of pinhole defects in insulative coatings in a single test mode. While finding primary application in submicron resists, the invention is also applicable to other insulative coatings, such as Si02, quartz,
Si 304 and various polymer coatings. In accordance with the present invention, a photocathodic current measurement at the semiconductor surface takes place with the current produced by contacting the coated semiconductor with an aqueous electrolyte and applying a small electrical bias with respect to a metal electrode. A small surface of the semiconductor is scanned utilizing a narrow focused beam of white light to allow current to flow through the electrolyte whenever the beam falls on a portion of the semiconductor contacting the electrolyte due to a pinhole in the coating. This current is detected utilizing conventional current measuring techniques. The frequency of the maximum current thus produced is dependent on the density of the pinholes in the coating. The position of the light beam at any given maximum current indicates the location of that corresponding pinhole. The magnitude of the maximum current is a function of the amount of semiconductor in contact with the electrolyte and therefore is a finite measure of pinhole size. The invention also refers to a respective method, which is set out inclaim 12. - This invention will be described in greater detail with respect to the drawings and the description of the preferred embodiment that follows.
-
- Fig. 1 is a schematic elevation view of a device under test explaining the operational principles of this invention;
- Fig. 2 is a schematic system diagram of the test structure for practicing this invention according to a first preferred embodiment; and
- Fig. 3 is a chart defining the band model for the electrode process in accordance with the present invention;
- Fig. 4 is a schematic system diagram of the test structure for practicing this invention in accordance with a second preferred embodiment of this invention; and
- Fig. 5 is a graph plotting pinhole density values obtained by MOS techniques and this invention for a number of samples.
- Referring first to Figure 1, the principles of the present invention will be discussed. This invention relies on the principle that electrical current flow between a_ polarized semiconductor and a metal electrode pair separated by an electrolyte can, under proper conditions, be enhanced by exposing the semiconductor to light energy. In Figure 1, the polarized semiconductor, a P-
type Si wafer 10, has thereon a processed resist 12 which may havepinhole defects electrolyte 18 typically H2S04 covers the processed resist 12. A metal electrode pair is defined by aplatinum electrode 20 immersed in theelectrolyte 18 and asecond electrode 22 in contact with thewafer 10. The circuit is completed by aDC power source 24 and anammeter 26. - In accordance with the present invention,
irradiation 28 supplied from a scanning light beam provides light energy in excess of the semiconductor band-gap and produces separated electron-hole charge carriers within the space-charge region present at the semiconductor-electrolyte interface. With a P-type semiconductor, excess holes generated by irradiation are drawn into an external circuit defined by theelectrodes source 24, andmeter 26 by cathodic polarization of thesemiconductor 10. Excess electrons are driven toward the electrolyte solution where they can facilitate the electrochemical reduction of an electro-active solute. This electrochemical reduction results in a current flow in the circuit thus described between the semiconductor and themetal electrode 20. The current density is proportional to the light intensity. - If the
semiconductor 10 is coated with an insulative material, such as resist 12, then, photo-assisted electro-chemical activity can occur only at defect sites in the resist film, that is, where the electrolyte is physically in contact with the illuminated semiconductor due topinholes pinhole 14 and its size can be determined, but also, that defect can be differentiated from a second defect, such asdefect 16 both in terms of location and size. By detecting the current frequency, the density of pinholes in the coating can be determined. It is on this fundamental basis that the system shown in Figure 2 operates as a preferred embodiment of this invention. - Referring now to Figure 2, a schematic illustration of a complete system for practicing the present invention is depicted. A resist coated P-
type silicon wafer 10 is mounted on avacuum chuck 30. A source ofvacuum 32 coupled to the chuck via ahose 34 provides the necessary hold-down action to maintain thewafer 10 in a stationary position on thechuck 30. The temperature of the chuck and therefore that of the wafer is maintained at a constant level, preferably near ambient, by means of a circulating constant temperature bath. This bath comprises a circulatingwater unit 36 havingconduits chuck 30. Thus, by circulating water through the body of the chuck, temperature stability of the wafer is maintained. - The chuck is mounted on a
microscope stage 42 having thereon an X-Y table 44. The table moves thechuck 30 at a known rate, for example, 0.5 mm/sec. by means of servos in either the X or Y direction. Alternatively, themicroscope stage 42 could be directly driven by external servos to achieve the same X-Y motion. Movement of the chuck is controlled so that preselected areas of thewafer 10 are scanned beneath amicroscope objective 60. Themicroscope 50 may typically have a 40x objective wherein light from a source 52 is focused bylens 54 and reflected byprism 56 through thebody 58 of the microscope. It is brought into focus on the wafer surface via theobjective 60. - Accordingly, light from source 52 is directed through the microscope to illuminate a circular area generally 0.5-5 mm in diameter with the size dependent on the objective power and numerical aperture. As shown in Figure 2, the narrow gap between the objective and the wafer is bridged with a fixed, microliter range volume of an electrolyte solution containing a
reducable solute 62. The electrolyte is typically dilute aqueous HZSO4. Electrical contact to the solution is made with a platinum wire secured to the objective 60. The wire is looped beneath the objective formingopen loops second contact point 68 on the objective 60. Thus, thewire loops solute 62 by surface tension. This technique of surface tension support is important to keep the droplet stationary with respect to the objective given relative movement of thewafer 10, vis-a-vis the objective. Consequently, movement of the wafer is facilitated while, at the same time, maintaining electrolyte contact and droplet configuration. - A suitable potential produced by
DC source 24 is 2V placed across thewafer 10 and the platinum electrode such that the wafer is negatively biased. Current flows through theelectrolyte droplet 62 and is measured as the voltage drop across a 1000 Ω resistor 70. The voltage may also be displayed on a recorder or supplied to asignal processing unit 72. - For example, with a 0.5% aqueous sulfuric acid electrolyte, hydrogen ions serve as the reducable solute, leading to cathodic hydrogen evolution at each illuminated resist defect site. This can be demonstrated according to the following reactions:


- In the above equations, ev and ec are respectively valence and conductive band electrons. Consumption of conductive band electrons as indicated in equation (3) produces a current flow which is proportional to the area of the reaction surface. Consequently, the steady state current thus produced is proportional to defect size.
- By movement of the wafer beneath the light beam as a function of the X-Y table, each resist defect passing through the field of illumination produces a current peak on a recorder or
data processing unit 72. The position of a given peak is indicative of the exact location of the corresponding resist defect. Thus, by knowing the position of the wafer as a function of X-Y table position (for example, by control via processor 72), exact defect position can be correlated by determining current peaks. Current peak amplitude is proportional to defect size. Hence, by determining scan parameters, the entire resist surface can be sampled by the light beam providing a map of all defect locations. Typically, various raster scan patterns may be utilized to insure that the entire surface is sampled. Alternatively, smaller discrete representative sites may be sampled to produce a cross-section of resist defect levels. Thus, by sampling and integrating data a model of the entire defect surface can be produced. - The choice of light beam diameter produced by the objective 60 is dependent on resist defect density. A larger defect density requires a smaller light beam to resolve adjacent defects. That is, as shown in Figure 1, if the spacing between
defects light beam diameter 28 is required to provide data for only one defect at a time, that is, not overlapping two adjacent defect sites. The selection of scan rate is dependent on several factors including defect density, resist wetting properties, and electronic response time. This parameter is optimized by calibration techniques well established in this technology. - Figure 3 shows current and voltage as a function of distance in a photo-assisted reaction shown in equation (3) herein. A
platinum anode 20 andelectrolyte droplet 62 are shown together with the interface of the resist 12 on top of the silicon wafer forming the photocathode. The relationships of electron energy and hole energy to the current and voltage curves are shown at the bottom of the figure. - Figure 3, then, represents a band model for the electrode process; this figure depicts the energetics involved in the photoconduction of charge at the semiconductor/electrolyte interface. The lines labeled CB and VB are, respectively, representations of allowed energy levels for electrons which are free to conduct charge (conduction band) and those which are involved in lattice bonding and cannot conduct charge (valence band). In p-type silicon, electrons constitute the minority charge carriers, hence the CB energy level is relatively sparsely populated. Application of heat or light provides sufficient energy for some electrons confined to the VB to "jump" the forbidden bandgap and assume a CB energy level. In this state the electron has mobility and may conduct charge, but in p-type silicon the relatively high concentration of electron deficiencies (holes) within the VB raises the likelihood that free electrons will quickly recombine and be returned to their VB energy level. Thus, charge conduction via irradiation produced electrons requires localized depletion of holes within the semiconductor by applying a negative bias. The effect of depletion is represented by'bending' of the CB and VB energy levels in Fig. 3. This bending allows VB holes to minimize their energy by moving away from the semiconductor/electrolyte interface while electrons may minimize their energy by moving toward the semiconductor surface. With electrons and holes effectively separated, the probability of recombination is reduced, and charge conduction can proceed. Thus, two conditions must be met for conduction of charge through the semiconductor; presence of negative electrical bias on the silicon, and illumination of the silicon surface. With a constant applied bias, current is regulated only by illumination.
- A second preferred embodiment of the photoelectrochemical defect detector (PED) is shown in Fig. 4 The enhancements of this embodiment result basically from use of a more sensitive electronics and more effective wafer illumination methodology. Common structure is identified by the same number as in the first embodiment. The operating principle in both embodiments is the same: a
silicon wafer 10 is made to behave as a photodiode in a liquid-junction cell arrangement. However, in the second embodiment, photo-current is modulated (turned on and off rapidly) by illuminating the wafer with chopped light, as shown in Fig. 4. This is effected by interposing a spinningmetal disk 80 having evenly spaced holes about its outer edge in the light path. The chopper is driven by amotor 82. The size of the disk, its angular velocity and the spacing of the holes are arranged such that the light is effectively turned on and off -900 times per second. The duration of the on (light) period is equal to that of the off (dark) period. - The light beam thus modulated from a
source 84, typically a tungsten lamp, is focused on the entrance aperture of a bifurcatedoptical fiber bundle 86 having a bundle diameter of about 2 mm. The optical connectors shown for the fiber bundle are well known in the art. One-half of this incident light is diverted through one leg of the bundle and allowed to illuminate a solid-state silicon photodiode 88. This photo diode, together with its associated biasing voltage and load resistor (not shown) produces an alternating current voltage in response to the incident modulated light. ThisAC voltage signal 89 drives the reference channel of a phase-lock (lock-in)amplifier 90. - The second half of the light beam is brought into close proximity with the test substrate via the
second leg 92 of theoptical fiber bundle 86. The substrate is thereby illuminated with a circular spot of light which is slightly larger than the diameter of the bundle. Signals produced by pinholes in the substrate coating are detected by thestainless steel anode 94 which is concentric with the optical fiber bundle. These signals take the form of an AC voltage across the voltage divider-load resistor 96, with a frequency equivalent to the light chopping rate (900 Hz). - This AC voltage, having the same frequency and phase as the reference signal (produced by the solid-state photodiode) is selectively amplified by the phase-
lock amplifier 90, producing aDC output 98. which is proportional to the magnitude of the AC input. This selective amplification scheme provides much greater signal-to-noise (S/N) ratio, allowing faster scanning rates (up to about 25 mm/sec) and improved resolution over the former system. Greater S/N ratio also permits use of low conductivity electrolytes for sensitive coating which might otherwise degrade in contact with H2SO4. For example, plain de-ionized water (containing from 1-5% isopropyl alcohol for wetting action) may be used as the electrolyte medium of choice for measurement of pinhole density in photoresist layers. - Figure 4 also illustrates another important difference between this embodiment and Figure 2. Specifically, the electrolyte confinement system is different utilizing the inverted
plastic sleeve 100 cylindrical with theanode 94. Theanode 94, typically stainless steel, receives at its upper end thesecond leg 92 ofoptical fiber bundle 86 which extends concentrically inside the anode to the bottom edge. The bottom edge is positioned about 0.5 mm above the surface of thesubstrate 10. - The electrolyte retention cup as shown in Figure 4 is sealed at its upper end to the
anode 94. It then flares outward to define achamber 102 for confiningelectrolyte solute 62 deposited therein by capillary action. The chamber is typically about 6 mm in diameter. As shown, when the probe is positioned over thesubstrate 10, the electrolyte bridges the gap downward to the substrate surface by surface tension. - In this embodiment, the
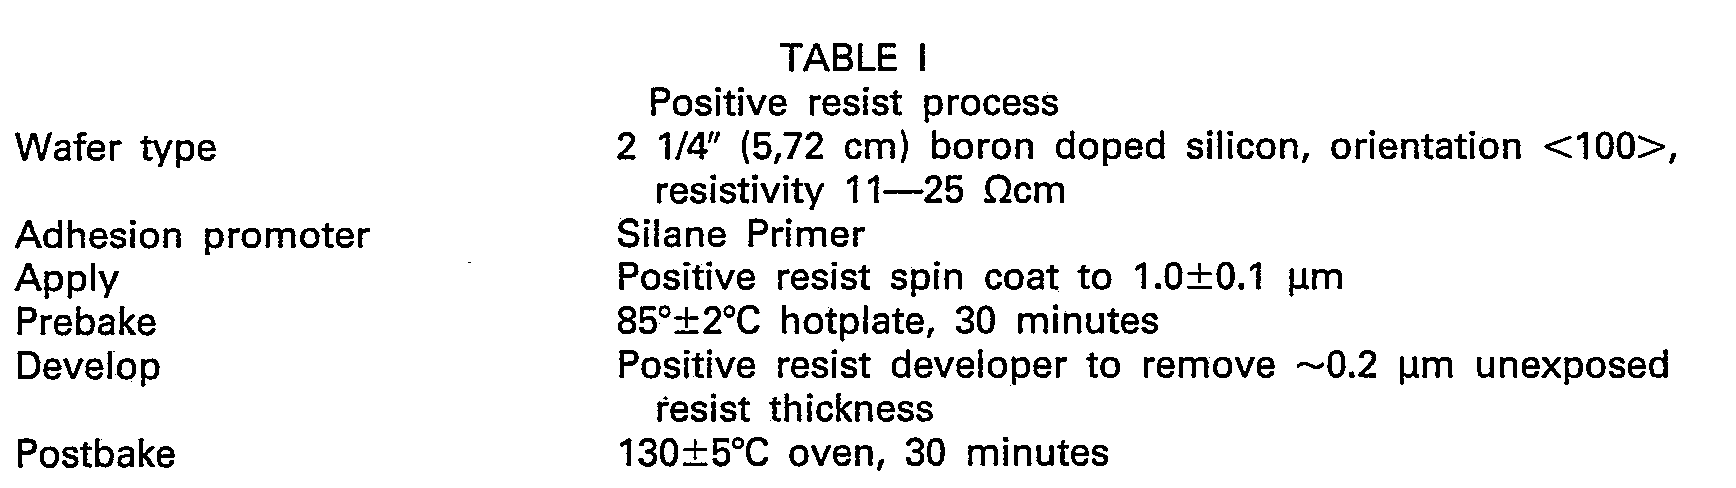
anode 94 is in electrical contact with theelectrolyte 62 and the retention cup is a plastic dielectric. Thus the anode replaces thewire loops - The performance of this invention can be compared to the prior art by comparative testing utilizing resists of well characterized defect behavior. The invention was compared to the prior art MOS capacitor and optical systems discussed herein. Specific resist process and testing conditions are delineated in Tables I and II.

- Typical defect density results for positive resist lots A (high defect) and B (low defect) were obtained utilizing optical, MOS, and photoelectrolysis methods of the present invention. These are categorized as follows:

- Figure 5 is a graph showing comparative data of the sensitivity of this invention versus the known MOS technique. Twenty-five examples were tested using resist type and procedures set forth herein in Tables I and II. The similarity in pinhole density values are clearly illustrated in Figure 5.
- It is apparent from this comparative test data, the photoelectrolysis process of the present invention has a sufficient sensitivity to predict the defect behavior of a resist especially in the high defect regions. In addition to high sensitivity, this invention offers significant advantages over available techniques. The invention provides in addition to sensitivity, quantitative defect size data following calibration with artificial defects produced by electron beam lithography. The test system measures defects directly through the resist film; transportation to an oxide film by etching is therefore not required. Consequently, oxide defects do not contribute to the final result as they do in prior art test regimes. Since defect features are not obscured by transportation, better defect characterization is achieved.
- Fewer process steps are required and consequently this test system produces results more quickly than any prior art technique currently utilized. The test is non-destructive. This enables testing of the result at various points in the process, for example, before and after resist development, then once again after postbake and/or etching. While the invention has been described relative to defect determination on a resist, it is also applicable for other insulative coatings, such as Si02,
Si 304, quartz, or polymer coatings. - Thus, the present invention produces a non-destructive test that determines not only size but also number and location of pinhole defects in insulative films. It does not require an optical recording or visual counting techniques which are cumbersome and hallmark deficiencies of the prior art.
Claims (14)
Applications Claiming Priority (2)
| Application Number | Priority Date | Filing Date | Title |
|---|---|---|---|
| US06/468,907 US4473795A (en) | 1983-02-23 | 1983-02-23 | System for resist defect measurement |
| US468907 | 1983-02-23 |
Publications (2)
| Publication Number | Publication Date |
|---|---|
| EP0120229A1 EP0120229A1 (en) | 1984-10-03 |
| EP0120229B1 true EP0120229B1 (en) | 1987-09-09 |
Family
ID=23861716
Family Applications (1)
| Application Number | Title | Priority Date | Filing Date |
|---|---|---|---|
| EP84101099A Expired EP0120229B1 (en) | 1983-02-23 | 1984-02-03 | System and method for resist defect measurement on semiconductors |
Country Status (4)
| Country | Link |
|---|---|
| US (1) | US4473795A (en) |
| EP (1) | EP0120229B1 (en) |
| JP (1) | JPS59216048A (en) |
| DE (1) | DE3466077D1 (en) |
Families Citing this family (29)
| Publication number | Priority date | Publication date | Assignee | Title |
|---|---|---|---|---|
| JPS60140729A (en) * | 1983-12-28 | 1985-07-25 | Oki Electric Ind Co Ltd | Method of detecting defect of semiconductor element film |
| GB2156511A (en) * | 1984-03-23 | 1985-10-09 | Philips Electronic Associated | Optical absorption spectroscopy for semiconductors |
| US4581576A (en) * | 1984-04-23 | 1986-04-08 | Hewlett-Packard Company | Nondestructive method for profiling imperfection levels in high resistivity semiconductor wafers |
| US4668330A (en) * | 1985-12-05 | 1987-05-26 | Monsanto Company | Furnace contamination |
| EP0295440B1 (en) * | 1987-06-15 | 1992-04-22 | Siemens Aktiengesellschaft | Measuring process and appliance for the diffusion length determination of minority charge carriers for the interference-free detection of defects and pollutants in semiconductor crystal bodies |
| US4978923A (en) * | 1989-04-26 | 1990-12-18 | Ron Maltiel | Electrical measurements of the profile of semiconductor devices during their manufacturing process |
| US4956611A (en) * | 1989-04-26 | 1990-09-11 | Ron Maltiel | Electrical measurements of properties of semiconductor devices during their manufacturing process |
| US5081421A (en) * | 1990-05-01 | 1992-01-14 | At&T Bell Laboratories | In situ monitoring technique and apparatus for chemical/mechanical planarization endpoint detection |
| US5200693A (en) * | 1991-02-26 | 1993-04-06 | Cornell Research Foundation, Inc. | Method for determining characteristics of pn semiconductor structures |
| US5223443A (en) * | 1992-02-19 | 1993-06-29 | Integrated Device Technology, Inc. | Method for determining wafer cleanliness |
| US5504434A (en) * | 1992-12-18 | 1996-04-02 | International Business Machines Corporation | Instrument for the measurement of electrical characteristics during manufacturing processes |
| JP3274924B2 (en) * | 1993-12-15 | 2002-04-15 | 株式会社東芝 | Semiconductor device screening method |
| US5638003A (en) * | 1995-05-23 | 1997-06-10 | Underwriters Laboratories, Inc. | Method and apparatus for testing surface breakdown of dielectric materials caused by electrical tracking |
| US5747365A (en) * | 1996-08-01 | 1998-05-05 | Taiwan Semiconductor Manufacturing Company, Ltd. | Method for preparing semiconductor chip as SEM specimen |
| JP2776382B2 (en) * | 1996-09-30 | 1998-07-16 | 日本電気株式会社 | Insulating film pinhole inspection method and apparatus |
| US6254672B1 (en) * | 1997-04-09 | 2001-07-03 | Memc Electronic Materials, Inc. | Low defect density self-interstitial dominated silicon |
| GB2340224B (en) * | 1998-08-01 | 2001-06-06 | British Aerospace | Thermographic wiring inspection |
| DE69921286D1 (en) * | 1999-01-26 | 2004-11-25 | St Microelectronics Srl | Characterization of a semiconductor-dielectric boundary layer using photocurrent measurements |
| JP4207307B2 (en) * | 1999-04-26 | 2009-01-14 | 日新イオン機器株式会社 | Charge-up measuring device |
| US6411110B1 (en) * | 1999-08-17 | 2002-06-25 | Micron Technology, Inc. | Apparatuses and methods for determining if protective coatings on semiconductor substrate holding devices have been compromised |
| JP2001188254A (en) * | 1999-10-21 | 2001-07-10 | Matsushita Electric Ind Co Ltd | In-substrate selective electrochemical treatment apparatus, in-substrate selective chemical treatment apparatus, and inspection and repair method for active substrate |
| US6452285B1 (en) * | 2000-10-17 | 2002-09-17 | Advanced Micro Devices, Inc. | Fabrication of standard defects in contacts |
| US20070256937A1 (en) * | 2006-05-04 | 2007-11-08 | International Business Machines Corporation | Apparatus and method for electrochemical processing of thin films on resistive substrates |
| JP4686423B2 (en) * | 2006-09-12 | 2011-05-25 | 株式会社東芝 | Adhesion amount measuring system and measuring method |
| LU91561B1 (en) * | 2009-04-30 | 2010-11-02 | Univ Luxembourg | Electrical and opto-electrical characterisation oflarge-area semiconductor devices. |
| CN102323718A (en) * | 2011-08-01 | 2012-01-18 | 上海先进半导体制造股份有限公司 | Defect monitoring method of photoresist coating process |
| US8941390B2 (en) | 2012-03-01 | 2015-01-27 | Neuronexus Technologies, Inc. | System and method for testing electrical circuits using a photoelectrochemical effect |
| US10883972B2 (en) * | 2017-02-09 | 2021-01-05 | Applied Materials, Inc. | Coating tester using gas sensors |
| CN116699456A (en) * | 2022-02-28 | 2023-09-05 | 宁德时代新能源科技股份有限公司 | Leakage detection method and leakage detection equipment |
Family Cites Families (6)
| Publication number | Priority date | Publication date | Assignee | Title |
|---|---|---|---|---|
| US3373353A (en) * | 1965-09-30 | 1968-03-12 | Navy Usa | Electron beam scanning system for quality control of materials |
| GB1313992A (en) * | 1971-01-08 | 1973-04-18 | Coal Industry Patents Ltd | Method and apparatus for detecting pinholes in sheet material |
| US3772520A (en) * | 1972-03-21 | 1973-11-13 | Us Air Force | Method for the investigation of thin films on a semiconductor substrate in a scanning electron microscope |
| US4125440A (en) * | 1977-07-25 | 1978-11-14 | International Business Machines Corporation | Method for non-destructive testing of semiconductor articles |
| DE2824308A1 (en) * | 1978-06-02 | 1979-12-13 | Siemens Ag | METHOD OF IMPRESSION OF A VOLTAGE WITH AN ELECTRON BEAM |
| DE3102337A1 (en) * | 1981-01-24 | 1982-08-19 | Hanno Prof. Dr. 2000 Hamburg Schaumburg | METHOD AND DEVICE FOR PRODUCING SEMICONDUCTOR ELEMENTS WITH SPECIFIC PHYSICAL PARAMETERS |
-
1983
- 1983-02-23 US US06/468,907 patent/US4473795A/en not_active Expired - Lifetime
- 1983-12-15 JP JP58235217A patent/JPS59216048A/en active Granted
-
1984
- 1984-02-03 EP EP84101099A patent/EP0120229B1/en not_active Expired
- 1984-02-03 DE DE8484101099T patent/DE3466077D1/en not_active Expired
Also Published As
| Publication number | Publication date |
|---|---|
| US4473795A (en) | 1984-09-25 |
| EP0120229A1 (en) | 1984-10-03 |
| DE3466077D1 (en) | 1987-10-15 |
| JPS59216048A (en) | 1984-12-06 |
| JPH0339581B2 (en) | 1991-06-14 |
Similar Documents
| Publication | Publication Date | Title |
|---|---|---|
| US4473795A (en) | System for resist defect measurement | |
| Ambridge et al. | Applications of Electrochemical Methods for Semiconductor Characterization: I. Highly Reproducible Carrier Concentration Profiling of VPE “Hi‐Lo” n‐GaAs | |
| US4758786A (en) | Method of analyzing semiconductor systems | |
| SU1713448A3 (en) | Method of determination of thickness of layers in semiconductor sandwich structures and device to implement it | |
| JP4783801B2 (en) | Semiconductor inspection system and apparatus using non-vibrating contact potential difference sensor and controlled irradiation | |
| US4433288A (en) | Method and apparatus for determining minority carrier diffusion length in semiconductors | |
| US4456879A (en) | Method and apparatus for determining the doping profile in epitaxial layers of semiconductors | |
| JPH02119236A (en) | Method and device for deciding minority carrier diffusion length from linear constant photon-flux photovoltaic measured value | |
| US4028207A (en) | Measuring arrangements | |
| US8427185B2 (en) | Inline inspection of photovoltaics for electrical defects | |
| Moritz et al. | Photocurrent measurements for laterally resolved interface characterization | |
| US6002131A (en) | Scanning probe potentiometer | |
| US4125440A (en) | Method for non-destructive testing of semiconductor articles | |
| US4841239A (en) | Method and measuring instrument for identifying the diffusion length of the minority charge carriers for non-destructive detection of flaws and impurities in semiconductor crystal bodies | |
| US5138256A (en) | Method and apparatus for determining the thickness of an interfacial polysilicon/silicon oxide film | |
| US5999006A (en) | Method of and apparatus for conducting analysis of buried oxides | |
| US5130643A (en) | Method for determining the recombination rate of minority carriers at boundary surfaces between semiconductors and other substances | |
| JP2000068345A (en) | Method for inspecting contact opening of semiconductor device | |
| JPH0674899A (en) | Method and device for measuring sample surface and method and device for microfabrication of sample surface | |
| Sittig et al. | Doping inhomogeneities in silicon observed by a high‐resolution electroreflectance technique | |
| JP2001351957A (en) | Measuring method and measuring device by scanning capacitance microscope | |
| JP3130177B2 (en) | Crystal evaluation apparatus and crystal evaluation method | |
| Stacey et al. | Using surface charge analysis to characterize the radiation response of Si/SiO/sub 2/structures | |
| KR100197658B1 (en) | Electrochemical Capacitance-Measuring Method | |
| Plunkett et al. | Laser scanning of experimental solar cells |
Legal Events
| Date | Code | Title | Description |
|---|---|---|---|
| PUAI | Public reference made under article 153(3) epc to a published international application that has entered the european phase |
Free format text: ORIGINAL CODE: 0009012 |
|
| AK | Designated contracting states |
Designated state(s): DE FR GB IT |
|
| 17P | Request for examination filed |
Effective date: 19841123 |
|
| 17Q | First examination report despatched |
Effective date: 19860127 |
|
| GRAA | (expected) grant |
Free format text: ORIGINAL CODE: 0009210 |
|
| AK | Designated contracting states |
Kind code of ref document: B1 Designated state(s): DE FR GB IT |
|
| REF | Corresponds to: |
Ref document number: 3466077 Country of ref document: DE Date of ref document: 19871015 |
|
| ET | Fr: translation filed | ||
| ITF | It: translation for a ep patent filed | ||
| PLBE | No opposition filed within time limit |
Free format text: ORIGINAL CODE: 0009261 |
|
| STAA | Information on the status of an ep patent application or granted ep patent |
Free format text: STATUS: NO OPPOSITION FILED WITHIN TIME LIMIT |
|
| 26N | No opposition filed | ||
| ITTA | It: last paid annual fee | ||
| PGFP | Annual fee paid to national office [announced via postgrant information from national office to epo] |
Ref country code: GB Payment date: 19940118 Year of fee payment: 11 |
|
| PGFP | Annual fee paid to national office [announced via postgrant information from national office to epo] |
Ref country code: FR Payment date: 19940126 Year of fee payment: 11 |
|
| PGFP | Annual fee paid to national office [announced via postgrant information from national office to epo] |
Ref country code: DE Payment date: 19940225 Year of fee payment: 11 |
|
| PG25 | Lapsed in a contracting state [announced via postgrant information from national office to epo] |
Ref country code: GB Effective date: 19950203 |
|
| GBPC | Gb: european patent ceased through non-payment of renewal fee |
Effective date: 19950203 |
|
| PG25 | Lapsed in a contracting state [announced via postgrant information from national office to epo] |
Ref country code: FR Effective date: 19951031 |
|
| PG25 | Lapsed in a contracting state [announced via postgrant information from national office to epo] |
Ref country code: DE Effective date: 19951101 |
|
| REG | Reference to a national code |
Ref country code: FR Ref legal event code: ST |