EP3620780A1 - Dispositif d'analyse de système de coagulation sanguine et procédé et programme d'analyse de système de coagulation sanguine - Google Patents
Dispositif d'analyse de système de coagulation sanguine et procédé et programme d'analyse de système de coagulation sanguine Download PDFInfo
- Publication number
- EP3620780A1 EP3620780A1 EP19198048.1A EP19198048A EP3620780A1 EP 3620780 A1 EP3620780 A1 EP 3620780A1 EP 19198048 A EP19198048 A EP 19198048A EP 3620780 A1 EP3620780 A1 EP 3620780A1
- Authority
- EP
- European Patent Office
- Prior art keywords
- blood
- permittivity
- coagulation system
- blood coagulation
- electrodes
- Prior art date
- Legal status (The legal status is an assumption and is not a legal conclusion. Google has not performed a legal analysis and makes no representation as to the accuracy of the status listed.)
- Withdrawn
Links
Images


Classifications
-
- G—PHYSICS
- G01—MEASURING; TESTING
- G01N—INVESTIGATING OR ANALYSING MATERIALS BY DETERMINING THEIR CHEMICAL OR PHYSICAL PROPERTIES
- G01N27/00—Investigating or analysing materials by the use of electric, electrochemical, or magnetic means
- G01N27/02—Investigating or analysing materials by the use of electric, electrochemical, or magnetic means by investigating impedance
- G01N27/026—Dielectric impedance spectroscopy
-
- G—PHYSICS
- G01—MEASURING; TESTING
- G01N—INVESTIGATING OR ANALYSING MATERIALS BY DETERMINING THEIR CHEMICAL OR PHYSICAL PROPERTIES
- G01N33/00—Investigating or analysing materials by specific methods not covered by groups G01N1/00 - G01N31/00
- G01N33/48—Biological material, e.g. blood, urine; Haemocytometers
- G01N33/483—Physical analysis of biological material
- G01N33/487—Physical analysis of biological material of liquid biological material
- G01N33/49—Blood
- G01N33/4905—Determining clotting time of blood
-
- G—PHYSICS
- G01—MEASURING; TESTING
- G01N—INVESTIGATING OR ANALYSING MATERIALS BY DETERMINING THEIR CHEMICAL OR PHYSICAL PROPERTIES
- G01N33/00—Investigating or analysing materials by specific methods not covered by groups G01N1/00 - G01N31/00
- G01N33/48—Biological material, e.g. blood, urine; Haemocytometers
- G01N33/50—Chemical analysis of biological material, e.g. blood, urine; Testing involving biospecific ligand binding methods; Immunological testing
- G01N33/86—Chemical analysis of biological material, e.g. blood, urine; Testing involving biospecific ligand binding methods; Immunological testing involving blood coagulating time or factors, or their receptors
Definitions
- the present invention relates to a field relating to a technique of obtaining information relating to blood coagulation from the permittivity of blood.
- prothrombin time and activated partial thromboplastin have been widely known as blood coagulation system tests.
- these tests are important for an examination of blood coagulation factor deficiency syndrome or the like and monitoring of blood to which an anticoagulant is applied, and methods of standardizing the tests have been proposed (for example, see PTL 1).
- the tests are not for (quantitatively) observing the degree of ease of clotting of blood, but for observing in a fragmentary manner (qualitatively) whether or not coagulation is completed within a time considered as normal under the conditions where the coagulation reaction is accelerated by adding an excessive amount of a coagulation initiator.
- the tests are methods for evaluating a risk (bleeding tendency) caused by difficulty of clotting of blood, and in this method, a risk (thrombotic tendency) caused by ease of clotting of blood cannot be evaluated.
- Observing (quantitatively) a degree of ease of clotting of blood is important because it has advantages such as a large amount of information in comparison to observing in a fragmentary manner, and in recent years, analyzing a blood coagulation system with high accuracy has been in more demand than observing in a fragmentary manner.
- the invention is contrived in view of the above-described points and is to propose a blood coagulation system analysis device, and a method and a program for analysis of a blood coagulation system, capable of analyzing a blood coagulation system with high accuracy.
- the invention relates to a blood coagulation system analysis device including: a pair of electrodes; application means for applying an alternating voltage to the pair of electrodes at predetermined time intervals; measurement means for measuring a permittivity of blood which is positioned between the pair of electrodes; and analysis means for analyzing a degree of the action of a blood coagulation system by using the permittivity of blood which is measured at the time intervals after the anticoagulant effect acting on the blood is ended.
- the invention relates to a blood coagulation system analysis method including: an application step of applying an alternating voltage to a pair of electrodes at predetermined time intervals; a measurement step of measuring a permittivity of blood which is positioned between the pair of electrodes; and an analysis step of analyzing a degree of the action of a blood coagulation system by using the permittivity of blood which is measured at the time intervals after the anticoagulant effect acting on the blood is ended.
- the invention relates to a program to cause: an application portion which applies an alternating voltage to apply an alternating voltage to a pair of electrodes at predetermined time intervals; a measurement portion which measures a permittivity to measure a permittivity of blood which is positioned between the pair of electrodes; and an analysis portion which analyzes a blood coagulation system to analyze a degree of the action of a blood coagulation system by using the permittivity of blood which is measured at the time intervals after the anticoagulant effect acting on the blood is ended.
- the blood coagulation system appears as a temporal change in permittivity before a timing (timing at which active polymerization of fibrin monomers starts) at which blood starts to clot from the dynamic viewpoint of viscoelasticity.
- the invention uses the permittivity which is measured after an anticoagulant effect acting on the blood is ended, the process before the timing at which the blood starts to clot from the dynamic viewpoint of viscoelasticity can be clearly observed.
- the invention can analyze the action of the blood coagulation system at an early stage by a temporal change in permittivity before the timing at which blood starts to clot from the dynamic viewpoint of viscoelasticity, and as a result, the degree of accuracy of the analysis can be increased in comparison to the conventional case as much as the movement of the blood coagulation system at an early stage is determined by a temporal change in permittivity.
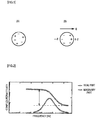
- Positive ions and negative ions are included in a cell ( Fig. 1(A) ).
- these ions move (follow) in accordance with a change in the positive and negative directions in the alternating electric field.
- the positive ions and the negative ions are unevenly distributed in the interface between the cell membrane and the cell cytoplasm, and ionic interfacial polarization occurs ( Fig. 1(B) ).
- Fig. 2 the simulated dielectric spectrum of a cell suspension which is quoted in references and the like is shown in Fig. 2 .
- Fig. 2 when the frequency of the alternating electric field is sufficiently low, interfacial polarization occurs in the interface between the cell membrane and the cell cytoplasm in the cell, and thus the real part of a complex permittivity is obtained as a large value.
- permittivity the real part of the complex permittivity
- dielectric relaxation The phenomenon of a reduction in permittivity is referred to as "dielectric relaxation", and in a portion where the dielectric relaxation occurs, the imaginary part of the complex permittivity increases.
- dielectric loss The imaginary part of the complex permittivity is referred to as dielectric loss in general.
- This dielectric relaxation occurs at a specific frequency band depending on the size, structure, and the like of the cell, and the number of the dielectric relaxations depends on the number of major interfaces included in the cell. For example, in a cell such as a red blood cell without a cell nucleus, the number of the dielectric relaxations is one, and in a nucleated cell with one or more nuclei, the number of the dielectric relaxations is two or more.
- dielectric dispersion the real part and the imaginary part of the complex permittivity of the cell depend on the frequency of the electric field. This is referred to as "dielectric dispersion”.
- the reaction was started by adding thrombin to model blood and the model blood just after the addition of the thrombin thereto was introduced into a sample introduction portion to measure the permittivity (the real part of the complex permittivity) in a blood coagulation system.
- the used model blood was prepared by mixing bovine-derived fibrinogen (Sigma Chem) with an erythrocyte suspension, which is prepared by washing preserved rabbit blood (Kohjin Bio Co., Ltd.) with PBS, and adjusting hematocrit to 25[%] and the concentration of fibrinogen to 0.22[%].
- bovine-derived thrombin (Sigma Chem) was adjusted to 0.01[%] (10 [units/ml]) thrombin, and 10 [ ⁇ l] (that is, 100 ml [units/ml]) or 5 [ ⁇ l] (that is, 50 ml [units/ml]) was added per 1 [ml] of model blood.
- the permittivity was measured by using an impedance analyzer (4294A) (manufactured by Agilent Technologies Inc.).
- the frequency range to be measured (hereinafter, also referred to as a measurement frequency range) was set in the range of 40 [Hz] to 110 [Hz]
- the time interval to be measured (hereinafter, also referred to as a measurement interval) was set to 1 [minute]
- the temperature of a target to be measured was set to 37[°C].
- the sample introduction portion had a structure shown in Fig. 3 . That is, a cylinder CL made of polypropylene was sealed by inserting a pair of gold-plated cylindrical electrodes E1 and E2 into both ends thereof, and a syringe needle HN for applying blood between the electrodes E1 and E2 penetrated the outer wall of the cylinder CL. The portion through which the syringe needle HN passes is blocked by grease, so that the sealed state of the space surrounded by the electrodes E1 and E2 and the cylinder CL is maintained.
- Fig. 4 shows the dielectric spectrum which was obtained on the basis of the above-described method of the experiment
- Fig. 5 shows the dielectric spectrum which was observed under the same conditions as in the above-described method of the experiment under the state in which thrombin was not added to model blood.
- Fig. 4 shows the dielectric spectrum when 10 [ ⁇ l] of thrombin was added per 1 [ml] of model blood.
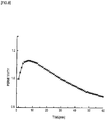
- a temporal change in permittivity corresponding to a specific frequency (here, 758 [kHz]) is shown in Fig. 6 .
- the curve W1 in Fig. 6 represents a case in which thrombin was not added to model blood (two-dimensional graph made by cutting out the portion of 758 [kHz] in Fig. 5 ).
- the curve W2 represents a case in which 10 [ ⁇ l] of thrombin was added per 1 [ml] of model blood (two-dimensional graph made by cutting out the portion of 758 [kHz] in Fig. 4 ).
- the curve W3 represents a case in which 5 [ ⁇ l] of thrombin was added per 1 [ml] of model blood (two-dimensional graph made by cutting out the portion of 758 [kHz] (not shown) as in Fig. 4 ).
- the graph (A) shows a case in which 10 [ ⁇ l] of thrombin was added per 1 [ml] of model blood and the graph (B) shows a case in which 5 [ ⁇ l] of thrombin was added per 1 [ml] of model blood.
- the peaks in Figs. 7(A) and 7(B) show the timing at which certain viscoelastic characteristics are exhibited. That is, the peaks represent the timing (hereinafter, also referred to as a viscoelasticity manifestation timing) at which blood starts to clot from the viewpoint of (dynamic) viscoelasticity.
- the actual blood coagulation system is subjected to complicated biological reactions in which a number of coagulation factors relate to each other, but eventually, fibrinogen in blood is converted into fibrin due to the involvement of thrombin.
- a portion in which fibrinogen is changed into fibrin can be determined as a process taking a substantial role of blood clotting.
- fibrinogen is changed into fibrin monomers due to the involvement of thrombin and they are polymerized with each other to be changed into fibrin polymers.
- the fibrin polymers are cross-linked to each other due to the involvement of a XIII-th factor to be changed into stabilized fibrin, so that substantial blood coagulation occurs.
- the viscoelasticity manifestation timing which is obtained as a peak by a measurement of a free damped oscillation-type rheometer (the peak may not be obtained, but in that case, the point of time at which the logarithmic decrement starts to be reduced is employed) is thought to correspond to the process in which fibrin monomers are polymerized with each other to be changed into fibrin polymers or the process in which these fibrin polymers are cross-linked to each other to be changed into stabilized fibrin. At least, the timing is later than a point of time at which the thrombin starts to be involved with respect to fibrinogen.
- Fig. 7 As is clear from Fig. 7 , as in the case of the dielectric spectrum shown in Fig. 6 , after about 8 [minutes] from the point of time at which thrombin was added ( Fig. 7(A) ), and after about 18 [minutes] from the point of time at which a half of the thrombin was added ( Fig. 7B )), a rapid increase in the viscoelastic modulus (viscoelasticity manifestation timing) was observed.
- Fig. 8 shows a temporal change in permittivity corresponding to a specific frequency (here, 758 [kHz]) from just after addition of a coagulation initiator (calcium chloride) to blood which is collected from a terminal of a human in a test tube containing an anticoagulant (citric acid).
- a coagulation initiator calcium chloride
- the gradient of the permittivity in the initial stage from just after the start of the measurement up to the peak is large when the viscoelasticity manifestation timing is early ( Fig. 6 : curve W2), and the gradient is small when the viscoelasticity manifestation timing is late ( Fig. 6 : curve W3). Accordingly, from the transition of the permittivity in the initial stage up to the peak, the degree of the action of the blood coagulation system (degree of hypercoagulability or degree of coagulability) can be analyzed in detail in a short time.
- FIG. 9 the schematic configuration of a blood coagulation system analysis device 1 is shown.
- This blood coagulation system analysis device 1 has a sample introduction portion 2 and a signal processing portion 3.
- a temperature sensor (not shown) and a thermoelectric element (not shown) are provided in the sample introduction portion 2 or the signal processing portion 3.
- the blood coagulation system analysis device 1 measures the temperature of blood to be measured by using the temperature sensor and gives a signal amount according to this measurement result to the thermoelectric element in order to be able to adjust the temperature of the blood.
- the sample introduction portion 2 has a pair of electrodes and human blood is introduced between the electrodes.
- An anticoagulation effect acts on this human blood, and the anticoagulation effect is ended just before or after introduction of the human blood between the electrodes.
- This sample introduction portion 2 can employ, for example, the structure shown in Fig. 3 .
- the structure of the sample introduction portion 2, or the shape or material of each portion is not limited to that shown in Fig. 3 .
- a sample introduction portion can be employed which has a structure in which both ends of a tube which has a sectional surface having a polygonal shape (triangular, square or polygonal) are sealed and a pair of electrodes and wirings connected thereto are printed on one inner surface of the cylinder.
- the main point is that the anticoagulation effect acting on the blood can be ended just before or after introduction of the blood between the electrodes and the blood can be allowed to stay between the electrodes for a predetermined time period.
- the signal processing portion 3 is configured to include a voltage application portion 11, a permittivity measurement portion 12, and a blood coagulation system analysis portion 13.
- the voltage application portion 11 applies an alternating voltage while judging a point of time at which a command to start a measurement is received or a point of time at which power is applied as a start point.
- the voltage application portion 11 applies, at set measurement intervals, an alternating voltage of a frequency (hereinafter, also referred to as a frequency to be considered) which is set to be considered to the pair of electrodes disposed in the sample introduction portion 2.
- a frequency to be considered an alternating voltage of a frequency
- the measurement interval and the frequency to be considered specifically, 1 [minute] and 758 [kHz] used in the above-described experiments can be employed.
- these numerical values are examples, and the measurement interval and the frequency to be considered are not limited to the numerical values.
- the measurement interval and the frequency to be considered can be set to various values via input means such as a mouse or a keyboard.
- the dielectric measurement portion 12 measures permittivity while judging a point of time at which a command to start a measurement is received or a point of time at which power is applied as a start point.
- the dielectric measurement portion 12 measures a current or impedance between the pair of electrodes disposed in the sample introduction portion 2 at predetermined intervals and calculates the permittivity from the measured value.
- a known function or relational expression showing the relationship between the current or impedance and the permittivity is used.
- permittivity data showing the permittivity corresponding to the frequency to be considered is given to the blood coagulation system analysis portion 13 from the permittivity measurement portion 12 at measurement intervals.
- the blood coagulation system analysis portion 13 starts a blood coagulation system analysis process when receiving the permittivity data after the point of time at which the anticoagulation effect of human blood is ended among the permittivity data given from the permittivity measurement portion 12.
- a method of setting a value, which is greater than the permittivity which is shown before the anticoagulation effect is ended by a predetermined amount, as a threshold and judging a point of time, at which permittivity data showing the permittivity equal to or greater than the threshold is received, as a point of time at which the anticoagulation effect of human blood is ended is employed.
- a period until a set period elapses from the point of time at which the blood coagulation system analysis process is started is set as an analysis period.
- the blood coagulation system analysis portion 13 detects a straight line most approximate to permittivities which are shown by a plurality of pieces of permittivity data received (measured) within this analysis period.
- the blood coagulation system analysis portion 13 obtains the gradient of the detected straight line as a parameter showing an amount of increase in permittivity before the viscoelasticity manifestation timing, and predicts the viscoelasticity manifestation timing from the gradient.
- the greater the gradient of the straight line, the earlier the viscoelasticity manifestation timing and for example, the prediction is performed on the basis of a database in which the gradient of the straight line and the viscoelasticity manifestation timing are associated with each other or a function showing the relationship (regularity) between the gradient of the straight line and the viscoelasticity manifestation timing.
- the blood coagulation system analysis portion 13 When predicting the viscoelasticity manifestation timing, the blood coagulation system analysis portion 13 notifies of one or both of the prediction results and the permittivity used in the prediction.
- This notification is performed by, for example, performing plotting and displaying on a monitor or printing on a predetermined medium.
- the blood coagulation system analysis device 1 sets, for example, the time when a command to start a measurement is received or the time when power is applied as a trigger to deploy a program stored in a ROM in a RAM, and advances the process to Step SP 1 to start the blood coagulation system analysis process.
- Step SP1 the blood coagulation system analysis device 1 prompts the voltage application portion 11 to start the application of an alternating voltage of a frequency to be considered to the pair of electrodes disposed in the sample introduction portion 2 at set measurement intervals, and advances the process to the next Step SP2.
- Step SP2 the blood coagulation system analysis device 1 prompts the permittivity measurement portion 12 to measure the permittivity, and advances the process to the following sub-routine (hereinafter, also referred to as a blood coagulation system analysis routine) SRT.
- the blood coagulation system analysis device prompts the blood coagulation system analysis portion 13 to start the analysis of the blood coagulation system.
- Step SP 11 of the blood coagulation system analysis routine the blood coagulation system analysis portion 13 awaits permittivity data showing the permittivity equal to or greater than a predetermined threshold.
- the blood coagulation system analysis portion 13 judges this moment as the point of time at which the anticoagulation effect of human blood is ended, and advances the process to the next Step SP12.
- Step SP12 the blood coagulation system analysis portion 13 starts timekeeping of the set analysis period, and accumulates permittivity data which is given from the permittivity measurement portion 12 until the set analysis period elapses.
- the blood coagulation system analysis portion 13 detects a straight line most approximate to permittivities which are shown by the permittivity data accumulated within the analysis period, and obtains a gradient of the straight line as a parameter showing an amount of increase in permittivity before the viscoelasticity manifestation timing.
- Step SP14 the blood coagulation system analysis portion 13 predicts the viscoelasticity manifestation timing from the parameter (gradient of the initial waveform of the dielectric spectrum) obtained in Step SP13, and then ends the blood coagulation system analysis process.
- the blood coagulation system analysis device 1 executes the blood coagulation system analysis process in accordance with the program deployed in the RAM.
- this blood coagulation system analysis device 1 applies an alternating voltage of a frequency to be considered at predetermined time intervals to the pair of electrodes which is opposed to each other with the position, at which blood is to be positioned, interposed therebetween (see Fig. 9 ).
- the blood coagulation system analysis device 1 measures a permittivity of the blood which is positioned between the pair of electrodes at predetermined time intervals after the anticoagulant effect acting on the blood is ended, and analyzes the degree of the action of the blood coagulation system from the measurement result.
- the blood coagulation system is observed as a temporal change in permittivity before the viscoelasticity manifestation timing (timing at which blood starts to clot from the viewpoint of viscoelasticity (in greater detail, at least timing at which active polymerization of fibrin monomers starts)) (see Figs. 6 and 7 ).
- the blood coagulation system analysis device 1 uses the permittivity which is measured after the anticoagulant effect acting on the blood is ended, the process before the viscoelasticity manifestation timing which cannot be observed by a free damped oscillation-type rheometer can be clearly observed.
- this blood coagulation system analysis device 1 can quantitatively determine the blood coagulation factor acting at an early stage before the viscoelasticity manifestation timing by a temporal change in permittivity before the viscoelasticity manifestation timing.
- activated partial thromboplastin time has been widely known as described above.
- this APTT is not for observing a degree of ease of clotting of blood, but for observing in a fragmentary manner (qualitatively) whether or not coagulation is completed within a time considered as normal under the conditions where the coagulation reaction is accelerated by adding an excessive amount of a coagulation initiator to evaluate the difficulty of clotting of blood (bleeding tendency). Accordingly, the APTT is useless when the ease of clotting of blood (thrombotic tendency) such as venous thrombosis relatively gradually progressing due to bloodstream stagnation in the vein becomes a problem, and a risk of the disease cannot be evaluated.
- This blood coagulation system analysis device 1 can quantitatively determine the blood coagulation factor acting at an early stage by a temporal change in permittivity before the viscoelasticity manifestation timing. Accordingly, this blood coagulation system analysis device 1 can evaluate a risk or perform monitoring of diseases relating to the blood coagulation with higher accuracy than in a conventional method of determining in a fragmentary manner (qualitatively) whether or not coagulation is completed within a time considered as normal. Evaluating the risk of diseases is very useful also from the viewpoint of preventive medicine.
- risk determination after the operation and judgment for medication based on the determination can be easily performed. Since advancing age, obesity, smoking, pregnancy, and the like are also risk factors for onset of venous thromboembolism, risk determination of these and judgment for medication based on the determination can be easily performed. In addition, in the case of diabetic patients, hypercoagulability is often seen and thus judgment for medication can be easily performed by determining the degree thereof.
- the viscoelasticity manifestation timing is predicted from the parameter showing the amount of increase in permittivity before the viscoelasticity manifestation timing. Accordingly, this blood coagulation system analysis device 1 can not only show a trend of the blood coagulation system before the viscoelasticity manifestation timing as a change in permittivity on the display portion, but also rapidly show the viscoelasticity manifestation timing which is predicted from the change in permittivity.
- the viscoelasticity manifestation timing requires several tens [minutes] from the start of the coagulation system, but showing the viscoelasticity manifestation timing in several [minutes] is particularly useful from the viewpoint of monitoring of diseases or evaluation of a risk.
- the blood coagulation system analysis device 1 was used to analyze the action of the blood coagulation system at an early stage by a temporal change in permittivity after the anticoagulant effect acting on blood is ended. Accordingly, it is possible to not only perform monitoring of diseases which could not be performed by a conventional measurement method relating to the blood coagulation system, but also evaluate a risk of the diseases. As a result, it is possible to realize the blood coagulation system analysis device 1 capable of increasing the degree of accuracy of the analysis in comparison to the conventional case.
- human peripheral blood venous blood
- the sample is not limited to human blood and may be blood of an animal other than a human.
- the sample may be arterial blood.
- an alternating voltage of a frequency to be considered was applied to the pair of electrodes disposed in the sample introduction portion 2.
- the frequency of the alternating voltage to be applied may be a frequency for each predetermined or whole width in a certain band including the frequency to be considered.
- data showing the permittivity corresponding to a plurality of frequencies is given to the blood coagulation system analysis portion 13 at measurement intervals from the permittivity measurement portion 12. Accordingly, the blood coagulation system analysis portion 13 can correct the above permittivity by using the permittivity corresponding to a plurality of frequencies.
- red blood cells are often linked together irregularly or in the form of rouleau and agglutinate (form a lump).
- red blood cells agglutinate the permittivities of the red blood cells are known to increase as shown in Fig. 12 .
- Fig. 12 quotes the measurement result of a change in permittivity after stopping stirring of whole blood, blood in which a plasma component is 50%, and blood in which a plasma component is 0% from A. lrimajiri et al, elsevier science, Biochim.Biophys, vol.1290, p.207-209 .
- a change ratio of permittivity is viewed as a ratio between the permittivity and permittivity at a reference time, it is found that a temporal change in permittivity resulting from the agglutination of red blood cells exhibits a frequency dependency (a difference in a temporal change in permittivity due to a difference in a frequency) that is smaller than that of a temporal change in permittivity resulting from blood coagulation.
- Figs. 13 and 14 show the experimental results.
- Fig. 13 shows temporal changes when permittivities corresponding to two specific frequencies are each expressed as a ratio between the permittivity and permittivity at a reference time just after human venous blood is collected in a test tube containing an anticoagulant (citric acid) and a coagulation initiator (calcium chloride) is added to the blood.
- an anticoagulant citric acid
- a coagulation initiator calcium chloride
- Fig. 14 shows a temporal change when a difference between change ratios of the permittivities each corresponding to each frequency is taken (that is, a difference between the waveform W10 and the waveform W11 shown in Fig. 13 ).
- the difference between change ratios corresponding to the respective frequencies has a tendency to linearly increase since the degree of influence of the permittivity resulting from the agglutination of red blood cells is reduced while leaving the degree of influence of a change in permittivity resulting from blood coagulation.
- Fig. 15 shows another experimental result. This Fig. 15 shows the relationship between analysis using the difference between change ratios of permittivities corresponding to two frequencies and the coagulation initiation timing obtained by a rheological measurement.
- the plots of Fig. 15 show, regarding five healthy people, a difference between change ratios of permittivities corresponding to two frequencies (150 [kHz] and 260 [kHz]) after 10 minutes from the start of the measurement.
- the waveform of Fig. 15 is an optimum approximate curve based on these plots.
- the blood coagulation system analysis portion 13 divides measured values (permittivities corresponding to the two specific frequencies), which are given from the permittivity measurement portion 12 at predetermined intervals, by expressing them as a ratio between the permittivity and permittivity at a reference time, thereby being capable of focusing precisely on the temporal change in permittivity reflecting the initial process of the blood coagulation reaction. As a result, it is possible to further improve the degree of accuracy of the analysis of the permittivity resulting from blood coagulation.
- the permittivity corresponding to the frequency to be considered may be corrected.
- a correction method of correcting the gradient of permittivity corresponding to the frequency to be considered can be employed so that the larger the degree of bias in the gradient of permittivity corresponding to a frequency approximate to the frequency to be considered, the side where the bias of the gradient is large is weighted.
- the above-described correction method is an example, and other types of correction methods can be employed.
- any one of a so-called frequency range method, a frequency superposition method, and a time range method can be employed and a method in which these methods are combined can also be employed.
- the frequency range method is a method of applying an alternating voltage while rapidly switching a frequency for each predetermined or the whole width in a frequency band to be measured.
- the frequency superposition method is a method of applying an alternating voltage in which all or some frequency components in a frequency band to be measured are mixed.
- the time range method is a method of applying a step voltage. In this time range method, a process is needed for Fourier-transforming the current responding to an alternating voltage in which a plurality of frequency components is mixed as a function of time and detecting the frequency dependency.
- a wave in which a plurality of frequency components is mixed for example, a derivative Gaussian wave, a surface transverse wave (STW), a Rayleigh wave (Surface Acoustic Wave), a Bleustein-Gulyaev-Shimizu (BGS) wave, a Lamb wave, a surface skimming bulk wave, a shear horizontal (SH) wave, or the like can be applied.
- a derivative Gaussian wave for example, a derivative Gaussian wave, a surface transverse wave (STW), a Rayleigh wave (Surface Acoustic Wave), a Bleustein-Gulyaev-Shimizu (BGS) wave, a Lamb wave, a surface skimming bulk wave, a shear horizontal (SH) wave, or the like
- STW surface transverse wave
- BGS Rayleigh wave
- BGS Bleustein-Gulyaev-Shimizu
- Lamb wave a surface skimming bulk wave
- SH shear horizontal
- the gradient of a straight line most approximate to the permittivities which are measured within the analysis period was applied.
- this parameter is not limited to the gradient of the straight line.
- an average of change ratios of the permittivities which are measured within the analysis period can be used.
- the blood coagulation system analysis portion 13 takes, for each reception of permittivity data from the permittivity measurement portion 12 within the analysis period, a difference between permittivities which are shown by the above permittivity data and permittivity data received just before the above point of time of reception. This difference becomes an amount of increase in permittivity per observation interval.
- the blood coagulation system analysis portion 13 obtains the amount of increase in permittivity per observation interval until the analysis period elapses, and when the analysis period elapses, the blood coagulation system analysis portion obtains an average of the obtained amounts of increase in permittivity as a parameter showing an amount of increase in permittivity before the viscoelasticity manifestation timing.
- an average of change ratios of the permittivities which are measured within the analysis period can be applied.
- Another other than the average of change ratios of the permittivities or the gradient of the straight line can be used as a parameter showing an amount of increase in permittivity before the viscoelasticity manifestation timing.
- the viscoelasticity manifestation timing was predicted.
- the analysis item is not limited to the prediction of the viscoelasticity manifestation timing. For example, a risk of thrombus can be evaluated.
- the evaluation is performed on the basis of, for example, a database in which the parameter and the risk of thrombus are associated with each other or a function showing the relationship (regularity) between the parameter and the risk of thrombus.
- the risk of thrombus can also be evaluated in a step-by-step manner.
- the invention can be used in biological experiments, monitoring, or bioindustries such as diagnosis or preparation of medicine.
Landscapes
- Health & Medical Sciences (AREA)
- Life Sciences & Earth Sciences (AREA)
- Engineering & Computer Science (AREA)
- Chemical & Material Sciences (AREA)
- Hematology (AREA)
- Biomedical Technology (AREA)
- Physics & Mathematics (AREA)
- Immunology (AREA)
- Molecular Biology (AREA)
- Urology & Nephrology (AREA)
- Analytical Chemistry (AREA)
- General Health & Medical Sciences (AREA)
- General Physics & Mathematics (AREA)
- Biochemistry (AREA)
- Pathology (AREA)
- Food Science & Technology (AREA)
- Medicinal Chemistry (AREA)
- Microbiology (AREA)
- Cell Biology (AREA)
- Biotechnology (AREA)
- Ecology (AREA)
- Biophysics (AREA)
- Spectroscopy & Molecular Physics (AREA)
- Chemical Kinetics & Catalysis (AREA)
- Electrochemistry (AREA)
- Investigating Or Analysing Biological Materials (AREA)
- Investigating Or Analyzing Materials By The Use Of Electric Means (AREA)
Applications Claiming Priority (4)
| Application Number | Priority Date | Filing Date | Title |
|---|---|---|---|
| JP2009002650 | 2009-01-08 | ||
| JP2009293156A JP5691168B2 (ja) | 2009-01-08 | 2009-12-24 | 血液凝固系解析装置、血液凝固系解析方法及びプログラム |
| PCT/JP2010/050367 WO2010079845A1 (fr) | 2009-01-08 | 2010-01-07 | Analyseur du système de coagulation sanguine, de même que procédé et programme d'analyse de système de coagulation sanguine |
| EP10729263.3A EP2375244B1 (fr) | 2009-01-08 | 2010-01-07 | Analyseur du système de coagulation sanguine, de même que procédé et programme d'analyse de système de coagulation sanguine |
Related Parent Applications (2)
| Application Number | Title | Priority Date | Filing Date |
|---|---|---|---|
| EP10729263.3A Division EP2375244B1 (fr) | 2009-01-08 | 2010-01-07 | Analyseur du système de coagulation sanguine, de même que procédé et programme d'analyse de système de coagulation sanguine |
| EP10729263.3A Division-Into EP2375244B1 (fr) | 2009-01-08 | 2010-01-07 | Analyseur du système de coagulation sanguine, de même que procédé et programme d'analyse de système de coagulation sanguine |
Publications (1)
| Publication Number | Publication Date |
|---|---|
| EP3620780A1 true EP3620780A1 (fr) | 2020-03-11 |
Family
ID=42316607
Family Applications (2)
| Application Number | Title | Priority Date | Filing Date |
|---|---|---|---|
| EP10729263.3A Active EP2375244B1 (fr) | 2009-01-08 | 2010-01-07 | Analyseur du système de coagulation sanguine, de même que procédé et programme d'analyse de système de coagulation sanguine |
| EP19198048.1A Withdrawn EP3620780A1 (fr) | 2009-01-08 | 2010-01-07 | Dispositif d'analyse de système de coagulation sanguine et procédé et programme d'analyse de système de coagulation sanguine |
Family Applications Before (1)
| Application Number | Title | Priority Date | Filing Date |
|---|---|---|---|
| EP10729263.3A Active EP2375244B1 (fr) | 2009-01-08 | 2010-01-07 | Analyseur du système de coagulation sanguine, de même que procédé et programme d'analyse de système de coagulation sanguine |
Country Status (5)
| Country | Link |
|---|---|
| US (2) | US9518997B2 (fr) |
| EP (2) | EP2375244B1 (fr) |
| JP (1) | JP5691168B2 (fr) |
| CN (1) | CN102308203B (fr) |
| WO (1) | WO2010079845A1 (fr) |
Cited By (1)
| Publication number | Priority date | Publication date | Assignee | Title |
|---|---|---|---|---|
| US12073926B2 (en) | 2020-09-21 | 2024-08-27 | Instrumentation Laboratory Company | Detecting and monitoring oral anticoagulants or intravenous direct thrombin inhibitors in a blood sample |
Families Citing this family (52)
| Publication number | Priority date | Publication date | Assignee | Title |
|---|---|---|---|---|
| JP5549484B2 (ja) | 2010-09-01 | 2014-07-16 | ソニー株式会社 | 液体試料の電気特性測定のためのサンプルカートリッジと装置 |
| JP5674006B2 (ja) * | 2010-09-02 | 2015-02-18 | 国立大学法人 千葉大学 | 赤血球モニター |
| JP5768422B2 (ja) * | 2011-03-17 | 2015-08-26 | ソニー株式会社 | 血液凝固系解析方法および血液凝固系解析装置 |
| JP5982976B2 (ja) * | 2012-04-13 | 2016-08-31 | ソニー株式会社 | 血液凝固系解析装置、血液凝固系解析方法及びそのプログラム |
| JP2014115256A (ja) * | 2012-12-12 | 2014-06-26 | Sony Corp | 電気的測定用容器、並びに電気的測定用装置および電気的測定方法 |
| KR20150108818A (ko) * | 2013-01-18 | 2015-09-30 | 소니 주식회사 | 전기적 특성 측정 장치 |
| EP2950087B1 (fr) * | 2013-01-28 | 2020-11-04 | Sony Corporation | Dispositif et système de mesure d'impédance pour échantillons biologiques |
| JP6421750B2 (ja) * | 2013-03-13 | 2018-11-14 | ソニー株式会社 | 血液状態解析装置、血液状態解析システム、および血液状態解析プログラム |
| JP6421749B2 (ja) * | 2013-03-15 | 2018-11-14 | ソニー株式会社 | 血液状態解析装置、血液状態解析システム、血液状態解析方法、および該方法をコンピューターに実現させるための血液状態解析プログラム |
| CN105102969A (zh) * | 2013-03-29 | 2015-11-25 | 索尼公司 | 血液状态评估装置、血液状态评估系统、血液状态评估方法以及程序 |
| CN105102968B (zh) * | 2013-03-29 | 2018-11-30 | 索尼公司 | 血液状态分析装置、血液状态分析系统、血液状态分析方法、以及程序 |
| WO2015098473A1 (fr) * | 2013-12-25 | 2015-07-02 | 株式会社日立ハイテクノロジーズ | Dispositif d'analyse automatique et procédé d'analyse |
| JP6569209B2 (ja) | 2014-01-07 | 2019-09-04 | ソニー株式会社 | 電気的測定用カートリッジ、並びに電気的測定装置及び電気的測定方法 |
| JP2015169432A (ja) | 2014-03-04 | 2015-09-28 | ソニー株式会社 | 電気的測定用カートリッジ、並びに電気的測定装置及び電気的測定方法 |
| WO2015159623A1 (fr) * | 2014-04-17 | 2015-10-22 | ソニー株式会社 | Dispositif d'analyse d'état du sang, système d'analyse d'état du sang, procédé d'analyse d'état du sang et programme |
| EP3133395B1 (fr) * | 2014-04-17 | 2019-12-25 | Sony Corporation | Dispositif, système, procédé et programme d'analyse de l'état du sang permettant à un ordinateur de mettre en uvre ledit procédé |
| JP6442858B2 (ja) | 2014-04-17 | 2018-12-26 | ソニー株式会社 | 血液状態解析装置、血液状態解析システム、血液状態解析方法、および該方法をコンピューターに実現させるための血液状態解析プログラム |
| CN103919616B (zh) * | 2014-05-06 | 2016-03-23 | 苏州大学 | 一种用于人工器官表面凝血检测的装置及检测方法 |
| JP6280820B2 (ja) * | 2014-06-04 | 2018-02-14 | 株式会社Dnpファインケミカル | 血液状態の規定方法 |
| JP6515677B2 (ja) | 2014-07-24 | 2019-05-22 | ソニー株式会社 | コンタクト構造体、及び該コンタクト構造体を用いた生体試料用電気的測定装置 |
| JP2016024161A (ja) | 2014-07-24 | 2016-02-08 | ソニー株式会社 | 電気的測定用カートリッジ、生体試料用電気的測定装置、生体試料用電気的測定システム及び生体試料用電気的測定方法 |
| WO2016132779A1 (fr) | 2015-02-20 | 2016-08-25 | ソニー株式会社 | Dispositif de mesure de caractéristique électrique, système de mesure de caractéristique électrique, procédé de mesure de caractéristique électrique et programme de mesure de caractéristique électrique permettant d'agir sur un ordinateur pour mettre en œuvre ledit procédé |
| JP2016174752A (ja) * | 2015-03-20 | 2016-10-06 | ソニー株式会社 | 血液状態監視装置、血液状態を監視する方法、血液状態監視システム、及び血液状態改善用プログラム |
| US10634660B2 (en) | 2015-03-31 | 2020-04-28 | Sony Corporation | Electrical characteristic measurement device, electrical characteristic measurement method, and blood condition analysis system |
| JP2016191668A (ja) | 2015-03-31 | 2016-11-10 | ソニー株式会社 | 電気的特性測定方法、電気的特性測定装置、及び血液状態解析システム |
| EP3403080B1 (fr) * | 2016-01-15 | 2025-07-23 | Case Western Reserve University | Détection diélectrique pour la caractérisation d'échantillons |
| US11175252B2 (en) | 2016-01-15 | 2021-11-16 | Case Western Reserve University | Dielectric sensing for blood characterization |
| EP3388838B1 (fr) * | 2016-01-29 | 2022-02-16 | Sony Group Corporation | Analyse de coagulation sanguine |
| CN108603853B (zh) * | 2016-02-10 | 2022-08-09 | 索尼公司 | 电特性测量用样本、电特性测量装置和电特性测量方法 |
| CN108603888B (zh) * | 2016-02-17 | 2022-06-10 | 索尼公司 | 血小板聚集活性分析设备、分析系统、分析程序和分析方法 |
| WO2017168885A1 (fr) * | 2016-03-28 | 2017-10-05 | ソニー株式会社 | Dispositif, système et procédé de mesure de caractéristiques électriques |
| WO2017169261A1 (fr) | 2016-03-29 | 2017-10-05 | ソニー株式会社 | Système d'analyse de système de coagulation sanguine, procédé d'analyse de système de coagulation sanguine, et programme d'analyse de système de coagulation sanguine |
| US20190101526A1 (en) | 2016-03-30 | 2019-04-04 | Sony Corporation | Blood state analysis apparatus, blood state analysis system, blood state analysis method, and program |
| JP6288182B2 (ja) * | 2016-08-04 | 2018-03-07 | ソニー株式会社 | 血液凝固系解析装置、血液凝固系解析方法及びそのプログラム |
| JP6750443B2 (ja) | 2016-10-05 | 2020-09-02 | ソニー株式会社 | 血小板凝集能解析方法、血小板凝集能解析装置、血小板凝集能解析用プログラム及び血小板凝集能解析システム |
| WO2018128002A1 (fr) * | 2017-01-06 | 2018-07-12 | ソニー株式会社 | Analyseur de système de coagulation sanguine, système d'analyse de système de coagulation sanguine, procédé d'analyse de système de coagulation sanguine, programme d'analyse de système de coagulation sanguine, prédicteur de volume hémorragique, système de prédiction de volume hémorragique, procédé de prédiction de volume hémorragique et programme de prédiction de volume hémorragique |
| JP6876911B2 (ja) | 2017-02-21 | 2021-05-26 | ソニーグループ株式会社 | 電気的測定用カートリッジ、電気的測定装置及び電気的測定方法 |
| EP3432314B1 (fr) | 2017-07-17 | 2025-09-24 | F. Hoffmann-La Roche AG | Techniques permettant de déterminer des résultats de la coagulation |
| KR102030248B1 (ko) * | 2017-10-31 | 2019-10-08 | 고려대학교 산학협력단 | 램-웨이브 기반 혈액 응고 평가 소자 및 방법 |
| CN107991385B (zh) * | 2017-11-28 | 2020-05-22 | 中国科学院苏州生物医学工程技术研究所 | 一种确定凝血时间的方法及装置 |
| JP6604392B2 (ja) * | 2018-02-08 | 2019-11-13 | ソニー株式会社 | 血液凝固系解析装置、血液凝固系解析方法及びそのプログラム |
| WO2020021890A1 (fr) * | 2018-07-25 | 2020-01-30 | ソニー株式会社 | Analyseur de système de coagulation sanguine |
| JP7135620B2 (ja) | 2018-09-07 | 2022-09-13 | ソニーグループ株式会社 | 血液凝固系解析装置、血液凝固系解析方法及び血液凝固系解析プログラム |
| JP7230429B2 (ja) | 2018-10-25 | 2023-03-01 | ソニーグループ株式会社 | 血小板凝集能解析装置、血小板凝集能解析方法及び血小板凝集能解析システム |
| CN109211729A (zh) * | 2018-10-29 | 2019-01-15 | 杨忠思 | 一种用于精准医疗检测的血液凝滞状态检测装置及方法 |
| CN109363662B (zh) * | 2018-11-08 | 2020-11-27 | 山东大学 | 一种便携式血栓检测装置 |
| JP6747491B2 (ja) * | 2018-11-28 | 2020-08-26 | ソニー株式会社 | 血液状態解析装置、血液状態解析システム、血液状態解析方法、および該方法をコンピューターに実現させるための血液状態解析プログラム |
| KR102185652B1 (ko) * | 2019-02-08 | 2020-12-02 | 고려대학교 산학협력단 | 램-웨이브 기반 검체 분석방법 및 검체 분석용 소자 |
| US11774388B2 (en) | 2019-04-02 | 2023-10-03 | Case Western Reserve University | Dielectric sensing to characterize hemostatic dysfunction |
| US11408844B2 (en) | 2019-04-02 | 2022-08-09 | Case Western Reserve University | Dielectric sensing to characterize hemostatic dysfunction |
| CN111735970B (zh) * | 2020-07-23 | 2020-12-01 | 南京岚煜生物科技有限公司 | 一种凝血分析系统进行凝血分析的方法 |
| CN118818067B (zh) * | 2024-09-11 | 2024-12-03 | 南通大学附属医院 | 一种基于家庭化pt测量的血液凝固特性检测方法及系统 |
Citations (5)
| Publication number | Priority date | Publication date | Assignee | Title |
|---|---|---|---|---|
| GB2260407A (en) * | 1991-10-10 | 1993-04-14 | Christopher Barnes | Contactless measurement of physical parameters of samples |
| WO1993018395A1 (fr) * | 1992-03-10 | 1993-09-16 | Christopher Barnes | Appareil permettant de determiner les proprietes physiques et/ou chimiques d'un echantillon et plus particulierement un echantillon de sang |
| JP2006349684A (ja) | 2005-06-16 | 2006-12-28 | Dade Behring Marburg Gmbh | 血液凝固試験の標準化のための方法 |
| US20080063566A1 (en) * | 2004-09-03 | 2008-03-13 | Mitsubishi Chemical Corporation | Sensor Unit and Reaction Field Cell Unit and Analyzer |
| US20080297169A1 (en) * | 2007-05-31 | 2008-12-04 | Greenquist Alfred C | Particle Fraction Determination of A Sample |
Family Cites Families (14)
| Publication number | Priority date | Publication date | Assignee | Title |
|---|---|---|---|---|
| JPS56744B1 (fr) | 1968-09-27 | 1981-01-09 | ||
| US3840806A (en) | 1973-08-20 | 1974-10-08 | G Stoner | Instrument for measuring blood clotting times |
| RU1720386C (ru) | 1988-07-29 | 1995-03-27 | Харьковский государственный университет | Способ определения агрегационной способности тромбоцитов |
| FR2664981B1 (fr) | 1990-07-20 | 1994-04-29 | Serbio | Dispositif de detection du changement de viscosite d'un electrolyte liquide par effet de depolarisation. |
| US6432657B1 (en) | 1997-07-23 | 2002-08-13 | Tokuyama Corporation | Method for determining coagulation parameters |
| AU754536B2 (en) * | 1998-03-19 | 2002-11-21 | Orgenics Biosensors Ltd. | Device for the determination of blood clotting by capacitance or resistance |
| GB0030929D0 (en) * | 2000-12-19 | 2001-01-31 | Inverness Medical Ltd | Analyte measurement |
| US7291310B2 (en) | 2002-12-17 | 2007-11-06 | The Regents Of The University Of Michigan | Microsystem for determining clotting time of blood and low-cost, single-use device for use therein |
| AU2004231988B2 (en) * | 2003-04-16 | 2010-04-15 | Drexel University | Acoustic blood analyzer for assessing blood properties |
| KR20070034169A (ko) * | 2005-09-23 | 2007-03-28 | 삼성전자주식회사 | 테라헤르츠파를 이용한 혈중 성분 농도 측정 장치 및 방법 |
| JP4935425B2 (ja) | 2007-03-01 | 2012-05-23 | ソニー株式会社 | 血球の定性及び/又は定量分析方法、及び血液劣化検出方法 |
| JP2008215909A (ja) * | 2007-03-01 | 2008-09-18 | Chugoku Electric Power Co Inc:The | 境界標識杭、境界標識杭用安定具および境界標識杭の設置方法 |
| US20080262740A1 (en) * | 2007-04-20 | 2008-10-23 | Infotonics Technology Center, Inc. | Permittivity-based material sensor |
| CA2689170A1 (fr) | 2007-06-20 | 2008-12-24 | Mec Dynamics Corporation | Procedes et appareil pour mesurer la coagulation du sang |
-
2009
- 2009-12-24 JP JP2009293156A patent/JP5691168B2/ja active Active
-
2010
- 2010-01-07 CN CN201080003940.6A patent/CN102308203B/zh active Active
- 2010-01-07 EP EP10729263.3A patent/EP2375244B1/fr active Active
- 2010-01-07 US US13/142,991 patent/US9518997B2/en active Active
- 2010-01-07 WO PCT/JP2010/050367 patent/WO2010079845A1/fr not_active Ceased
- 2010-01-07 EP EP19198048.1A patent/EP3620780A1/fr not_active Withdrawn
-
2016
- 2016-10-10 US US15/289,636 patent/US11067523B2/en active Active
Patent Citations (5)
| Publication number | Priority date | Publication date | Assignee | Title |
|---|---|---|---|---|
| GB2260407A (en) * | 1991-10-10 | 1993-04-14 | Christopher Barnes | Contactless measurement of physical parameters of samples |
| WO1993018395A1 (fr) * | 1992-03-10 | 1993-09-16 | Christopher Barnes | Appareil permettant de determiner les proprietes physiques et/ou chimiques d'un echantillon et plus particulierement un echantillon de sang |
| US20080063566A1 (en) * | 2004-09-03 | 2008-03-13 | Mitsubishi Chemical Corporation | Sensor Unit and Reaction Field Cell Unit and Analyzer |
| JP2006349684A (ja) | 2005-06-16 | 2006-12-28 | Dade Behring Marburg Gmbh | 血液凝固試験の標準化のための方法 |
| US20080297169A1 (en) * | 2007-05-31 | 2008-12-04 | Greenquist Alfred C | Particle Fraction Determination of A Sample |
Non-Patent Citations (3)
| Title |
|---|
| A IRIMAJIRI ET AL: "Dielectric monitoring of rouleaux formation in human whole blood: a feasibility study", BIOCHIMICA ET BIOPHYSICA ACTA., vol. 1290, no. 3, 13 August 1996 (1996-08-13), NL, pages 207 - 209, XP055281069, ISSN: 0006-3002, DOI: 10.1016/0304-4165(96)00048-7 * |
| A. LRIMAJIRI ET AL.: "Biochim.Biophys", vol. 1290, ELSEVIER SCIENCE, pages: 207 - 209 |
| MAKOTO KAIBARA, EXPERIMENTAL MEDICINE, vol. 22, no. 13, 2004, pages 1869 - 1874 |
Cited By (1)
| Publication number | Priority date | Publication date | Assignee | Title |
|---|---|---|---|---|
| US12073926B2 (en) | 2020-09-21 | 2024-08-27 | Instrumentation Laboratory Company | Detecting and monitoring oral anticoagulants or intravenous direct thrombin inhibitors in a blood sample |
Also Published As
| Publication number | Publication date |
|---|---|
| JP5691168B2 (ja) | 2015-04-01 |
| JP2010181400A (ja) | 2010-08-19 |
| US20170138875A1 (en) | 2017-05-18 |
| WO2010079845A1 (fr) | 2010-07-15 |
| US20120035450A1 (en) | 2012-02-09 |
| US9518997B2 (en) | 2016-12-13 |
| EP2375244B1 (fr) | 2019-10-30 |
| EP2375244A1 (fr) | 2011-10-12 |
| US11067523B2 (en) | 2021-07-20 |
| EP2375244A4 (fr) | 2017-01-25 |
| CN102308203B (zh) | 2015-08-26 |
| CN102308203A (zh) | 2012-01-04 |
Similar Documents
| Publication | Publication Date | Title |
|---|---|---|
| EP2375244B1 (fr) | Analyseur du système de coagulation sanguine, de même que procédé et programme d'analyse de système de coagulation sanguine | |
| JP2020030217A (ja) | 血液凝固系解析装置、血液凝固系解析方法及びプログラム | |
| CN103543191B (zh) | 检验血液凝固特性 | |
| JP7192944B2 (ja) | 血液凝固系解析装置、血液凝固系解析システム、血液凝固系解析方法、及び血液凝固系解析用プログラム、並びに、出血量予測装置、出血量予測システム、出血量予測方法、及び出血量予測用プログラム | |
| Maji et al. | Assessment of whole blood coagulation with a microfluidic dielectric sensor | |
| JP2012052906A (ja) | 液体試料の電気特性測定のためのサンプルカートリッジと装置 | |
| JP2012194087A (ja) | 血液凝固系解析方法および血液凝固系解析装置 | |
| Balandina et al. | Thrombodynamics: a new method to the diagnosis of hemostasis system disorders | |
| US10962495B2 (en) | Blood coagulation system analysis system, blood coagulation system analysis method, and blood coagulation system analysis program | |
| US11982667B2 (en) | Platelet aggregation capacity analyzer, analysis method, and analysis system using complex dielectric permittivity | |
| Döderlein et al. | Reference intervals for thromboelastometry with the ROTEM® delta in cats | |
| US11802825B2 (en) | Platelet aggregation analysis method, platelet aggregation analysis device, program for analyzing platelet aggregation, and platelet aggregation analysis system | |
| Granaderos et al. | IN-VITRO CHARACTERIZATION OF THE THROMBOTIC POTENTIAL OF WHOLE BLOOD USING AN IMPEDANCE METHOD | |
| JP2020190570A (ja) | 血小板凝集能解析方法、血小板凝集能解析装置、血小板凝集能解析用プログラム及び血小板凝集能解析システム |
Legal Events
| Date | Code | Title | Description |
|---|---|---|---|
| PUAI | Public reference made under article 153(3) epc to a published international application that has entered the european phase |
Free format text: ORIGINAL CODE: 0009012 |
|
| STAA | Information on the status of an ep patent application or granted ep patent |
Free format text: STATUS: REQUEST FOR EXAMINATION WAS MADE |
|
| 17P | Request for examination filed |
Effective date: 20190918 |
|
| AC | Divisional application: reference to earlier application |
Ref document number: 2375244 Country of ref document: EP Kind code of ref document: P |
|
| AK | Designated contracting states |
Kind code of ref document: A1 Designated state(s): AT BE BG CH CY CZ DE DK EE ES FI FR GB GR HR HU IE IS IT LI LT LU LV MC MK MT NL NO PL PT RO SE SI SK SM TR |
|
| RAP3 | Party data changed (applicant data changed or rights of an application transferred) |
Owner name: SONY GROUP CORPORATION |
|
| STAA | Information on the status of an ep patent application or granted ep patent |
Free format text: STATUS: EXAMINATION IS IN PROGRESS |
|
| 17Q | First examination report despatched |
Effective date: 20220516 |
|
| STAA | Information on the status of an ep patent application or granted ep patent |
Free format text: STATUS: THE APPLICATION IS DEEMED TO BE WITHDRAWN |
|
| 18D | Application deemed to be withdrawn |
Effective date: 20220927 |