EP4006532A1 - Stress analysis device - Google Patents
Stress analysis device Download PDFInfo
- Publication number
- EP4006532A1 EP4006532A1 EP20856201.7A EP20856201A EP4006532A1 EP 4006532 A1 EP4006532 A1 EP 4006532A1 EP 20856201 A EP20856201 A EP 20856201A EP 4006532 A1 EP4006532 A1 EP 4006532A1
- Authority
- EP
- European Patent Office
- Prior art keywords
- temperature
- images
- image
- stress
- temperature images
- Prior art date
- Legal status (The legal status is an assumption and is not a legal conclusion. Google has not performed a legal analysis and makes no representation as to the accuracy of the status listed.)
- Ceased
Links
Images


Classifications
-
- G—PHYSICS
- G01—MEASURING; TESTING
- G01N—INVESTIGATING OR ANALYSING MATERIALS BY DETERMINING THEIR CHEMICAL OR PHYSICAL PROPERTIES
- G01N3/00—Investigating strength properties of solid materials by application of mechanical stress
- G01N3/32—Investigating strength properties of solid materials by application of mechanical stress by applying repeated or pulsating forces
-
- G—PHYSICS
- G01—MEASURING; TESTING
- G01K—MEASURING TEMPERATURE; MEASURING QUANTITY OF HEAT; THERMALLY-SENSITIVE ELEMENTS NOT OTHERWISE PROVIDED FOR
- G01K11/00—Measuring temperature based upon physical or chemical changes not covered by groups G01K3/00, G01K5/00, G01K7/00 or G01K9/00
- G01K11/22—Measuring temperature based upon physical or chemical changes not covered by groups G01K3/00, G01K5/00, G01K7/00 or G01K9/00 using measurement of acoustic effects
- G01K11/26—Measuring temperature based upon physical or chemical changes not covered by groups G01K3/00, G01K5/00, G01K7/00 or G01K9/00 using measurement of acoustic effects of resonant frequencies
-
- G—PHYSICS
- G01—MEASURING; TESTING
- G01N—INVESTIGATING OR ANALYSING MATERIALS BY DETERMINING THEIR CHEMICAL OR PHYSICAL PROPERTIES
- G01N3/00—Investigating strength properties of solid materials by application of mechanical stress
- G01N3/02—Details
- G01N3/06—Special adaptations of indicating or recording means
- G01N3/068—Special adaptations of indicating or recording means with optical indicating or recording means
-
- G—PHYSICS
- G06—COMPUTING OR CALCULATING; COUNTING
- G06T—IMAGE DATA PROCESSING OR GENERATION, IN GENERAL
- G06T5/00—Image enhancement or restoration
- G06T5/50—Image enhancement or restoration using two or more images, e.g. averaging or subtraction
-
- G—PHYSICS
- G06—COMPUTING OR CALCULATING; COUNTING
- G06T—IMAGE DATA PROCESSING OR GENERATION, IN GENERAL
- G06T5/00—Image enhancement or restoration
- G06T5/70—Denoising; Smoothing
-
- G—PHYSICS
- G06—COMPUTING OR CALCULATING; COUNTING
- G06T—IMAGE DATA PROCESSING OR GENERATION, IN GENERAL
- G06T7/00—Image analysis
- G06T7/0002—Inspection of images, e.g. flaw detection
- G06T7/0004—Industrial image inspection
-
- G—PHYSICS
- G01—MEASURING; TESTING
- G01N—INVESTIGATING OR ANALYSING MATERIALS BY DETERMINING THEIR CHEMICAL OR PHYSICAL PROPERTIES
- G01N2203/00—Investigating strength properties of solid materials by application of mechanical stress
- G01N2203/02—Details not specific for a particular testing method
- G01N2203/06—Indicating or recording means; Sensing means
- G01N2203/0641—Indicating or recording means; Sensing means using optical, X-ray, ultraviolet, infrared or similar detectors
- G01N2203/0647—Image analysis
-
- G—PHYSICS
- G06—COMPUTING OR CALCULATING; COUNTING
- G06T—IMAGE DATA PROCESSING OR GENERATION, IN GENERAL
- G06T2207/00—Indexing scheme for image analysis or image enhancement
- G06T2207/10—Image acquisition modality
- G06T2207/10048—Infrared image
-
- G—PHYSICS
- G06—COMPUTING OR CALCULATING; COUNTING
- G06T—IMAGE DATA PROCESSING OR GENERATION, IN GENERAL
- G06T2207/00—Indexing scheme for image analysis or image enhancement
- G06T2207/20—Special algorithmic details
- G06T2207/20212—Image combination
-
- G—PHYSICS
- G06—COMPUTING OR CALCULATING; COUNTING
- G06T—IMAGE DATA PROCESSING OR GENERATION, IN GENERAL
- G06T2207/00—Indexing scheme for image analysis or image enhancement
- G06T2207/30—Subject of image; Context of image processing
- G06T2207/30108—Industrial image inspection
Definitions
- the present disclosure relates to a stress analysis device using a plurality of temperature images.
- a stress image is obtained from the temperature image by using the fact that there is a linear relationship between temperature change of an object obtained from the temperature image and a stress applied to the object.
- the present disclosure was conceived in view of the situations and it is therefore one non-limiting and exemplary embodiment provides a stress analysis device capable of obtaining a stress image with improved accuracy.
- a stress analysis device includes:
- a stress analysis method includes:
- a temperature measuring device includes:
- a temperature measuring method includes:
- the stress analysis device since a plurality of stress images are added and averaged to obtain an additional averaging stress image, a stress image with improved accuracy can be obtained.
- a stress analysis device includes:
- the stress analysis device further may include a background temperature subtractor that subtracts a background temperature from each of the temperature images after pixel rearrangement.
- the stress analysis device further may include an amplitude corrector that corrects amplitudes of each of the temperature images after pixel rearrangement by dividing a relationship between a frequency and an amplitude after Fourier transformation by a frequency response function of a first-order lag system.
- the stress analysis device further may include a spline interpolator that performs spline interpolation over the same time range of each of the temperature images after pixel rearrangement.
- the imaging element when obtaining the two or more temperature images, may cause a synchronization signal to be included in the two or more temperature images, and the stress analysis device further may include a starting point setter that aligns starting point for the temperature images after pixel rearrangement based on the synchronization signal.
- a stress analysis method includes:
- a temperature measuring device includes:
- a temperature measuring method includes:
- Fig. 1 is a block diagram illustrating a configuration of a stress analysis device 40 according to a first embodiment.
- the stress analysis device 40 includes imaging elements 20a to 20d that obtain two or more temperature images, a feature point extractor 35a that extracts a feature point in each of the temperature images, a projection transformer 35b that aligns the temperature images, a pixel rearranger 35c that rearranges the pixel array of each of the temperature images, a stress converter 35h that obtains a stress image by multiplying each of the temperature images by the stress conversion coefficient, and an additional averaging part 35i that obtains the additional averaging stress image by adding and averaging the stress images.
- the imaging elements 20a to 20d obtain two or more temperature images over the same time range for the same region of an object 1.
- the projection transformer 35b performs projective transformation on each of the temperature images so as to align the feature point in the temperature images, and aligns the temperature images with respect to the temperature image that is the reference.
- the pixel rearranger 35c rearranges the pixel array of each of the temperature images subjected to the projective transformation with respect to the pixel array of the temperature image that is the reference.
- the stress analysis device 40 two or more stress images are added and averaged to obtain the additional averaging stress image.
- a noise generated from the imaging element is canceled by adding and averaging the stress images, and a stress image with improved accuracy can be obtained.
- the object 1 is a body for which stress is analyzed. Although the object 1 is illustrated as an elongated test piece in Fig. 1 , the object 1 is not limited to this.
- the object 1 may be an architecture such as a bridge, a building, or a tower, or a movable body such as a vehicle, a ship, or an aircraft, and an infrared camera may move.
- the object 1 is supported by a load applying portion 10.
- a known sinusoidal load or a sinusoidal load having a plurality of frequencies may be applied to the object 1 in combination by the load applying portion 10.
- the load applied from the load applying portion 10 to the object 1 is known.
- the load applying portion 10 is provided as needed, and is an optional component.
- the load applied to the object 1 to be analyzed in the stress analysis device includes not only the above-mentioned known load but also an unknown load.
- the load applying portion 10 By applying a known load to the object 1 by the load applying portion 10, it is possible to compare temperature data obtained by the temperature images with known load data.
- the time constant of the frequency response function of the first-order lag system is different for each imaging element, and the stress conversion coefficient is also different. Therefore, by applying a known sinusoidal load to the object by the load applying portion 10, the time constant and the stress conversion coefficient of the frequency response function of the imaging elements can be calculated.
- Fig. 1 illustrates four imaging elements 20a to 20d.
- the imaging elements 20a to 20d are illustrated as a combination of four infrared cameras respectively including lenses and the imaging elements.
- the four imaging elements 20a to 20d are arranged in two stages, and two in each stage, but the arrangement method is not limited to this.
- four imaging elements 20a to 20d may be arranged side by side in a horizontal row.
- the imaging elements 20a to 20d have a plurality of pixels, for example, 320 ⁇ 256 pixels, and captures four temperature images ( Figs. 4A to 4D ) of the fields of view 1 to 4 for the same region of the object 1 over the same time range.
- the temperature image is also called an infrared image.
- the image is captured at a predetermined frame rate, for example, 5 Hz to 3000 Hz (5 shots/sec to 3000 shots/sec).
- the above characteristics of the imaging elements 20a to 20d are merely examples, and are not limited thereto.
- a case of four imaging elements is shown here, but is not limited to this. As long as two or more temperature images can be obtained, the number of imaging elements may be one or more as shown in a modification described below.
- An image processor 30 performs image processing on a plurality of temperature images.
- the image processor 30 is, for example, a computer device.
- a general-purpose computer device can be used, and for example, as illustrated in Fig. 1 , the computer device includes a processor 31, a storage 32, and a display 33.
- the computer device may further include an input device, a storage device, an interface, and the like.
- the processor 31 is only required to be, for example, a central processing operator (CPU, MPU, or the like), a microcomputer, or a processing device capable of executing instructions that can be executed by a computer.
- CPU central processing operator
- MPU microcontroller
- processing device capable of executing instructions that can be executed by a computer.
- the storage 32 may be, for example, at least one of ROM, EEPROM, RAM, flash SSD, hard disk, USB memory, magnetic disk, optical disk, magnetooptical disk, and the like.
- the storage 32 includes a program 35.
- the program 35 may be downloaded from the network as needed.
- the program 35 includes the feature point extractor 35a, the projection transformer 35b, the pixel rearranger 35c, the stress converter 35h, and the additional averaging part 35i. They are read from the storage 32 and executed by the processor 31 at the time of execution.
- the program may include a background temperature subtractor 35d, a spline interpolator 35e, an amplitude corrector 35f, and a starting point setter 35g, but they are not essential but optional components.
- the feature point extractor 35a extracts a feature point in each temperature image.
- portions having different temperatures are represented by the difference in grayscale.
- portions having the same temperature are represented as the same temperature regardless of the shape and cannot be distinguished from each other. Therefore, a difference in shape or the like that can be a feature point in a normal image is not a noticeable difference in the temperature image, and is difficult to be used as the feature point. That is, in the temperature image, a portion that appears to be a different temperature can be the feature point. Therefore, for example, a pattern that partially changes the emissivity may be provided on a surface of the object.
- a portion in which a pattern having a different emissivity is provided even if the temperature is substantially the same as the surroundings can be recognized as an apparently different temperature in the temperature image and can be the feature point.
- the pattern having a different emissivity may be formed, for example, by attaching an aluminum thin film having a low emissivity to a part of the object 1.
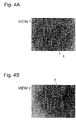
- Fig. 4A is a schematic view illustrating the feature points in the temperature image of a field of view 1 among four fields of view of 1 to 4.
- Fig. 4B is a schematic view illustrating the feature points in the temperature image of a field of view 2 among the four fields of view of 1 to 4.
- Fig. 4C is a schematic view illustrating the feature points in the temperature image of a field of view 3 among the four fields of view of 1 to 4.
- Fig. 4D is a schematic view illustrating the feature points in the temperature image of a field of view 4 among the four fields of view of 1 to 4.
- Figs. 4A to 4D illustrate how the patterns having a different emissivity provided on the surface of the object 1 are detected as the feature points having a difference in apparent temperature in the temperature images of the fields of view 1 to 4. Specifically, a square pattern formed by four circles above and below the elongated object is detected as the feature point. In the temperature images of the fields of view, the square patterns above and below the object correspond to each other.
- the projection transformer 35b performs projective transformation on the temperature images so as to align the feature point in the temperature images, and aligns the temperature images with respect to the temperature image that is the reference.
- a coefficient of the projective transformation for superimposing the temperature images of the fields of view 2, 3, and 4 on the temperature image of the field of view 1 is calculated from the feature points.
- the equation of the projective transformation to convert from (x, y) to (x', y') is as follows.
- x ′ f 0 xh 11 + yh 12 + f 0 h 13 xh 31 + yh 32 + f 0 h 33
- y ′ f 0 xh 21 + yh 22 + f 0 h 23 xh 31 + yh 32 + f 0 h 33
- fo is a constant
- h ij is a coefficient
- f0 is set to 1
- the coefficient is calculated using the least square method.
- x, x', and H are expressed as follows.
- x x / f 0 y / f 0 1
- x ′ x ′ / f 0 y ′ / f 0 1
- 9-dimensional vectors h, ⁇ (1) , ⁇ (2) , and ⁇ (3) are defined as follows.
- the vector h to be determined is a unit eigenvector for the minimum value of a matrix M that minimizes J.
- Fig. 5A(a) is a schematic view illustrating a pixel array including the feature points of the temperature image of the field of view 1
- Fig. 5A(b) is a schematic view illustrating a pixel array including the feature points of the temperature image of the field of view 2.
- Fig. 5B(a) is a schematic view illustrating a pixel array according to a coordinate system of the temperature image of the field of view 1 that is a reference
- Fig. 5B(b) is a schematic view illustrating a pixel array of the temperature image of the field of view 2 after performing projective transformation on the temperature images of the field of view 2 of Fig. 5A(b) to the coordinate system of the temperature image of the field of view 1 so as to aligning the feature points.
- the temperature image of the field of view 2 in Fig. 5B(b) is the schematic view illustrating the pixel array after performing projective transformation of rotating the temperature image of the field of view 2 in Fig. 5A(b) counterclockwise by 45°. Comparing the temperature image of the field of view 1 in Fig. 5B(a) with the temperature image of the field of view 2 after the projective transformation in Fig. 5B(b) , it can be seen that the feature points correspond to each other.
- the temperature image of the field of view 2 can be aligned with the temperature image of the field of view 1 as the reference.
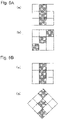
- Fig. 6A(a) is a schematic view illustrating the pixel array according to the coordinate system of the temperature image of the field of view 1 that is the reference
- Fig. 6A(b) is a schematic view illustrating the pixel array of the temperature image of the field of view 2 after performing projective transformation to the coordinate system of the temperature image of the field of view 1.
- Fig. 6B(a) is a schematic view illustrating the pixel array of the temperature image of the field of view 1 that is the reference
- Fig. 6B(b) is a schematic view illustrating the pixel array of the temperature image of the field of view 2 in which the pixel array of the temperature image of the field of view 2 is rearranged to correspond to the pixel array of the temperature image of the field of view 1.
- the pixels are respectively arranged in squares of 3 rows and 3 columns.
- the pixel rearranger 35c rearranges the pixel array of each temperature image subjected to the projective transformation with respect to the pixel array of the temperature image that is the reference. Pixel rearrangement is also called resampling. For example, as illustrated in Fig. 6A(b) , the pixel array of the temperature image of the field of view 2 after the projective transformation may be rotated with respect to the pixel array of the temperature image of the field of view 1. In this case, it may be unclear which pixel corresponds to each temperature image. Therefore, the pixel rearranger 35c rearranges the pixels so that a configuration of the pixel array of the temperature image of the field of view 2 align with a configuration of the pixel array of the temperature image of the field of view 1.
- pixels of three feature points in the center of the pixel array of the field of view 2 before the pixel rearrangement directly correspond to three vertical pixels in the center.
- pixels at corners on both sides before the pixel rearrangement respectively correspond to middle pixels on both sides after pixel rearrangement.
- the pixels on the side adjacent to the corners on both sides before the pixel rearrangement correspond to the pixels on the corners on both sides after pixel rearrangement.
- the pixel arrays of both have the same configuration, and the pixels corresponding to each other are clear.
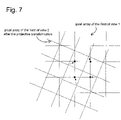
- Fig. 7 is a schematic view illustrating that the pixel array of the field of view 2 after the projective transformation is rearranged to the pixel array of the nearest field of view 1.
- the pixel array of the field of view 1 and the pixel array of the field of view 2 after the projective transformation are illustrated assuming that the pixels are at grid points.
- the pixel array of the field of view 2 is an example of the pixel rearrangement when the pixel array of the field of view 2 is rotated clockwise by 45° with respect to the pixel array of the field of view 1, but the pixel rearrangement is not limited to this. That is, when the pixel arrays form an arbitrary angle with each other, as illustrated in Fig. 7 , the pixels of the pixel array of the field of view 2 are rearranged to the pixels of the pixel array of the nearest field of view 1. Specifically, the pixels of the pixel array of the field of view 2, which are nearest to the pixels of the pixel array of the field of view 1, are rearranged as illustrated by arrows in Fig. 7 . This method is called a "nearest neighbor method". Thus, the pixel array of the field of view 2 has the same configuration as the pixel array of the field of view 1.
- the pixel array of the field of view 2 can be rearranged to a pixel array similar to the pixel array of the field of view 1.
- the pixel rearrangement method is not limited to the above-mentioned nearest neighbor method, and other methods may be used. Further, the pixel rearrangement is not an indispensable configuration, and may be provided as needed.
- the background temperature subtractor 35d subtracts the background temperature from each temperature image after pixel rearrangement.
- the background temperature may be, for example, a temperature of a background object or the like that is present around the object but is not related to the object and is not stressed. By subtracting the background temperature from the temperature image, a back noise generated by temperature change of the environment can be reduced. Especially when the temperature change is large, it is effective for noise reduction.
- the background object is not limited to a naturally present object, and may be, for example, a board installed in advance.
- the imaging element such as a cooling type imaging element in which temperature drift occurs, it is effective to reflect an object whose temperature change is considered to be constant in the temperature image as the object whose background temperature can be obtained.
- the background temperature subtractor is not essential when it is not necessary to substantially consider a change in the background temperature.
- the spline interpolator 35e performs spline interpolation over the same time range of each temperature image after pixel rearrangement.
- the spline interpolation is performed by obtaining a polynomial approximation, for example, a cubic approximation, between data points so that each data point is smoothly connected to each pixel of each temperature image based on the data points before the interpolation by sampling.
- a polynomial approximation for example, a cubic approximation
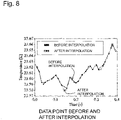
- Fig. 8 is a schematic view illustrating the data points before the interpolation by sampling the temperature change of one pixel and the data points after the interpolation that interpolates between the data points by sampling. As illustrated in Fig. 8 , after the interpolation, the interpolated data points are illustrated between the sampled data points as the data points at the same timing in each temperature image.
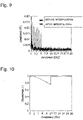
- Fig. 9 is a schematic view illustrating a state before and after amplitude correction of the amplitude of the temperature image with respect to the frequency after Fourier transformation.
- Fig. 10 is a diagram illustrating an example of the frequency response function of the first-order lag system used for the amplitude correction in Fig. 9 .
- the amplitude corrector 35f corrects the amplitude of each temperature image after pixel rearrangement by dividing the relationship between the frequency and the amplitude after Fourier transformation by the frequency response function of the first-order lag system.
- ⁇ is a time constant.
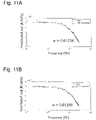
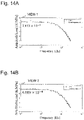
- Fig. 11A is a diagram illustrating the time constant in the frequency response function of the first-order lag system for the temperature image of the field of view 1 by a sinusoidal load experiment.
- Fig. 11B is a diagram illustrating the time constant in the frequency response function of the first-order lag system for the temperature image of the field of view 2 by the sinusoidal load experiment.
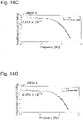
- Fig. 11C is a diagram illustrating the time constant in the frequency response function of the first-order lag system for the temperature image of the field of view 3 by the sinusoidal load experiment.
- Fig. 11D is a diagram illustrating the time constant in the frequency response function of the first-order lag system for the temperature image of the field of view 4 by the sinusoidal load experiment.
- the temperature change obtained by applying a known sinusoidal load to the object 1 is divided by the stress and fitted by the frequency response function of the first-order lag system, so that a time constant ⁇ can be obtained.
- the frequency response function of the first-order lag system of each field of view is calculated using the obtained time constant ⁇ , and for each temperature image, the relationship between the frequency and the amplitude after Fourier transformation can be divided by the calculated frequency response function of the first-order lag system to correct the amplitude.
- the upper limit of the frequency range to be corrected is not limited to 10 Hz.
- the starting point setter 35g aligns the starting points of each temperature image after pixel rearrangement based on the synchronization signal included in each temperature image.
- the synchronization signal is recorded as, for example, the temperature change at the same time in each temperature image by light emission of an LED lamp. By emitting light from the LED lamp, the temperature change at the same time in each temperature image can be used as the synchronization signal.
- the synchronization signal is not limited to a record as the temperature change at the same time in each temperature image by the light emission of the LED lamp.
- opening and closing of a shutter at the time of imaging of each imaging element may be used as the synchronization signal.
- a method of aligning the starting points is not limited to a case of using the synchronization signal included in each temperature image described above.
- a cross-correlation of the temperature images may be calculated to calculate the timing at which the amplitudes of the temperature images best match, and align the starting points.
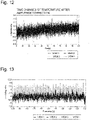
- Fig. 12 is a diagram illustrating time changes of temperature of the same corresponding pixels in the fields of view after amplitude correction in a superimposed manner.
- Fig. 13 is a diagram illustrating the time changes of temperature of the same corresponding pixels in the fields of view after amplitude correction of Fig. 12 by aligning the starting points and superimposing them.
- the stress converter 35h obtains the stress images by multiplying the temperature images after pixel rearrangement by the stress conversion coefficient.
- the stress converter 35h calculates a stress change amount ⁇ from a temperature change amount ⁇ T by using, for example, the following equation (1) expressing thermoelastic effects.
- ⁇ T ⁇ KT ⁇ ⁇
- K is a thermoelastic coefficient
- K ⁇ /(CP)
- T is an absolute temperature of the surface of the object.
- ⁇ is a linear expansion coefficient of the surface of the object
- ⁇ is a density of the surface of the object
- CP is a specific heat of the surface of the object under constant stress.
- the stress converter 35h can obtain the stress image based on the stress change amount of all pixels.
- Fig. 14A is a diagram illustrating the stress conversion coefficient calculated as a reciprocal of an intercept for the temperature image of the field of view 1 by the sinusoidal load experiment.
- Fig. 14B is a diagram illustrating the stress conversion coefficient calculated as the reciprocal of the intercept for the temperature image of the field of view 2 by the sinusoidal load experiment.
- Fig. 14C is a diagram illustrating the stress conversion coefficient calculated as the reciprocal of the intercept for the temperature image of the field of view 3 by the sinusoidal load experiment.
- Fig. 14D is a diagram illustrating the stress conversion coefficient calculated as the reciprocal of the intercept for the temperature image of the field of view 4 by the sinusoidal load experiment.
- the stress images can be obtained for the time changes of the temperature images of the fields of view.
- this stress conversion is not limited to a case where it is performed at a timing after the starting point is set. For example, it may be performed after reading the temperature image. Further, it may be performed at any timing after background temperature subtraction, the spline interpolation, the amplitude correction, or additional averaging.
- the additional averaging part 35i obtains the additional averaging stress image by adding and averaging the stress images.
- the number of stress images to be added and averaged is two or more. Increasing the number of stress images will increase the accuracy, but if it is too many, it will take time for processing. Further, as the number of imaging elements increases, it is difficult to arrange them. Therefore, usually, for example, four stress images are added and averaged. At most 8 to 10 stress images are added and averaged.
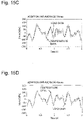
- Fig. 15A is a diagram illustrating the temperature data, which is the time change of the temperature of one pixel in the temperature image of one field of view, and the load data, in a superimposed manner.
- Fig. 15B is a diagram illustrating the temperature data, which is a temperature change of additional averaging of temperatures of the same corresponding pixels in the temperature images of two fields of view, and the load data, in a superimposed manner.
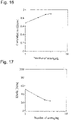
- Fig. 15C is a diagram illustrating the temperature data, which is a temperature change of additional averaging of temperatures of the same corresponding pixels in the temperature images of three fields of view, and the load data, in a superimposed manner.
- Fig. 15A is a diagram illustrating the temperature data, which is the time change of the temperature of one pixel in the temperature image of one field of view, and the load data, in a superimposed manner.
- Fig. 15B is a diagram illustrating the temperature data, which is a temperature change of additional averaging of temperatures of the same corresponding pixels in the
- FIG. 15D is a diagram illustrating the temperature data, which is a temperature change of additional averaging of temperatures of the same corresponding pixels in the temperature images of four fields of view, and the load data, in a superimposed manner.
- the load data applied to the object is known. Therefore, the accuracy of stress conversion from the temperature image to the stress image can be known by superimposing the temperature data obtained from the time change of the temperature image and the load data. That is, the more the temperature data is in line with the load data, the higher the accuracy of stress conversion.
- the temperature data obtained from one temperature image has a large noise with respect to the load data, and the accuracy of the stress image is not sufficient.
- Fig. 15B which is additional averaging of the temperature data obtained from two temperature images
- Fig. 15C which is additional averaging of the temperature data obtained from three temperature images
- Fig. 15D which is additional averaging of the temperature data obtained from four temperature images
- Fig. 16 is a diagram illustrating a relationship between the number of times of additional averaging for one pixel and a correlation coefficient between the temperature data and the load data.
- Fig. 17 is a diagram illustrating a relationship between the number of times of additional averaging for the one pixel and a root mean square error (RMSE) between the temperature data and the load data.
- Fig. 18A is a diagram illustrating the root mean square error (RMSE) between the temperature data and the load data when the additional averaging is once and four times in an X direction of the temperature image.
- Fig. 18B is a diagram illustrating the root mean square error (RMSE) between the temperature data and the load data when the additional averaging is once and four times in a Y direction of the temperature image.
- the correlation coefficient between the temperature data and the load data increases as the number of times of additional averaging increases.
- the root mean square error (RMSE) between the temperature data and the load data decreases as the number of times of additional averaging increases.
- the root mean square error (RMSE) between the temperature data and the load data is smaller when the additional averaging is four times than when the additional averaging is once in the X direction of the temperature image.
- the root mean square error (RMSE) between the temperature data and the load data is smaller when the additional averaging is four times than when the additional averaging is once in the Y direction of the temperature image.
- the stress image with improved accuracy can be obtained by calculating the additional averaging stress image by adding and averaging the plurality of temperature images, that is, the plurality of stress images.
- the display 33 may display a captured temperature image, a graph of temperature change, an obtained stress image, the additional averaging stress image, and the like.
- Fig. 3 is a schematic view illustrating four temperature images of the field of view 1 to the field of view 4 by the compound eye infrared camera of the imaging element used in the stress analysis device 40 according to the modification.
- the modification differs in that the plurality of imaging elements are not used as illustrated in Fig. 1 . That is, it is characterized in that the plurality of temperature images of the fields of view 1 to 4 are captured in one imaging element.
- the compound eye infrared camera having a plurality of lenses for one imaging element is used.
- the compound eye infrared camera has the plurality of lenses for one imaging element, and can capture four temperature images of the fields of view 1 to 4 by the lenses by the one imaging element.
- the number of fields of view is an example and is not limited to this.
- optical paths leading to the imaging elements are different optical paths from different viewpoints, but the optical paths are not limited to this.
- an optical path may be divided from the same optical axis using a prism and guided to the plurality of imaging elements to obtain the plurality of temperature images having the same optical axis.
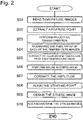
- Fig. 2 is a flowchart of the stress analysis method according to the first embodiment.
- the stress analysis method will be described below. Since details of the steps are substantially the same as those described for "imaging element”, “feature point extractor”, “projection transformer”, “pixel rearranger”, “background temperature subtractor”, “spline interpolator”, “amplitude corrector”, “starting point setter”, “stress converter”, and “additional averaging part”, duplicate description will be omitted here.
- Fig. 19 is a block diagram illustrating a configuration of a temperature measuring device 50 according to a second embodiment.
- the temperature measuring device 50 includes the imaging elements 20a to 20d that obtain two or more temperature images, the feature point extractor 35a that extracts the feature point in each of the temperature images, the projection transformer 35b that aligns the temperature images, the pixel rearranger 35c that rearranges the pixel array of the temperature images, a temperature image obtainer 35j that obtains the temperature images, and a temperature image additional averaging part 35k that obtains the additional averaging temperature image by adding and averaging the temperature images.
- the imaging elements 20a to 20d obtain two or more temperature images over the same time range for the same region of an object 1.
- the projection transformer 35b performs projective transformation on the temperature images so as to align the feature point in the temperature images, and aligns the temperature images with respect to the temperature image that is the reference.
- the pixel rearranger 35c rearranges the pixel array of the temperature images subjected to the projective transformation with respect to the pixel array of the temperature image that is the reference.
- the temperature image is obtained as it is without multiplying the temperature image by the stress conversion coefficient, and two or more temperature images are added and averaged to obtain the additional averaging temperature image.
- the noise generated from the imaging element is canceled by adding and averaging the temperature images, so that the temperature image with improved accuracy can be obtained.
- the imaging elements 20a to 20d, the feature point extractor 35a, the projection transformer 35b, the pixel rearranger 35c, the background temperature subtractor 35d, the spline interpolator 35e, the amplitude corrector 35f, and the starting point setter 35g are substantially the same as those in the first embodiment, description thereof will be omitted.
- the temperature image obtainer 35j obtains the temperature image as it is without multiplying the temperature image by the stress conversion coefficient.
- the temperature image additional averaging part 35k obtains the additional averaging temperature image by adding and averaging two or more temperature images.
- Fig. 20 is a flowchart of the temperature measuring method according to the second embodiment.
- the temperature measuring method will be described below. Since details of the steps are substantially the same as those described for "imaging element”, “feature point extractor”, “projection transformer”, “pixel rearranger”, “background temperature subtractor”, “spline interpolator”, “amplitude corrector”, “starting point setter”, “temperature image obtainer”, and “temperature image additional averaging part", the duplicate description will be omitted here. Further, since the following steps S11 to S18 are substantially the same as the steps S01 to S08 of the stress analysis method according to the first embodiment, a part of the description will be omitted.
- the temperature image with improved accuracy can be obtained.
- the stress image with improved accuracy can be obtained by adding and averaging the plurality of temperature images, that is, the plurality of stress images to calculate the additional averaging stress image.
Landscapes
- Physics & Mathematics (AREA)
- Engineering & Computer Science (AREA)
- General Physics & Mathematics (AREA)
- Theoretical Computer Science (AREA)
- Computer Vision & Pattern Recognition (AREA)
- Quality & Reliability (AREA)
- Life Sciences & Earth Sciences (AREA)
- Health & Medical Sciences (AREA)
- Chemical & Material Sciences (AREA)
- Analytical Chemistry (AREA)
- Biochemistry (AREA)
- General Health & Medical Sciences (AREA)
- Immunology (AREA)
- Pathology (AREA)
- Acoustics & Sound (AREA)
- Radiation Pyrometers (AREA)
- Investigating Or Analyzing Materials Using Thermal Means (AREA)
- Investigating Strength Of Materials By Application Of Mechanical Stress (AREA)
Abstract
Description
- The present disclosure relates to a stress analysis device using a plurality of temperature images.
- Various techniques have been proposed for performing stress analysis from the temperature images (see for example
WO2017/141294 ). In these stress analysis techniques, a stress image is obtained from the temperature image by using the fact that there is a linear relationship between temperature change of an object obtained from the temperature image and a stress applied to the object. - However, when a stress change is obtained from a general temperature image, the stress image with sufficient accuracy has not been obtained due to a noise generated from an imaging element.
- The present disclosure was conceived in view of the situations and it is therefore one non-limiting and exemplary embodiment provides a stress analysis device capable of obtaining a stress image with improved accuracy.
- In one general aspect, the techniques disclosed here feature: a stress analysis device according to the present disclosure includes:
- an imaging element that obtains two or more temperature images over a same time range for a same region of an object;
- a feature point extractor that extracts a feature point in each of the temperature images;
- a projection transformer that performs projective transformation on each of the temperature images so as to align the feature point in the temperature images, and aligns the temperature images with respect to a temperature image that is a reference;
- a pixel rearranger that rearranges a pixel array of each of the temperature images subjected to the projective transformation with respect to a pixel array of the temperature image that is the reference;
- a stress converter that obtains a stress image by multiplying each of the temperature images after pixel rearrangement by a stress conversion coefficient; and
- an additional averaging part that obtains an additional averaging stress image by adding and averaging the stress images.
- A stress analysis method according to the present disclosure includes:
- obtaining two or more temperature images over a same time range for a same region of an object;
- extracting a feature point in each of the temperature images;
- performing projective transformation on each of the temperature images so as to align the feature point in the temperature images, and aligning the temperature images with respect to a temperature image that is a reference;
- rearranging a pixel array of each of the temperature images subjected to the projective transformation with respect to a pixel array of the temperature image that is the reference;
- obtaining a stress image by multiplying each of the temperature images after pixel rearrangement by a stress conversion coefficient; and
- obtaining an additional averaging stress image by adding and averaging the stress images.
- A temperature measuring device according to the present disclosure includes:
- an imaging element that obtains two or more temperature images over a same time range for a same region of an object;
- a feature point extractor that extracts a feature point in each of the temperature images;
- a projection transformer that performs projective transformation on each of the temperature images so as to align the feature point in the temperature images, and aligns the temperature images with respect to a temperature image that is a reference;
- a pixel rearranger that rearranges a pixel array of each of the temperature images subjected to the projective transformation with respect to a pixel array of the temperature image that is the reference;
- a temperature image obtainer that obtains each of the temperature images after pixel rearrangement; and
- a temperature image additional averaging part that obtains an additional averaging temperature image by adding and averaging the temperature images.
- A temperature measuring method according to the present disclosure includes:
- obtaining two or more temperature images over a same time range for a same region of an object;
- extracting a feature point in each of the temperature images;
- performing projective transformation on each of the temperature images so as to align the feature point in the temperature images, and aligning the temperature images with respect to a temperature image that is a reference;
- rearranging a pixel array of each of the temperature images subjected to the projective transformation with respect to a pixel array of the temperature image that is the reference;
- obtaining each of the temperature images after pixel rearrangement; and
- obtaining an additional averaging temperature image by adding and averaging the temperature images.
- These general and specific aspects may be realized by any combination of systems, methods, computer programs, systems, methods, and computer programs.
- According to the stress analysis device according to the present disclosure, since a plurality of stress images are added and averaged to obtain an additional averaging stress image, a stress image with improved accuracy can be obtained.
-
-
Fig. 1 is a block diagram illustrating a configuration of a stress analysis device according to a first embodiment. -
Fig. 2 is a flowchart of a stress analysis method according to the first embodiment. -
Fig. 3 is a schematic view illustrating four temperature images of a field ofview 1 to a field ofview 4 by a compound eye camera used in a stress analysis device according to a modification. -
Fig. 4A is a schematic view illustrating feature points in the temperature image of the field ofview 1 among four fields ofview 1 to 4 of the stress analysis device according to the first embodiment. -
Fig. 4B is a schematic view illustrating feature points in the temperature image of the field ofview 2 among the four fields ofview 1 to 4 of the stress analysis device according to the first embodiment. -
Fig. 4C is a schematic view illustrating feature points in the temperature image of the field ofview 3 among the four fields ofview 1 to 4 of the stress analysis device according to the first embodiment. -
Fig. 4D is a schematic view illustrating feature points in the temperature image of the field ofview 4 among the four fields ofview 1 to 4 of the stress analysis device according to the first embodiment. -
Fig. 5A(a) is a schematic view illustrating a pixel array including the feature points of the temperature image of the field ofview 1, andFig. 5A(b) is a schematic view illustrating a pixel array including the feature points of the temperature image of the field ofview 2. -
Fig. 5B(a) is a schematic view illustrating a pixel array according to a coordinate system of the temperature image of the field ofview 1 that is a reference, andFig. 5B(b) is a schematic view illustrating a pixel array of the temperature image of the field ofview 2 after performing projective transformation on the temperature images of the field ofview 2 ofFig. 5A(b) to the coordinate system of the temperature image of the field ofview 1 so as to aligning the feature point. -
Fig. 6A(a) is a schematic view illustrating the pixel array according to the coordinate system of the temperature image of the field ofview 1 that is the reference, andFig. 6A(b) is a schematic view illustrating the pixel array of the temperature image of the field ofview 2 after performing projective transformation to the coordinate system of the temperature image of the field ofview 1. -
Fig. 6B(a) is a schematic view illustrating the pixel array of the temperature image of the field ofview 1 that is the reference, andFig. 6B(b) is a schematic view illustrating the pixel array of the temperature image of the field ofview 2 in which the pixel array of the temperature image of the field ofview 2 is rearranged to correspond to the pixel array of the temperature image of the field ofview 1. -
Fig. 7 is a schematic view illustrating that the pixel array of the field ofview 2 after the projective transformation is rearranged to the pixel array of the nearest field ofview 1. -
Fig. 8 is a schematic view illustrating data points before interpolation by sampling a temperature change of one pixel and data points after interpolation that interpolates between data points by sampling. -
Fig. 9 is a schematic view illustrating a state before and after amplitude correction of an amplitude of the temperature image with respect to frequency after Fourier transformation. -
Fig. 10 is a diagram illustrating an example of a frequency response function of a first-order lag system used for amplitude correction inFig. 9 . -
Fig. 11A is a diagram illustrating a time constant in the frequency response function of the first-order lag system for the temperature image of the field ofview 1 by a sinusoidal load experiment. -
Fig. 11B is a diagram illustrating the time constant in the frequency response function of the first-order lag system for the temperature image of the field ofview 2 by the sinusoidal load experiment. -
Fig. 11C is a diagram illustrating the time constant in the frequency response function of the first-order lag system for the temperature image of the field ofview 3 by the sinusoidal load experiment. -
Fig. 11D is a diagram illustrating the time constant in the frequency response function of the first-order lag system for the temperature image of the field ofview 4 by the sinusoidal load experiment. -
Fig. 12 is a diagram illustrating time changes of temperature of the same corresponding pixels in the fields of view after amplitude correction in a superimposed manner. -
Fig. 13 is a diagram illustrating the time changes of temperature of the same corresponding pixels in the fields of view after amplitude correction ofFig. 12 by aligning starting points and superimposing them. -
Fig. 14A is a diagram illustrating a stress conversion coefficient calculated as a reciprocal of an intercept for the temperature image of the field ofview 1 by the sinusoidal load experiment. -
Fig. 14B is a diagram illustrating the stress conversion coefficient calculated as the reciprocal of the intercept for the temperature image of the field ofview 2 by the sinusoidal load experiment. -
Fig. 14C is a diagram illustrating the stress conversion coefficient calculated as the reciprocal of the intercept for the temperature image of the field ofview 3 by the sinusoidal load experiment. -
Fig. 14D is a diagram illustrating the stress conversion coefficient calculated as the reciprocal of the intercept for the temperature image of the field ofview 4 by the sinusoidal load experiment. -
Fig. 15A is a diagram illustrating temperature data, which is the time change of the temperature of one pixel in the temperature image of one field of view, and load data, in a superimposed manner. -
Fig. 15B is a diagram illustrating temperature data, which is a temperature change of additional averaging of temperatures of the same corresponding pixels in temperature images of two fields of view, and the load data, in a superimposed manner. -
Fig. 15C is a diagram illustrating temperature data, which is a temperature change of additional averaging of temperatures of the same corresponding pixels in temperature images of three fields of view, and the load data, in a superimposed manner. -
Fig. 15D is a diagram illustrating temperature data, which is a temperature change of additional averaging of temperatures of the same corresponding pixels in temperature images of four fields of view, and the load data, in a superimposed manner. -
Fig. 16 is a diagram illustrating a relationship between the number of times of additional averaging for one pixel and a correlation coefficient between the temperature data and the load data. -
Fig. 17 is a diagram illustrating a relationship between the number of times of additional averaging for the one pixel and a root mean square error (RMSE) between the temperature data and the load data. -
Fig. 18A is a diagram illustrating the root mean square error (RMSE) between the temperature data and the load data when the additional averaging is once and four times in an X direction of the temperature image. -
Fig. 18B is a diagram illustrating the root mean square error (RMSE) between the temperature data and the load data when the additional averaging is once and four times in a Y direction of the temperature image. -
Fig. 19 is a block diagram illustrating a configuration of atemperature measuring device 50 according to a second embodiment. -
Fig. 20 is a flowchart of a temperature measuring method according to the second embodiment. - A stress analysis device according to a first aspect includes:
- an imaging element that obtains two or more temperature images over a same time range for a same region of an object;
- a feature point extractor that extracts a feature point in each of the temperature images;
- a projection transformer that performs projective transformation on each of the temperature images so as to align the feature point in the temperature images, and aligns the temperature images with respect to a temperature image that is a reference;
- a pixel rearranger that rearranges a pixel array of each of the temperature images subjected to the projective transformation with respect to a pixel array of the temperature image that is the reference;
- a stress converter that obtains a stress image by multiplying each of the temperature images after pixel rearrangement by a stress conversion coefficient; and
- an additional averaging part that obtains an additional averaging stress image by adding and averaging the stress images.
- Further, as a stress analysis device of a second aspect, in the first aspect, the stress analysis device further may include a background temperature subtractor that subtracts a background temperature from each of the temperature images after pixel rearrangement.
- Further, as a stress analysis device of a third aspect, in the first or second aspect, the stress analysis device further may include an amplitude corrector that corrects amplitudes of each of the temperature images after pixel rearrangement by dividing a relationship between a frequency and an amplitude after Fourier transformation by a frequency response function of a first-order lag system.
- Further, as a stress analysis device of a fourth aspect, in any one of the first to third aspects, the stress analysis device further may include a spline interpolator that performs spline interpolation over the same time range of each of the temperature images after pixel rearrangement.
- Further, as a stress analysis device of a fifth aspect, in any one of the first to fourth aspects, when obtaining the two or more temperature images, the imaging element may cause a synchronization signal to be included in the two or more temperature images, and
the stress analysis device further may include a starting point setter that aligns starting point for the temperature images after pixel rearrangement based on the synchronization signal. - A stress analysis method according to a sixth aspect includes:
- obtaining two or more temperature images over a same time range for a same region of an object;
- extracting a feature point in each of the temperature images;
- performing projective transformation on each of the temperature images so as to align the feature point in the temperature images, and aligning the temperature images with respect to a temperature image that is a reference;
- rearranging a pixel array of each of the temperature images subjected to the projective transformation with respect to a pixel array of the temperature image that is the reference;
- obtaining a stress image by multiplying each of the temperature images after pixel rearrangement by a stress conversion coefficient; and
- obtaining an additional averaging stress image by adding and averaging the stress images.
- A temperature measuring device according to a seventh aspect includes:
- an imaging element that obtains two or more temperature images over a same time range for a same region of an object;
- a feature point extractor that extracts a feature point in each of the temperature images;
- a projection transformer that performs projective transformation on each of the temperature images so as to align the feature point in the temperature images, and aligns the temperature images with respect to a temperature image that is a reference;
- a pixel rearranger that rearranges a pixel array of each of the temperature images subjected to the projective transformation with respect to a pixel array of the temperature image that is the reference;
- a temperature image obtainer that obtains each of the temperature images after pixel rearrangement; and
- a temperature image additional averaging part that obtains an additional averaging temperature image by adding and averaging the temperature images.
- A temperature measuring method according to an eighth aspect includes:
- obtaining two or more temperature images over a same time range for a same region of an object;
- extracting a feature point in each of the temperature images;
- performing projective transformation on each of the temperature images so as to align the feature point in the temperature images, and aligning the temperature images with respect to a temperature image that is a reference;
- rearranging a pixel array of each of the temperature images subjected to the projective transformation with respect to a pixel array of the temperature image that is the reference;
- obtaining each of the temperature images after pixel rearrangement; and
- obtaining an additional averaging temperature image by adding and averaging the temperature images.
- Hereinafter, the stress analysis device according to the embodiments will be described with reference to the attached drawings. In the drawings, substantially the same members are denoted by the same reference numerals.
-
Fig. 1 is a block diagram illustrating a configuration of astress analysis device 40 according to a first embodiment. - The
stress analysis device 40 includes imaging elements 20a to 20d that obtain two or more temperature images, a feature point extractor 35a that extracts a feature point in each of the temperature images, a projection transformer 35b that aligns the temperature images, a pixel rearranger 35c that rearranges the pixel array of each of the temperature images, a stress converter 35h that obtains a stress image by multiplying each of the temperature images by the stress conversion coefficient, and an additional averaging part 35i that obtains the additional averaging stress image by adding and averaging the stress images. The imaging elements 20a to 20d obtain two or more temperature images over the same time range for the same region of anobject 1. The projection transformer 35b performs projective transformation on each of the temperature images so as to align the feature point in the temperature images, and aligns the temperature images with respect to the temperature image that is the reference. The pixel rearranger 35c rearranges the pixel array of each of the temperature images subjected to the projective transformation with respect to the pixel array of the temperature image that is the reference. - According to the
stress analysis device 40, two or more stress images are added and averaged to obtain the additional averaging stress image. Thus, a noise generated from the imaging element is canceled by adding and averaging the stress images, and a stress image with improved accuracy can be obtained. - Members constituting the
stress analysis device 40 will be described below. - The
object 1 is a body for which stress is analyzed. Although theobject 1 is illustrated as an elongated test piece inFig. 1 , theobject 1 is not limited to this. For example, theobject 1 may be an architecture such as a bridge, a building, or a tower, or a movable body such as a vehicle, a ship, or an aircraft, and an infrared camera may move. - In
Fig. 1 , theobject 1 is supported by aload applying portion 10. A known sinusoidal load or a sinusoidal load having a plurality of frequencies may be applied to theobject 1 in combination by theload applying portion 10. In this case, the load applied from theload applying portion 10 to theobject 1 is known. Theload applying portion 10 is provided as needed, and is an optional component. The load applied to theobject 1 to be analyzed in the stress analysis device includes not only the above-mentioned known load but also an unknown load. - By applying a known load to the
object 1 by theload applying portion 10, it is possible to compare temperature data obtained by the temperature images with known load data. The time constant of the frequency response function of the first-order lag system is different for each imaging element, and the stress conversion coefficient is also different. Therefore, by applying a known sinusoidal load to the object by theload applying portion 10, the time constant and the stress conversion coefficient of the frequency response function of the imaging elements can be calculated. -
Fig. 1 illustrates four imaging elements 20a to 20d. InFig. 1 , the imaging elements 20a to 20d are illustrated as a combination of four infrared cameras respectively including lenses and the imaging elements. InFig. 1 , the four imaging elements 20a to 20d are arranged in two stages, and two in each stage, but the arrangement method is not limited to this. For example, four imaging elements 20a to 20d may be arranged side by side in a horizontal row. - The imaging elements 20a to 20d have a plurality of pixels, for example, 320 × 256 pixels, and captures four temperature images (
Figs. 4A to 4D ) of the fields ofview 1 to 4 for the same region of theobject 1 over the same time range. The temperature image is also called an infrared image. The image is captured at a predetermined frame rate, for example, 5 Hz to 3000 Hz (5 shots/sec to 3000 shots/sec). The above characteristics of the imaging elements 20a to 20d are merely examples, and are not limited thereto. - A case of four imaging elements is shown here, but is not limited to this. As long as two or more temperature images can be obtained, the number of imaging elements may be one or more as shown in a modification described below.
- An
image processor 30 performs image processing on a plurality of temperature images. Theimage processor 30 is, for example, a computer device. As the computer device, a general-purpose computer device can be used, and for example, as illustrated inFig. 1 , the computer device includes a processor 31, astorage 32, and adisplay 33. The computer device may further include an input device, a storage device, an interface, and the like. - The processor 31 is only required to be, for example, a central processing operator (CPU, MPU, or the like), a microcomputer, or a processing device capable of executing instructions that can be executed by a computer.
- The
storage 32 may be, for example, at least one of ROM, EEPROM, RAM, flash SSD, hard disk, USB memory, magnetic disk, optical disk, magnetooptical disk, and the like. - The
storage 32 includes aprogram 35. When theimage processor 30 is connected to a network, theprogram 35 may be downloaded from the network as needed. - The
program 35 includes the feature point extractor 35a, the projection transformer 35b, the pixel rearranger 35c, the stress converter 35h, and the additional averaging part 35i. They are read from thestorage 32 and executed by the processor 31 at the time of execution. - In addition to the above, as shown in
Fig. 1 , the program may include a background temperature subtractor 35d, a spline interpolator 35e, an amplitude corrector 35f, and astarting point setter 35g, but they are not essential but optional components. - The feature point extractor 35a extracts a feature point in each temperature image. In the temperature image, portions having different temperatures are represented by the difference in grayscale. On the other hand, portions having the same temperature are represented as the same temperature regardless of the shape and cannot be distinguished from each other. Therefore, a difference in shape or the like that can be a feature point in a normal image is not a noticeable difference in the temperature image, and is difficult to be used as the feature point. That is, in the temperature image, a portion that appears to be a different temperature can be the feature point. Therefore, for example, a pattern that partially changes the emissivity may be provided on a surface of the object. A portion in which a pattern having a different emissivity is provided even if the temperature is substantially the same as the surroundings can be recognized as an apparently different temperature in the temperature image and can be the feature point. When the surface of the
object 1 has an emissivity close to that of a black body, the pattern having a different emissivity may be formed, for example, by attaching an aluminum thin film having a low emissivity to a part of theobject 1. -
Fig. 4A is a schematic view illustrating the feature points in the temperature image of a field ofview 1 among four fields of view of 1 to 4.Fig. 4B is a schematic view illustrating the feature points in the temperature image of a field ofview 2 among the four fields of view of 1 to 4.Fig. 4C is a schematic view illustrating the feature points in the temperature image of a field ofview 3 among the four fields of view of 1 to 4.Fig. 4D is a schematic view illustrating the feature points in the temperature image of a field ofview 4 among the four fields of view of 1 to 4. -
Figs. 4A to 4D illustrate how the patterns having a different emissivity provided on the surface of theobject 1 are detected as the feature points having a difference in apparent temperature in the temperature images of the fields ofview 1 to 4. Specifically, a square pattern formed by four circles above and below the elongated object is detected as the feature point. In the temperature images of the fields of view, the square patterns above and below the object correspond to each other. - <Projection transformer>
- The projection transformer 35b performs projective transformation on the temperature images so as to align the feature point in the temperature images, and aligns the temperature images with respect to the temperature image that is the reference.
- First, a coefficient of the projective transformation for superimposing the temperature images of the fields of
view view 1 is calculated from the feature points. The equation of the projective transformation to convert from (x, y) to (x', y') is as follows.

- Note that fo is a constant, and hij is a coefficient. Here, f0 is set to 1, and the coefficient is calculated using the least square method.
- Using a normalization operator Z[ ] that sets a third component to 1, it is expressed as x' = Z[Hx].
- Here, x, x', and H are expressed as follows.

- The equation x'= Z [Hx] is equivalent to the following equation because it indicates that the vectors x' and Hx are parallel.

- Next, 9-dimensional vectors h, ξ(1), ξ(2), and ξ(3) are defined as follows.

- The following constraint equation is obtained from x' × Hx = 0.


- When N feature points (xα, yα) and corresponding feature points (x'α, y'α) (α = 1 to N) are given, ξ(1), ξ(2), ξ(3) are respectively ξα (1), ξα (2), and ξα (3).
- Therefore, the vector h is determined such that (ξ(1), h) to 0, (ξ(2), h) to 0, (ξ(3), h) to 0, (α = 1 to N).
- The sum of squares of the constraint equation is as follows.

- Where, M is expressed by the following equation.
- The vector h to be determined is a unit eigenvector for the minimum value of a matrix M that minimizes J.
-
Fig. 5A(a) is a schematic view illustrating a pixel array including the feature points of the temperature image of the field ofview 1, andFig. 5A(b) is a schematic view illustrating a pixel array including the feature points of the temperature image of the field ofview 2.Fig. 5B(a) is a schematic view illustrating a pixel array according to a coordinate system of the temperature image of the field ofview 1 that is a reference, andFig. 5B(b) is a schematic view illustrating a pixel array of the temperature image of the field ofview 2 after performing projective transformation on the temperature images of the field ofview 2 ofFig. 5A(b) to the coordinate system of the temperature image of the field ofview 1 so as to aligning the feature points. - Comparing the feature points of the temperature image of the field of
view 1 inFig. 5A(a) with the feature points of the temperature image of the field ofview 2 inFig. 5A(b) , it can be seen that the temperature image of the field ofview 2 is rotated clockwise by 45° with respect to the temperature image of the field ofview 1. Therefore, in order to align the corresponding feature points using the temperature image of the field ofview 1 as the reference, it is necessary to perform projective transformation of rotating the temperature image of the field ofview 2 counterclockwise by 45°. - The temperature image of the field of
view 2 inFig. 5B(b) is the schematic view illustrating the pixel array after performing projective transformation of rotating the temperature image of the field ofview 2 inFig. 5A(b) counterclockwise by 45°. Comparing the temperature image of the field ofview 1 inFig. 5B(a) with the temperature image of the field ofview 2 after the projective transformation inFig. 5B(b) , it can be seen that the feature points correspond to each other. - Thus, the temperature image of the field of
view 2 can be aligned with the temperature image of the field ofview 1 as the reference. -
Fig. 6A(a) is a schematic view illustrating the pixel array according to the coordinate system of the temperature image of the field ofview 1 that is the reference, andFig. 6A(b) is a schematic view illustrating the pixel array of the temperature image of the field ofview 2 after performing projective transformation to the coordinate system of the temperature image of the field ofview 1.Fig. 6B(a) is a schematic view illustrating the pixel array of the temperature image of the field ofview 1 that is the reference, andFig. 6B(b) is a schematic view illustrating the pixel array of the temperature image of the field ofview 2 in which the pixel array of the temperature image of the field ofview 2 is rearranged to correspond to the pixel array of the temperature image of the field ofview 1. In the figures, it is assumed that the pixels are respectively arranged in squares of 3 rows and 3 columns. - The pixel rearranger 35c rearranges the pixel array of each temperature image subjected to the projective transformation with respect to the pixel array of the temperature image that is the reference. Pixel rearrangement is also called resampling. For example, as illustrated in
Fig. 6A(b) , the pixel array of the temperature image of the field ofview 2 after the projective transformation may be rotated with respect to the pixel array of the temperature image of the field ofview 1. In this case, it may be unclear which pixel corresponds to each temperature image. Therefore, the pixel rearranger 35c rearranges the pixels so that a configuration of the pixel array of the temperature image of the field ofview 2 align with a configuration of the pixel array of the temperature image of the field ofview 1. - Specifically, comparing the pixel array of the temperature image of the field of
view 2 after the projective transformation inFig. 6A(b) and the pixel array of the temperature image of the field ofview 2 after pixel rearrangement inFig. 6B(b) , pixels of three feature points in the center of the pixel array of the field ofview 2 before the pixel rearrangement directly correspond to three vertical pixels in the center. On the other hand, pixels at corners on both sides before the pixel rearrangement respectively correspond to middle pixels on both sides after pixel rearrangement. Further, the pixels on the side adjacent to the corners on both sides before the pixel rearrangement correspond to the pixels on the corners on both sides after pixel rearrangement. - Thus, when comparing the pixel array of the field of
view 1 inFig. 6B(a) with the pixel array of the field ofview 2 inFig. 6B(b) , the pixel arrays of both have the same configuration, and the pixels corresponding to each other are clear. -
Fig. 7 is a schematic view illustrating that the pixel array of the field ofview 2 after the projective transformation is rearranged to the pixel array of the nearest field ofview 1. InFig. 7 , unlike the pixel array in which the pixels are arranged in the squares illustrated inFigs. 6A and 6B , the pixel array of the field ofview 1 and the pixel array of the field ofview 2 after the projective transformation are illustrated assuming that the pixels are at grid points. - In the case of
Fig. 6A , the pixel array of the field ofview 2 is an example of the pixel rearrangement when the pixel array of the field ofview 2 is rotated clockwise by 45° with respect to the pixel array of the field ofview 1, but the pixel rearrangement is not limited to this. That is, when the pixel arrays form an arbitrary angle with each other, as illustrated inFig. 7 , the pixels of the pixel array of the field ofview 2 are rearranged to the pixels of the pixel array of the nearest field ofview 1. Specifically, the pixels of the pixel array of the field ofview 2, which are nearest to the pixels of the pixel array of the field ofview 1, are rearranged as illustrated by arrows inFig. 7 . This method is called a "nearest neighbor method". Thus, the pixel array of the field ofview 2 has the same configuration as the pixel array of the field ofview 1. - Thus, even when the pixel arrays of the fields of view form an arbitrary angle with each other, the pixel array of the field of
view 2 can be rearranged to a pixel array similar to the pixel array of the field ofview 1. - Note that the pixel rearrangement method is not limited to the above-mentioned nearest neighbor method, and other methods may be used. Further, the pixel rearrangement is not an indispensable configuration, and may be provided as needed.
- The background temperature subtractor 35d subtracts the background temperature from each temperature image after pixel rearrangement. The background temperature may be, for example, a temperature of a background object or the like that is present around the object but is not related to the object and is not stressed. By subtracting the background temperature from the temperature image, a back noise generated by temperature change of the environment can be reduced. Especially when the temperature change is large, it is effective for noise reduction. The background object is not limited to a naturally present object, and may be, for example, a board installed in advance.
- In the case of the imaging element such as a cooling type imaging element in which temperature drift occurs, it is effective to reflect an object whose temperature change is considered to be constant in the temperature image as the object whose background temperature can be obtained.
- Note that the background temperature subtractor is not essential when it is not necessary to substantially consider a change in the background temperature.
- The spline interpolator 35e performs spline interpolation over the same time range of each temperature image after pixel rearrangement. The spline interpolation is performed by obtaining a polynomial approximation, for example, a cubic approximation, between data points so that each data point is smoothly connected to each pixel of each temperature image based on the data points before the interpolation by sampling. By performing the spline interpolation, it is possible to obtain the temperature change over continuous time between the data points of the temperature images. Thus, the frame rate varies for each imaging element, the sampling is performed at different timings, and even when the data points vary in the temperature images, the data points at the same timing can be calculated by the interpolation. The spline interpolation can be performed by a commonly employed method.
- For measurement data (x0, y0), (x1, y1), ... (xn, yn), an interpolated value y of x in an interval [xi, xi+1] (i = 0, 1, ..., n-1) is obtained by the following equation.


-
Fig. 8 is a schematic view illustrating the data points before the interpolation by sampling the temperature change of one pixel and the data points after the interpolation that interpolates between the data points by sampling. As illustrated inFig. 8 , after the interpolation, the interpolated data points are illustrated between the sampled data points as the data points at the same timing in each temperature image. - Note that it is not necessary to perform the spline interpolation when the sampling timing of each temperature image is substantially the same, or when the plurality of temperature images is obtained by the same imaging element as in the case of a compound eye infrared camera.
-
Fig. 9 is a schematic view illustrating a state before and after amplitude correction of the amplitude of the temperature image with respect to the frequency after Fourier transformation.Fig. 10 is a diagram illustrating an example of the frequency response function of the first-order lag system used for the amplitude correction inFig. 9 . - The amplitude corrector 35f corrects the amplitude of each temperature image after pixel rearrangement by dividing the relationship between the frequency and the amplitude after Fourier transformation by the frequency response function of the first-order lag system.
- The amplitude of the temperature change tends to be attenuated as the frequency increases. It is assumed that this attenuation tendency of the amplitude is represented by, for example, the first-order lag system. The frequency response function in this case is illustrated in
Fig. 10 and is expressed by the following equation. InFig. 10 , a frequency ω to be corrected is up to 10 Hz. This is because the higher the frequency, the larger an amount of correction, so that here an upper limit of a frequency range to be corrected is 10 Hz. In this case, the frequency is high even at 10 Hz. That is, since the frequency response function of the first-order lag system is smaller as the frequency is higher, the amplitude after correction is larger as the frequency is higher. If the frequency is the upper limit or more of the frequency to be corrected, since a value of the frequency response function is set to 1, the correction is not performed.
- Note that α is a time constant.
-
Fig. 11A is a diagram illustrating the time constant in the frequency response function of the first-order lag system for the temperature image of the field ofview 1 by a sinusoidal load experiment.Fig. 11B is a diagram illustrating the time constant in the frequency response function of the first-order lag system for the temperature image of the field ofview 2 by the sinusoidal load experiment.Fig. 11C is a diagram illustrating the time constant in the frequency response function of the first-order lag system for the temperature image of the field ofview 3 by the sinusoidal load experiment.Fig. 11D is a diagram illustrating the time constant in the frequency response function of the first-order lag system for the temperature image of the field ofview 4 by the sinusoidal load experiment. - As illustrated in
Figs. 11A to 11D , the temperature change obtained by applying a known sinusoidal load to theobject 1 is divided by the stress and fitted by the frequency response function of the first-order lag system, so that a time constant α can be obtained. The frequency response function of the first-order lag system of each field of view is calculated using the obtained time constant α, and for each temperature image, the relationship between the frequency and the amplitude after Fourier transformation can be divided by the calculated frequency response function of the first-order lag system to correct the amplitude. - Note that the upper limit of the frequency range to be corrected is not limited to 10 Hz.
- When the frequency characteristic of the imaging element is constant, the amplitude correction is not necessary.
- The
starting point setter 35g aligns the starting points of each temperature image after pixel rearrangement based on the synchronization signal included in each temperature image. By including the synchronization signal in each temperature image, the same time of each temperature image can be identified, and the starting points can be aligned. The synchronization signal is recorded as, for example, the temperature change at the same time in each temperature image by light emission of an LED lamp. By emitting light from the LED lamp, the temperature change at the same time in each temperature image can be used as the synchronization signal. - The synchronization signal is not limited to a record as the temperature change at the same time in each temperature image by the light emission of the LED lamp. For example, opening and closing of a shutter at the time of imaging of each imaging element may be used as the synchronization signal.
- Further, a method of aligning the starting points is not limited to a case of using the synchronization signal included in each temperature image described above. For example, a cross-correlation of the temperature images may be calculated to calculate the timing at which the amplitudes of the temperature images best match, and align the starting points.
-
Fig. 12 is a diagram illustrating time changes of temperature of the same corresponding pixels in the fields of view after amplitude correction in a superimposed manner.Fig. 13 is a diagram illustrating the time changes of temperature of the same corresponding pixels in the fields of view after amplitude correction ofFig. 12 by aligning the starting points and superimposing them. - In
Fig. 12 , since the starting points of the temperature images of the fields of view vary from each other, the temperature changes of the same period do not overlap for the fields of view. On the other hand, as illustrated inFig. 13 , by aligning the starting points of the temperature images of the fields of view, it can be seen that the temperature changes of the same period overlap with each other for the temperature images of the fields of view. - Note that it is not necessary to set the starting points when the starting points are aligned with each other in hardware, like the compound eye infrared camera.
- The stress converter 35h obtains the stress images by multiplying the temperature images after pixel rearrangement by the stress conversion coefficient. The stress converter 35h calculates a stress change amount Δδ from a temperature change amount ΔT by using, for example, the following equation (1) expressing thermoelastic effects.

- K is a thermoelastic coefficient, K = α/(CP), and T is an absolute temperature of the surface of the object. α is a linear expansion coefficient of the surface of the object, ρ is a density of the surface of the object, and CP is a specific heat of the surface of the object under constant stress.
- Then, the stress converter 35h can obtain the stress image based on the stress change amount of all pixels.
-
Fig. 14A is a diagram illustrating the stress conversion coefficient calculated as a reciprocal of an intercept for the temperature image of the field ofview 1 by the sinusoidal load experiment.Fig. 14B is a diagram illustrating the stress conversion coefficient calculated as the reciprocal of the intercept for the temperature image of the field ofview 2 by the sinusoidal load experiment.Fig. 14C is a diagram illustrating the stress conversion coefficient calculated as the reciprocal of the intercept for the temperature image of the field ofview 3 by the sinusoidal load experiment.Fig. 14D is a diagram illustrating the stress conversion coefficient calculated as the reciprocal of the intercept for the temperature image of the field ofview 4 by the sinusoidal load experiment. - Using the stress conversion coefficients illustrated in
Figs. 14Ato 14D , the stress images can be obtained for the time changes of the temperature images of the fields of view. - Note that this stress conversion is not limited to a case where it is performed at a timing after the starting point is set. For example, it may be performed after reading the temperature image. Further, it may be performed at any timing after background temperature subtraction, the spline interpolation, the amplitude correction, or additional averaging.
- The additional averaging part 35i obtains the additional averaging stress image by adding and averaging the stress images. The number of stress images to be added and averaged is two or more. Increasing the number of stress images will increase the accuracy, but if it is too many, it will take time for processing. Further, as the number of imaging elements increases, it is difficult to arrange them. Therefore, usually, for example, four stress images are added and averaged. At most 8 to 10 stress images are added and averaged.
-
Fig. 15A is a diagram illustrating the temperature data, which is the time change of the temperature of one pixel in the temperature image of one field of view, and the load data, in a superimposed manner.Fig. 15B is a diagram illustrating the temperature data, which is a temperature change of additional averaging of temperatures of the same corresponding pixels in the temperature images of two fields of view, and the load data, in a superimposed manner.Fig. 15C is a diagram illustrating the temperature data, which is a temperature change of additional averaging of temperatures of the same corresponding pixels in the temperature images of three fields of view, and the load data, in a superimposed manner.Fig. 15D is a diagram illustrating the temperature data, which is a temperature change of additional averaging of temperatures of the same corresponding pixels in the temperature images of four fields of view, and the load data, in a superimposed manner. InFigs. 15A to 15D , the load data applied to the object is known. Therefore, the accuracy of stress conversion from the temperature image to the stress image can be known by superimposing the temperature data obtained from the time change of the temperature image and the load data. That is, the more the temperature data is in line with the load data, the higher the accuracy of stress conversion. - Since the stress conversion from the "temperature data" to "stress data" is a linear conversion, a unit of "temperature data" is represented by "MPa" after the stress conversion in the figures.
- As illustrated in
Fig. 15A , the temperature data obtained from one temperature image has a large noise with respect to the load data, and the accuracy of the stress image is not sufficient. On the other hand, when comparingFig. 15B , which is additional averaging of the temperature data obtained from two temperature images,Fig. 15C , which is additional averaging of the temperature data obtained from three temperature images, andFig. 15D , which is additional averaging of the temperature data obtained from four temperature images, it can be seen that the temperature data approaches the load data as the number of times of additional averaging increases. By adding and averaging the plurality of temperature images, that is, a plurality of stress images to calculate the additional averaging stress image, the stress image with improved accuracy can be obtained. -
Fig. 16 is a diagram illustrating a relationship between the number of times of additional averaging for one pixel and a correlation coefficient between the temperature data and the load data.Fig. 17 is a diagram illustrating a relationship between the number of times of additional averaging for the one pixel and a root mean square error (RMSE) between the temperature data and the load data.Fig. 18A is a diagram illustrating the root mean square error (RMSE) between the temperature data and the load data when the additional averaging is once and four times in an X direction of the temperature image.Fig. 18B is a diagram illustrating the root mean square error (RMSE) between the temperature data and the load data when the additional averaging is once and four times in a Y direction of the temperature image. - As illustrated in
Fig. 16 , the correlation coefficient between the temperature data and the load data increases as the number of times of additional averaging increases. Further, as illustrated inFig. 17 , the root mean square error (RMSE) between the temperature data and the load data decreases as the number of times of additional averaging increases. Furthermore, as illustrated inFig. 18A , the root mean square error (RMSE) between the temperature data and the load data is smaller when the additional averaging is four times than when the additional averaging is once in the X direction of the temperature image. Similarly, as illustrated inFig. 18B , the root mean square error (RMSE) between the temperature data and the load data is smaller when the additional averaging is four times than when the additional averaging is once in the Y direction of the temperature image. - As described above, it can be seen that the stress image with improved accuracy can be obtained by calculating the additional averaging stress image by adding and averaging the plurality of temperature images, that is, the plurality of stress images.
- The
display 33 may display a captured temperature image, a graph of temperature change, an obtained stress image, the additional averaging stress image, and the like. -
Fig. 3 is a schematic view illustrating four temperature images of the field ofview 1 to the field ofview 4 by the compound eye infrared camera of the imaging element used in thestress analysis device 40 according to the modification. The modification differs in that the plurality of imaging elements are not used as illustrated inFig. 1 . That is, it is characterized in that the plurality of temperature images of the fields ofview 1 to 4 are captured in one imaging element. In the modification, the compound eye infrared camera having a plurality of lenses for one imaging element is used. As illustrated inFig. 3 , the compound eye infrared camera has the plurality of lenses for one imaging element, and can capture four temperature images of the fields ofview 1 to 4 by the lenses by the one imaging element. The number of fields of view is an example and is not limited to this. - Further, in
Fig. 1 , optical paths leading to the imaging elements are different optical paths from different viewpoints, but the optical paths are not limited to this. As another modification, for example, an optical path may be divided from the same optical axis using a prism and guided to the plurality of imaging elements to obtain the plurality of temperature images having the same optical axis. Thus, since the temperature images have the same optical axis and substantially the same pixel array, it is possible to reduce loads of feature point extraction, the projective transformation, and the pixel rearrangement, which will be described below. -
Fig. 2 is a flowchart of the stress analysis method according to the first embodiment. The stress analysis method will be described below. Since details of the steps are substantially the same as those described for "imaging element", "feature point extractor", "projection transformer", "pixel rearranger", "background temperature subtractor", "spline interpolator", "amplitude corrector", "starting point setter", "stress converter", and "additional averaging part", duplicate description will be omitted here. -
- (1) Read two or more temperature images over the same time range for the same region of the object 1 (S01). Specifically, read the two or more temperature images captured by the imaging elements 20a to 20d into the
image processor 30. - (2) Extract a feature point for each of the temperature images (S02). For example, an aluminum thin film having a low emissivity may be attached to a part of the
object 1 to form the pattern of the feature points. - (3) Perform projective transformation on each of the temperature images so as to align the feature point, and perform alignment with respect to the temperature image that is the reference (S03).
- (4) Rearrange the pixel array of each of the temperature images subjected to the projective transformation with respect to the pixel array of the temperature image that is the reference (S04). By rearranging the pixels of the pixel array of the field of
view 2 to the pixel array similar to the pixel array of the nearest field ofview 1, the pixel array of the field ofview 2 has the same configuration as the pixel array of the field ofview 1. - (5) Subtract the background temperature from each temperature image (S05). This makes it possible to reduce the back noise generated by the temperature change of the environment. Specifically, the background temperature is detected from the background object, and the background temperature is subtracted from the temperature image.
- (6) Perform spline interpolation over the same time range of the temperature images (S06). Thus, even when the frame rate is different for each imaging element, the sampling is performed at different timings, and the data point is different in each temperature image, the data points at the same timing can be calculated by interpolation.
- (7) For each temperature image, the relationship between the frequency and the amplitude after Fourier transformation is divided by the frequency response function of the first-order lag system to correct the amplitude (S07). For example, the amplitude is corrected by dividing by the frequency response function illustrated in
Fig. 10 . - (8) For the temperature images, align the starting point based on the synchronization signal included in advance (S08). The synchronization signal may be recorded as, for example, the temperature change at the same time in each temperature image by light emission of an LED lamp. Alternatively, the opening and closing of the shutter at the time of imaging of each imaging element may be used as the synchronization signal. Further, a method of aligning the starting points is not limited to a case of using the synchronization signal included in each temperature image described above. For example, the cross-correlation of the temperature images may be calculated to align the starting points.
- (9) The temperature images are multiplied by the stress conversion coefficient to obtain the stress image (S09). For example, the stress change amount Δδ is calculated from the temperature change amount ΔT using the equation ΔT = -KTΔδ expressing the thermoelastic effect. As described above, the stress conversion coefficient of each imaging element can be calculated based on the temperature image obtained by applying a known load.
- (10) Add and average the stress images to obtain the additional averaging stress image (S10). The number of stress images to be added and averaged is two or more. By adding and averaging the plurality of temperature images, that is, a plurality of stress images to calculate the additional averaging stress image, the stress image with improved accuracy can be obtained.
- From the above, the stress image with improved accuracy can be obtained.
-
Fig. 19 is a block diagram illustrating a configuration of atemperature measuring device 50 according to a second embodiment. - The
temperature measuring device 50 includes the imaging elements 20a to 20d that obtain two or more temperature images, the feature point extractor 35a that extracts the feature point in each of the temperature images, the projection transformer 35b that aligns the temperature images, the pixel rearranger 35c that rearranges the pixel array of the temperature images, a temperature image obtainer 35j that obtains the temperature images, and a temperature image additional averaging part 35k that obtains the additional averaging temperature image by adding and averaging the temperature images. The imaging elements 20a to 20d obtain two or more temperature images over the same time range for the same region of anobject 1. The projection transformer 35b performs projective transformation on the temperature images so as to align the feature point in the temperature images, and aligns the temperature images with respect to the temperature image that is the reference. The pixel rearranger 35c rearranges the pixel array of the temperature images subjected to the projective transformation with respect to the pixel array of the temperature image that is the reference. - According to the
temperature measuring device 50, comparing with the stress analysis device according to the first embodiment, the temperature image is obtained as it is without multiplying the temperature image by the stress conversion coefficient, and two or more temperature images are added and averaged to obtain the additional averaging temperature image. Thus, the noise generated from the imaging element is canceled by adding and averaging the temperature images, so that the temperature image with improved accuracy can be obtained. - Members constituting the
temperature measuring device 50 will be described below. - Since the imaging elements 20a to 20d, the feature point extractor 35a, the projection transformer 35b, the pixel rearranger 35c, the background temperature subtractor 35d, the spline interpolator 35e, the amplitude corrector 35f, and the
starting point setter 35g are substantially the same as those in the first embodiment, description thereof will be omitted. - The temperature image obtainer 35j obtains the temperature image as it is without multiplying the temperature image by the stress conversion coefficient.
- The temperature image additional averaging part 35k obtains the additional averaging temperature image by adding and averaging two or more temperature images.
-
Fig. 20 is a flowchart of the temperature measuring method according to the second embodiment. The temperature measuring method will be described below. Since details of the steps are substantially the same as those described for "imaging element", "feature point extractor", "projection transformer", "pixel rearranger", "background temperature subtractor", "spline interpolator", "amplitude corrector", "starting point setter", "temperature image obtainer", and "temperature image additional averaging part", the duplicate description will be omitted here. Further, since the following steps S11 to S18 are substantially the same as the steps S01 to S08 of the stress analysis method according to the first embodiment, a part of the description will be omitted. -
- (1) Read two or more temperature images over the same time range for the same region of the object 1 (S11).
- (2) Extract feature points for the temperature images (S12).
- (3) Perform projective transformation on each of the temperature images so as to align the feature point, and perform alignment with respect to the temperature image that is the reference (S13).
- (4) Rearrange the pixel array of each of the temperature images subjected to the projective transformation with respect to the pixel array of the temperature image that is the reference (S14).
- (5) Subtract the background temperature from each temperature image (S15). This makes it possible to reduce the back noise generated by the temperature change of the environment.
- (6) Perform spline interpolation over the same time range of the temperature images (S16). Thus, even when the frame rate is different for each imaging element, the sampling is performed at different timings, and the data point is different in each temperature image, the data points at the same timing can be calculated by interpolation.
- (7) For each temperature image, the relationship between the frequency and the amplitude after Fourier transformation is divided by the frequency response function of the first-order lag system to correct the amplitude (S17).
- (8) For the temperature images, align the starting point based on the synchronization signal included in advance (S18).
- (9) Obtain each of the temperature images (S19).
- (10) Add and average the temperature images to obtain the additional averaging temperature image (S20). The number of temperature images to be added and averaged is two or more.
- From the above, by adding and averaging the plurality of temperature images to calculate the additional averaging temperature image, the temperature image with improved accuracy can be obtained.
- It is to be noted that the present disclosure includes appropriately combining any of the embodiments and/or examples among the various embodiments and/or examples described above, and can obtain the effects of the embodiments and/or examples.
- According to the stress analysis device according to the present disclosure, the stress image with improved accuracy can be obtained by adding and averaging the plurality of temperature images, that is, the plurality of stress images to calculate the additional averaging stress image.
-
- 1
- OBJECT
- 10
- LOAD APPLYING PORTION
- 20a, 20b, 20c, 20d
- IMAGING ELEMENT
- 30
- IMAGE PROCESSOR (COMPUTER DEVICE)
- 31
- PROCESSOR
- 32
- STORAGE
- 33
- DISPLAY
- 35
- PROGRAM
- 35a
- FEATURE POINT EXTRACTOR
- 35b
- PROJECTION TRANSFORMER
- 35c
- PIXEL REARRANGER
- 35d
- BACKGROUND TEMPERATURE SUBTRACTOR
- 35e
- SPLINE INTERPOLATOR
- 35f
- AMPLITUDE CORRECTOR
- 35g
- STARTING POINT SETTER
- 35h
- STRESS CONVERTER
- 35i
- ADDITIONAL AVERAGING PART
- 35j
- TEMPERATURE IMAGE OBTAINER
- 35k
- TEMPERATURE IMAGE ADDITIONALAVERAGING PART
- 40
- STRESS ANALYSIS DEVICE
- 50
- TEMPERATURE MEASURING DEVICE
Claims (8)
- A stress analysis device comprising:an imaging element that obtains two or more temperature images over a same time range for a same region of an object;a feature point extractor that extracts a feature point in each of the temperature images;a projection transformer that performs projective transformation on each of the temperature images so as to align the feature point in the temperature images, and aligns the temperature images with respect to a temperature image that is a reference;a pixel rearranger that rearranges a pixel array of each of the temperature images subjected to the projective transformation with respect to a pixel array of the temperature image that is the reference;a stress converter that obtains a stress image by multiplying each of the temperature images after pixel rearrangement by a stress conversion coefficient; andan additional averaging part that obtains an additional averaging stress image by adding and averaging the stress images.
- The stress analysis device according to claim 1, further comprising a background temperature subtractor that subtracts a background temperature from each of the temperature images after pixel rearrangement.
- The stress analysis device according to claim 1 or 2, further comprising an amplitude corrector that corrects amplitude of each of the temperature images after pixel rearrangement by dividing a relationship between a frequency and an amplitude after Fourier transformation by a frequency response function of a first-order lag system.
- The stress analysis device according to any one of claims 1 to 3, further comprising a spline interpolator that performs spline interpolation over the same time range of each of the temperature images after pixel rearrangement.
- The stress analysis device according to any one of claims 1 to 4, whereinwhen obtaining the two or more temperature images, the imaging element causes a synchronization signal to be included in the two or more temperature images, andthe stress analysis device further comprises a starting point setter that aligns starting point for the temperature images after pixel rearrangement based on the synchronization signal.
- A stress analysis method comprising:obtaining two or more temperature images over a same time range for a same region of an object;extracting a feature point in each of the temperature images;performing projective transformation on each of the temperature images so as to align the feature point in the temperature images, and aligning the temperature images with respect to a temperature image that is a reference;rearranging a pixel array of each of the temperature images subjected to the projective transformation with respect to a pixel array of the temperature image that is the reference;obtaining a stress image by multiplying each of the temperature images after pixel rearrangement by a stress conversion coefficient; andobtaining an additional averaging stress image by adding and averaging the stress images.
- A temperature measuring device comprising:an imaging element that obtains two or more temperature images over a same time range for a same region of an object;a feature point extractor that extracts a feature point in each of the temperature images;a projection transformer that performs projective transformation on each of the temperature images so as to align the feature point in the temperature images, and aligns the temperature images with respect to a temperature image that is a reference;a pixel rearranger that rearranges a pixel array of each of the temperature images subjected to the projective transformation with respect to a pixel array of the temperature image that is the reference;a temperature image obtainer that obtains each of the temperature images after pixel rearrangement; anda temperature image additional averaging part that obtains an additional averaging temperature image by adding and averaging the temperature images.
- A temperature measuring method comprising:obtaining two or more temperature images over a same time range for a same region of an object;extracting a feature point in each of the temperature images;performing projective transformation on each of the temperature images so as to align the feature point in the temperature images, and aligning the temperature images with respect to a temperature image that is a reference;rearranging a pixel array of each of the temperature images subjected to the projective transformation with respect to a pixel array of the temperature image that is the reference;obtaining each of the temperature images after pixel rearrangement; andobtaining an additional averaging temperature image by adding and averaging the temperature images.
Applications Claiming Priority (2)
| Application Number | Priority Date | Filing Date | Title |
|---|---|---|---|
| JP2019158453 | 2019-08-30 | ||
| PCT/JP2020/027271 WO2021039160A1 (en) | 2019-08-30 | 2020-07-13 | Stress analysis device |
Publications (2)
| Publication Number | Publication Date |
|---|---|
| EP4006532A1 true EP4006532A1 (en) | 2022-06-01 |
| EP4006532A4 EP4006532A4 (en) | 2023-02-01 |
Family
ID=74684010
Family Applications (1)
| Application Number | Title | Priority Date | Filing Date |
|---|---|---|---|
| EP20856201.7A Ceased EP4006532A4 (en) | 2019-08-30 | 2020-07-13 | DEVICE FOR VOLTAGE ANALYSIS |
Country Status (5)
| Country | Link |
|---|---|
| US (1) | US12073549B2 (en) |
| EP (1) | EP4006532A4 (en) |
| JP (1) | JP7209398B2 (en) |
| CN (1) | CN114303168A (en) |
| WO (1) | WO2021039160A1 (en) |
Families Citing this family (3)
| Publication number | Priority date | Publication date | Assignee | Title |
|---|---|---|---|---|
| WO2021039160A1 (en) * | 2019-08-30 | 2021-03-04 | パナソニックIpマネジメント株式会社 | Stress analysis device |
| DE102020205031A1 (en) * | 2020-04-21 | 2021-10-21 | Deckel Maho Seebach Gmbh | Machine tool control and method for map-based error compensation on a machine tool |
| WO2025121107A1 (en) * | 2023-12-06 | 2025-06-12 | パナソニックIpマネジメント株式会社 | Imaging system and image alignment method |
Family Cites Families (28)
| Publication number | Priority date | Publication date | Assignee | Title |
|---|---|---|---|---|
| JP2001041832A (en) * | 1999-07-30 | 2001-02-16 | Jeol Ltd | Stress distribution image measurement method |
| JP2002366953A (en) | 2001-06-11 | 2002-12-20 | Central Res Inst Of Electric Power Ind | Image extraction method and apparatus, image extraction program, method and apparatus for detecting abnormalities of pole equipment on distribution pole using image extracting method, and abnormality detection program |
| JP4610955B2 (en) * | 2004-07-15 | 2011-01-12 | ▲隆▼英 阪上 | Method and apparatus for measuring thermal influence due to plastic deformation |
| CN100383502C (en) * | 2004-12-17 | 2008-04-23 | 华中科技大学 | Analysis Method of Historical Trend of Infrared Sequence Images |
| JP4595733B2 (en) * | 2005-08-02 | 2010-12-08 | カシオ計算機株式会社 | Image processing device |
| JP5000895B2 (en) * | 2006-02-01 | 2012-08-15 | 株式会社コンステック | Position correction method in infrared thermoelastic stress measurement |
| JP5281495B2 (en) * | 2009-06-18 | 2013-09-04 | キヤノン株式会社 | Image processing apparatus and method |
| US8265885B2 (en) * | 2011-06-24 | 2012-09-11 | General Electric Company | System and method for determining lifetime of wind turbine blade |
| KR20130020421A (en) * | 2011-08-19 | 2013-02-27 | 삼성전자주식회사 | Method and system for monitoring temperature of treatment site using ultrasound, system for treatment and diagnosis using ultrasound |
| JP2013130541A (en) * | 2011-12-22 | 2013-07-04 | Tohto C-Tech Corp | Bonding inspection device |
| CN103268596B (en) * | 2013-05-30 | 2017-04-05 | 华南理工大学 | A kind of method for reducing picture noise and making color be near the mark |
| JP6261994B2 (en) * | 2014-01-28 | 2018-01-17 | 三菱重工業株式会社 | Image correction method, inspection method and inspection apparatus using the same |
| JP6248706B2 (en) * | 2014-03-03 | 2017-12-20 | 株式会社ジェイテクト | Stress distribution measuring apparatus and stress distribution measuring method |
| JP6347675B2 (en) * | 2014-06-06 | 2018-06-27 | キヤノン株式会社 | Image processing apparatus, imaging apparatus, image processing method, imaging method, and program |
| CN104236457A (en) * | 2014-09-09 | 2014-12-24 | 中国电子科技集团公司第三十八研究所 | Digital speckle measuring device using infrared sources as speckle target and measuring method |
| CN105205818A (en) * | 2015-09-18 | 2015-12-30 | 国网上海市电力公司 | Method for registering infrared image and visible light image of electrical equipment |
| CN105547834B (en) * | 2016-01-13 | 2018-06-29 | 南京航空航天大学 | The measuring method of quick stress-strain diagram measuring system based on binocular vision |
| WO2017141294A1 (en) | 2016-02-15 | 2017-08-24 | パナソニックIpマネジメント株式会社 | Stress distribution measurement method and stress distribution measurement system |
| JP6034524B1 (en) * | 2016-04-08 | 2016-11-30 | Jfeテクノリサーチ株式会社 | Resonance frequency estimation method |
| US10297034B2 (en) * | 2016-09-30 | 2019-05-21 | Qualcomm Incorporated | Systems and methods for fusing images |
| JP6574989B2 (en) * | 2017-04-26 | 2019-09-18 | パナソニックIpマネジメント株式会社 | Stress measuring apparatus, stress measuring system and stress measuring method |
| CN207081508U (en) * | 2017-08-31 | 2018-03-09 | 北京蓝海华业科技股份有限公司 | A kind of system for detecting transmission line of electricity stress state |
| CN107689029A (en) * | 2017-09-01 | 2018-02-13 | 努比亚技术有限公司 | Image processing method, mobile terminal and computer-readable recording medium |
| JP7306408B2 (en) * | 2018-11-05 | 2023-07-11 | ソニーグループ株式会社 | Temperature estimation device, temperature estimation method and temperature estimation program |
| CN109886878B (en) * | 2019-03-20 | 2020-11-03 | 中南大学 | Infrared image splicing method based on coarse-to-fine registration |
| CN110057399B (en) * | 2019-03-28 | 2021-05-11 | 东南大学 | Temperature field and displacement field synchronous measurement system and measurement method based on 3D-DIC |
| WO2021039160A1 (en) * | 2019-08-30 | 2021-03-04 | パナソニックIpマネジメント株式会社 | Stress analysis device |
| KR102292547B1 (en) * | 2020-04-10 | 2021-08-20 | 코그넥스코오포레이션 | Optic system using dynamic diffuser |
-
2020
- 2020-07-13 WO PCT/JP2020/027271 patent/WO2021039160A1/en not_active Ceased
- 2020-07-13 JP JP2021542608A patent/JP7209398B2/en active Active
- 2020-07-13 EP EP20856201.7A patent/EP4006532A4/en not_active Ceased
- 2020-07-13 CN CN202080059646.0A patent/CN114303168A/en active Pending
-
2022
- 2022-02-24 US US17/679,298 patent/US12073549B2/en active Active
Also Published As
| Publication number | Publication date |
|---|---|
| JP7209398B2 (en) | 2023-01-20 |
| EP4006532A4 (en) | 2023-02-01 |
| WO2021039160A1 (en) | 2021-03-04 |
| US20220180502A1 (en) | 2022-06-09 |
| CN114303168A (en) | 2022-04-08 |
| JPWO2021039160A1 (en) | 2021-03-04 |
| US12073549B2 (en) | 2024-08-27 |
Similar Documents
| Publication | Publication Date | Title |
|---|---|---|
| US12073549B2 (en) | Stress analysis device | |
| US8036491B2 (en) | Apparatus and method for aligning images by detecting features | |
| Tzannes et al. | Measurement of the modulation transfer function of infrared cameras | |
| US8203116B2 (en) | Scene based non-uniformity correction for infrared detector arrays | |
| US6961481B2 (en) | Method and apparatus for image processing using sub-pixel differencing | |
| US8736737B2 (en) | Image processing apparatus, image processing method, and storage medium | |
| US20100321510A1 (en) | Image processing apparatus and method thereof | |
| US10429271B2 (en) | Camera testing using reverse projection | |
| JP2008500529A (en) | Method for characterizing a digital imaging system | |
| US10521883B1 (en) | Image turbulence correction using tile approach | |
| US9224212B2 (en) | Image processing apparatus and image processing method | |
| US20150042849A1 (en) | Image capturing apparatus and method of controlling the same | |
| US20200228698A1 (en) | Image processing device, image capturing device, control method of image processing device, control method of image capturing device, and storage medium | |
| AU2020245706B2 (en) | Method and system to detect orbiting objects | |
| JP7306408B2 (en) | Temperature estimation device, temperature estimation method and temperature estimation program | |
| US8520950B2 (en) | Image processing device, image processing method, program, and integrated circuit | |
| US20100238305A1 (en) | Apparatus for the evaluation of polynomials | |
| Kolodziejczak et al. | Flagging and correction of pattern noise in the Kepler focal plane array | |
| JP5053889B2 (en) | Image collation device, personal authentication device, corresponding point search device, corresponding point search method, and corresponding point search program | |
| KR101938067B1 (en) | Method and Apparatus for Stereo Matching of Wide-Angle Images using SIFT Flow | |
| KR101737426B1 (en) | Correction of radiometric artefacts in imagery acquired from satellite or aircraft platforms using the minimum noise fraction transform | |
| US9292907B2 (en) | Image processing apparatus and image processing method | |
| JP5465001B2 (en) | Target estimation device | |
| KR20240125181A (en) | Apparatus and method for performing image registration on a pluarality of images | |
| Fanning et al. | IR system field performance with superresolution |
Legal Events
| Date | Code | Title | Description |
|---|---|---|---|
| STAA | Information on the status of an ep patent application or granted ep patent |
Free format text: STATUS: THE INTERNATIONAL PUBLICATION HAS BEEN MADE |
|
| PUAI | Public reference made under article 153(3) epc to a published international application that has entered the european phase |
Free format text: ORIGINAL CODE: 0009012 |
|
| STAA | Information on the status of an ep patent application or granted ep patent |
Free format text: STATUS: REQUEST FOR EXAMINATION WAS MADE |
|
| 17P | Request for examination filed |
Effective date: 20220224 |
|
| AK | Designated contracting states |
Kind code of ref document: A1 Designated state(s): AL AT BE BG CH CY CZ DE DK EE ES FI FR GB GR HR HU IE IS IT LI LT LU LV MC MK MT NL NO PL PT RO RS SE SI SK SM TR |
|
| DAV | Request for validation of the european patent (deleted) | ||
| DAX | Request for extension of the european patent (deleted) | ||
| A4 | Supplementary search report drawn up and despatched |
Effective date: 20230105 |
|
| RIC1 | Information provided on ipc code assigned before grant |
Ipc: G06T 7/00 20170101ALI20221223BHEP Ipc: G06T 5/50 20060101ALI20221223BHEP Ipc: G06T 5/00 20060101ALI20221223BHEP Ipc: G01J 5/48 20220101ALI20221223BHEP Ipc: G01N 3/32 20060101ALI20221223BHEP Ipc: G01N 25/20 20060101AFI20221223BHEP |
|
| STAA | Information on the status of an ep patent application or granted ep patent |
Free format text: STATUS: EXAMINATION IS IN PROGRESS |
|
| 17Q | First examination report despatched |
Effective date: 20231031 |
|
| REG | Reference to a national code |
Ref country code: DE Ref legal event code: R003 |
|
| STAA | Information on the status of an ep patent application or granted ep patent |
Free format text: STATUS: THE APPLICATION HAS BEEN REFUSED |
|
| 18R | Application refused |
Effective date: 20241115 |