EP4116432A1 - Analyse parallèle multiplexée enrichie en cible pour l'évaluation d'échantillons d'adn f tal - Google Patents
Analyse parallèle multiplexée enrichie en cible pour l'évaluation d'échantillons d'adn f tal Download PDFInfo
- Publication number
- EP4116432A1 EP4116432A1 EP22171474.4A EP22171474A EP4116432A1 EP 4116432 A1 EP4116432 A1 EP 4116432A1 EP 22171474 A EP22171474 A EP 22171474A EP 4116432 A1 EP4116432 A1 EP 4116432A1
- Authority
- EP
- European Patent Office
- Prior art keywords
- tacs
- chr2
- chr1
- chr3
- chr4
- Prior art date
- Legal status (The legal status is an assumption and is not a legal conclusion. Google has not performed a legal analysis and makes no representation as to the accuracy of the status listed.)
- Granted
Links
Images


Classifications
-
- C—CHEMISTRY; METALLURGY
- C12—BIOCHEMISTRY; BEER; SPIRITS; WINE; VINEGAR; MICROBIOLOGY; ENZYMOLOGY; MUTATION OR GENETIC ENGINEERING
- C12Q—MEASURING OR TESTING PROCESSES INVOLVING ENZYMES, NUCLEIC ACIDS OR MICROORGANISMS; COMPOSITIONS OR TEST PAPERS THEREFOR; PROCESSES OF PREPARING SUCH COMPOSITIONS; CONDITION-RESPONSIVE CONTROL IN MICROBIOLOGICAL OR ENZYMOLOGICAL PROCESSES
- C12Q1/00—Measuring or testing processes involving enzymes, nucleic acids or microorganisms; Compositions therefor; Processes of preparing such compositions
- C12Q1/68—Measuring or testing processes involving enzymes, nucleic acids or microorganisms; Compositions therefor; Processes of preparing such compositions involving nucleic acids
- C12Q1/6876—Nucleic acid products used in the analysis of nucleic acids, e.g. primers or probes
- C12Q1/6883—Nucleic acid products used in the analysis of nucleic acids, e.g. primers or probes for diseases caused by alterations of genetic material
-
- C—CHEMISTRY; METALLURGY
- C12—BIOCHEMISTRY; BEER; SPIRITS; WINE; VINEGAR; MICROBIOLOGY; ENZYMOLOGY; MUTATION OR GENETIC ENGINEERING
- C12Q—MEASURING OR TESTING PROCESSES INVOLVING ENZYMES, NUCLEIC ACIDS OR MICROORGANISMS; COMPOSITIONS OR TEST PAPERS THEREFOR; PROCESSES OF PREPARING SUCH COMPOSITIONS; CONDITION-RESPONSIVE CONTROL IN MICROBIOLOGICAL OR ENZYMOLOGICAL PROCESSES
- C12Q1/00—Measuring or testing processes involving enzymes, nucleic acids or microorganisms; Compositions therefor; Processes of preparing such compositions
- C12Q1/68—Measuring or testing processes involving enzymes, nucleic acids or microorganisms; Compositions therefor; Processes of preparing such compositions involving nucleic acids
- C12Q1/6806—Preparing nucleic acids for analysis, e.g. for polymerase chain reaction [PCR] assay
-
- C—CHEMISTRY; METALLURGY
- C12—BIOCHEMISTRY; BEER; SPIRITS; WINE; VINEGAR; MICROBIOLOGY; ENZYMOLOGY; MUTATION OR GENETIC ENGINEERING
- C12Q—MEASURING OR TESTING PROCESSES INVOLVING ENZYMES, NUCLEIC ACIDS OR MICROORGANISMS; COMPOSITIONS OR TEST PAPERS THEREFOR; PROCESSES OF PREPARING SUCH COMPOSITIONS; CONDITION-RESPONSIVE CONTROL IN MICROBIOLOGICAL OR ENZYMOLOGICAL PROCESSES
- C12Q1/00—Measuring or testing processes involving enzymes, nucleic acids or microorganisms; Compositions therefor; Processes of preparing such compositions
- C12Q1/68—Measuring or testing processes involving enzymes, nucleic acids or microorganisms; Compositions therefor; Processes of preparing such compositions involving nucleic acids
- C12Q1/6876—Nucleic acid products used in the analysis of nucleic acids, e.g. primers or probes
- C12Q1/6883—Nucleic acid products used in the analysis of nucleic acids, e.g. primers or probes for diseases caused by alterations of genetic material
- C12Q1/6886—Nucleic acid products used in the analysis of nucleic acids, e.g. primers or probes for diseases caused by alterations of genetic material for cancer
-
- C—CHEMISTRY; METALLURGY
- C12—BIOCHEMISTRY; BEER; SPIRITS; WINE; VINEGAR; MICROBIOLOGY; ENZYMOLOGY; MUTATION OR GENETIC ENGINEERING
- C12Q—MEASURING OR TESTING PROCESSES INVOLVING ENZYMES, NUCLEIC ACIDS OR MICROORGANISMS; COMPOSITIONS OR TEST PAPERS THEREFOR; PROCESSES OF PREPARING SUCH COMPOSITIONS; CONDITION-RESPONSIVE CONTROL IN MICROBIOLOGICAL OR ENZYMOLOGICAL PROCESSES
- C12Q2600/00—Oligonucleotides characterized by their use
- C12Q2600/156—Polymorphic or mutational markers
Definitions
- the invention is in the field of biology, medicine and chemistry, more in particular in the field of molecular biology and more in particular in the field of molecular diagnostics.
- TACS TArget Capture Sequences
- Such targeted approaches require significantly less sequencing than the MPSS approaches, since sequencing is only performed on specific loci on the target sequence of interest rather than across the whole genome.
- Additional methodologies for NGS-based approaches are still needed, in particular approaches that can target specific sequences of interest, thereby greatly reducing the amount of sequencing needed as compared to whole genome-based approaches, as well as increasing the read-depth of regions of interest, thus enabling detection of low signal to noise ratio regions.
- additional methodologies are still needed that allow for genetic aberrations present in diminutive amounts in a sample can be reliably detected.
- additional methodologies are still needed that allow for analysis of DNA samples that contain predominantly fetal or embryonic DNA, since such samples contain only diminutive amounts of fetal or embryonic DNA.
- This invention provides improved methods for enriching targeted genomic regions of interest to be analyzed by multiplexed parallel sequencing, wherein the DNA sample used in the method contains predominantly or only fetal/embryonic DNA. Accordingly, the methods allow for analysis of very small starting amounts of fetal or embryonic DNA.
- the methods of the disclosure can be used in the analysis of fetal or embryonic DNA samples, e.g., for the presence of genetic abnormalities, for example for purposes of IVF Pre-implantation Genetic Screening (PGS) and Diagnosis (PGD).
- PPS Pre-implantation Genetic Screening
- PTD Diagnosis
- the methods of the invention utilize a pool of TArget Capture Sequences (TACS) designed such that the sequences within the pool have features that optimize the efficiency, specificity and accuracy of genetic assessment.
- TACS TArget Capture Sequences
- the pool of TACS comprises member sequences whose binding encompasses all chromosomes within the human genome (chromosomes 1-22, X and Y), thereby allowing for evaluation of the entire human genome in a single fetal/embryonic DNA sample.
- the invention pertains to a method of testing for risk of a genetic abnormality in a DNA sample comprising predominantly fetal or embryonic DNA and comprising genomic sequences of interest, the method comprising:
- the DNA sample is from, for example, a pre-implantation embryo, intact trophoblasts collected from a maternal Papanicolaou smear or a fetal cell found in maternal plasma.
- the DNA sample is obtained directly from fetal or embryonic tissue.
- the DNA sample is obtained directly from fetal tissue, or amniotic fluid, or chorionic villi, or medium where products of conception were grown.
- the pool of TACS comprises members that bind to chromosomes 1-22, X and Y of the human genome. In one embodiment, each member sequence within the pool of TACS is at least 160 base pairs in length. In certain embodiments, the GC content of the pool of TACS is between 19% and 80% or is between 19% and 46%. Alternative % ranges for the GC content of the pool of TACS are described herein.
- the pool of TACS comprises a plurality of TACS families, wherein each member of a TACS family binds to the same target sequence of interest but with different start and/or stop positions on the sequence with respect to a reference coordinate system (i.e., binding of TACS family members to the target sequence is staggered) to thereby enrich for target sequences of interest, followed by massive parallel sequencing and statistical analysis of the enriched population.
- the pool of TACS comprises a plurality of TACS families directed to different genomic sequences of interest, wherein each TACS family comprises a plurality of member sequences, wherein each member sequence binds to the same genomic sequence of interest but has different start and/or stop positions with respect to a reference coordinate system for the genomic sequence of interest.
- each TACS family comprises at least 3 member sequences or at least 5 member sequences. Alternative numbers of member sequences in each TACS family are described herein.
- the pool of TACS comprises at least 50 different TACS families. Alternative numbers of different TACS families within the pool of TACS are described herein.
- the start and/or stop positions for the member sequences within a TACS family, with respect to a reference coordinate system for the genomic sequence of interest are staggered by at least 3 base pairs or by at least 10 base pairs. Alternative lengths (sizes) for the number of base pairs within the stagger are described herein.
- the genomic abnormality is a chromosomal aneuploidy.
- the genomic abnormality is a structural abnormality, including but not limited to copy number changes including microdeletions and microduplications, insertions, deletions, translocations, inversions and small-size mutations including point mutations and mutational signatures.
- the pool of TACS is fixed to a solid support.
- the TACS are biotinylated and are bound to streptavidin-coated magnetic beads.
- amplification of the enriched library is performed in the presence of blocking sequences that inhibit amplification of wild-type sequences.
- members of the sequencing library that bind to the pool of TACS are partially complementary to the TACS.
- the statistical analysis comprises a segmentation algorithm, for example, likelihood-based segmentation, segmentation using small overlapping windows, segmentation using parallel pairwise testing, and combinations thereof.
- the statistical analysis comprises a score-based classification system.
- sequencing of the enriched library provides a read-depth for the genomic sequences of interest and read-depths for reference loci and the statistical analysis comprises applying an algorithm that tests sequentially the read-depth of the loci of from the genomic sequences of interest against the read-depth of the reference loci, the algorithm comprising steps for: (a) removal of inadequately sequenced loci; (b) GC-content bias alleviation; and (c) ploidy status determination.
- GC-content bias is alleviated by grouping together loci of matching GC content.
- sequencing of the enriched library provides the number and size of sequenced fragments for TACS-specific coordinates and the statistical analysis comprises applying an algorithm that tests sequentially the fragment-size proportion for the genomic sequence of interest against the fragment-size proportion of the reference loci, the algorithm comprising steps for: (a) removal of fragment-size outliers; (b) fragment-size proportion calculation; and (c) ploidy status determination.
- the invention pertains to a method of testing for risk of a genetic abnormality in a DNA sample comprising predominantly fetal or embryonic DNA and comprising genomic sequences of interest, the method comprising:
- kits for performing the methods of the invention are also encompassed.
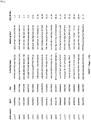
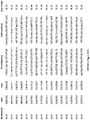
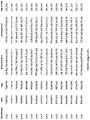
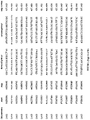
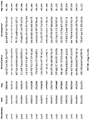
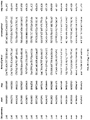
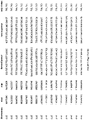
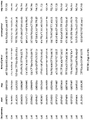
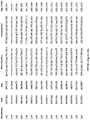
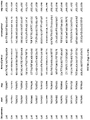
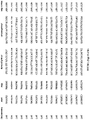
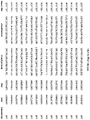
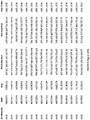
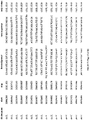
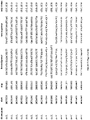
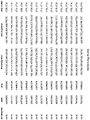
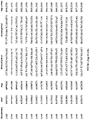
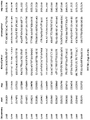
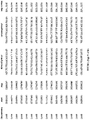
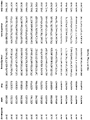
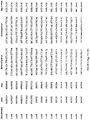
- Table 1 shows exemplary and preferred TACS positions. The corresponding sequences are depicted in the sequence protocol.
- Ch. Start Stop GC content Ch. Start Stop GC content chr1 1321966 1322216 0,348 chr10 9058150 9058400 0,3 chr1 2223227 2223477 0,348 chr10 9876196 9876446 0,348 chr1 3047692 3047942 0,348 chr10 10677282 10677532 0,348 chr1 4134402 4134652 0,348 chr10 11492282 11492532 0,348 chr1 5007713 5007963 0,348 chr10 12401604 12401854 0,348 chr1 5865510 5865760 0,348 chr10 13224650 13224900 0,348 chr1 6714342 6714592 0,348 chr10 14043964 14044214 0,348 chr1 7651255 7651505 0,
- the invention pertains to a method for analyzing genetic abnormalities that involves hybridization-based enrichment of selected target regions across the human genome in a multiplexed panel assay, followed by quantification, coupled with a novel bioinformatics and mathematical analysis pipeline. An overview of the method is shown schematically in Figure 1 .
- the target sequences (referred to as TArget Capture Sequences, or TACS) used to enrich for specific regions of interest have been optimized for maximum efficiency, specificity and accuracy and, furthermore, allow for analysis of very small starting amounts of fetal or embryonic DNA in samples containing only or predominantly fetal or embryonic DNA.
- the TACS used in the methods are families of TACS, comprising a plurality of members that bind to the same genomic sequence but with differing start and/or stop positions, such that enrichment of the genomic sequences of interest is significantly improved compared to use of a single TACS binding to the genomic sequence.
- the configuration of such families of TACS is illustrated schematically in Figure 3 , showing that the different start and/or stop positions of the members of the TACS family when bound to the genomic sequence of interest results in a staggered binding pattern for the family members.
- the methods and kits of the disclosure are used in the analysis of fetal or embryonic DNA samples, e.g., for the presence of genetic abnormalities, for example for purposes of IVF Pre-implantation Genetic Screening (PGS) and Diagnosis (PGD).
- the DNA sample comprises predominantly or only fetal or embryonic DNA.
- the methods can be used with samples from a single or only a few fetal or embryonic cells.
- a few fetal or embryonic cells refers to 10 fetal or embryonic cells or less.
- the methods allow for analysis of very small amounts of fetal or embryonic DNA.
- the fetal or embryonic DNA sample contains predominantly or only fetal/embryonic DNA, described further below in the subsection on sample preparation. An exemplification of use of the method with samples from 3-day and 5-day biopsy embryos is described in Example 6.
- the invention pertains to a method of testing for risk of a genetic abnormality in a DNA sample comprising predominantly fetal or embryonic DNA and comprising genomic sequences of interest, the method comprising:
- the pool of TACS comprises a plurality of TACS families, wherein each member of a TACS family binds to the same target sequence of interest but with different start and/or stop positions on the sequence with respect to a reference coordinate system (i.e., binding of TACS family members to the target sequence is staggered) to thereby enrich for target sequences of interest, followed by massive parallel sequencing and statistical analysis of the enriched population.
- the pool of TACS comprises a plurality of TACS families directed to different genomic sequences of interest, wherein each TACS family comprises a plurality of member sequences, wherein each member sequence binds to the same genomic sequence of interest but has different start and/or stop positions with respect to a reference coordinate system for the genomic sequence of interest.
- the invention pertains to a method of testing for risk of a genetic abnormality in a DNA sample comprising predominantly fetal or embryonic DNA and comprising genomic sequences of interest, the method comprising:
- the TACS-enrichment based method of the disclosure can be used in the detection of a wide variety of genetic abnormalities.
- the genetic abnormality is a chromosomal aneuploidy (such as a trisomy, a partial trisomy or a monosomy).
- the genomic abnormality is a structural abnormality, including but not limited to copy number changes including microdeletions and microduplications, insertions, translocations, inversions and small-size mutations including point mutations and mutational signatures.
- the genetic abnormality is a chromosomal mosaicism.
- TACS Target Capture Sequences
- TACS a genomic sequence(s) of interest
- a genomic sequence(s) of interest e.g., chromosome(s) of interest
- bait a genomic sequence of interest
- a pool of TACS is used for enrichment wherein the sequences within the pool have been optimized with regard to: (i) the length of the sequences; (ii) the distribution of the TACS across the region(s) of interest; and (iii) the GC content of the TACS.
- the number of sequences within the TACS pool (pool size) has also been optimized.
- each sequence within the pool of TACS is between 150-260 base pairs, 100-200 base pairs, 200-260 base pairs, 100-350 bp in length, or 100-500 bp in length.
- the length of the TACS within the pool is at least 250 base pairs, or is 250 base pairs or is 260 base pairs or is 280 base pairs.
- TACS size typically can be used without altering the results (e.g., the addition or deletion of a few base pairs on either end of the TACS); accordingly, the base pair lengths given herein are to be considered “about” or “approximate”, allowing for some slight variation (e.g., 1-5%) in length.
- a length of "250 base pairs” is intended to refer to "about 250 base pairs” or “approximately 250 base pairs", such that, for example, 248 or 252 base pairs is also encompassed.
- each sequence within the TACS pool is designed such that the 5' end and the 3' end are each at least 50 base pairs away from regions in the genome that are known to harbour one or more of the following genomic elements: Copy Number Variations (CNVs), Segmental duplications and/or repetitive DNA elements (such as transposable elements or tandem repeat areas).
- CNVs Copy Number Variations
- Segmental duplications and/or repetitive DNA elements (such as transposable elements or tandem repeat areas).
- each sequence within the TACS pool is designed such that the 5' end and the 3' end are each at least 50, 100, 150, 200, 250, 300, 400 or 500 base pairs away from regions in the genome that are known to harbour one or more of the aforementioned elements.
- Copy Number Variations is a term of art that refers to a form of structural variation in the human genome in which there can be alterations in the DNA of the genome in different individuals that can result in a fewer or greater than normal number of a section(s) of the genome in certain individuals.
- CNVs correspond to relatively large regions of the genome that may be deleted (e.g., a section that normally is A-B-C-D can be A-B-D) or may be duplicated (e.g., a section that normally is A-B-C-D can be A-B-C-C-D).
- CNVs account for roughly 13% of the human genome, with each variation ranging in size from about 1 kilobase to several megabases in size.
- Segmental duplications are also a term of art that refers to blocks of DNA that range from about 1 to 400 kilobases in length that occur at more than one site within the genome and typically share a high level (greater than 90%) of sequence identity. Segmental duplications are reviewed in, for example, Eichler. E.E. (2001) Trends Genet. 17:661-669 .
- petitive DNA elements also known as “repeat DNA” or “repeated DNA” is also a term of art that refers to patterns of DNA that occur in multiple copies throughout the genome.
- the term “repetitive DNA element” encompasses terminal repeats, tandem repeats and interspersed repeats, including transposable elements. Repetitive DNA elements in NGS is discussed further in, for example, Todd, J. et al. (2012) Nature Reviews Genet. 13:36-46 .
- the TACS are designed with specific GC content characteristics in order to minimize data GC bias and to allow a custom and innovative data analysis pipeline. It has been determined that TACS with a GC content of 19-80% achieve optimal enrichment and perform best with cell free fetal DNA.
- the % GC content of each sequence is chosen as between 19-80%, as determined by calculating the GC content of each member within the pool of TACS or within each family of TACS. That is, every member within the pool or within each family of TACS in the pool has a % GC content within the given percentage range (e.g., between 19-80% GC content).
- the pool of TACS (e.g., each member within each family of TACS) may be chosen so as to define a different % GC content range, deemed to be more suitable for the assessment of specific genetic abnormalities.
- % GC content ranges can be between 19% and 80%, or between 19% and 79%, or between 19% and 78%, or between 19% and 77%, or between 19% and 76%, or between 19% and 75%, or between 19% and 74%, or between 19% and 73%, or between 19% and 72%, or between 19% and 71%, or between 19% and 70%, or between 19% and 69%, or between 19% and 68%, or between 19% and 67%, or between 19% and 66%, or between 19% and 65%, or between 19% and 64%, or between 19% and 63%, or between 19% and 62%, or between 19% and 61%, or between 19% and 60%, or between 19% and 59%, or between 19% and 58%, or between
- test loci and reference loci can then be "matched" or grouped together according to their % GC content (e.g., test loci with a % GC content of 40% is matched with reference loci with a % GC content of 40%). It is appreciated that the % GC content matching procedure may allow slight variation in the allowed matched % GC range.
- a test locus with % GC content of 40% could be matched with reference loci of % GC ranging from 39-41%, thereby encompassing the test locus % GC within a suitable range.
- both manual and computerized analysis methods known in the art can be applied to the analysis of the human reference genome.
- a semi-automatic method is implemented where regions are firstly manually designed based on the human reference genome build 19 (hg19) ensuring that the aforementioned repetitive regions are avoided and subsequently are curated for GC-content using software that computes the % GC-content of each region based on its coordinates on the human reference genome build 19 (hg19).
- custom-built software is used to analyze the human reference genome in order to identify suitable TACS regions that fulfill certain criteria, such as but not limited to, % GC content, proximity to repetitive regions and/or proximity to other TACS.
- the number of TACS in the pool has been carefully examined and adjusted to achieve the best balance between result robustness and assay cost/throughput.
- the pool typically contains at least 800 or more TACS, but can include more, such as 1500 or more TACS, 2000 or more TACS or 2500 or more TACS or 3500 or more TACS or 5000 or more TACS. It has been found that an optimal number of TACS in the pool is 5000. It will be appreciated by the ordinarily skilled artisan that a slight variation in pool size typically can be used without altering the results (e.g., the addition or removal of a small number of TACS); accordingly, the number sizes of the pool given herein are to be considered “about” or “approximate", allowing for some slight variation (e.g., 1-5%) in size. Thus, for example, a pool size of "1600 sequences" is intended to refer to "about 1600 sequences" or “approximately 1600 sequences", such that, for example, 1590 or 1610 sequences is also encompassed.
- the invention provides a method for preparing a pool of TACS for use in the method of the invention for detecting risk of a chromosomal and/or other genetic abnormality, wherein the method for preparing the pool of TACS comprises: selecting regions in one or more chromosomes of interest having the criteria set forth above (e.g., at least 50 base pairs away on either end from the aforementioned repetitive sequences and a GC content of between 19% and 80%, as determined by calculating the GC content of each member within each family of TACS), preparing primers that amplify sequences that hybridize to the selected regions, and amplifying the sequences, wherein each sequence is 100-500 base pairs in length.
- the criteria set forth above e.g., at least 50 base pairs away on either end from the aforementioned repetitive sequences and a GC content of between 19% and 80%, as determined by calculating the GC content of each member within each family of TACS
- primers that amplify sequences that hybridize to the selected regions, and
- the pool of TACS typically is fixed to a solid support, such as beads (such as magnetic beads) or a column.
- the pool of TACS are labeled with biotin and are bound to magnetic beads coated with a biotin-binding substance, such as streptavidin or avidin, to thereby fix the pool of TACS to a solid support.
- a biotin-binding substance such as streptavidin or avidin
- Other suitable binding systems for fixing the pool of TACS to a solid support are known to the skilled artisan and readily available in the art.
- sequences that bind to the TACS affixed to the beads can be separated magnetically from those sequences that do not bind to the TACS.
- the pool of TACS comprises a plurality of TACS families directed to different genomic sequences of interest.
- Each TACS family comprises a plurality of members that bind to the same genomic sequence of interest but having different start and/or stop positions with respect to a reference coordinate system for the genomic sequence of interest.
- the reference coordinate system that is used for analyzing human genomic DNA is the human reference genome built hg19, which is publically available in the art, but other coordinate systems may also be used.
- the reference coordinate system can be an artificially created genome based on built hg19 that contains only the genomic sequences of interest. Exemplary non-limiting examples of start/stop positions for TACS that bind to chromosome 13, 18, 21, X or Y are shown in Figure 2 .
- Each TACS family comprises at least 2 members that bind to the same genomic sequence of interest.
- each TACS family comprises at least 2 member sequences, or at least 3 member sequences, or at least 4 member sequences, or at least 5 member sequences, or at least 6 member sequences, or at least 7 member sequences, or at least 8 member sequence, or at least 9 member sequences, or at least 10 member sequences.
- each TACS family comprises 2 member sequences, or 3 member sequences, or 4 member sequences, or 5 member sequences, or 6 member sequences, or 7 member sequences, or 8 member sequences, or 9 member sequences, or 10 member sequences.
- the plurality of TACS families comprises different families having different numbers of member sequences.
- a pool of TACS can comprise one TACS family that comprises 3 member sequences, another TACS family that comprises 4 member sequences, and yet another TACS family that comprises 5 member sequences, and the like.
- a TACS family comprises 3-5 member sequences.
- the TACS family comprises 4 member sequences.
- the pool of TACS comprises a plurality of TACS families.
- a pool of TACS comprises at least 2 TACS families.
- a pool of TACS comprises at least 3 different TACS families, or at least 5 different TACS families, or at least 10 different TACS families, or at least 50 different TACS families, or at least 100 different TACS families, or at least 500 different TACS families, or at least 1000 different TACS families, or at least 2000 TACS families, or at least 4000 TACS families, or at least 5000 TACS families.
- each member within a family of TACS binds to the same genomic region of interest but with different start and/or stop positions, with respect to a reference coordinate system for the genomic sequence of interest, such that the binding pattern of the members of the TACS family is staggered (see Figure 3 ).
- the start and/or stop positions are staggered by at least 3 base pairs, or at least 4 base pairs, or at least 5 base pairs, or at least 6 base pairs, or at least 7 base pairs, or at least 8 base pairs, or at least 9 base pairs, or at least 10 base pairs, or at least 15 base pairs, or at least 20 base pairs, or at least 25 base pairs.
- the start and/or stop positions are staggered by 5-10 base pairs. In one embodiment, the start and/or stop positions are staggered by 5 base pairs. In another embodiment, the start and/or stop positions are staggered by 10 base pairs.
- fetal or embryonic DNA is one that contains more than 50% fetal or embryonic DNA, and typically contains more than 90%, or 95% or 99% fetal or embryonic DNA.
- the source of the sample that contains predominantly fetal or embryonic DNA is fetal or embryonic cells obtained from embryo biopsy of in vitro fertilized (IVF) pre-implantation embryos. It has been demonstrated that intact cells can be obtained from IVF pre-implantation embryos for Pre-implantation Genetic Screening (PGS) and Pre-implantation Genetic Diagnosis (PGD) processes.
- IVF in vitro fertilized
- An ovum is fertilized through IVF and resulting cells are collected during in vitro growth of the embryo.
- cells can be collected from a day 3 embryo or a day 5 embryo.
- aCGH array Comparative Genomic Hybridization
- the source of the sample that contains predominantly fetal or embryonic DNA is fetal or embryonic cells obtained non-invasively from collecting intact cells (trophoblasts) from a maternal Papanicolaou smear (pap test). Recently it has been shown that this is a simple and safe approach for obtaining fetal or embryonic genetic material non-invasively and that the cells obtained from the pap test had an abundance (near 100%) of fetal or embryonic genetic material ( Jain, C.V. et al. (2016) Science Translational Medicine 8(363):363re4-363re4 ).
- the source of the sample that contains predominantly fetal or embryonic DNA is one or a few fetal or embryonic cells found in maternal plasma.
- one or a few fetal or embryonic cells present in maternal plasma can be isolated and DNA from the one or a few cells can be used as the DNA sample in the methods of the invention.
- the sample containing predominantly fetal or embryonic DNA is a DNA sample that is obtained directly from fetal tissue, or from amniotic fluid, or from chorionic villi or from medium where products of conception were grown.
- the DNA sample that contains predominantly fetal or embryonic DNA is obtained directly from fetal or embryonic tissue.
- the cell free DNA of the sample is used for sequencing library construction to make the sample compatible with a downstream sequencing technology, such as Next Generation Sequencing. Typically this involves ligation of adapters onto the ends of the cell free DNA fragments, followed by amplification. Sequencing library preparation kits are commercially available. A non-limiting exemplary protocol for sequencing library preparation is described in detail in Example 1.
- the region(s) of interest on the chromosome(s) of interest is enriched by hybridizing the pool of TACS to the sequencing library, followed by isolation of those sequences within the sequencing library that bind to the TACS.
- enriched sequences typically the TACS sequences are modified in such a way that sequences that hybridize to the TACS can be separated from sequences that do not hybridize to the TACS. Typically, this is achieved by fixing the TACS to a solid support. This allows for physical separation of those sequences that bind the TACS from those sequences that do not bind the TACS.
- each sequence within the pool of TACS can be labeled with biotin and the pool can then be bound to beads coated with a biotin-binding substance, such as streptavidin or avidin.
- the TACS are labeled with biotin and bound to streptavidin-coated magnetic beads.
- affinity binding systems are known in the art and can be used instead of biotin-streptavidin/avidin.
- an antibody-based system can be used in which the TACS are labeled with an antigen and then bound to antibody-coated beads.
- the TACS can incorporate on one end a sequence tag and can be bound to a solid support via a complementary sequence on the solid support that hybridizes to the sequence tag.
- a sequence tag can be bound to a solid support via a complementary sequence on the solid support that hybridizes to the sequence tag.
- other types of solid supports can be used, such as polymer beads and the like.
- the members of the sequencing library that bind to the pool of TACS are fully complementary to the TACS. In other embodiments, the members of the sequencing library that bind to the pool of TACS are partially complementary to the TACS. For example, in certain circumstances it may be desirable to utilize and analyze data that are from DNA fragments that are products of the enrichment process but that do not necessarily belong to the genomic regions of interest (i.e., such DNA fragments could bind to the TACS because of part homologies (partial complementarity) with the TACS and when sequenced would produce very low coverage throughout the genome in non-TACS coordinates).
- the members of the enriched library are eluted from the solid support and are amplified and sequenced using standard methods known in the art.
- Next Generation Sequencing is typically used, although other sequencing technologies can also be employed, which provides very accurate counting in addition to sequence information.
- NGS is a type of technology that enables very accurate counting. Accordingly, for the detection of genetic abnormalities, such as but not limited to, aneuploidies or structural copy number changes, other accurate counting methods, such as digital PCR and microarrays can also be used instead of NGS.
- Non-limiting exemplary protocols for amplification and sequencing of the enriched library are described in detail in Example 3.
- the information obtained from the sequencing of the enriched library can be analyzed using an innovative biomathematical/biostatistical data analysis pipeline. Details of an exemplary analysis using this pipeline are described in depth in Example 4, and in further detail below. Alternative data analysis approaches for different purposes are also provided herein. For example, data analysis approaches for analyzing fetal and/or embryonic DNA samples for genetic abnormalities are described in detail in Example 6.
- the analysis pipeline described in Example 4 exploits the characteristics of the TACS, and the high-efficiency of the target capture enables efficient detection of aneuploidies or structural copy number changes, as well as other types of genetic abnormalities.
- the sample's sequenced DNA fragments are aligned to the human reference genome.
- QC metrics are used to inspect the aligned sample's properties and decide whether the sample is suitable to undergo classification.
- These QC metrics can include, but are not limited to, analysis of the enrichment patterns of the loci of interest, such as for example the overall sequencing depth of the sample, the on-target sequencing output of the sample, TACS performance, GC bias expectation, fraction of interest quantification.
- an innovative algorithm For determining the risk of a chromosomal abnormality in the fetal DNA of the sample, an innovative algorithm is applied.
- the steps of the algorithm include, but are not limited to, removal of inadequately sequenced loci, read-depth and fragment-size information extraction at TACS-specific coordinates, genetic (GC-content) bias alleviation and ploidy status classification.
- Ploidy status determination is achieved using one or more statistical methods, non-limiting examples of which include a t-test method, a bootstrap method, a permutation test and/or a binomial test of proportions and/or segmentation-based methods and/or combinations thereof.
- a t-test method a bootstrap method
- a permutation test and/or a binomial test of proportions and/or segmentation-based methods and/or combinations thereof.
- the selection and application of tests to be included in ploidy status determination is based on the number of data points available. As such, the suitability of each test is determined by various factors such as, but not limited to, the number of TACS utilized and the respective application for GC bias alleviation, if applicable.
- the aforementioned methods are to be taken as examples of the types of statistical analysis that may be employed and are not the only methods suitable for the determination of ploidy status.
- the statistical method results in a score value for the mixed sample and risk of the chromosomal abnormality
- one aspect of the statistical analysis involves quantifying and alleviating GC-content bias.
- the sequencing process itself introduces certain biases that can obscure signal detection.
- One such bias is the preferential sequencing/amplification of genetic regions based on their GC-content.
- certain detection methods such as but not limited to, read-depth based methods, need to account for such bias when examining sequencing data.
- the bias in the data needs to be quantified and, subsequently, suitable methods are applied to account for it such that genetic context dependencies cannot affect any statistical methods that may be used to quantify fetal genetic abnormality risk.
- one method of quantifying the GC-content bias is to use a locally weighted scatterplot smoothing (LOESS) technique on the sequencing data.
- LOESS locally weighted scatterplot smoothing
- Each targeted locus may be defined by its sequencing read-depth output and its' GC-content.
- a line of best fit through these two variables, for a large set of loci provides an estimate of the expected sequencing read-depth given the GC-content.
- the next step is to use this information to account for possible biases in the data.
- One method is to normalize the read-depth of all loci by their expected read-depth (based on each locus' GC-content). In principle, this unlinks the read-depth data from their genetic context and makes all data comparable.
- the statistical analysis of the enriched library sequences comprises alleviating GC bias using a LOESS procedure.
- the GC-content bias is quantified and alleviated by grouping together loci of similar (matching) GC-content.
- this method for alleviating GC-content bias comprises of three steps, as follows:
- the dataset is split into two groups; the test loci and the reference loci.
- subsets of groups are created where loci are categorized according to their GC-content as illustrated in a non-limiting example in the sample Table 1 below:
- subgroup creation may involve encompassing a range of appropriate GC-content and/or a subset of loci that are defined by a given GC-content and/or GC-content range.
- the % GC content given in the non-limiting example of Table 1 are to be considered “about” or “approximate", allowing for some slight variation (e.g., 1-2%).
- a % GC content of "40%” is intended to refer to "about 40%” or “approximately 40%", such that, for example, "39%-41%" GC-content loci may also be encompassed if deemed appropriate.
- the reference and test loci subgroups may comprise of any number of loci related to a particular % GC content and/or range.
- a representative read-depth is calculated.
- a number of methods may be utilized to choose this such as, but not limited to, the mean, median or mode of each set.
- two vectors of representative read-depth are created where one corresponds to the reference loci and the other to the test loci (e.g., Xm, Ym).
- the two vectors may be tested against each other to identify significant differences in read-depth.
- the difference of the two vectors may be used to assess if there are significant discrepancies between the test and reference loci. The sample is attributed the score of the test.
- the dataset is split into two groups, the test loci and the reference loci.
- the GC-content of each locus is then calculated.
- the following procedure is performed: A random locus is selected from the reference loci; its read-depth and GC-content are recorded.
- a random locus from the test loci is selected, with the only condition being that its' GC-content is similar to that of the reference locus. Its read-depth is recorded. It is appreciated by the ordinarily skilled artisan that GC-content similarity may encompass a range of suitable GC-content.
- referral to a specific % GC content may be considered as "approximate” or “proximal” or “within a suitable range” (e.g., 1%-2%) encompassing the specific % GC content under investigation.
- a reference-test locus pair of similar GC-content is created.
- the difference of the reference-test pair is recorded, say E1.
- the loci are then replaced to their respective groups. This process is repeated until a bootstrap sample of the same size as the number of test TACS present is created.
- a representative read-depth of the bootstrap sample is estimated, say E_mu, and recorded.
- a number of methods may be utilized to do so, such as but not limited to, the mean, mode or median value of the vector, and/or multiples thereof.
- the dataset is sorted firstly into two groups, the test-loci and the reference loci.
- groups For each group, subsets of groups are created, where loci are categorized according to their GC-content similarity (see columns 2 and 3 of the non-limiting sample Table 2 below).
- the number of loci present in each test subgroup is also recorded.
- the loci of the test group are utilized to calculate an estimate of the test-group's read-depth, say Yobs.
- a representative number from each GC-content subgroup may be selected to do so. Any number of methods may be used to provide a read-depth estimate, such as but not limited to, the mean, median or mode of the chosen loci.
- Table 2 GC Reference loci read- Test loci read-depth test loci Merging of loci 40% x 1 40 , x 2 40 , ... , x nx 40 40 y 1 40 , y 2 40 , ... , y ny 40 40 ny40 x 1 40 ,.. , x nx 40 40 , y 1 40 , ... , y ny 40 40 41% x 1 41 , x 2 41 , ... , x nx 41 41 y 1 41 , y 2 41 , ... , y ny 41 41 ny41 x 1 41 ,.. , x nx 41 41 , y 1 41 ,...
- y ny 41 41 42% x 1 42 , x 2 42 , ... , x nx 42 42 y 1 42 , y 2 42 , ... , y ny 42 42 ny42 x 1 42 ,.. , x nx 42 42 , y 1 42 ,.. , y ny 42 42 ... ... ... ... ... ...
- a distribution to test Yobs is then built utilizing loci irrespective of their test or reference status as follows.
- the test and reference loci of each GC-content subgroup (see last column of sample Table 2) are combined to allow for calculation of a new read-depth estimate. From each merged subgroup a number of loci are chosen at random, where this number is upper-bounded by the number of test-loci utilized in the original calculation of Yobs (e.g., for GC content 40%, and in the context of the non-limiting sample Table 2, this number of loci may be in the range [1,ny40]).
- the new read-depth estimate is calculated from all the chosen loci. The procedure is iterated as many times as necessary in order to build a distribution of observed means.
- a sample is then attributed a score that corresponds to the position of Yobs in this distribution using a suitable transformation that accounts for the moments of the built distribution.
- % GC content e.g., 1%-2%
- reference to a specific GC-content could be taken as "about” or “approximate”, so that for example when referring to a 40% GC-content, loci that are "approximately” or “about” 40% (e.g., 39%-41%) may be utilized in the method.
- fragment-sizes aligned to TACS-specific genomic coordinates are used. It has been shown that fragments of cell free genetic material originating from the placenta tend to be smaller in length when compared to other cell free genetic material ( Chan, K.C. (2004) Clin. Chem. 50:88-92 ). Hence, the statistic of interest is whether the proportion of small-size fragments aligned to a TACS-specific test-region deviates significantly from what is expected when comparing it to the respective proportion of other TACS-specific reference-regions, as this would indicate fetal genetic abnormalities.
- fragment-sizes are assigned into two groups. Sizes related to the test loci are assigned to one group and fragment-sizes related to the reference loci are assigned to the other group. Subsequently, in each group, fragment sizes are distributed into two subgroups, whereby small-size fragments are assigned into one subgroup and all remaining fragments are designated to the remaining subgroup. The last step computes the proportion of small-sized fragments in each group and uses these quantities in a binomial test of proportions. The score of the test is attributed to the sample under investigation.
- the final result of a sample may be given by combining one or more scores derived from the different statistical methods, non-limiting examples of which are given in Example 4.
- the read-depth and sequence composition of non-overlapping genomic regions of interest of fixed-size is obtained.
- GC-content read-depth bias alleviation may be performed, but is not limited to, using a local polynomial fitting method in order to estimate the expected read-depth of regions based on their GC content.
- the expected value, dependent on GC-content is then used to normalize regions using suitable methods known to those skilled in the art.
- the normalized dataset is subsequently processed using one or more segmentation-based classification routines. To do so the algorithms process consecutive data points to detect the presence of read-depth deviations which manifest in the form of a "jump/drop" from their surrounding data points.
- data points are given a score which is used towards assigning membership into segments of similar performing read-depths. For example, consecutive data points with score values within a suitable range may be classified as one segment, whereas consecutive data points with score values which exceed the set thresholds may be assigned to a different segment. Details of segmentation-based routines are given in Example 6.
- the invention provides kits for carrying out the methods of the disclosure.
- the kit comprises a container consisting of the pool of TACS and instructions for performing the method.
- the TACS are provided in a form that allows them to be bound to a solid support, such as biotinylated TACS.
- the TACS are provided together with a solid support, such as biotinylated TACS provided together with streptavidin-coated magnetic beads.
- the kit comprises a container comprising the pool of TACS and instructions for performing the method, wherein the pool of TACS comprises a plurality of member sequences, wherein:
- the pool of TACS comprises a plurality of TACS families, wherein each TACS family comprises a plurality of member sequences, wherein each member sequence binds to the same genomic sequence of interest but has different start and/or stop positions with respect to a reference coordinate system for the genomic sequence of interest,
- any of the various features described herein with respect to the design and structure of the TACS can be incorporated into the TACS that are included in the kit.
- the kit can comprise additional components for carrying out other aspects of the method.
- the kit can comprise one or more of the following (i) one or more components for isolating cell free DNA from a biological sample (e.g., as described in Example 1); (ii) one or more components for preparing the sequencing library (e.g., primers, adapters, buffers, linkers, restriction enzymes, ligation enzymes, polymerase enzymes and the like as described in detail in Example 1); (iii) one or more components for amplifying and/or sequencing the enriched library (e.g., as described in Example 3); and/or (iv) software for performing statistical analysis (e.g., as described in Example 4).
- the sequencing library e.g., primers, adapters, buffers, linkers, restriction enzymes, ligation enzymes, polymerase enzymes and the like as described in detail in Example 1
- the sequencing library e.g., primers, adapters, buffers, linkers, restriction enzymes, ligation enzymes
- the invention pertains to fragment based analysis of samples, described further in Example 7.
- fetal cell free DNA can be found in the medium of IVF products of conception and it can be used for the assessment of chromosomal abnormalities (Liu, WeiQiang, et al. (2017)).
- specific types of genetic abnormalities can be characterized by and/or associated with fragments of a smaller size than the expected size of fragments originating from healthy tissues ( Jiang et al, (2015), Proceedings of the National Academy of Sciences, 112(11), ppE1317-E1325 ).
- fragments-based detection may be used to detect abnormalities.
- a binomial test of proportions as described Example 4, can be used for the detection of increased presence of nucleic acid material originating from abnormal cells based on fragment size.
- a binomial test for proportions as described in Example 4 using continuity correction can be utilized to quantify any evidence against it.
- Fetal cell samples were obtained from 3-day and 5-day biopsy embryos respectively were subjected to the TACS methodology shown in Figure 1 to determine the status of genetic abnormalities. Protocols used for collecting samples for our study were approved by the Cyprus National Bioethics Committee, and informed consent was obtained from all participants.
- Hybridization mixtures for adapter P5 and P7 were prepared separately and incubated for 10 seconds at 95° C followed by a ramp from 95° C to 12° C at a rate of 0.1° C /second. P5 and P7 reactions were combined to obtain a ready-to-use adapter mix (100 ⁇ M of each adapter). Hybridization mixtures were prepared as follows: P5 reaction mixture contained adaptor P5_F (500 ⁇ M) at a final concentration of 200 ⁇ M, adaptor P5+P7_R (500 ⁇ M) at a final concentration of 200 ⁇ M with 1X oligo hybridization buffer.
- This example describes preparation of custom TACS for the detection of whole or partial chromosomal abnormalities for chromosomes 1-22, X and Y or any other chromosome, as well as other genetic abnormalities, such as but not limited to, chromosomal mosaicism, microdeletion/microduplication syndromes, translocations, inversions, insertions, and other point or small size mutations.
- the genomic target-loci used for TACS design were selected based on their GC content and their distance from repetitive elements (minimum 50 bp away).
- TACS size can be variable. In one embodiment of the method the TACS range from 100-500 bp in size and are generated through a PCR-based approach as described below.
- the TACS were prepared by simplex polymerase chain reaction using standard Taq polymerase, primers designed to amplify the target-loci, and normal DNA used as template.
- All custom TACS were generated using the following cycling conditions: 95°C for 3 minutes; 40 cycles at 95°C for 15 seconds, 60°C for 15 seconds, 72°C for 12 seconds; and 72°C for 12 seconds, followed by verification via agarose gel electrophoresis and purification using standard PCR clean up kits such as the Qiaquick PCR Purification Kit (Qiagen) or the NucleoSpin 96 PCR clean-up (Mackerey Nagel) or the Agencourt AMPure XP for PCR Purification (Beckman Coulter). Concentration was measured by Nanodrop (Thermo Scientific).
- This example describes the steps schematically illustrated in Figure 1 of target capture by hybridization using TACS, followed by quantitation of captured sequences by Next Generation Sequencing (NGS).
- NGS Next Generation Sequencing
- TACS were prepared for hybridization, as previously described ( Koumbaris, G. et al. (2015) Clinical chemistry, 62(6), pp.848-855 ), starting with blunt ending with the Quick Blunting Kit (NEB) and incubation at room temperature for 30 minutes. Reaction products were subsequently purified using the MinElute kit (Qiagen) and were ligated with a biotin adaptor using the Quick Ligation Kit (NEB) in a 40 ⁇ l reaction at RT for 15 minutes. The reaction products were purified with the MinElute kit (Qiagen) and were denatured into single stranded DNA prior to immobilization on streptavidin coated magnetic beads (Invitrogen).
- Amplified libraries were mixed with blocking oligos ( Koumbaris, G. et al. (2105) Clinical chemistry, 62(6), pp.848-855 ) (200 ⁇ M), 5 ⁇ g of Cot-1 DNA (Invitrogen), 50 ⁇ g of Salmon Sperm DNA (Invitrogen), Agilent hybridization buffer 2x, Agilent blocking agent 10X, and were heated at 95°C for 3 minutes to denature the DNA strands. Denaturation was followed by 30 minute incubation at 37°C to block repetitive elements and adaptor sequences. The resulting mixture was then added to the biotinylated TACS. All samples were incubated in a rotating incubator for 12- 48 hours at 66°C.
- the bioinformatic pipeline routine described below was applied in order to align the sample's sequenced DNA fragments to the human reference genome.
- Targeted paired-end read fragments obtained from NGS results were processed to remove adaptor sequences and poor quality reads (Q-score ⁇ 25) using the cutadapt software (Martin, M. et al. (2011) EMB.netJournal 17.1).
- the quality of the raw and/or processed reads as well as any descriptive statistics which aid in the assessment of quality check of the sample's sequencing output were obtained using the FastQC software (Babraham Institute (2015) FastQC ) and/or other custom-built software.
- the above software analysis resulted in a final aligned version of a sequenced sample against the human reference genome and all subsequent steps were based on this aligned version.
- Information in terms of Short Nucleotide Polymorphisms (SNPs) at loci of interest was obtained using bcftools from the SAMtools software suite ( Li, H. et al. (2009) Bioinformatics 25:2078-2079 ) and/or other software known to those skilled in the art.
- the read-depth per base, at loci of interest was obtained using the mpileup option of the SAMtools software suite, from here on referred to as the mpileup file.
- Information pertaining to the size of the aligned fragments was obtained using the view option of the SAMtools software suite, from here on referred to as the fragment-sizes file and/or other software known to those skilled in the art.
- the mpileup file and the fragment-sizes file were processed using custom-build application programming interfaces (APIs) written in the Python and R programming languages (Python Software Foundation (2015) Python ; The R Foundation (2015) The R Project for Statistical Computing ) .
- APIs application programming interfaces
- the APIs were used to determine the ploidy state of chromosomes of interest, and/or other genetic abnormalities in regions of interest across the human genome, using a series of steps (collectively henceforth referred to as the "algorithm”) and to also collect further descriptive statistics to be used as quality check metrics, such as but not limited to fetal fraction quantification (collectively henceforth referred to as the "QC metrics").
- the APIs can also be used for the assessment of genetic abnormalities from data generated when applying the described method in cases of multiple gestation pregnancies, as well as other genetic abnormalities such as, but not limited to, microdeletions, microduplications, copy number variations, translocations, inversions, insertions, point mutations and mutational signatures.
- QC metrics were used to inspect an aligned sample's properties and decide whether the sample was suitable to undergo classification. These metrics were, but are not limited to, the enrichment of a sample. The patterns of enrichment are indicative of whether a sample has had adequate enrichment across loci of interest in a particular sequencing experiment (herein referred to as a "run"). To assess this, various metrics are assessed, non-limiting examples of which are:
- the algorithm is a collection of data processing, mathematical and statistical model routines arranged as a series of steps.
- the algorithm's steps aim in deciding the relative ploidy state of a chromosome of interest with respect to all other chromosomes of the sequenced sample and is used for the detection of whole or partial chromosomal abnormalities for chromosomes 1-22, X and Y or any other chromosome, as well as other genetic abnormalities such as, but not limited to, chromosomal mosaicism, microdeletion/microduplication syndromes and other point or small size mutations.
- the algorithm can be used, but is not limited to, the detection of whole or partial chromosomal abnormalities for chromosomes 13, 18, 21, X, Y or any other chromosome, as well as other genetic abnormalities such as, but not limited to, microdeletions, microduplications, copy number variations, translocations, inversions, insertions, point mutations and other mutational signatures.
- the algorithm compares sequentially the read-depth of loci from each chromosome of interest (herein referred to as the test chromosome) against the read-depth of all other loci (herein referred to as the reference loci) to classify its ploidy state. For each sample, these steps were, but are not limited to:
- the algorithm computes the proportion of small-size fragments found in test-loci and compares it with the respective proportion in reference-loci as described in Statistical Method 4 below.
- H0 The proportion of small fragments of the test-region is not different from the proportion of small-fragments of the reference region.
- small fragments are defined as those fragments whose size is less than or equal to a subset of Z + that is upper-bounded by 160bp.
- the test region can be any proper subset S which defines the region under investigation, and the reference region is the relative complement of S in T.
- the set S is defined by all TACS-captured sequences of chromosome 21 and thus the reference set is defined by all TACS-captured fragments on the reference chromosomes, and/or other reference loci
- H1 The proportion of small fragments of the test-region is not equal to the proportion of test fragments of the reference region.
- the algorithm tests sequentially the proportion of fragment sizes of regions under investigation (for example, but not limited to, chromosome 21, chromosome 18, chromosome 13 or other (sub)chromosomal regions of interest) against reference regions; those not under investigation at the time of testing. For each sample a score is assigned for each test. Scores above a set-threshold, say c4, provide evidence against the null hypothesis.
- the terms max ⁇ R s ,F s ⁇ and min ⁇ R s ,F s ⁇ denote the maximum and minimum values of the bracketed set, respectively.
- F s is the run-specific corrected score arising from the fragment-size related statistical method and is defined as: where W test is as defined earlier, ⁇ f is the run specific median calculated from the vector of all unadjusted fragment-related statistical scores that arise from a single sequencing run, and ⁇ f is a multiple of the standard deviation of F scores calculated from a reference set of 100 euploid samples.
- a unique classification score of less than a predefined value indicates that there is no evidence from the observed data that a sample has a significant risk of aneuploidy.
- a unique classification score of less than a predefined value indicates that there is no evidence from the observed data that a sample has a significant risk of aneuploidy.
- the aforementioned method(s), are also suitable for the detection of other genetic abnormalities, such as but not limited to, subchromosomal abnormalities.
- a non-limiting example is the contiguous partial loss of chromosomal material leading to a state of microdeletion, or the contiguous partial gain of chromosomal material leading to a state of microduplication.
- a known genetic locus subject to both such abnormalities is 7q11.23.
- synthetic plasma samples of 5%, 10% and 20% fetal material were tested for increased risk of microdeletion and/or microduplication states for the genetic locus 7q11.23.
- fetal sex determination methods were also developed, with non-limiting examples given below.
- the null hypothesis of the Poisson test was that the sample is male.
- fetal sex was assigned using the average read-depth of target sequences on chromosome Y. If the average read-depth of the target-sequences was over a predefined threshold, where such threshold may be defined using other sample-specific characteristics such as read-depth and fetal-fraction estimate, the fetal sex was classified as male. If the average read-depth was below such threshold then the sample was classified as female.
- a family of TACS containing a plurality of members that all bind to the same target sequence of interest, was used for enrichment, compared to use of a single TACS binding to a target sequence of interest.
- Each member of the family of TACS bound to the same target sequence of interest but had a different start and/or stop coordinates with respect to a reference coordinate system for that target sequence (e.g., the human reference genome built hg19).
- a reference coordinate system for that target sequence e.g., the human reference genome built hg19.
- the family of TACS exhibit a staggered binding pattern, as illustrated in Figure 3 .
- the members of a TACS family were staggered approximately 5-10 base pairs.
- a family of TACS containing four members i.e., four sequences that bound to the same target sequence but having different start/stop positions such that the binding of the members to the target sequence was staggered
- Single TACS hybridization was also prepared as a control.
- the TACS were fixed to a solid support by labelling with biotin and binding to magnetic beads coated with a biotin-binding substance (e.g., streptavidin or avidin) as described in Example 3.
- the family of TACS and single TACS were then hybridized to a sequence library, bound sequences were eluted and amplified, and these enriched amplified products were then pooled equimolarly and sequenced on a suitable sequencing platform, as described in Example 3.
- This example demonstrates that use of a family of TACS, as compared to a single TACS, results in significantly improved enrichment of a target sequence of interest resulting in significantly improved read-depth of that sequence.
- fetal DNA samples obtained from fetal cells from embryo biopsy were analyzed using the TACS-based methodology shown in Figure 1 to detect chromosomal abnormalities in the fetal samples.
- Fetal cell samples were obtained from 3-day and 5-day biopsy embryos respectively were subjected to the TACS methodology shown in Figure 1 to determine the status of genetic abnormalities. All samples were previously referred for Pre-implantation Genetic Screening (PGS) and subjected to array Comparative Genomic Hybridization (aCGH) as part of the routine screening test. Results of aCGH were used as a reference standard for the results obtained.
- PPS Pre-implantation Genetic Screening
- aCGH array Comparative Genomic Hybridization
- the lysed material was subjected to whole genome amplification using commercial whole genome amplification kits. Briefly, following a pre-amplification step, the lysed material was then amplified using amplification enzyme and buffer supplied by the manufacturer. Subsequently, DNA was purified followed by fragmentation using sonication. Fragmented DNA was then processed using standard sequencing library preparation methods such as described in Example 1, typically involving ligation of adapters onto the ends of the cell free DNA fragments, followed by amplification. In addition to the description provided in Example 1, sequencing library preparation kits are commercially available for this purpose.
- the sequencing library obtained from the above methods underwent TACS hybridization essentially as described in Example 3.
- the region(s) of interest on the chromosome(s) of interest were enriched by hybridizing the pool of TACS to the sequencing library, followed by isolation of those sequences within the sequencing library that bind to the TACS.
- enriched sequences typically the TACS sequences were modified such that sequences that hybridized to the TACS were separable from sequences that did not hybridize to the TACS. Typically this was achieved by fixing the TACS to a solid support such as described in Example 3, thereby allowing for physical separation of those sequences that bind the TACS from those sequences that do not bind the TACS.
- the pools of TACS used either can contain a plurality of single TACS that bind to different target sequences of interest or, alternatively, can contain a plurality of families of TACS containing a plurality of members that each bind to the same target sequence of interest but with different start and/or stop positions on the target sequence, as described in Example 5.
- the pool of TACS can contain TACS that target a subset of chromosomes of interest (e.g., chromosomes 13, 18, 21, X and Y). More preferably, however, the pool of TACS contains various TACS that target every chromosome within the human genome (chromosomes 1-22, X and Y) such that the entire genome is encompassed, allowing for determination of chromosomal abnormalities in any chromosome within the human genome.
- NGS Next Generation Sequencing
- Sequencing data obtained from NGS were processed to remove adaptor sequences and poor quality reads. Reads whose length was at least 25 bases long post adaptor-removal were aligned to the human reference genome built hg19. If relevant, duplicate reads were removed post-alignment. Where applicable, sequencing output pertaining to the same sample but processed on separate sequencing lanes, was merged to a single sequencing output file. Software analysis provides a final aligned version of a sequenced sample against the human reference genome from which information was extracted in terms of Short Nucleotide Polymorphisms (SNPs) at loci of interest, read-depth per base and the size of aligned fragments.
- SNPs Short Nucleotide Polymorphisms
- the read-depth of non-overlapping genomic regions of fixed size (e.g. 50kb or 1Mb) was obtained by using the samtools bedcov tool, which provides the sum of all reads across a specified genomic region. The obtained value was divided by the length of the windows.
- the read-depth was obtained by using the samtools mpileup tool, which provides information on the read-depth per base, across specified contiguous sequences or the bedcov tool. The median value of the obtained information was assigned as the read-depth of a given locus. Removal of read-depth outliers was performed using either a median-based or mean-based outlier detection approach.
- GC-content read-depth bias alleviation was achieved using a local polynomial fitting method to estimate the expected read-depth of regions based on their GC content and then normalize regions using this expected value accordingly.
- the expected ploidy state is the diploid state.
- the segmentation approach aims to discover breakpoints in consecutive data where there is a clear distinction between read-depths, which in turn indicates that there is a change in ploidy state.
- the algorithms are described below.
- FIG. 5 Representative results of fetal DNA analysis using the likelihood-based segmentation algorithm are shown in Figure 5 . These results demonstrate that likelihood-based segmentation analysis can classify whole-chromosome aberrations in fetal DNA samples (e.g., from PGD/PGS products of conception).
- fetal DNA samples e.g., from PGD/PGS products of conception.
- FIG. 5 a sample without any ploidy abnormalities subjected to whole-genome sequencing is presented.
- the expected read-depth of each chromosome (blue horizontal bars) lies within the red lines that indicate the range of values of normal ploidy, as decided from the data. Even if on occasion individual data points (grey dots) deviate from the confidence intervals this is not sufficient evidence of ploidy aberrations according to the probabilistic metric used.
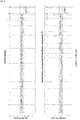
- Figure 10 presents results from the algorithm utilizing data derived from TACS specific coordinates combined with data from products of partial complementarity to the TACS that align to non-TACS coordinates thus producing low coverage throughout the genome.
- a normal male sample is presented, whereas in the bottom panel the male sample is classified as having trisomy for chromosome 13 and monosomy for chromosome 21.
- Figure 11 presents results from the algorithm utilizing data from TACS specific coordinates only. As with Figure 10 , in the top panel of Figure 11 a normal male sample is presented, whereas in the bottom panel the male sample is classified as having trisomy for chromosome 13 and monosomy for chromosome 21.
- the algorithm successfully classifies TACS-based enrichment and TACS-based whole genome sequencing data, allowing for correct classification of chromosomal abnormalities and at the same time requiring significantly less sequencing than massively parallel shotgun sequencing approaches.
- FIG. 6 Representative results of ploidy determination for fetal DNA samples (e.g., PGS/PGD products of conception) using whole genome sequencing and small overlapping windows segmentation are shown in Figure 6 .
- the top panel illustrates a normal sample.
- the expected read-depth of each chromosome (blue horizontal bars) lies within the red lines, which indicate the range of values of normal ploidy.
- the expected read-depth is calculated from the individual data points (grey dots).
- the average read-depth and data points of chromosomes X and Y lie below the bottom red-line, indicating that there is only a single copy of each chromosome, as expected for a male sample.
- An aneuploid sample is presented at the bottom of Figure 6 where the sample is classified with trisomy 13 and mosaicism on chromosome 19.
- This segmentation approach firstly performs full chromosome ploidy determination and then a sub-chromosomal ploidy determination as follows:
- FIG. 7 Representative results of ploidy determination for fetal DNA samples (e.g., PGS/PGD products of conception) using whole genome sequencing and small overlapping windows segmentation are presented in Figure 7 .
- the top panel illustrates a normal sample.
- the expected read-depth of each chromosome is illustrated using blue horizontal bars. In this instance, confidence interval bars have been omitted.
- a normal sample is presented at the top Figure 7 whilst a sample presenting many abnormalities is presented at the bottom panel.
- fetal DNA samples can be analyzed using score-based classification.
- the read-depth data were firstly transformed using square root or logarithmic transformation in order to minimize variance biases. Then methods such as those described in Example 4 were performed to decide on the ploidy status of each tested region (chromosomal and sub-chromosomal regions may be tested).
- Green dots illustrate normal ploidy samples whilst all others that lie above or below the normal ploidy thresholds illustrate some type of abnormality. Specifically, blue dots illustrate trisomy samples, cyan dots illustrate partial trisomy samples and red dots illustrate monosomy samples.
- this example demonstrates the successful analysis of fetal DNA samples (e.g., PGS/PGD products of conception) for chromosomal abnormalities using either whole genome sequencing data, TACS-based whole genome sequencing data and TACS-based enrichment data, using a variety of statistical analysis approaches. Furthermore, the example illustrates that the methods used with whole genome sequencing data can be successfully applied to TACS-based whole genome sequencing data and TACS-based enrichment data.
- fetal DNA samples e.g., PGS/PGD products of conception
- a binomial test of proportions as described Example 4, can be used for the detection of increased presence of nucleic acid material originating from non-healthy tissue based on fragment size.
- a binomial test for proportions (as described in Example 4) using continuity correction can be utilized to quantify any evidence against it.
- placenta derived fragments are generally of smaller size when compared to fragments originating from maternal tissues/cells. Accordingly, assessment of the fragment size-based test was performed using maternal plasma samples (i.e., mixed samples where cell free DNA is of maternal and fetal origin). The size of fragments that have aligned to TACS-enriched regions can be obtained from the aligned data. Subsequently, the proportion of fragments under a specific threshold from a test region is compared respective proportion of fragments from a reference region for evidence against the null hypothesis H0,
- H0 The proportion of small fragments of the test-region is not different from the proportion of small-fragments of the reference region.
- Figure 9 shows results when applying the fragment sizes method to the mixed sample containing maternal and fetal DNA.
- the black dots are individual samples.
- the x-axis shows the sample index.
- the y-axis shows the score result of the fragments-based method.
- a score result greater than the one indicated by the threshold, illustrated as a grey line, indicates a deviation from the expected size of fragments illustrating the presence of aneuploidy.
- the results demonstrate that an aneuploid sample, having an estimated fetal fraction equal to 2.8%, was correctly identified, illustrating that fragments-based detection may be used to detect abnormalities in samples with low signal-to-noise ratio (e.g., as is the case in detection of cancer).
- this example demonstrates the successful ability of the fragments-based detection method in detecting genetic abnormalities present in diminutive amounts.
- small-sized fragments are associated with fragments from non-healthy tissues ( Jiang et al, (2015), Proceedings of the National Academy of Sciences, 112(11), ppE1317-E1325
Landscapes
- Chemical & Material Sciences (AREA)
- Life Sciences & Earth Sciences (AREA)
- Organic Chemistry (AREA)
- Health & Medical Sciences (AREA)
- Proteomics, Peptides & Aminoacids (AREA)
- Analytical Chemistry (AREA)
- Zoology (AREA)
- Wood Science & Technology (AREA)
- Engineering & Computer Science (AREA)
- Genetics & Genomics (AREA)
- Immunology (AREA)
- Molecular Biology (AREA)
- General Engineering & Computer Science (AREA)
- Biotechnology (AREA)
- Biophysics (AREA)
- Physics & Mathematics (AREA)
- Biochemistry (AREA)
- Bioinformatics & Cheminformatics (AREA)
- Microbiology (AREA)
- General Health & Medical Sciences (AREA)
- Pathology (AREA)
- Chemical Kinetics & Catalysis (AREA)
- Hospice & Palliative Care (AREA)
- Oncology (AREA)
- Measuring Or Testing Involving Enzymes Or Micro-Organisms (AREA)
Applications Claiming Priority (3)
| Application Number | Priority Date | Filing Date | Title |
|---|---|---|---|
| US201762529790P | 2017-07-07 | 2017-07-07 | |
| EP18745509.2A EP3649258B1 (fr) | 2017-07-07 | 2018-07-06 | Analyse parallèle multiplexée enrichie en cible pour l'évaluation d'échantillons d'adn f tal |
| PCT/EP2018/068414 WO2019008153A1 (fr) | 2017-07-07 | 2018-07-06 | Analyse parallèle multiplexée enrichie en cible pour l'évaluation d'échantillons d'adn fœtal |
Related Parent Applications (2)
| Application Number | Title | Priority Date | Filing Date |
|---|---|---|---|
| PCT/EP2018/068414 Previously-Filed-Application WO2019008153A1 (fr) | 2017-07-07 | 2018-07-06 | Analyse parallèle multiplexée enrichie en cible pour l'évaluation d'échantillons d'adn fœtal |
| EP18745509.2A Division EP3649258B1 (fr) | 2017-07-07 | 2018-07-06 | Analyse parallèle multiplexée enrichie en cible pour l'évaluation d'échantillons d'adn f tal |
Publications (2)
| Publication Number | Publication Date |
|---|---|
| EP4116432A1 true EP4116432A1 (fr) | 2023-01-11 |
| EP4116432B1 EP4116432B1 (fr) | 2026-04-29 |
Family
ID=63012985
Family Applications (2)
| Application Number | Title | Priority Date | Filing Date |
|---|---|---|---|
| EP22171474.4A Active EP4116432B1 (fr) | 2017-07-07 | 2018-07-06 | Analyse parallèle multiplexée enrichie en cible pour l'évaluation d'échantillons d'adn f tal |
| EP18745509.2A Active EP3649258B1 (fr) | 2017-07-07 | 2018-07-06 | Analyse parallèle multiplexée enrichie en cible pour l'évaluation d'échantillons d'adn f tal |
Family Applications After (1)
| Application Number | Title | Priority Date | Filing Date |
|---|---|---|---|
| EP18745509.2A Active EP3649258B1 (fr) | 2017-07-07 | 2018-07-06 | Analyse parallèle multiplexée enrichie en cible pour l'évaluation d'échantillons d'adn f tal |
Country Status (10)
| Country | Link |
|---|---|
| US (2) | US11649500B2 (fr) |
| EP (2) | EP4116432B1 (fr) |
| AU (1) | AU2018298437B2 (fr) |
| CY (1) | CY1125316T1 (fr) |
| DK (1) | DK3649258T3 (fr) |
| ES (1) | ES2924224T3 (fr) |
| PL (1) | PL3649258T3 (fr) |
| PT (1) | PT3649258T (fr) |
| WO (1) | WO2019008153A1 (fr) |
| ZA (1) | ZA201908543B (fr) |
Families Citing this family (4)
| Publication number | Priority date | Publication date | Assignee | Title |
|---|---|---|---|---|
| EP3649260B1 (fr) | 2017-07-07 | 2022-05-11 | Nipd Genetics Public Company Limited | Analyse parallèle multiplexée enrichie en cible pour l'évaluation de biomarqueurs tumoraux |
| WO2019008167A1 (fr) | 2017-07-07 | 2019-01-10 | Nipd Genetics Public Company Limited | Analyse parallèle multiplexée enrichie en cible pour évaluation du risque pour des troubles génétiques |
| DK3649257T3 (da) | 2017-07-07 | 2022-07-04 | Nipd Genetics Public Company Ltd | Berigelse af målrettede genomiske regioner til multiplekset parallel analyse |
| WO2019008153A1 (fr) | 2017-07-07 | 2019-01-10 | Nipd Genetics Public Company Limited | Analyse parallèle multiplexée enrichie en cible pour l'évaluation d'échantillons d'adn fœtal |
Citations (10)
| Publication number | Priority date | Publication date | Assignee | Title |
|---|---|---|---|---|
| WO2008027548A2 (fr) * | 2006-09-01 | 2008-03-06 | Dana-Farber Cancer Institute, Inc. | Cartographie de structure de chromatine à base de microarray |
| US20080194414A1 (en) * | 2006-04-24 | 2008-08-14 | Albert Thomas J | Enrichment and sequence analysis of genomic regions |
| US20110039304A1 (en) * | 2009-08-12 | 2011-02-17 | President And Fellows Of Harvard College | Methods to Generate Oligonucleotide Pools and Enrich Target Nucleic Acid Sequences |
| US20110160076A1 (en) * | 2009-12-31 | 2011-06-30 | Ventana Medical Systems, Inc. | Methods for producing uniquely specific nucleic acid probes |
| US20150203907A1 (en) * | 2014-01-17 | 2015-07-23 | Florida State University Research Foundation | Genome capture and sequencing to determine genome-wide copy number variation |
| EP2902500A1 (fr) * | 2011-02-09 | 2015-08-05 | Natera, Inc. | Procédés pour une classification de ploïdie prénatal non invasif |
| WO2016024134A2 (fr) * | 2014-08-14 | 2016-02-18 | Oxford Gene Technology (Operations) Ltd. | Colonne d'hybridation pour enrichissement d'acide nucléique |
| US20160068889A1 (en) * | 2014-09-10 | 2016-03-10 | Good Start Genetics, Inc. | Methods for selectively suppressing non-target sequences |
| WO2016189388A1 (fr) * | 2015-05-22 | 2016-12-01 | Nipd Genetics Ltd | Analyse parallèle multiplexée de régions génomiques ciblées pour des tests prénataux non invasifs |
| US20170051355A1 (en) * | 2010-05-18 | 2017-02-23 | Natera, Inc. | Highly multiplex pcr methods and compositions |
Family Cites Families (7)
| Publication number | Priority date | Publication date | Assignee | Title |
|---|---|---|---|---|
| TR201910868T4 (tr) | 2006-02-02 | 2019-08-21 | Univ Leland Stanford Junior | Dijital analizle invazif olmayan fetal genetik tarama. |
| HUE031848T2 (en) | 2008-09-20 | 2017-08-28 | Univ Leland Stanford Junior | Non-invasive diagnosis of fetal aneuploidy by sequencing |
| ES2534758T3 (es) | 2010-01-19 | 2015-04-28 | Verinata Health, Inc. | Métodos de secuenciación en diagnósticos prenatales |
| US20120270739A1 (en) | 2010-01-19 | 2012-10-25 | Verinata Health, Inc. | Method for sample analysis of aneuploidies in maternal samples |
| AU2011358564B9 (en) * | 2011-02-09 | 2017-07-13 | Natera, Inc | Methods for non-invasive prenatal ploidy calling |
| DK3649257T3 (da) | 2017-07-07 | 2022-07-04 | Nipd Genetics Public Company Ltd | Berigelse af målrettede genomiske regioner til multiplekset parallel analyse |
| WO2019008153A1 (fr) | 2017-07-07 | 2019-01-10 | Nipd Genetics Public Company Limited | Analyse parallèle multiplexée enrichie en cible pour l'évaluation d'échantillons d'adn fœtal |
-
2018
- 2018-07-06 WO PCT/EP2018/068414 patent/WO2019008153A1/fr not_active Ceased
- 2018-07-06 PL PL18745509.2T patent/PL3649258T3/pl unknown
- 2018-07-06 EP EP22171474.4A patent/EP4116432B1/fr active Active
- 2018-07-06 EP EP18745509.2A patent/EP3649258B1/fr active Active
- 2018-07-06 PT PT187455092T patent/PT3649258T/pt unknown
- 2018-07-06 US US16/625,437 patent/US11649500B2/en active Active
- 2018-07-06 AU AU2018298437A patent/AU2018298437B2/en active Active
- 2018-07-06 ES ES18745509T patent/ES2924224T3/es active Active
- 2018-07-06 DK DK18745509.2T patent/DK3649258T3/da active
-
2019
- 2019-12-20 ZA ZA2019/08543A patent/ZA201908543B/en unknown
-
2022
- 2022-06-22 CY CY20221100433T patent/CY1125316T1/el unknown
-
2023
- 2023-05-11 US US18/316,080 patent/US20230416826A1/en active Pending
Patent Citations (10)
| Publication number | Priority date | Publication date | Assignee | Title |
|---|---|---|---|---|
| US20080194414A1 (en) * | 2006-04-24 | 2008-08-14 | Albert Thomas J | Enrichment and sequence analysis of genomic regions |
| WO2008027548A2 (fr) * | 2006-09-01 | 2008-03-06 | Dana-Farber Cancer Institute, Inc. | Cartographie de structure de chromatine à base de microarray |
| US20110039304A1 (en) * | 2009-08-12 | 2011-02-17 | President And Fellows Of Harvard College | Methods to Generate Oligonucleotide Pools and Enrich Target Nucleic Acid Sequences |
| US20110160076A1 (en) * | 2009-12-31 | 2011-06-30 | Ventana Medical Systems, Inc. | Methods for producing uniquely specific nucleic acid probes |
| US20170051355A1 (en) * | 2010-05-18 | 2017-02-23 | Natera, Inc. | Highly multiplex pcr methods and compositions |
| EP2902500A1 (fr) * | 2011-02-09 | 2015-08-05 | Natera, Inc. | Procédés pour une classification de ploïdie prénatal non invasif |
| US20150203907A1 (en) * | 2014-01-17 | 2015-07-23 | Florida State University Research Foundation | Genome capture and sequencing to determine genome-wide copy number variation |
| WO2016024134A2 (fr) * | 2014-08-14 | 2016-02-18 | Oxford Gene Technology (Operations) Ltd. | Colonne d'hybridation pour enrichissement d'acide nucléique |
| US20160068889A1 (en) * | 2014-09-10 | 2016-03-10 | Good Start Genetics, Inc. | Methods for selectively suppressing non-target sequences |
| WO2016189388A1 (fr) * | 2015-05-22 | 2016-12-01 | Nipd Genetics Ltd | Analyse parallèle multiplexée de régions génomiques ciblées pour des tests prénataux non invasifs |
Non-Patent Citations (3)
| Title |
|---|
| ERIC J DUNCAVAGE ET AL: "Targeted next generation sequencing of clinically significant gene mutations and translocations in leukemia", MODERN PATHOLOGY, vol. 25, no. 6, 16 March 2012 (2012-03-16), GB, pages 795 - 804, XP055235397, ISSN: 0893-3952, DOI: 10.1038/modpathol.2012.29 * |
| STEPHAN BAU ET AL: "Targeted next-generation sequencing by specific capture of multiple genomic loci using low-volume microfluidic DNA arrays", ANALYTICAL AND BIOANALYTICAL CHEMISTRY, SPRINGER, BERLIN, DE, vol. 393, no. 1, 29 October 2008 (2008-10-29), pages 171 - 175, XP019652995, ISSN: 1618-2650 * |
| XI LIN ET AL: "Applications of targeted gene capture and next-generation sequencing technologies in studies of human deafness and other genetic disabilities", HEARING RESEARCH, ELSEVIER SCIENCE PUBLISHERS, AMSTERDAM, NL, vol. 288, no. 1, 6 January 2012 (2012-01-06), pages 67 - 76, XP028519246, ISSN: 0378-5955, [retrieved on 20120114], DOI: 10.1016/J.HEARES.2012.01.004 * |
Also Published As
| Publication number | Publication date |
|---|---|
| AU2018298437B2 (en) | 2024-12-05 |
| ZA201908543B (en) | 2022-06-29 |
| US20210147936A1 (en) | 2021-05-20 |
| US20230416826A1 (en) | 2023-12-28 |
| US11649500B2 (en) | 2023-05-16 |
| PL3649258T3 (pl) | 2022-10-03 |
| EP3649258B1 (fr) | 2022-05-04 |
| ES2924224T3 (es) | 2022-10-05 |
| PT3649258T (pt) | 2022-05-25 |
| CY1125316T1 (el) | 2024-09-20 |
| DK3649258T3 (da) | 2022-08-01 |
| WO2019008153A1 (fr) | 2019-01-10 |
| EP4116432B1 (fr) | 2026-04-29 |
| CA3068110A1 (fr) | 2019-01-10 |
| AU2018298437A1 (en) | 2020-01-16 |
| EP3649258A1 (fr) | 2020-05-13 |
Similar Documents
| Publication | Publication Date | Title |
|---|---|---|
| EP3608420B1 (fr) | Acides nucléiques et procédés de détection d'anomalies chromosomiques | |
| US12480160B2 (en) | Multiplexed parallel analysis of targeted genomic regions for non-invasive prenatal testing | |
| US20230416826A1 (en) | Target-enriched multiplexed parallel analysis for assessment of fetal dna samples | |
| EP4095258B1 (fr) | Analyse parallèle multiplexée enrichie en cible pour l'évaluation de biomarqueurs tumoraux | |
| US20240200138A1 (en) | Target-Enriched Multiplexed Parallel Analysis For Assessment Of Risk For Genetic Conditions | |
| US12270069B2 (en) | Enrichment of targeted genomic regions for multiplexed parallel analysis | |
| HK40086712A (en) | Target-enriched multiplexed parallel analysis for assessment of fetal dna samples | |
| CA3068110C (fr) | Analyse parallele multiplexee enrichie en cible pour l'evaluation d'echantillons d'adn foetal | |
| HK40089491A (en) | Targetenriched multiplexed parallel analysis for assessment of risk for genetic conditions | |
| HK40113543A (en) | Multiplexed parallel analysis of targeted genomic regions for non-invasive prenatal testing | |
| HK40032387B (en) | Multiplexed parallel analysis of targeted genomic regions for non-invasive prenatal testing | |
| HK40032387A (en) | Multiplexed parallel analysis of targeted genomic regions for non-invasive prenatal testing | |
| HK40030210A (en) | Target-enriched multiplexed parallel analysis for assessment of fetal dna samples | |
| HK40030210B (en) | Target-enriched multiplexed parallel analysis for assessment of fetal dna samples | |
| HK1252710B (en) | Multiplexed parallel analysis of targeted genomic regions for non-invasive prenatal testing | |
| HK1256543B (en) | Nucleic acids and methods for detecting chromosomal abnormalities |
Legal Events
| Date | Code | Title | Description |
|---|---|---|---|
| PUAI | Public reference made under article 153(3) epc to a published international application that has entered the european phase |
Free format text: ORIGINAL CODE: 0009012 |
|
| STAA | Information on the status of an ep patent application or granted ep patent |
Free format text: STATUS: THE APPLICATION HAS BEEN PUBLISHED |
|
| AC | Divisional application: reference to earlier application |
Ref document number: 3649258 Country of ref document: EP Kind code of ref document: P |
|
| AK | Designated contracting states |
Kind code of ref document: A1 Designated state(s): AL AT BE BG CH CY CZ DE DK EE ES FI FR GB GR HR HU IE IS IT LI LT LU LV MC MK MT NL NO PL PT RO RS SE SI SK SM TR |
|
| P01 | Opt-out of the competence of the unified patent court (upc) registered |
Effective date: 20230414 |
|
| STAA | Information on the status of an ep patent application or granted ep patent |
Free format text: STATUS: REQUEST FOR EXAMINATION WAS MADE |
|
| REG | Reference to a national code |
Ref country code: HK Ref legal event code: DE Ref document number: 40086712 Country of ref document: HK |
|
| 17P | Request for examination filed |
Effective date: 20230803 |
|
| RBV | Designated contracting states (corrected) |
Designated state(s): AL AT BE BG CH CY CZ DE DK EE ES FI FR GB GR HR HU IE IS IT LI LT LU LV MC MK MT NL NO PL PT RO RS SE SI SK SM TR |
|
| RAP3 | Party data changed (applicant data changed or rights of an application transferred) |
Owner name: MEDICOVER PUBLIC CO LTD |
|
| GRAP | Despatch of communication of intention to grant a patent |
Free format text: ORIGINAL CODE: EPIDOSNIGR1 |
|
| STAA | Information on the status of an ep patent application or granted ep patent |
Free format text: STATUS: GRANT OF PATENT IS INTENDED |
|
| RIC1 | Information provided on ipc code assigned before grant |
Ipc: C12Q 1/6806 20180101AFI20251114BHEP Ipc: C12Q 1/6883 20180101ALI20251114BHEP Ipc: C12Q 1/6886 20180101ALI20251114BHEP |
|
| INTG | Intention to grant announced |
Effective date: 20251126 |
|
| GRAS | Grant fee paid |
Free format text: ORIGINAL CODE: EPIDOSNIGR3 |
|
| GRAA | (expected) grant |
Free format text: ORIGINAL CODE: 0009210 |
|
| STAA | Information on the status of an ep patent application or granted ep patent |
Free format text: STATUS: THE PATENT HAS BEEN GRANTED |