EP4220545A1 - Dispositif de détection d'anomalies, procédé de détection d'anomalies et système de détection d'anomalies - Google Patents
Dispositif de détection d'anomalies, procédé de détection d'anomalies et système de détection d'anomalies Download PDFInfo
- Publication number
- EP4220545A1 EP4220545A1 EP20955233.0A EP20955233A EP4220545A1 EP 4220545 A1 EP4220545 A1 EP 4220545A1 EP 20955233 A EP20955233 A EP 20955233A EP 4220545 A1 EP4220545 A1 EP 4220545A1
- Authority
- EP
- European Patent Office
- Prior art keywords
- abnormality
- distribution
- abnormality detection
- gradient
- region
- Prior art date
- Legal status (The legal status is an assumption and is not a legal conclusion. Google has not performed a legal analysis and makes no representation as to the accuracy of the status listed.)
- Pending
Links
Images


Classifications
-
- G—PHYSICS
- G06—COMPUTING OR CALCULATING; COUNTING
- G06T—IMAGE DATA PROCESSING OR GENERATION, IN GENERAL
- G06T7/00—Image analysis
- G06T7/0002—Inspection of images, e.g. flaw detection
- G06T7/0004—Industrial image inspection
-
- G—PHYSICS
- G06—COMPUTING OR CALCULATING; COUNTING
- G06T—IMAGE DATA PROCESSING OR GENERATION, IN GENERAL
- G06T7/00—Image analysis
- G06T7/0002—Inspection of images, e.g. flaw detection
-
- G—PHYSICS
- G06—COMPUTING OR CALCULATING; COUNTING
- G06T—IMAGE DATA PROCESSING OR GENERATION, IN GENERAL
- G06T2207/00—Indexing scheme for image analysis or image enhancement
- G06T2207/10—Image acquisition modality
- G06T2207/10016—Video; Image sequence
-
- G—PHYSICS
- G06—COMPUTING OR CALCULATING; COUNTING
- G06T—IMAGE DATA PROCESSING OR GENERATION, IN GENERAL
- G06T2207/00—Indexing scheme for image analysis or image enhancement
- G06T2207/10—Image acquisition modality
- G06T2207/10024—Color image
-
- G—PHYSICS
- G06—COMPUTING OR CALCULATING; COUNTING
- G06T—IMAGE DATA PROCESSING OR GENERATION, IN GENERAL
- G06T2207/00—Indexing scheme for image analysis or image enhancement
- G06T2207/20—Special algorithmic details
- G06T2207/20021—Dividing image into blocks, subimages or windows
Definitions
- Non-Patent Document 2 describes a technique for detecting abnormalities caused by lightning strikes or snow by using a robot that runs on top of the transmission lines to image capture the appearance of the transmission lines, and analyzing the captured images with a proprietary AI to determine portions that are not a straight line as "disconnections.”
- Non-Patent Documents 1 and 2 rely on AI-based image analysis, a large amount of learning data for training the AI is required in order to achieve good detection accuracy, and therefore, image capture and labeling by an expert worker become costly.
- one representative abnormality detection device of the present disclosure includes an image input unit for inputting an input image of an abnormality detection target object; a gradient distribution generation unit for dividing the input image into predetermined regions and generating, for each region, a gradient distribution that indicates a distribution of a luminance gradient-direction of the region; and an abnormality determination unit for determining a presence or absence of an abnormality by analyzing the gradient distribution generated for each region.
- the abnormality detection target object refers to an object to be subjected to abnormality detection, and may be any object such as a silicon wafer used for manufacturing an electronic circuit, a power transmission line, an outer wall of a building, or the like, but as will be described later, is preferably an object with a periodic pattern.
- abnormality here refers to a property that is different from the normal property of an abnormality detection target object that serves as the target object to be subjected to abnormality detection, and various abnormalities are conceivable depending on the type of the abnormality detection target object.
- the abnormality detection target object is a power transmission line
- damage to the power transmission line melting due to lightning strikes, disconnections, deformation, and the like
- the abnormality detection target object is a substrate
- cracking, chipping, warping, and the like can be considered.
- the computer system 300 may include one or more general purpose programmable central processing units (CPUs), 302A and 302B, herein collectively referred to as the processor 302.
- the computer system 300 may contain multiple processors, and in other embodiments, the computer system 300 may be a single CPU system.
- Each processor 302 executes instructions stored in the memory 304 and may include an on-board cache.
- the memory 304 may include random access semiconductor memory, storage device, or storage medium (either volatile or non-volatile) for storing data and programs.
- the memory 304 may store all or a part of the programs, modules, and data structures that perform the functions described herein.
- the memory 304 may store an abnormality detection application 350.
- the abnormality detection application 350 may include instructions or statements that execute the functions described below on the processor 302.
- the display system 324 may include a display controller, a display memory, or both.
- the display controller may provide video, audio, or both types of data to the display device 326.
- the computer system 300 may also include a device, such as one or more sensors, configured to collect data and provide the data to the processor 302.
- the storage interface 314 supports the attachment of one or more disk drives or direct access storage devices 322 (which are typically magnetic disk drive storage devices, but may be arrays of disk drives or other storage devices configured to appear as a single disk drive).
- the storage device 322 may be implemented as any secondary storage device.
- the contents of the memory 304 are stored in the storage device 322 and may be read from the storage device 322 as needed.
- the I/O device interface 316 may provide an interface to other I/O devices such as printers, fax machines, and the like.
- the network interface 318 may provide a communication path so that computer system 300 and other devices can communicate with each other.
- the communication path may be, for example, the network 330.
- the sensor device 205 is a sensor for acquiring an image that indicates the appearance of an abnormality detection target object that serves as the target object to be subjected to abnormality detection.
- the image (hereinafter, the "input image" input to the abnormality detection device) acquired by the sensor device 205 may be directly transmitted to the abnormality detection device 230 or may be transmitted to the client terminal 210.
- the number, type, and arrangement of the sensor devices 205 may be appropriately selected depending on the abnormality detection target object.
- the sensor device 205 may be a camera mounted on a self-propelled robot that moves along the power transmission line
- the sensor device 205 may be a camera mounted on a device that processes the silicon wafer.
- the abnormality detection device 230 is a device for performing an abnormality detection process according to the embodiments of the present disclosure on an input image received from the sensor device 205 or the client terminal 210 and detecting the presence or absence of an abnormality. As illustrated in FIG. 2 , the abnormality detection device 230 includes an image input unit 232, a pre-processing unit 233, a gradient distribution generation unit 234, an abnormality determination unit 236, an output unit 238, and a storage unit 240.
- the image input unit 232 is a functional unit for inputting an input image indicating an abnormality detection target object.
- the image input unit 232 may receive, from the sensor device 205 or the client terminal 210, an input image indicating the appearance of an abnormality detection target object that serves as the target object to be subjected to abnormality detection via the communication network 225 and input the input image.
- the pre-processing unit 233 is a functional unit for performing pre-processing (area extraction and gray scale conversion) with respect to the input image received by the image input unit 232 in order to facilitate the abnormality detection processing according to the embodiments of the present disclosure.
- pre-processing unit 233 The details of the pre-processing performed by the pre-processing unit 233 will be described later with reference to FIG. 5 .
- the gradient distribution generation unit 234 is a functional unit that divides an input image into regions of a predetermined size and generates, for each region, a gradient distribution that indicates the distribution of a luminance gradient direction of the region.
- the gradient distribution represents a distribution in the gradient direction of the luminance, and includes various forms of expression such as maps and diagrams. As will be described later, by using the gradient distribution generated here, it is possible to detect the presence or absence of an abnormality with respect to an object appearing in a target with high accuracy without using AI, even in an environment in which luminance values and colors easily fluctuate.
- the abnormality determination unit 236 is a functional unit for determining the presence or absence of an abnormality by analyzing the gradient distribution generated for each region.
- the abnormality determination unit 236 may detect, from among each of the gradient distributions generated for each of the regions, a gradient direction that satisfies a predetermined frequency criterion as a distribution peak, and determine the presence or absence of an abnormality based on the detected distribution peak and a predetermined abnormality threshold set in advance.
- the abnormality determination unit may generate an average gradient distribution by averaging each gradient distribution generated for each of the regions, detect, in the average gradient distribution, a gradient direction that satisfies a predetermined frequency criterion as a distribution peak, and determine the presence or absence of an abnormality based on the detected distribution peak and a predetermined abnormality threshold set in advance.
- the abnormality determination unit may extract, from among each of the gradient distributions generated for each of the regions, a first gradient distribution corresponding to a first region and a second gradient distribution corresponding to a second region adjacent to the first region, determine a distribution divergence between the first gradient distribution and the second gradient distribution by comparing the first gradient distribution and the second gradient distribution, and determine the presence or absence of an abnormality based on the determined distribution divergence and a predetermined distribution divergence threshold set in advance.
- the storage unit 240 is a storage device for storing the various types of information used by the abnormality detection device 230.
- the storage unit 240 may store, for example, information of input images received from the sensor device 205 or the client terminal 210, information of abnormality notifications, and the like.
- the storage unit 240 may be, for example, a storage device such as a hard disk drive or a solid state drive mounted in the abnormality detection device 230, or may be a cloud-type storage area accessible from the abnormality detection device 230.
- the abnormality detection system 200 configured as described above, it is possible to provide a technique for detecting the presence or absence of an abnormality with respect to an object appearing in an analysis target image with high accuracy without using AI, even in an environment in which luminance values or colors are likely to fluctuate.
- the input image 360 is, for example, an image that was image captured by the sensor device 205 described with reference to FIG. 2 and that illustrates the appearance of a power transmission line.
- the input image 360 illustrated in FIG. 3 is an image that has already been subjected to pre-processing (area extraction, grayscale conversion, contrast correction, and area division) to facilitate the abnormality detection technique according to the embodiments of the present disclosure.
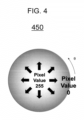
- Each pixel in the input image 360 has a luminance value of 0 to 255 as a value representing the luminance (brightness) of that pixel.
- a pixel closer to black has a lower luminance value
- the direction extending from higher luminance values to lower luminance values is referred to as a "gradient of the luminance” or a "luminance gradient.”
- the luminance gradient direction 365 of the block is illustrated for each of a plurality of blocks constituting the predetermined region 362 in the input image 360.
- the regions 362 are regions having a size in which at least one period of the pattern is contained.
- the gradient of the luminance is set such that the horizontal axis direction of the input image is 0 degrees, the counterclockwise direction represents positive values, and the clockwise direction represents negative values.
- the angle of the luminance gradient for each of a plurality of blocks constituting a specific region in an arbitrary input image can be represented using a consistent notation.
- FIG. 5 is a flowchart illustrating an example of a process 500 which shows the flow of the first half of the abnormality detection method according to the embodiments of the present disclosure.
- the process 500 illustrated in FIG. 5 is, for example, a process performed by the image input unit 232, the pre-processing unit 233, and the gradient distribution generation unit 234 in the abnormality detection device 230 illustrated in FIG. 2 .
- the image input unit (for example, the image input unit 232 illustrated in FIG. 2 ) inputs an input image.
- the image input unit may receive, from the sensor device or the client via the communication network, an input image that indicates the appearance of an abnormality detection target object that serves as the target object to be subjected to abnormality detection and input the received image.
- the input image here may be, for example, a RGB image.
- Step S530 the pre-processing unit performs grayscale conversion on the area of the input image extracted in Step S520.
- the pre-processing unit may use any existing technique, and is not particularly limited in the present disclosure. It should be noted that, although a case in which a color image is converted into gray scale is described as an example in the present disclosure, the present disclosure is not limited to this, and in a case in which there are features in the color information, the gradient analysis to be described later can be performed on each color channel of an RGB image.
- Step S540 the pre-processing unit performs contrast-correction on the image subjected to the grayscale conversion in Step S530.
- This contrast correction is a process performed to enhance the visibility of the image by enhancing the brightness and darkness of the image and making the shading clearer, and is not essential in the gradient analysis described later. Accordingly, Step S540 here may be skipped in cases where computing resources are limited, for example. However, it is desirable to perform the contrast correction because it makes it easier to visually confirm the results of the abnormality determination.
- the luminance gradient analysis processing is performed on an image subjected to the pre-processing such as area extraction and grayscale conversion, a high-quality abnormality determination result can be obtained.
- FIG. 6 is a flowchart illustrating an example of a process 600 which shows the flow of the second half of the abnormality detection method according to the embodiments of the present disclosure.
- the process 600 illustrated in FIG. 6 is a process of determining the presence or absence of an abnormality based on the distribution peak of the luminance gradient of the input image indicating the abnormality detection target object, and is, for example, a process performed following Step S550 of the process 500 in the first half of the abnormality detection process illustrated in FIG. 5 .
- FIG. 7 is a diagram illustrating an example of a gradient distribution according to the embodiments of the present disclosure.
- the gradient distribution generation unit divides the input image into a plurality of regions, and generates, for each region, a gradient distribution that indicates the distribution of the luminance gradient direction of the region.
- the gradient distribution is a data structure that indicates the frequency (number of times) distribution at which a predetermined gradient angle appears in a particular region, and may be represented as a histogram such as the gradient distribution 710 shown in FIG. 7 that shows the frequency per bin corresponding to different gradient angles in the range of -180 degrees to 180 degrees. In this way, a number of histograms equal to the number of regions can be acquired, such as the set of gradient distributions 720 shown in FIG. 7 .
- T means transpose and B is the number of bins in the histogram.
- the size of the region must be such as to include one or more periods of the design of the abnormality detection target object within the region.
- the characteristics of the normal state of the abnormality detection target can be represented by the gradient distribution.
- the abnormality determination unit detects the distribution peak in the gradient distribution.
- the distribution peak refers to a gradient angle having the highest frequency in the gradient distribution, and is a feature for determining whether or not an abnormality exists in the abnormality detection target.
- the distribution peak in the gradient distribution can be obtained by various methods, and is not particularly limited here.
- a gradient angle that satisfies a predetermined frequency criterion may be identified as the distribution peak from among the respective gradient distributions generated for each region.
- the predetermined frequency criterion may be a predetermined frequency set arbitrarily, or may be a criterion for specifying the gradient angle that has the highest frequency or the like (that is, to find the gradient direction that is the peak of the histogram for each region, and take the one with the highest frequency (number of occurrences) among the peak gradient directions as the peak).
- an average gradient distribution may be generated by averaging the respective gradient distributions generated for each region, and a gradient that satisfies a predetermined frequency criterion may be detected as the distribution peak in the average gradient distribution.
- the abnormality determination unit calculates an abnormality degree of each region based on the values corresponding to the gradients of the peaks detected in Step S620.
- the abnormality degree of each region is a value indicating a divergence degree (distribution divergence degree) of the gradient distribution of a specific region from the normal distribution.
- a feature value graph g obtained by the following Equations 7 and 8 may be used.
- the abnormality determination unit determines the presence or absence of an abnormality with respect to each region of the input image based on the abnormality degree calculated based on the distribution peak in Step S630 and a predetermined abnormality threshold set in advance.
- the abnormality threshold value is a value defining the boundary line between normal and abnormal, and may be set by a user, or may be automatically determined by the abnormality determination unit based on previous abnormality determination data.
- the abnormality determination unit determines that an abnormality exists with respect to this region, and in the case that the abnormality degree calculated for the specific region is a value less than the predetermined abnormality threshold value set in advance, the abnormality determination unit determines that an abnormality does not exist in the region.
- the output unit (for example, the output unit 238 illustrated in FIG. 2 ) outputs an abnormality notification indicating the result of the abnormality determination in Step S640.
- the abnormality notification may be an image indicating the abnormality degree calculated for each region in the input image.
- the abnormality notification may include an image that indicates the regions determined to be abnormal.
- the abnormality notification may include a heat map 730 that aggregates the set of gradient distributions 720 illustrated in FIG. 7 . In the heat map 730, the abnormality degree of each region in the input image is indicated by a color gradation.
- the abnormality notification generated in Step S650 may be transmitted to the client terminal via the communication network.
- FIG. 8 is a flowchart illustrating an example of a process 800 which shows the flow in the second half of the abnormality detection method according to the embodiments of the present disclosure.
- the process 800 illustrated in FIG. 8 is a process for detecting an abnormality using a method different from that of the process 600 illustrated in FIG. 6 , and is a process performed following Step S550 in the process 500 illustrated in FIG. 5 , for example, similarly to the process 600 illustrated in FIG. 6 .
- FIG. 9 is a diagram illustrating a concept of the process 800 illustrated in FIG. 8 . More particularly, the process 800 illustrated in FIG.
- FIG. 8 is a process of determining the presence or absence of an abnormality by comparing gradient distributions between adjacent regions in an input image that indicates an abnormality detection target object, and is performed by, for example, the gradient distribution generation unit 234, the abnormality determination unit 236, and the output unit 238 illustrated in FIG. 2 .
- the gradient distribution generation unit divides the input image into a plurality of regions, and generates, for each region, a gradient distribution that indicates the distribution of the luminance gradient direction of the region.
- the gradient distribution is a data structure that indicates the frequency (number of times) distribution at which a predetermined gradient angle appears in a particular region, and may be represented as a histogram such as the gradient distribution 710 shown in FIG. 7 that shows the frequency per bin corresponding to different gradient angles in the range of -180 degrees to 180 degrees. In this way, a number of histograms equal to the number of regions can be acquired, such as the set of gradient distributions 720 shown in FIG. 7 .
- Step S810 in the process 800 is substantially the same as Step S610 in the process 600 described with reference to FIG. 6 , the description thereof is omitted here.
- the abnormality determination unit extracts a gradient distribution corresponding to adjacent regions (hereinafter referred to as "adjacent regions") from among the respective gradient distributions generated for each region.
- the abnormality determination unit may extract a first gradient distribution corresponding to a first region and a second gradient distribution corresponding to a second region adjacent to the first region.
- the abnormality determination unit compares the gradient distributions of the adjacent regions extracted in Step S830, and determines the distribution divergence degree of these gradient distributions.
- the distribution divergence degree here is a value that indicates the distance of the gradient distributions, such that a larger distribution divergence degree of the gradient direction distribution indicates a larger difference from the gradient direction distribution of other regions. For example, as illustrated in FIG. 9 , from among the set of gradient distributions 910, the gradient distribution 911 and the gradient distribution 912 are compared, and the gradient distribution 913 and the gradient distribution 914 are compared.
- W represents the width of the region (in terms of the number of pixels or the number of blocks)
- H represents the height of the area (in terms of the number of pixels or the number of blocks).
- Equation 15 ⁇ P n log P n P n + 1
- adjacent regions are because there is a high possibility that distortions of the camera, lighting conditions, and the like are the same in adjacent regions, and any combination of regions may be used as long as it is a comparison between regions in which the appearance patterns are estimated to be the same in normal conditions.
- the abnormality determination unit determines that an abnormality exists with respect to these adjacent regions, and in the case that the distribution divergence degree calculated for the specific adjacent regions is a value less than the predetermined distribution divergence threshold value set in advance, the abnormality determination unit determines that an abnormality does not exist in the adjacent regions.
- Step S850 the output unit (for example, the output unit 238 illustrated in FIG. 2 ) outputs an abnormality notification indicating the results of the abnormality determination in Step S840.
- Step S850 in the process 800 is substantially the same as Step S650 in the process 600 described with reference to FIG. 6 , and therefore the explanation thereof is omitted here.
- 200 Abnormality detection system
- 205 Sensor device
- 210 Client terminal
- 225 Communication network
- 230 Abnormality detection device
- 232 Image input unit
- 233 Pre-processing unit
- 234 Gradient distribution generation unit
- 236 Abnormality determination unit
- 238 Output unit
- 240 Storage unit
Landscapes
- Engineering & Computer Science (AREA)
- Quality & Reliability (AREA)
- Computer Vision & Pattern Recognition (AREA)
- Physics & Mathematics (AREA)
- General Physics & Mathematics (AREA)
- Theoretical Computer Science (AREA)
- Image Analysis (AREA)
Applications Claiming Priority (1)
| Application Number | Priority Date | Filing Date | Title |
|---|---|---|---|
| PCT/JP2020/036301 WO2022064639A1 (fr) | 2020-09-25 | 2020-09-25 | Dispositif de détection d'anomalies, procédé de détection d'anomalies et système de détection d'anomalies |
Publications (2)
| Publication Number | Publication Date |
|---|---|
| EP4220545A1 true EP4220545A1 (fr) | 2023-08-02 |
| EP4220545A4 EP4220545A4 (fr) | 2024-07-17 |
Family
ID=80846340
Family Applications (1)
| Application Number | Title | Priority Date | Filing Date |
|---|---|---|---|
| EP20955233.0A Pending EP4220545A4 (fr) | 2020-09-25 | 2020-09-25 | Dispositif de détection d'anomalies, procédé de détection d'anomalies et système de détection d'anomalies |
Country Status (4)
| Country | Link |
|---|---|
| US (1) | US12561783B2 (fr) |
| EP (1) | EP4220545A4 (fr) |
| JP (1) | JP7410323B2 (fr) |
| WO (1) | WO2022064639A1 (fr) |
Families Citing this family (4)
| Publication number | Priority date | Publication date | Assignee | Title |
|---|---|---|---|---|
| CN115389624B (zh) * | 2022-10-27 | 2023-02-10 | 智能网联汽车(山东)协同创新研究院有限公司 | 一种加工用声波测试系统 |
| CN117611578B (zh) * | 2024-01-17 | 2024-06-11 | 深圳市新良田科技股份有限公司 | 一种图像处理方法及图像处理系统 |
| CN118552548B (zh) * | 2024-07-30 | 2024-10-25 | 江西省交通工程集团有限公司 | 一种基于图像数据分析的钢混组合梁质量检测方法及系统 |
| CN120912602B (zh) * | 2025-10-09 | 2026-01-27 | 江苏蔚蓝数智科技有限公司 | 基于计算机视觉的变压器铁芯检测方法 |
Family Cites Families (10)
| Publication number | Priority date | Publication date | Assignee | Title |
|---|---|---|---|---|
| JP2009079979A (ja) * | 2007-09-26 | 2009-04-16 | Toppan Printing Co Ltd | 周期性パターン試料検査装置 |
| JP5310485B2 (ja) | 2009-10-30 | 2013-10-09 | 富士通株式会社 | 画像処理方法及び装置並びにプログラム |
| JP5924735B2 (ja) | 2012-06-28 | 2016-05-25 | 国立大学法人九州工業大学 | 画像特徴抽出及び画像処理のためのシステム、方法及びプログラム |
| CN105574871A (zh) | 2015-12-16 | 2016-05-11 | 深圳市智影医疗科技有限公司 | 在放射图像中检测肺部局部性病变的分割分类方法和系统 |
| JP6932947B2 (ja) * | 2017-03-02 | 2021-09-08 | コニカミノルタ株式会社 | 不良画像発生予測システム及び不良画像発生予測プログラム |
| JP6960252B2 (ja) | 2017-06-20 | 2021-11-05 | 東日本旅客鉄道株式会社 | 画像分析装置及び鉄道設備部品の保守管理方法 |
| KR20190078685A (ko) * | 2017-12-13 | 2019-07-05 | (주) 엠투유테크널러지 | 점진적 군집화를 이용한 센서 데이터의 이상 패턴 감지 방법 |
| CN108109145A (zh) | 2018-01-02 | 2018-06-01 | 中兴通讯股份有限公司 | 图像质量检测方法、装置、存储介质和电子装置 |
| US11544499B2 (en) | 2018-09-18 | 2023-01-03 | Microsoft Technology Licensing, Llc | Classification of synthetic data tasks and orchestration of resource allocation |
| JP7463052B2 (ja) * | 2018-09-19 | 2024-04-08 | キヤノン株式会社 | 情報処理装置、情報処理システム、情報処理方法及びプログラム |
-
2020
- 2020-09-25 US US18/022,427 patent/US12561783B2/en active Active
- 2020-09-25 JP JP2022551522A patent/JP7410323B2/ja active Active
- 2020-09-25 EP EP20955233.0A patent/EP4220545A4/fr active Pending
- 2020-09-25 WO PCT/JP2020/036301 patent/WO2022064639A1/fr not_active Ceased
Also Published As
| Publication number | Publication date |
|---|---|
| US20230342903A1 (en) | 2023-10-26 |
| EP4220545A4 (fr) | 2024-07-17 |
| JPWO2022064639A1 (fr) | 2022-03-31 |
| WO2022064639A1 (fr) | 2022-03-31 |
| US12561783B2 (en) | 2026-02-24 |
| JP7410323B2 (ja) | 2024-01-09 |
Similar Documents
| Publication | Publication Date | Title |
|---|---|---|
| US12561783B2 (en) | Abnormality detection device, abnormality detection method, and abnormality detection system | |
| CN112669344B (zh) | 一种运动物体的定位方法、装置、电子设备及存储介质 | |
| US9524558B2 (en) | Method, system and software module for foreground extraction | |
| US9846932B2 (en) | Defect detection method for display panel based on histogram of oriented gradient | |
| US12165290B1 (en) | Image processing method and apparatus | |
| WO2022105019A1 (fr) | Procédé et appareil d'évaluation de qualité d'instantané pour dispositif à baïonnette de véhicule, et support lisible | |
| US10929676B2 (en) | Video recognition using multiple modalities | |
| CN110222694B (zh) | 图像处理方法、装置、电子设备及计算机可读介质 | |
| CN106683073B (zh) | 一种车牌的检测方法及摄像机和服务器 | |
| US20140029855A1 (en) | Image processing apparatus, image processing method, and program | |
| CN114220009B (zh) | 一种基于红外图像的导线风偏识别方法与系统 | |
| US20160196637A1 (en) | Raw sensor image and video de-hazing and atmospheric light analysis methods and systems | |
| JP2013042415A (ja) | 画像処理装置、画像処理方法及びコンピュータプログラム | |
| EP3579182A1 (fr) | Dispositif de traitement d'images, dispositif de reconnaissance d'images, programme de traitement d'images et programme de reconnaissance d'images | |
| JP2022185143A (ja) | テキスト検出方法、テキスト認識方法及び装置 | |
| CN112312001A (zh) | 一种图像检测的方法、装置、设备和计算机存储介质 | |
| US9747511B2 (en) | Image recognition device, image recognition method, program, and recording medium | |
| US20060067569A1 (en) | Image inspection device, image inspection method, and image inspection program | |
| CN114418968A (zh) | 一种基于深度学习的输电线路小目标缺陷检测方法 | |
| CN115719488B (zh) | 文本识别方法、装置、电子设备以及存储介质 | |
| CN105551044A (zh) | 一种图片对比方法和装置 | |
| CN113780294A (zh) | 文本字符分割的方法和装置 | |
| CN119478823A (zh) | 一种电力铁塔状态监测方法、装置、设备及存储介质 | |
| CN115953670B (zh) | 通信设备监测方法、装置、终端及存储介质 | |
| WO2025138741A1 (fr) | Procédé et appareil de détermination de l'état de précision d'une ligne, dispositif et support de stockage |
Legal Events
| Date | Code | Title | Description |
|---|---|---|---|
| STAA | Information on the status of an ep patent application or granted ep patent |
Free format text: STATUS: THE INTERNATIONAL PUBLICATION HAS BEEN MADE |
|
| PUAI | Public reference made under article 153(3) epc to a published international application that has entered the european phase |
Free format text: ORIGINAL CODE: 0009012 |
|
| STAA | Information on the status of an ep patent application or granted ep patent |
Free format text: STATUS: REQUEST FOR EXAMINATION WAS MADE |
|
| 17P | Request for examination filed |
Effective date: 20230323 |
|
| AK | Designated contracting states |
Kind code of ref document: A1 Designated state(s): AL AT BE BG CH CY CZ DE DK EE ES FI FR GB GR HR HU IE IS IT LI LT LU LV MC MK MT NL NO PL PT RO RS SE SI SK SM TR |
|
| DAV | Request for validation of the european patent (deleted) | ||
| DAX | Request for extension of the european patent (deleted) | ||
| A4 | Supplementary search report drawn up and despatched |
Effective date: 20240617 |
|
| RIC1 | Information provided on ipc code assigned before grant |
Ipc: G06T 7/00 20170101AFI20240611BHEP |