JP2014123302A - Display processor, display processing method, and display processing program - Google Patents
Display processor, display processing method, and display processing program Download PDFInfo
- Publication number
- JP2014123302A JP2014123302A JP2012279831A JP2012279831A JP2014123302A JP 2014123302 A JP2014123302 A JP 2014123302A JP 2012279831 A JP2012279831 A JP 2012279831A JP 2012279831 A JP2012279831 A JP 2012279831A JP 2014123302 A JP2014123302 A JP 2014123302A
- Authority
- JP
- Japan
- Prior art keywords
- unit
- data
- display
- graph
- stock price
- Prior art date
- Legal status (The legal status is an assumption and is not a legal conclusion. Google has not performed a legal analysis and makes no representation as to the accuracy of the status listed.)
- Pending
Links
Images




Landscapes
- Information Retrieval, Db Structures And Fs Structures Therefor (AREA)
- Controls And Circuits For Display Device (AREA)
- User Interface Of Digital Computer (AREA)
Abstract
【課題】ユーザによる容易なグラフ分析を実現すること。
【解決手段】本願に係る端末装置は、記憶部と、受付部と、取得部と、表示制御部とを有する。記憶部は、所定の単位毎のデータを記憶する。受付部は、第1単位毎のデータを示すグラフに対して、任意の位置を指定する操作を受け付ける。取得部153は、受付部151によって受け付けられた任意の位置に対応する、第1単位と異なる第2単位毎のデータを記憶部から取得する。表示制御部は、任意の位置における第1単位のデータの代わりに取得部153によって取得された第2単位毎のデータを表示制御するとともに、任意の位置以外の他の位置における第1単位毎のデータを表示制御する。
【選択図】図2To realize easy graph analysis by a user.
A terminal device according to the present application includes a storage unit, a reception unit, an acquisition unit, and a display control unit. The storage unit stores data for each predetermined unit. The accepting unit accepts an operation for designating an arbitrary position on the graph indicating the data for each first unit. The acquisition unit 153 acquires, from the storage unit, data for each second unit different from the first unit corresponding to an arbitrary position received by the reception unit 151. The display control unit performs display control of data for each second unit acquired by the acquisition unit 153 instead of the first unit data at an arbitrary position, and for each first unit at a position other than the arbitrary position. Control display of data.
[Selection] Figure 2
Description
本発明は、表示処理装置、表示処理方法及び表示処理プログラムに関する。 The present invention relates to a display processing device, a display processing method, and a display processing program.
従来、インターネット上で配信されるウェブページには、各種データ(例えば、株価や気温や人口)の変動や分布を示すグラフ(統計図表)が表示される場合がある。また、ウェブページに限られず、PC(Personal Computer)や携帯端末等に搭載されたアプリケーションが、データの変動や分布を示すグラフを表示する場合もある。 Conventionally, a web page distributed on the Internet may display a graph (statistical chart) showing fluctuations and distributions of various data (for example, stock price, temperature, and population). Further, not limited to web pages, an application installed in a PC (Personal Computer), a portable terminal, or the like may display a graph indicating data fluctuation and distribution.
このようなグラフには、同種のデータ(例えば、株価)を示す場合であっても、年毎のデータを示すグラフや、月毎のデータを示すグラフや、日毎のデータを示すグラフといったように、データを区切る単位が異なる複数種類のグラフが存在する。この種のグラフを閲覧するユーザは、データを区切る単位(例えば、年、月、日)を指定することで、所望の表示態様となるグラフを閲覧することが可能となる。 In such a graph, even when the same kind of data (for example, stock price) is shown, a graph showing data for each year, a graph showing data for every month, a graph showing data for every day, etc. There are multiple types of graphs with different units for separating data. A user who browses this type of graph can browse a graph having a desired display mode by designating a unit (for example, year, month, day) for separating data.
なお、グラフ表示に関する技術として、所定の時間単位毎のデータを示すグラフがクリックされた場合に、異なる時間単位毎のデータを示す新たなグラフを表示する技術が知られている。かかる技術では、クリックされた部分を中心とした新たなグラフを表示するので、ユーザによる詳細なデータ分析が可能になるとも考えられる。 As a technique related to graph display, a technique for displaying a new graph showing data for different time units when a graph showing data for each predetermined time unit is clicked is known. In such a technique, a new graph centered on the clicked portion is displayed, so that it is considered that detailed data analysis by the user becomes possible.
しかしながら、上記の従来技術では、ユーザにとって、グラフに示されるデータを分析することが困難となる場合があった。 However, with the above-described conventional technology, it may be difficult for the user to analyze the data shown in the graph.
株価の例を挙げて説明すると、上記の従来技術において、ユーザが、「1月」〜「12月」の月毎の株価を示すグラフを表示させた後に、かかるグラフの代わりに「5月」の日毎の株価を示すグラフを表示させたものとする。この例の場合、ユーザは、長期間に渡る株価変動を広く分析した後に、「5月」の株価変動を詳細に分析しているものと考えられる。このとき、ユーザは、長期間に渡る株価変動を参照しながら「5月」の日毎の株価を詳細に分析したい場合であっても、「5月」の日毎の株価を示すグラフしか閲覧できないので、かかる分析を行うことができない。また、ユーザは、仮に双方のグラフを表示させた場合であっても、異なるグラフを見比べることになるので、結局のところ長期間に渡る株価変動を参照しながら「5月」の日毎の株価を詳細に分析するといったことは困難となる。 An example of the stock price will be described. In the above-described conventional technology, after the user displays a graph showing the monthly stock price from “January” to “December”, “May” is used instead of the graph. It is assumed that a graph showing the daily stock price is displayed. In the case of this example, it is considered that the user analyzes the stock price fluctuation in “May” in detail after extensively analyzing the stock price fluctuation over a long period of time. At this time, even if the user wants to analyze the stock price of “May” every day in detail while referring to the stock price fluctuation over a long period of time, he can only view the graph showing the stock price of “May” every day. This analysis cannot be performed. In addition, even if both the graphs are displayed, the user compares the different graphs, so that the price of daily stock for “May” can be calculated by referring to the stock price fluctuation over a long period of time. Detailed analysis becomes difficult.
このようなことから、上記の従来技術では、データを区切る単位が異なる複数種類のグラフが表示可能な場合において、グラフ間の各種データを比較することが困難であるので、グラフに示されるデータを分析することが困難となる場合があった。 For this reason, in the above-described prior art, when a plurality of types of graphs having different units for separating data can be displayed, it is difficult to compare various data between the graphs. It was sometimes difficult to analyze.
本願は、上記に鑑みてなされたものであって、ユーザによる容易なグラフ分析を実現することができる表示処理装置、表示処理方法及び表示処理プログラムを提供することを目的とする。 The present application has been made in view of the above, and an object thereof is to provide a display processing device, a display processing method, and a display processing program that can realize easy graph analysis by a user.
本願に係る表示処理装置は、所定の単位毎のデータを記憶する記憶手段と、第1単位毎のデータを示すグラフに対して、任意の位置を指定する操作を受け付ける受付手段と、前記受付手段によって受け付けられた任意の位置に対応する、前記第1単位と異なる第2単位毎のデータを前記記憶手段から取得する取得手段と、前記任意の位置における前記第1単位のデータの代わりに前記取得手段によって取得された第2単位毎のデータを表示制御するとともに、前記任意の位置以外の他の位置における前記第1単位毎のデータを表示制御する表示制御手段とを備えることを特徴とする。 The display processing apparatus according to the present application includes a storage unit that stores data for each predetermined unit, a reception unit that receives an operation for designating an arbitrary position with respect to a graph indicating data for each first unit, and the reception unit Acquisition means for acquiring data for each second unit different from the first unit corresponding to the arbitrary position received by the storage means, and the acquisition instead of the data of the first unit at the arbitrary position And display control means for controlling the display of the data for each second unit acquired by the means and for controlling the display of the data for each first unit at a position other than the arbitrary position.
実施形態の一態様によれば、ユーザによる容易なグラフ分析を実現することができるという効果を奏する。 According to one aspect of the embodiment, there is an effect that easy graph analysis by the user can be realized.
以下に、本願に係る表示処理装置、表示処理方法及び表示処理プログラムを実施するための形態(以下、「実施形態」と呼ぶ)について図面に基づいて詳細に説明する。なお、この実施形態により本願に係る表示処理装置、表示処理方法及び表示処理プログラムが限定されるものではない。また、以下の各実施形態において同一の部位には同一の符号を付し、重複する説明は省略される。また、各図面に株価のグラフを模式的に図示する場合があるが、このような株価のグラフは、実際にはローソク足等により表される株価チャートであってもよい。 Hereinafter, a display processing apparatus, a display processing method, and a display processing program according to the present application will be described in detail with reference to the drawings (hereinafter referred to as “embodiments”). Note that the display processing device, the display processing method, and the display processing program according to the present application are not limited to the embodiment. In the following embodiments, the same portions are denoted by the same reference numerals, and redundant description is omitted. In addition, there is a case in which a stock price graph is schematically shown in each drawing, but such a stock price graph may actually be a stock price chart represented by a candlestick or the like.
〔1.表示処理〕
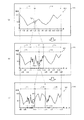
まず、図1を用いて、実施形態に係る表示処理について説明する。図1は、実施形態に係る表示処理の一例を示す図である。図1に示した端末装置100は、ユーザによって利用されるタブレット型端末であり、表示部120を有する。かかる端末装置100は、タッチパネルが採用されており、表示部120上を指等でタッチされることにより各種操作を受け付ける。なお、図1に示した端末装置100は、少なくとも日毎の株価データを保持しているものとする。
[1. Display processing)
First, display processing according to the embodiment will be described with reference to FIG. FIG. 1 is a diagram illustrating an example of display processing according to the embodiment. A
ここで、図1(a)に示した例のように、端末装置100が、月毎の株価を示すグラフG11を表示しているものとする。かかるグラフG11の縦軸は、株価を示す。また、グラフG11の横軸は、時間軸を示し、ここの例では月毎に区切られている。図1(a)の例では、グラフG11の横軸には、月毎の目盛として「1月」、「2月」、・・・、「12月」といった情報が表示される。
Here, as in the example illustrated in FIG. 1A, it is assumed that the
そして、端末装置100は、グラフG11に対して「5月」を示す位置P11を指等で指定した後に位置P11を横軸方向に広げるピンチアウト操作をユーザから受け付けたものとする。具体的には、端末装置100は、位置P11を図1(b)に示した幅L11まで広げるピンチアウト操作を受け付けたものとする。
Then, it is assumed that the
かかる場合に、端末装置100は、位置P11が示す「5月」に対応する株価として、グラフG11における横軸の単位「月」よりも細かい単位(ここでは、年月日の「日」とする)毎の株価を取得する。そして、端末装置100は、図1(b)に示すように、位置P11に表示されていた「5月」の株価の代わりに、「5月」の日毎の株価を表示制御する。
In this case, the
具体的には、端末装置100は、位置P11が幅L11まで広げられた領域の横軸に、グラフG11に表示されていた月毎の目盛と異なる単位の日毎の目盛(例えば、「5/1」、・・・、「5/31」)を表示する。このとき、端末装置100は、ピンチアウト操作に基づく幅に応じて、幅L11の領域に表示する横軸の目盛間隔を変化させる。例えば、端末装置100は、ピンチアウト操作において広げられた幅L11が広いほど横軸に広い目盛間隔を表示する。そして、端末装置100は、幅L11の領域に「5月」の日毎の株価を示すグラフを表示する。例えば、端末装置100は、幅L11の領域に表示した日毎の目盛に、各日に対応する株価をプロット(plot)することにより、「5月」の日毎の株価を表示する。
Specifically, the
また、端末装置100は、図1(b)に示すように、ユーザにより指定されていない「5月」以外の「1月」から「4月」までの株価と「6月」から「12月」までの株価とについては、グラフG11と同様に月毎に表示制御する。このようにして、端末装置100は、図1(b)に示すグラフG12を表示制御する。
In addition, as illustrated in FIG. 1B, the
なお、図1に示した例において、端末装置100は、ピンチアウト操作に基づく幅に応じて、幅L11の領域の横軸に表示する目盛を変動させてもよい。例えば、端末装置100は、幅L11が所定値よりも狭い場合には、日毎の目盛ではなく、所定の日数毎の目盛を(例えば、5日間毎の場合、「5/1」、「5/5」、・・など)を表示してもよい。
In the example illustrated in FIG. 1, the
また、図1に示した例では、図1(a)から図1(b)に画面遷移する例を示したが、端末装置100は、ピンチアウト操作が行われている最中においても、ユーザ操作と連動して図1(b)に示した表示態様を実現する。例えば、ユーザが2本指で位置P11を指定した後に、2本指を離れる方向にスライドさせた場合、端末装置100は、表示部120から2本指が離れるまで、2本指の間隔と連動して幅L11を変化させ、かかる幅L11の領域における横軸の目盛間隔も幅L11と連動して変化させながら「5月」の日毎の株価を示すグラフを表示する。
In the example illustrated in FIG. 1, an example in which the screen transitions from FIG. 1A to FIG. 1B is illustrated. However, the
このように、図1に例示した端末装置100は、ユーザにより指定された「5月」については、月毎の株価に置き換えて日毎の株価を表示し、指定されていない「1月」等については、月毎の株価のまま表示する。すなわち、端末装置100は、「5月」が指定された場合であっても、「5月」の日毎の株価だけを示すグラフを表示するのではなく、月毎の株価を示すグラフG11の中に、「5月」の日毎の株価を混在させて表示する。
As described above, the
このため、端末装置100のユーザは、複数のグラフを見比べることなく、グラフG12を閲覧するだけでよいので、長期間(1月〜4月、6月〜12月)に渡る株価と、「5月」の詳細な株価とを容易に比較することができる。このため、ユーザは、例えば、長期間(1月〜12月)に渡る株価変動を参照しながら、「5月」の日毎の株価を詳細に分析することができる。また、端末装置100のユーザは、グラフG12を閲覧することにより、「1月」〜「4月」の月毎の株価から「5月」の日毎の株価への変化や、「5月」の日毎の株価から「6月」〜「12月」の月毎の株価への変化を容易に把握することができるので、「5月」の株価を詳細に分析しながら、株価の長期的な推移を把握することもできる。以上のことから、実施形態に係る端末装置100は、ユーザによる容易なグラフ分析を実現することができる。以上、端末装置100の一態様を説明したが、以下に、他の態様を含めて端末装置100による処理について説明する。
For this reason, since the user of the
なお、図1(b)の例では、月毎の株価と日毎の株価とが接続されないグラフG12を示したが、端末装置100は、双方の株価が接続されたグラフを表示してもよい。以下では、全ての株価が接続されたグラフの例を用いて説明する。また、図1(b)の例において、端末装置100は、「4月」と「5月1日」とを横軸の同位置に配置してもよく、同様に、「6月」と「5月31日」とを横軸の同位置に配置してもよい。
Although the graph G12 in which the monthly stock price and the daily stock price are not connected is shown in the example of FIG. 1B, the
〔2.表示システムの構成〕
次に、図2を用いて、実施形態に係る表示システムについて説明する。図2は、実施形態に係る表示システム1の構成例を示す図である。図2に示すように、表示システム1には、サーバ装置10と、端末装置100とが含まれる。サーバ装置10と端末装置100とは、ネットワークNを介して、有線又は無線により通信可能に接続される。なお、図2では、表示システム1に、1台のサーバ装置10や端末装置100が含まれる例を示したが、表示システム1には、複数台のサーバ装置10や端末装置100が含まれてもよい。
[2. (Display system configuration)
Next, the display system according to the embodiment will be described with reference to FIG. FIG. 2 is a diagram illustrating a configuration example of the display system 1 according to the embodiment. As shown in FIG. 2, the display system 1 includes a
サーバ装置10は、ウェブサーバ等であり、端末装置100からの要求に応じて各種ウェブページを配信する。実施形態に係るサーバ装置10は、少なくとも株価のグラフが表示されるウェブページを提供することができるものとする。
The
〔3.端末装置の構成〕
端末装置100は、グラフ等の各種情報を表示することができる表示処理装置であり、例えば、タブレット型端末や、ノート型PC(Personal Computer)や、携帯電話機、PDA(Personal Digital Assistant)等である。なお、実施形態に係る端末装置100は、図1に示した例のように、タッチパネルが採用されたタブレット型端末であるものとする。かかる端末装置100は、図2に示すように、通信部110と、表示部120と、入力部130と、記憶部140と、制御部150とを有する。
[3. Configuration of terminal device]
The
(通信部110について)
通信部110は、ネットワークNに接続され、ネットワークNを介して、サーバ装置10との間で情報の送受信を行う。かかる通信部110は、ネットワークNとの接続を有線又は無線で行う。
(About the communication unit 110)
The
(表示部120、入力部130について)
表示部120は、各種情報を表示するための表示デバイスである。例えば、表示部120は、液晶ディスプレイ等によって実現される。入力部130は、ユーザから各種操作を受け付ける入力デバイスである。例えば、入力部130は、端末装置100の側壁等に備えられたハードキー等によって実現される。なお、実施形態に係る端末装置100にはタッチパネルが採用されているので、表示部120と入力部130の一部とは一体化される。
(About the
The
(記憶部140について)
記憶部140は、例えば、RAM(Random Access Memory)、フラッシュメモリ(Flash Memory)等の半導体メモリ素子、または、ハードディスク、光ディスク等の記憶装置によって実現される。かかる記憶部140は、所定の単位毎に、データを記憶する。実施形態に係る記憶部140は、分毎の株価を記憶するものとする。
(About the storage unit 140)
The
ここで、図3に、実施形態に係る記憶部140の一例を示す。図3に示すように、記憶部140は、「会社名」、「日時」、「株価」といった項目を有する。「会社名」は、株価が一般に公開されている株式会社の名称を示す。「日時」は、年月日時分秒のうち年月日時分を示す。「株価」は、「会社名」によって示される株式会社の分毎の株価を示す。
Here, FIG. 3 shows an example of the
例えば、図3では、会社名「A会社」の「2012年5月1日9時0分」における株価が「55円」であり、「2012年5月1日9時1分」における株価が「53円」であり、「2012年5月1日9時2分」における株価が「54円」である例を示している。 For example, in FIG. 3, the stock price of the company name “Company A” at “9:00 on May 1, 2012” is “55 yen”, and the stock price at “9: 1 on May 1, 2012” is In this example, the price is “53 yen” and the stock price at “9:02 on May 1, 2012” is “54 yen”.
なお、図3では、記憶部140が年月日時分毎に株価を記憶する例を示したが、この例に限られず、記憶部140は、年月日毎に株価を記憶してもよいし、年月日時毎に株価を記憶してもよいし、年月日時分秒毎に株価を記憶してもよい。
In addition, in FIG. 3, the
(制御部150について)
制御部150は、例えば、CPU(Central Processing Unit)やMPU(Micro Processing Unit)等によって、内部の記憶装置に記憶されているプログラム(表示処理プログラムの一例に相当)がRAMを作業領域として実行されることにより実現される。
(Regarding the controller 150)
In the
かかる制御部150は、図2に示すように、受付部151と、Web制御部152と、取得部153と、表示制御部154とを有し、以下に説明する情報処理の機能や作用を実現または実行する。なお、制御部150の内部構成は、図2に示した構成に限られず、後述する情報処理を行う構成であれば他の構成であってもよい。
As shown in FIG. 2, the
(受付部151について)
受付部151は、ユーザから各種操作を受け付ける。実施形態に係る受付部151は、端末装置100がタッチパネル式のタブレット型端末であるので、表示部120上を指等でタッチされることにより各種操作を受け付ける。例えば、受付部151は、図1(a)に例示したようなグラフG11に対して、任意の位置を指定した後にかかる位置を広げるピンチアウト操作や、任意の領域を指定した後にかかる領域を狭めるピンチイン操作であるマルチタッチ操作を受け付ける。
(About the reception unit 151)
The accepting
(Web制御部152について)
Web制御部152は、ユーザ操作に従って、サーバ装置10にアクセスすることによりウェブページを取得し、取得したウェブページを表示制御部154に出力する。かかるWeb制御部152は、例えば、ウェブブラウザと呼ばれるソフトウェア等によって実現される。
(About Web control unit 152)
The
ここで、実施形態に係るWeb制御部152は、所定の単位毎のデータを示すグラフが表示されるウェブページを取得する場合に、かかる所定の単位とは異なる単位毎のデータをサーバ装置10から取得する。例えば、Web制御部152は、図1(a)に示した例のように、月毎の株価を示すグラフが表示されるウェブページを取得する場合には、日毎や分毎や秒毎の株価をサーバ装置10から取得する。Web制御部152は、このようにサーバ装置10から取得した株価を記憶部140に格納する。
Here, when acquiring a web page on which a graph indicating data for each predetermined unit is displayed, the
なお、上記例において、Web制御部152は、ウェブページをサーバ装置10に要求する際に、日毎や分毎や秒毎の株価を送信するようにサーバ装置10に要求してもよい。または、この例に限られず、サーバ装置10は、Web制御部152からウェブページを要求された際に、日毎や分毎や秒毎の株価を自動的にWeb制御部152に送信してもよい。
In the above example, when requesting a web page from the
(取得部153について)
取得部153は、表示部120に表示されているグラフに対してピンチアウト操作等が行われた場合に、かかる操作に対応する単位毎のデータを記憶部140から取得する。具体的には、取得部153は、所定の単位(第1単位とする)毎のデータを示すグラフに対して、任意の位置を指定する操作が受付部151により受け付けられた場合に、かかる任意の位置におけるデータとして、第1単位とは異なる第2単位毎のデータを記憶部140から取得する。なお、取得部153による処理については図4〜図6を用いて後述する。
(About the acquisition unit 153)
When a pinch-out operation or the like is performed on the graph displayed on the
(表示制御部154について)
表示制御部154は、Web制御部152によってサーバ装置10から取得されたウェブページを表示部120に表示制御する。また、表示制御部154は、表示部120に表示されているグラフに対してピンチアウト操作等が行われた場合に、取得部153によって取得されたデータを用いて、データを区切る単位が異なるグラフを表示部120に表示制御する。
(About the display control unit 154)
The
具体的には、表示制御部154は、第1単位毎のデータを示すグラフに対して、任意の位置を指定する操作が受付部151により受け付けられた場合に、かかる任意の位置におけるデータの代わりに、取得部153によって取得された第2単位毎のデータを表示制御する。さらに、表示制御部154は、かかる任意の位置以外の他の位置におけるデータを第1単位毎に表示制御する。なお、表示制御部154による処理については図4〜図6を用いて後述する。
Specifically, when an operation for designating an arbitrary position is accepted by the accepting
〔4.グラフ表示例〕
次に、図4〜図6を用いて、実施形態に係る端末装置100によって表示制御されるグラフの一例について説明する。なお、以下では、記憶部140は図3に示した状態であるものとする。また、以下では、端末装置100によって、記憶部140に記憶されている会社名「A会社」における株価のグラフが表示されるものとする。また、以下に説明する各グラフは、2012年の株価を示すものとする。
[4. (Graph display example)
Next, an example of a graph whose display is controlled by the
〔4−1.グラフ表示例(1)〕
まず、図4を用いて、月毎の株価、日毎の株価、時毎(1時間毎)の株価を混在させて表示する例について説明する。最初に、表示部120には、図4(a)に示す例のように、月毎の株価を示すグラフG21が表示されているものとする。そして、受付部151は、グラフG21に対して「5月」を示す位置P21を指定した後に幅L21まで広げるピンチアウト操作を受け付けたものとする。
[4-1. Graph display example (1)]
First, an example in which the monthly stock price, the daily stock price, and the hourly (every hour) stock price are mixed and displayed will be described with reference to FIG. First, it is assumed that a graph G21 indicating a monthly stock price is displayed on the
このようなピンチアウト操作が受け付けられた場合に、取得部153は、位置P21が示す「5月」に対応する株価として、単位「月」よりも細かい単位「日」毎の「5月」の株価を記憶部140から取得する。ここで、図3に示すように、記憶部140には分毎の株価が格納されている。この場合、取得部153は、記憶部140から会社名「A会社」かつ日時「2012年5月」の株価を取得し、取得した株価の平均値を年月日毎に算出することにより、「5月」の日毎の株価を取得することができる。
When such a pinch-out operation is accepted, the
続いて、表示制御部154は、図4(b)に示すように、位置P21が幅L21まで広げられた後の領域に、取得部153によって取得された「5月」の日毎の株価を表示制御する。さらに、表示制御部154は、図4(b)に示すように、位置P21が幅L21まで広げられたことに応じて、「1月」〜「4月」の月毎の株価が表示されていた幅L12の領域を幅L22の領域に狭めた上で、狭めた領域に「1月」〜「4月」の株価を月毎に表示制御する。同様に、表示制御部154は、「6月」〜「12月」の月毎の株価が表示されていた幅L13の領域を幅L23の領域に狭め、狭めた領域に「6月」〜「12月」の株価を月毎に表示制御する。このようにして、表示制御部154は、図4(b)に示すグラフG22を表示制御する。
Subsequently, as shown in FIG. 4B, the
続いて、受付部151は、グラフG22に対して「5月21日」を示す位置P22を指定した後に幅L24まで広げるピンチアウト操作を受け付けたものとする。かかる場合に、取得部153は、「5月21日」に対応する株価として、単位「日」よりも細かい単位「時間」毎の株価を記憶部140から取得する。このとき、取得部153は、記憶部140から会社名「A会社」かつ日時「2012年5月21日」の株価を取得し、取得した株価の平均値を年月日時毎に算出することにより、「5月21日」の時毎の株価を求める。
Subsequently, it is assumed that the accepting
続いて、表示制御部154は、図4(c)に示すように、取得部153によって取得された「5月21日」における時毎の株価を幅L24の領域に表示制御する。さらに、表示制御部154は、図4(c)に示すように、位置P22が幅L24まで広げられたことに応じて、「5月21日」以外の「1月」〜「5月20日」が表示されていた幅L14の領域を幅L25の領域に狭め、狭めた領域に「1月」〜「4月」の株価を月毎に表示制御するとともに、「5月1日」〜「5月20日」の株価を日毎に表示制御する。同様に、表示制御部154は、図4(c)に示すように、幅L15の領域を幅L26の領域に狭め、狭めた領域に「5月22」〜「5月31日」の株価を日毎に表示制御するとともに、「6月」〜「12月」の株価を月毎に表示制御する。このようにして、表示制御部154は、図4(c)に示すグラフG23を表示制御する。
Subsequently, as illustrated in FIG. 4C, the
このように、実施形態に係る端末装置100は、ユーザによりピンチアウト操作が行われた場合に、指定された位置について元の表示態様よりも細かい単位毎の株価を表示し、新たに表示した株価について更にピンチアウト操作が行われた場合に、更に細かい単位毎の株価を表示する。これにより、端末装置100のユーザは、グラフG23を閲覧するだけで、長期間(1月〜12月)に渡る株価変動を参照しながら、「5月」の日毎の株価や、「5月21日」の時毎の株価などを詳細に分析することができる。また、端末装置100のユーザは、グラフG23を閲覧するだけで、「1月」〜「4月」の月毎の株価から「5月」の日毎の株価への変化や、「5月1日」〜「5月20日」の日毎の株価から「5月21日」の時毎の株価への変化を把握することができるので、日毎や時毎の株価を詳細に分析しながら、株価の長期的な推移を把握することができる。
As described above, the
なお、図4に示した例において、表示制御部154は、株価を区切る単位が異なる領域毎に、縦軸(すなわち、株価を示す横軸)の最大値を変動させてもよい。具体的には、表示制御部154は、領域毎に株価の最大値が表示可能なように、かかる領域における縦軸の最大値を決定してもよい。例えば、図4(c)に示すように、表示制御部154は、月毎及び日毎の株価を表示している幅L25及びL26の領域については、縦軸の最大値を「100」とし、時毎の株価を表示している幅L24の領域については、縦軸の最大値を「50」としてもよい。これにより、表示制御部154は、各領域に表示されるデータの推移を閲覧し易くすることができる。
In the example illustrated in FIG. 4, the
〔4−2.グラフ表示例(2)〕
次に、図5を用いて、複数の月毎及び日毎の株価を混在させて表示する例について説明する。最初に、表示部120には、図5(a)に示す例のように、月毎の株価を示すグラフG31が表示されているものとする。そして、受付部151は、グラフG31に対して「5月」を示す位置P31を指定した後に幅L31まで広げるピンチアウト操作を受け付けたものとする。この場合、表示制御部154は、図4の例と同様に、幅L31の領域に「5月」の日毎の株価を表示制御する。
[4-2. Graph display example (2)]
Next, an example in which a plurality of monthly and daily stock prices are mixed and displayed will be described with reference to FIG. First, it is assumed that a graph G31 indicating a monthly stock price is displayed on the
この後に、受付部151は、「10月」を示す位置P32を指定した後に幅L32まで広げるピンチアウト操作を受け付けたものとする。この場合、表示制御部154は、図5(b)に示すように、幅L32の領域に「10月」の日毎の株価を表示制御する。このとき、表示制御部154は、前述において表示制御した「5月」の日毎の株価についても表示したままとすることで、図5(b)に示すグラフG32を表示制御する。
Thereafter, it is assumed that the accepting
このように、実施形態に係る端末装置100は、ユーザにより複数の位置を指定してピンチアウト操作が行われた場合には、指定された各位置について細かい単位毎の株価を表示する。これにより、端末装置100のユーザは、グラフG32を閲覧するだけで、長期間(1月〜12月)に渡る株価変動を参照しながら、複数月における日毎の株価を詳細に分析することができる。
As described above, the
〔4−3.グラフ表示例(3)〕
次に、図6を用いて、ピンチイン操作を受け付けた場合における表示例について説明する。最初に、表示部120には、図6(a)に示す例のように、「8月1日」〜「11月30日」における日毎の株価を示すグラフG41が表示されているものとする。そして、受付部151は、グラフG41に対して、幅L41の領域が指定された後にかかる領域を狭めるピンチイン操作を受け付けたものとする。具体的には、受付部151は、ユーザから、一方の指で「9月1日」を示す位置P41が指定され、他方の指で「10月31日」を示す位置P42が指定された後に、双方の指を幅L42まで狭めるピンチイン操作を受け付ける。このとき、受付部151は、「9月1日」〜「10月31日」の領域に含まれる各位置を、ユーザが指定した位置として受け付ける。
[4-3. Graph display example (3)]
Next, a display example when a pinch-in operation is received will be described with reference to FIG. First, as shown in the example shown in FIG. 6A, a graph G41 indicating daily stock prices from “August 1” to “November 30” is displayed on the
このようなピンチイン操作が受け付けられた場合に、取得部153は、ユーザにより指定された「9月1日」〜「10月31日」に対応する株価として、単位「日」よりも粗い単位「月」毎の株価を記憶部140から取得する。すなわち、取得部153は、「9月」及び「10月」の月毎の株価を記憶部140から取得する。
When such a pinch-in operation is accepted, the
続いて、表示制御部154は、図6(b)に示すように、取得部153によって取得された「9月」及び「10月」の月毎の株価を幅L42の領域に表示制御する。さらに、表示制御部154は、図6(b)に示すように、幅L41の領域が狭められたことに応じて、「8月1日」〜「8月31日」の日毎の株価が表示されていた幅L43の領域を幅L45の領域に広げた上で、広げた領域に「8月1日」〜「8月31日」の株価を日毎に表示制御する。同様に、表示制御部154は、「11月1日」〜「11月30日」の日毎の株価が表示されていた幅L44の領域を幅L46の領域に狭め、狭めた領域に「11月1日」〜「11月30日」の株価を日毎に表示制御する。このようにして、表示制御部154は、図6(b)に示すグラフG42を表示制御する。
Subsequently, as illustrated in FIG. 6B, the
このように、実施形態に係る端末装置100は、ユーザによりピンチイン操作が行われた場合に、指定された領域について元の表示態様よりも粗い単位毎の株価を表示する。これにより、端末装置100のユーザは、日毎の株価を詳細に分析している最中に、月毎の株価の推移を閲覧することができる。
As described above, the
なお、表示制御部154は、広げた領域(幅L45や幅L46の領域)に、グラフG41と同様の日付に対応する株価を表示するのではなく、領域が広げられたことに応じて、新たな日付の株価を表示してもよい。例えば、図6(b)に示した例において、表示制御部154は、幅L45の領域に「7月1日」〜「8月31日」における日毎の株価を表示してもよいし、幅L46の領域に「11月1日」〜「12月31日」における日毎の株価を表示してもよい。
Note that the
また、表示制御部154は、グラフG42に対して、「9月」や「10月」を指定した上でピンチアウト操作が行われた場合には、図4に示した例と同様に、「9月」や「10月」の日毎の株価を再度表示する。このように、端末装置100のユーザは、異なる単位毎の株価を表示させた後に、元の単位毎の株価に再度表示させることができる。
In addition, when a pinch-out operation is performed on the graph G42 after specifying “September” or “October”, the
〔5.表示処理手順〕
次に、図7を用いて、実施形態に係る端末装置100によるグラフ表示処理について説明する。図7は、実施形態に係る端末装置100によるグラフ表示処理を示すフローチャートである。なお、図7では、株価のグラフを示すウェブページを表示する例について説明する。
[5. (Display processing procedure)
Next, the graph display process by the
図7に示すように、端末装置100の受付部151は、ウェブページへのアクセス操作を受け付けたか否かを判定する(ステップS101)。そして、受付部151は、アクセス操作を受け付けていない場合には(ステップS101;No)、アクセス操作を受け付けるまで待機する。
As illustrated in FIG. 7, the
一方、Web制御部152は、受付部151によってアクセス操作が受け付けられた場合には(ステップS101;Yes)、サーバ装置10にアクセスすることでウェブページを取得する(ステップS102)。ここでは、Web制御部152は、第1単位毎の株価を示すグラフが表示されるウェブページを取得するものとする。
On the other hand, when the access operation is accepted by the accepting unit 151 (step S101; Yes), the
続いて、Web制御部152は、サーバ装置10から最小単位毎(例えば、分毎や秒毎)の株価を取得し(ステップS103)、取得した最小単位毎(例えば、分毎や秒毎)の株価を記憶部140に格納する。
Subsequently, the
続いて、表示制御部154は、Web制御部152によって取得されたウェブページを表示部120に表示制御する(ステップS104)。すなわち、表示制御部154は、時間軸が第1単位毎に区切られて第1単位毎の株価を示すグラフを表示部120に表示する。
Subsequently, the
続いて、受付部151は、表示部120に表示されているグラフに対してピンチ操作(ピンチアウト操作又はピンチイン操作)を受け付けたか否かを判定する(ステップS105)。そして、取得部153は、受付部151によってピンチ操作が受け付けられた場合に(ステップS105;Yes)、記憶部140から第2単位毎の株価を取得する(ステップS106)。例えば、取得部153は、ピンチアウト操作が受け付けられた場合には、第1単位よりも細かい第2単位毎の株価を取得し、ピンチイン操作が受け付けられた場合には、第1単位よりも粗い第2単位毎の株価を取得する。
Subsequently, the
そして、Web制御部152は、第1単位毎の株価と第2単位毎の株価とが混在されたグラフを表示部120に表示制御する(ステップS107)。具体的には、Web制御部152は、ピンチ操作で指定された領域に第2単位毎の株価を表示制御し、ピンチ操作で指定されなかった領域については、ステップS104において表示していた第1単位毎の株価を表示制御する。
Then, the
〔6.効果〕
上述してきたように、実施形態に係る端末装置100は、記憶部140と、受付部151と、取得部153と、表示制御部154とを有する。記憶部140は、所定の単位毎のデータ(例えば、株価)を記憶する。受付部151は、所定の軸(例えば、横軸)が第1単位毎に区切られて第1単位毎のデータを示すグラフに対して、任意の位置を指定する操作を受け付ける。取得部153は、受付部151によって受け付けられた任意の位置におけるデータとして、第1単位と異なる第2単位毎のデータを記憶部140から取得する。表示制御部154は、任意の位置におけるデータの代わりに取得部153によって取得された第2単位毎のデータを表示制御するとともに、任意の位置以外の他の位置におけるデータを第1単位毎に表示制御する。
[6. effect〕
As described above, the
これにより、実施形態に係る端末装置100は、長期間に渡るデータの変動や分布と、詳細なデータの変動や分布とが示される単一のグラフを表示することができる。このため、ユーザは、例えば、長期間に渡る全体的なデータ変動を参照しながら、短期間における詳細なデータ変動を分析することができる。この結果、実施形態に係る端末装置100は、ユーザによる容易なグラフ分析を実現することができる。
Thereby, the
また、実施形態に係る端末装置100において、受付部151は、任意の位置を指定した後に任意の位置を広げる操作を受け付ける。また、取得部153は、任意の位置におけるデータとして、第1単位よりも細かい単位である第2単位毎のデータを記憶部140から取得する。また、表示制御部154は、任意の位置が広げられた後の領域に、取得部153によって取得された第2単位毎のデータを表示制御するとともに、任意の位置が広げられたことに応じて他の位置におけるデータが表示されていた領域を狭めた上で、狭めた領域に他の位置におけるデータを第1単位毎に表示制御する。
Moreover, in the
これにより、実施形態に係る端末装置100は、ピンチアウト操作が行われた場合に、指定された領域について元の表示態様よりも細かい単位毎のデータを表示する。これにより、端末装置100のユーザは、長期間に渡る全体的なデータ変動を分析している最中に、短期間における詳細なデータ変動を分析することができる。この結果、実施形態に係る端末装置100は、ユーザによる容易なグラフ分析を実現することができる。
Thereby, the
また、実施形態に係る端末装置100において、受付部151は、任意の領域が指定されることで任意の領域に含まれる各位置を任意の位置として受け付けるとともに、任意の領域を狭める操作を受け付ける。取得部153は、任意の領域におけるデータとして、第1単位よりも粗い単位である第2単位毎のデータを記憶部140から取得する。表示制御部154は、任意の領域が狭められた後の領域に、取得部153によって取得された第2単位毎のデータを表示制御するとともに、任意の領域が狭められたことに応じて任意の領域以外の領域を広げた上で、広げた領域に他の位置におけるデータを第1単位毎に表示制御する。
In the
このように、実施形態に係る端末装置100は、ピンチイン操作が行われた場合に、指定された領域について元の表示態様よりも粗い単位毎のデータを表示する。これにより、端末装置100のユーザは、短期間における詳細なデータ変動を分析している最中に、長期間に渡る全体的なデータ変動を分析することができる。この結果、実施形態に係る端末装置100は、ユーザによる容易なグラフ分析を実現することができる。
Thus, when the pinch-in operation is performed, the
〔7.変形例〕
上述した実施形態に係る端末装置100は、上記実施形態以外にも種々の異なる形態にて実施されてよい。そこで、以下では、上記の端末装置100の他の実施形態について説明する。
[7. (Modification)
The
〔7−1.グラフ表示の変形例(1)〕
上記実施形態では、第1単位毎の株価を示すグラフに対して任意の位置が指定された場合、第1単位毎の株価と第2単位毎の株価を混在させて表示する例を示した。しかし、端末装置100は、第1単位毎の株価と第2単位毎の株価との間に、第1単位と第2単位との間の第3単位毎の株価を表示してもよい。
[7-1. Modification of graph display (1)]
In the above embodiment, when an arbitrary position is specified for the graph showing the stock price for each first unit, the stock price for each first unit and the stock price for each second unit are displayed together. However, the
この点について図8を用いて説明する。図8は、実施形態に係る端末装置100によって表示制御されるグラフの一例を示す図である。図8に示すように、受付部151は、月毎の株価を示すグラフG51に対して位置P51(「6月」)を指定した後に幅L51まで広げるピンチアウト操作を受け付けたものとする。
This point will be described with reference to FIG. FIG. 8 is a diagram illustrating an example of a graph whose display is controlled by the
かかる場合に、取得部153は、「6月」の日毎の株価を記憶部140から取得する。さらに、取得部153は、ユーザにより指定された「6月」から所定値だけ離れた他の月までのデータとして、単位「月」と単位「日」の間の単位毎(ここでは、「10日間」毎とする)の株価を記憶部140から取得する。図8の例では、取得部153は、「6月」より1ヶ月前の「5月」の株価として、10日間毎の平均株価を取得し、さらに、「6月」から1ヶ月後の「7月」の株価として、10日間毎の平均株価を取得する。
In such a case, the
そして、表示制御部154は、図4等に示した処理と同様に、取得部153によって取得された「6月」の日毎の株価を幅L51の領域に表示制御する。また、表示制御部154は、図8(b)に示すように、幅L51の領域に隣接する幅L52の領域に「5月」における10日間毎の平均株価を表示制御し、幅L53の領域に「7月」における10日間毎の平均株価を表示制御する。さらに、表示制御部154は、幅L52の領域に隣接する幅L54の領域に「1月」〜「4月」の月毎の株価を表示制御し、幅L55の領域に「8月」〜「12月」の月毎の株価を表示制御する。このようにして、表示制御部154は、図8(b)に示すグラフG52を表示制御する。
Then, the
このように、実施形態に係る端末装置100は、横軸(時間軸)を区切る単位が段階的になるように株価を表示制御する。これにより、端末装置100のユーザは、株価の推移が滑らかに表されたグラフを閲覧することができるので、株価を容易に分析することができる。
Thus, the
〔7−2.グラフ表示の変形例(2)〕
また、上記実施形態では、単一のグラフを表示する例を示したが、端末装置100は、複数のグラフを表示し、ユーザ操作を複数のグラフ間で連動させてもよい。この点について図9を用いて説明する。図9は、実施形態に係る端末装置100によって表示制御されるグラフの一例を示す図である。図9に示すように、表示部120には、「A会社」、「B会社」及び「C会社」の株価が並列表示されているものとする。この状態において、受付部151は、3個のグラフのうち「A会社」の株価を示すグラフに対して位置P61(「5月」)を広げるピンチアウト操作を受け付けたものとする。
[7-2. Modification of graph display (2)]
Moreover, although the example which displays a single graph was shown in the said embodiment, the
かかる場合に、取得部153は、「A会社」における「5月」の日毎の株価を記憶部140から取得する。さらに、取得部153は、「A会社」以外の「B会社」及び「C会社」についても、「5月」の日毎の株価を記憶部140から取得する。
In such a case, the
そして、表示制御部154は、図9(b)に示すように、「A会社」の株価を示すグラフとして、「5月」の日毎の株価と、「1月」〜「4月」及び「6月」〜「12月」の月毎の株価を表示制御する。また、表示制御部154は、図9(b)に示すように、「B会社」及び「C会社」の株価を示すグラフについても、「A会社」と同様に、「5月」の日毎の株価と、「1月」〜「4月」及び「6月」〜「12月」の月毎の株価を表示制御する。すなわち、表示制御部154は、ユーザによってピンチアウト操作が行われていない「B会社」及び「C会社」のグラフについても、「A会社」のグラフに対して行われた操作と同様の操作が行われたものとして表示処理を行う。
Then, as shown in FIG. 9B, the
このように、実施形態に係る端末装置100は、複数のグラフを表示している場合に、1個のグラフに対して行われた操作を他のグラフにも連動させる。これにより、端末装置100のユーザは、複数のグラフを並列表示させた場合に、1個のグラフに対してピンチアウト操作等を行うだけで、各グラフにおいて関連性のある位置(図9の例では「5月」)を同様の表示態様とすることができるので、関連性のある位置について同様の分析(図9の例では詳細な分析)を行うことができる。
As described above, when the
なお、図9では、ピンチアウト操作を例に挙げて説明したが、実施形態に係る端末装置100は、複数のグラフを表示している場合に、1個のグラフに対してピンチイン操作を受け付けた場合であっても、かかるピンチイン操作を他のグラフに連動させてもよい。
In FIG. 9, the pinch-out operation is described as an example, but the
〔7−3.グラフ表示の変形例(3)〕
また、図9の例では、複数のグラフ間でユーザ操作を連動させる例を示したが、端末装置100は、単一のグラフ内でユーザ操作を連動させてもよい。この点について図10を用いて説明する。図10は、実施形態に係る端末装置100によって表示制御されるグラフの一例を示す図である。図10(a)に示すように、表示部120には、「5月」の日毎の株価が表示されているものとする。この状態において、受付部151は、位置P71(「5月14日(日曜日)」)を広げるピンチアウト操作を受け付けたものとする。
[7-3. Modification of graph display (3)]
Further, in the example of FIG. 9, an example in which user operations are linked between a plurality of graphs has been shown, but the
かかる場合に、取得部153は、「5月14日(日曜日)」の時毎の株価を記憶部140から取得する。さらに、取得部153は、「5月14日(日曜日)」に対応する日の株価として、5月の各日曜日における時毎の株価を記憶部140から取得する。すなわち、取得部153は、「5月7日(日曜日)」における時毎の株価と、「5月21日(日曜日)」における時毎の株価と、「5月28日(日曜日)」における時毎の株価とを記憶部140から取得する。
In such a case, the
そして、表示制御部154は、図10(b)に示すように、「5月7日」、「5月14日」、「5月21日」及び「5月28日」については時毎の株価を表示制御し、その他の日については図10(a)と同様に日毎の株価を表示制御する。
Then, as shown in FIG. 10B, the
このように、実施形態に係る端末装置100は、所定の位置に対してユーザ操作が行われた場合に、かかる所定の位置に対応する他の位置に対してもユーザ操作を連動させる。これにより、端末装置100のユーザは、所定の位置に対してピンチアウト操作等を行って詳細な分析を行う場合に、対応する他の位置(図10の例では「日曜日」)についても詳細な分析を行うことができる。
As described above, when a user operation is performed on a predetermined position, the
なお、図10では、ピンチアウト操作を例に挙げて説明したが、実施形態に係る端末装置100は、所定の位置に対してピンチイン操作を受け付けた場合であっても、かかるピンチイン操作を他の位置に連動させてもよい。
In FIG. 10, the pinch-out operation has been described as an example. However, the
〔7−4.操作幅と単位の連動〕
また、上記実施形態において、端末装置100は、ユーザから受け付けた操作後の幅に応じて、第2単位を決定してもよい。具体的には、取得部153は、受付部151によってピンチアウト操作が受け付けられた場合に、広げられた後の幅が広いほど第2単位を細かい単位とし、受付部151によってピンチイン操作が受け付けられた場合に、狭められた後の幅が狭いほど第2単位を粗い単位とし、かかる第2単位毎の株価を記憶部140から取得してもよい。例えば、図4(a)に示した例において、取得部153は、「5月」に対するピンチアウト操作後の幅が第1閾値以上である場合に、10日間毎の平均株価を記憶部140から取得し、ピンチアウト操作後の幅が第2閾値(第2閾値>第1閾値)以上である場合に、日毎の株価を記憶部140から取得してもよい。これにより、端末装置100のユーザは、感覚的な操作によって所望する単位毎の株価を閲覧することができる。
[7-4. Linking operation width and unit)
Moreover, in the said embodiment, the
〔7−5.操作幅の下限〕
また、上記実施形態において、端末装置100は、ユーザから受け付けた操作後の幅が所定の下限閾値以上である場合に、第2単位毎の株価を記憶部140から取得し、異なる単位毎の株価を表示させてもよい。言い換えれば、端末装置100は、操作後の幅が下限閾値よりも小さい場合には、表示態様を変化させなくてもよい。これにより、端末装置100は、操作後の幅が狭い場合に、かかる狭い幅の領域に日毎の株価等を表示しないので、煩雑なグラフが表示されることを防止できる。
[7-5. (Lower limit of operation width)
Moreover, in the said embodiment, the
〔7−6.グラフ〕
また、上記実施形態では、株価の変動を示すグラフを例に挙げて説明したが、この例に限られない。端末装置100は、ユーザの体重や歩数や血圧等のヘルスデータの変動を示すグラフについても上述してきた表示処理を行うことができる。また、例えば、端末装置100は、電圧と電流との関係を示すグラフや、1日の行動予定(又は、行動実績)を示すグラフについても上述してきた表示処理を行うことができる。
[7-6. Graph〕
In the above embodiment, the graph showing the fluctuation of the stock price has been described as an example, but the present invention is not limited to this example. The
また、上記実施形態では、折れ線グラフを例に挙げて説明したが、この例に限られない。例えば、端末装置100は、棒グラフ、関数グラフ、円グラフ、散布図等についても上述してきた表示処理を行うことができる。また、例えば、端末装置100は、2次元のグラフに限られず、3次元で表現されるグラフについても上述してきた表示処理を行うことができる。
In the above embodiment, a line graph has been described as an example, but the present invention is not limited to this example. For example, the
〔7−7.ピンチ操作〕
また、上記実施形態では、横軸方向に広げる(又は、狭める)ピンチ操作を受け付ける例を示したが、この例に限られない。例えば、端末装置100は、縦軸方向に広げる(又は、狭める)ピンチ操作を受け付けてもよい。一例を挙げて説明すると、例えば、端末装置100は、縦軸が電流値を示し、横軸が電圧値を示すグラフを表示しているものとする。このとき、端末装置100は、縦軸方向に広げる(又は、狭める)ピンチ操作を受け付けた場合には、電流値を区切る単位が混在したグラフを表示する。
[7-7. (Pinch operation)
Moreover, although the example which receives the pinch operation expanded (or narrowed) to a horizontal-axis direction was shown in the said embodiment, it is not restricted to this example. For example, the
また、上記実施形態では、グラフ上の位置が指定される操作を受け付ける例を示したが、この例に限られない。例えば、図1の例において、端末装置100は、グラフG11上の位置P11自体が指定されなくても、位置P11の近傍や、位置P11から縦軸方向に延伸した直線上のいずれかの位置が指定された場合であっても、「5月」が指定されたものとして操作を受け付けてもよい。
In the above embodiment, an example in which an operation for designating a position on the graph is received is shown, but the present invention is not limited to this example. For example, in the example of FIG. 1, even if the position P11 itself on the graph G11 is not specified, the
また、端末装置100は、ピンチ操作ではなくグラフ上の任意の位置がタッチされる操作だけを受け付けてもよい。この場合、端末装置100は、タッチされた位置について細かい(又は粗い)単位毎のデータを表示する。このとき、端末装置100は、新たに表示するデータの表示領域の幅については、所定の固定値としてもよいし、タッチされた時間等に応じて変動させてもよいし、ダブルタッチ等の操作に応じて変動させてもよい。
Further, the
〔7−8.ログ表示〕
また、上記実施形態において、端末装置100は、グラフ上の位置に対して所定の操作(ダブルタッチ等)が行われた場合に、かかる位置を示す日付に対応する行動実績を表示してもよい。例えば、端末装置100は、縦軸が体重を示し、横軸が時間軸を示すグラフを表示しているものとする。そして、端末装置100は、例えばグラフ上の「5月21日」に対して所定の操作が行われた場合に、「5月21日」におけるユーザの行動実績(運動有無、外食有無などを示す情報)をポップアップ等により表示してもよい。これにより、端末装置100のユーザは、グラフ上のデータと自身の行動実績とを比較することが可能となる。なお、この場合、端末装置100は、日付毎に、ユーザの行動実績を所定の記憶部の記憶しておく。
[7-8. (Log display)
Moreover, in the said embodiment, the
また、上記例において、端末装置100は、グラフ上の位置に対して所定の操作が行われた場合に、かかる位置を示す日付に対応するニュースや出来事を表示してもよい。例えば、端末装置100は、株価を示すグラフを表示している場合に、株価変動に起因するような、経済ニュース、政治ニュース、国際ニュース等を表示してもよい。これにより、端末装置100のユーザは、株価を閲覧しながらニュースや出来事を参照することができるので、より効果的な株価分析を行うことができる。
In the above example, when a predetermined operation is performed on a position on the graph, the
〔7−9.動作主体〕
また、上記実施形態では、端末装置100が、サーバ装置10からグラフが表示されるウェブページと、株価データを取得する例を示した。しかし、端末装置100は、グラフに表示される各種データや、グラフを表示するためのアプリケーションを搭載し、かかるアプリケーションによる動作によって上述してきた表示処理を行うことができる。例えば、端末装置100は、ユーザから日々の体重や歩数等の入力を受け付け、記憶部140に保持しておく。そして、端末装置100は、ユーザ操作に従って、上述してきた表示処理を行うことができる。
[7-9. Action subject)
Moreover, in the said embodiment, the
また、端末装置100が、上述してきた表示処理を行うのではなく、サーバ装置10が上述してきた表示処理を行ってもよい。具体的には、サーバ装置10は、端末装置100からユーザ操作の内容を受け付け、かかるユーザ操作の内容に応じて、上述してきた端末装置100による表示処理と同様の処理を行うことでグラフを生成し、生成したグラフが表示されるウェブページを端末装置100に送信してもよい。なお、ユーザ操作の内容とは、例えば、ピンチアウト操作又はピンチイン操作のいずれであるかを示す情報や、グラフ上でユーザに指定された位置や、操作後の幅等が含まれる。
In addition, the
〔7−10.その他〕
また、上記実施形態において説明した各処理のうち、自動的に行われるものとして説明した処理の全部または一部を手動的に行うこともでき、あるいは、手動的に行われるものとして説明した処理の全部または一部を公知の方法で自動的に行うこともできる。この他、上記文書中や図面中で示した処理手順、具体的名称、各種のデータやパラメータを含む情報については、特記する場合を除いて任意に変更することができる。例えば、各図に示した各種情報は、図示した情報に限られない。
[7-10. Others]
In addition, among the processes described in the above embodiment, all or part of the processes described as being automatically performed can be performed manually, or the processes described as being performed manually can be performed. All or a part can be automatically performed by a known method. In addition, the processing procedures, specific names, and information including various data and parameters shown in the document and drawings can be arbitrarily changed unless otherwise specified. For example, the various types of information illustrated in each drawing is not limited to the illustrated information.
また、図示した各装置の各構成要素は機能概念的なものであり、必ずしも物理的に図示の如く構成されていることを要しない。すなわち、各装置の分散・統合の具体的形態は図示のものに限られず、その全部または一部を、各種の負荷や使用状況などに応じて、任意の単位で機能的または物理的に分散・統合して構成することができる。例えば、上記実施形態において、端末装置100は、タッチパネルが採用されている必要はなく、マウス等で各種ユーザ操作を受け付けてもよい。
Further, each component of each illustrated apparatus is functionally conceptual, and does not necessarily need to be physically configured as illustrated. In other words, the specific form of distribution / integration of each device is not limited to that shown in the figure, and all or a part thereof may be functionally or physically distributed or arbitrarily distributed in arbitrary units according to various loads or usage conditions. Can be integrated and configured. For example, in the above embodiment, the
以上、本願の実施形態のいくつかを図面に基づいて詳細に説明したが、これらは例示であり、発明の開示の欄に記載の態様を始めとして、当業者の知識に基づいて種々の変形、改良を施した他の形態で本発明を実施することが可能である。 As described above, some of the embodiments of the present application have been described in detail with reference to the drawings. However, these are merely examples, and various modifications, including the aspects described in the disclosure section of the invention, based on the knowledge of those skilled in the art, It is possible to implement the present invention in other forms with improvements.
また、上述した端末装置100は、複数のサーバコンピュータで実現してもよく、また、機能によっては外部のプラットフォーム等をAPI(Application Programming Interface)やネットワークコンピューティングなどで呼び出して実現するなど、構成は柔軟に変更できる。
The
また、特許請求の範囲に記載した「手段」は、「部(section、module、unit)」や「回路」などに読み替えることができる。例えば、受付手段は、受付部や受付回路に読み替えることができる。 Further, the “means” described in the claims can be read as “section (module, unit)” or “circuit”. For example, the reception unit can be read as a reception unit or a reception circuit.
1 表示システム
10 サーバ装置
100 端末装置
110 通信部
120 表示部
130 入力部
140 記憶部
150 制御部
151 受付部
152 Web制御部
153 取得部
154 表示制御部
DESCRIPTION OF SYMBOLS 1
Claims (11)
第1単位毎のデータを示すグラフに対して、任意の位置を指定する操作を受け付ける受付手段と、
前記受付手段によって受け付けられた任意の位置に対応する、前記第1単位と異なる第2単位毎のデータを前記記憶手段から取得する取得手段と、
前記任意の位置における前記第1単位のデータの代わりに前記取得手段によって取得された第2単位毎のデータを表示制御するとともに、前記任意の位置以外の他の位置における前記第1単位毎のデータを表示制御する表示制御手段と
を備えることを特徴とする表示処理装置。 Storage means for storing data for each predetermined unit;
Accepting means for accepting an operation for designating an arbitrary position on the graph indicating data for each first unit;
An acquisition means for acquiring data for each second unit different from the first unit corresponding to an arbitrary position received by the receiving means from the storage means;
In addition to controlling the display of the data for each second unit acquired by the acquisition means instead of the data for the first unit at the arbitrary position, the data for the first unit at other positions other than the arbitrary position. And a display control means for controlling the display.
前記任意の位置を指定した後に当該任意の位置を広げる操作を受け付け、
前記取得手段は、
前記任意の位置におけるデータに基づく、前記第1単位よりも細かい単位である前記第2単位毎のデータを前記記憶手段から取得し、
前記表示制御手段は、
前記任意の位置を広げる操作に基づく幅の領域に、前記取得手段によって取得された第2単位毎のデータを表示制御するとともに、前記任意の位置が広げられたことに応じて前記他の位置における前記第1単位毎のデータが表示されていた領域を狭めた上で、狭めた領域に当該他の位置における前記第1単位毎のデータを表示制御する
ことを特徴とする請求項1に記載の表示処理装置。 The accepting means is
Accepting an operation to expand the arbitrary position after specifying the arbitrary position,
The acquisition means includes
Based on the data at the arbitrary position, the data for each second unit which is a unit smaller than the first unit is acquired from the storage unit,
The display control means includes
In the area of the width based on the operation of expanding the arbitrary position, the display unit controls display of the data for each second unit acquired by the acquiring unit, and at the other position according to the expansion of the arbitrary position. 2. The display control of the data for each first unit at the other position is performed in the narrowed area after narrowing the area where the data for each first unit is displayed. Display processing device.
任意の領域が指定されることで当該任意の領域に含まれる各位置を前記任意の位置として受け付けるとともに、当該任意の領域を狭める操作を受け付け、
前記取得手段は、
前記任意の領域におけるデータに基づく、前記第1単位よりも粗い単位である前記第2単位毎のデータを前記記憶手段から取得し、
前記表示制御手段は、
前記任意の領域を狭める操作に基づく幅の領域に、前記取得手段によって取得された第2単位毎のデータを表示制御するとともに、前記任意の領域が狭められたことに応じて当該任意の領域以外の領域を広げた上で、広げた領域に前記他の位置における前記第1単位毎のデータを表示制御する
ことを特徴とする請求項1に記載の表示処理装置。 The accepting means is
Accepting each position included in the arbitrary area as the arbitrary position by specifying an arbitrary area, and accepting an operation to narrow the arbitrary area,
The acquisition means includes
Based on the data in the arbitrary area, the data for each second unit which is a coarser unit than the first unit is acquired from the storage unit,
The display control means includes
In addition to controlling the display of the data for each second unit acquired by the acquisition unit in an area having a width based on the operation for narrowing the arbitrary area, the area other than the arbitrary area according to the reduction of the arbitrary area The display processing apparatus according to claim 1, wherein the display unit is configured to display the data for each of the first units at the other positions in the expanded region.
前記受付手段によって受け付けられた操作に基づく幅が広いほど、前記第2単位を細かい単位とし、当該操作後の幅が狭いほど、前記第2単位を粗い単位とする
ことを特徴とする請求項2又は3に記載の表示処理装置。 The acquisition means includes
The second unit is set as a finer unit as the width based on the operation received by the receiving unit is wider, and the second unit is set as a coarser unit as the width after the operation is narrower. Or the display processing apparatus of 3.
前記受付手段によって受け付けられた操作に基づく幅が所定の閾値以上である場合に、前記第2単位毎のデータを取得する
ことを特徴とする請求項2〜4のいずれか一つに記載の表示処理装置。 The acquisition means includes
The display according to any one of claims 2 to 4, wherein data for each second unit is acquired when a width based on an operation received by the receiving unit is equal to or greater than a predetermined threshold. Processing equipment.
前記第1単位毎のデータを示す複数のグラフのうち、第1グラフに対して前記任意の位置を指定する操作を受け付け、
前記取得手段は、
前記第1グラフ以外の他のグラフにおける前記任意の位置に対応する対応位置のデータに基づく、前記第2単位毎のデータを前記記憶手段からさらに取得し、
前記表示制御手段は、
前記他のグラフ上のデータのうち、前記対応位置におけるデータの代わりに前記取得手段によってさらに取得された第2単位毎のデータを表示制御するとともに、当該対応位置以外の他の位置における前記第1単位毎のデータを表示制御する
ことを特徴とする請求項1〜5のいずれか一つに記載の表示処理装置。 The accepting means is
Among the plurality of graphs indicating the data for each first unit, an operation for specifying the arbitrary position with respect to the first graph is received,
The acquisition means includes
Further acquiring from the storage means data for each second unit based on data at corresponding positions corresponding to the arbitrary positions in the graph other than the first graph;
The display control means includes
Of the data on the other graph, the second unit data further acquired by the acquisition unit instead of the data at the corresponding position is displayed and controlled, and the first at other positions other than the corresponding position is displayed. The display processing apparatus according to claim 1, wherein display control of data for each unit is performed.
前記グラフ上のデータのうち前記任意の位置に対応する対応位置のデータに基づく、当該対応位置における前記第2単位毎のデータを前記記憶手段からさらに取得し、
前記表示制御手段は、
前記対応位置におけるデータの代わりに前記取得手段によってさらに取得された第2単位毎のデータを表示制御するとともに、当該対応位置以外の他の位置における前記第1単位毎のデータを表示制御する
ことを特徴とする請求項1〜5のいずれか一つに記載の表示処理装置。 The acquisition means includes
Based on the data of the corresponding position corresponding to the arbitrary position among the data on the graph, further acquiring data for the second unit at the corresponding position from the storage unit,
The display control means includes
Display control of the data for each second unit further acquired by the acquisition means instead of the data for the corresponding position, and display control for the data for the first unit at a position other than the corresponding position. The display processing device according to claim 1, wherein the display processing device is a display processing device.
前記任意の位置から所定値だけ離れた前記他の位置までのデータに基づく、前記第1単位と前記第2単位との間の第3単位毎のデータを前記記憶手段から取得し、
前記表示制御手段は、
前記任意の位置から前記所定値だけ離れた前記他の位置までの領域に、前記取得手段によって取得された第3単位毎のデータを表示制御する
ことを特徴とする請求項1〜7のいずれか一つに記載の表示処理装置。 The acquisition means includes
Based on data from the arbitrary position to the other position separated by a predetermined value, data for each third unit between the first unit and the second unit is acquired from the storage unit;
The display control means includes
8. The display unit controls display of data for each third unit acquired by the acquisition unit in an area from the arbitrary position to the other position separated by the predetermined value. The display processing device according to one.
前記所定の軸と異なる他の軸を表示する場合に、前記第1単位毎のデータが表示される領域における前記他の軸の最大値と、前記第2単位毎のデータが表示される領域における前記他の軸の最大値とを異なる値とする
ことを特徴とする請求項1〜8のいずれか一つに記載の表示処理装置。 The display control means includes
When displaying another axis different from the predetermined axis, the maximum value of the other axis in the area where the data for each first unit is displayed and the area where the data for each second unit are displayed. The display processing apparatus according to claim 1, wherein the maximum value of the other axis is set to a different value.
第1単位毎のデータを示すグラフに対して、任意の位置を指定する操作を受け付ける受付工程と、
前記受付工程によって受け付けられた任意の位置に対応する、前記第1単位と異なる第2単位毎のデータを所定の単位毎のデータを記憶する記憶手段から取得する取得工程と、
前記任意の位置における前記第1単位のデータの代わりに前記取得工程によって取得された第2単位毎のデータを表示制御するとともに、前記任意の位置以外の他の位置における前記第1単位毎のデータを表示制御する表示制御工程と
を含んだことを特徴とする表示処理方法。 A display processing method executed by a display processing device,
An accepting step of accepting an operation for designating an arbitrary position with respect to a graph indicating data for each first unit;
An acquisition step of acquiring data for each second unit different from the first unit corresponding to an arbitrary position received by the reception step from a storage unit that stores data for each predetermined unit;
In addition to controlling the display of the data for each second unit acquired by the acquisition step instead of the data for the first unit at the arbitrary position, the data for the first unit at other positions other than the arbitrary position. And a display control process for controlling display of the display.
前記受付手順によって受け付けられた任意の位置に対応する、前記第1単位と異なる第2単位毎のデータを所定の単位毎のデータを記憶する記憶手段から取得する取得手順と、
前記任意の位置における前記第1単位のデータの代わりに前記取得手順によって取得された第2単位毎のデータを表示制御するとともに、前記任意の位置以外の他の位置における前記第1単位毎のデータを表示制御する表示制御手順と
コンピュータに実行させることを特徴とする表示処理プログラム。 An acceptance procedure for accepting an operation for designating an arbitrary position on a graph indicating data for each first unit;
An acquisition procedure for acquiring data for each second unit different from the first unit corresponding to an arbitrary position received by the reception procedure from a storage unit that stores data for each predetermined unit;
In addition to controlling the display of the data for each second unit acquired by the acquisition procedure instead of the data for the first unit at the arbitrary position, the data for the first unit at a position other than the arbitrary position. A display control program for controlling the display and a display processing program executed by a computer.
Priority Applications (1)
| Application Number | Priority Date | Filing Date | Title |
|---|---|---|---|
| JP2012279831A JP2014123302A (en) | 2012-12-21 | 2012-12-21 | Display processor, display processing method, and display processing program |
Applications Claiming Priority (1)
| Application Number | Priority Date | Filing Date | Title |
|---|---|---|---|
| JP2012279831A JP2014123302A (en) | 2012-12-21 | 2012-12-21 | Display processor, display processing method, and display processing program |
Publications (1)
| Publication Number | Publication Date |
|---|---|
| JP2014123302A true JP2014123302A (en) | 2014-07-03 |
Family
ID=51403715
Family Applications (1)
| Application Number | Title | Priority Date | Filing Date |
|---|---|---|---|
| JP2012279831A Pending JP2014123302A (en) | 2012-12-21 | 2012-12-21 | Display processor, display processing method, and display processing program |
Country Status (1)
| Country | Link |
|---|---|
| JP (1) | JP2014123302A (en) |
Cited By (3)
| Publication number | Priority date | Publication date | Assignee | Title |
|---|---|---|---|---|
| JP2016021092A (en) * | 2014-07-11 | 2016-02-04 | 東芝ライテック株式会社 | Information processing apparatus, display method, and display program |
| JP2018156592A (en) * | 2017-03-21 | 2018-10-04 | 株式会社東芝 | Display control system, display data generation system, display control method and program |
| JP2023125963A (en) * | 2022-02-28 | 2023-09-07 | パナソニックIpマネジメント株式会社 | Display system, display method and program |
Citations (4)
| Publication number | Priority date | Publication date | Assignee | Title |
|---|---|---|---|---|
| JPH11248840A (en) * | 1998-03-05 | 1999-09-17 | Aloka Co Ltd | Radiation-measuring device and method for displaying trend graph |
| JP2008209511A (en) * | 2007-02-23 | 2008-09-11 | Tosoh Corp | Monitor screen display scale change system |
| JP2011009846A (en) * | 2009-06-23 | 2011-01-13 | Sony Corp | Image processing device, image processing method and program |
| JP2012173890A (en) * | 2011-02-18 | 2012-09-10 | Kddi Corp | User interface program, terminal and method for switching time scale by pinch operation of finger |
-
2012
- 2012-12-21 JP JP2012279831A patent/JP2014123302A/en active Pending
Patent Citations (4)
| Publication number | Priority date | Publication date | Assignee | Title |
|---|---|---|---|---|
| JPH11248840A (en) * | 1998-03-05 | 1999-09-17 | Aloka Co Ltd | Radiation-measuring device and method for displaying trend graph |
| JP2008209511A (en) * | 2007-02-23 | 2008-09-11 | Tosoh Corp | Monitor screen display scale change system |
| JP2011009846A (en) * | 2009-06-23 | 2011-01-13 | Sony Corp | Image processing device, image processing method and program |
| JP2012173890A (en) * | 2011-02-18 | 2012-09-10 | Kddi Corp | User interface program, terminal and method for switching time scale by pinch operation of finger |
Non-Patent Citations (2)
| Title |
|---|
| CSND201200536002; 佐々木 康之,石坂 勇三,平野 亜矢,渡貫 幹彦: '今日から始める! スマートフォン アンドロイド&iPhone 基礎編 スムーズに使うための基本操作を' 日経PCビギナーズ 第3巻 第12号 第3巻第12号【ISSN】2185-1204, 20121013, p.14-p.17, 日経BP社 * |
| JPN6014033759; 佐々木 康之,石坂 勇三,平野 亜矢,渡貫 幹彦: '今日から始める! スマートフォン アンドロイド&iPhone 基礎編 スムーズに使うための基本操作を' 日経PCビギナーズ 第3巻 第12号 第3巻第12号【ISSN】2185-1204, 20121013, p.14-p.17, 日経BP社 * |
Cited By (3)
| Publication number | Priority date | Publication date | Assignee | Title |
|---|---|---|---|---|
| JP2016021092A (en) * | 2014-07-11 | 2016-02-04 | 東芝ライテック株式会社 | Information processing apparatus, display method, and display program |
| JP2018156592A (en) * | 2017-03-21 | 2018-10-04 | 株式会社東芝 | Display control system, display data generation system, display control method and program |
| JP2023125963A (en) * | 2022-02-28 | 2023-09-07 | パナソニックIpマネジメント株式会社 | Display system, display method and program |
Similar Documents
| Publication | Publication Date | Title |
|---|---|---|
| US10394438B2 (en) | Scroll bar control | |
| EP2386940B1 (en) | Methods and systems for performing analytical procedures by interactions with visiual representations of datasets | |
| US20200125789A1 (en) | Dynamic zooming of content with overlays | |
| US8600967B2 (en) | Automatic organization of browsing histories | |
| EP2990924B1 (en) | Gesture-based on-chart data filtering | |
| US9058365B2 (en) | Systems and methods providing touchscreen report navigation | |
| US8823667B1 (en) | Touch target optimization system | |
| US20120266104A1 (en) | Method and Apparatus of Scrolling a Document Displayed in a Browser Window | |
| US20050022135A1 (en) | Systems and methods for window alignment grids | |
| JP2014063102A (en) | Advertisement display control device, terminal device, advertisement display method and advertisement display program | |
| TWI545450B (en) | Browser and method for displaying subsites | |
| WO2013067240A1 (en) | Visual navigation of documents by object | |
| Nurshuhada et al. | Enhancing performance aspect in usability guidelines for mobile web application | |
| KR101438000B1 (en) | Apparatus and method for controling output window based emr system | |
| US8451271B2 (en) | Methods and systems for displaying graphical markers in a mixed box chart | |
| JP6587576B2 (en) | Information processing apparatus, information processing method, and information processing program | |
| JP2014123302A (en) | Display processor, display processing method, and display processing program | |
| JP6109798B2 (en) | Advertisement display control device, terminal device, advertisement display method, and advertisement display program | |
| CN107480218B (en) | Webpage display method and device, electronic equipment and storage medium | |
| JP2017059067A (en) | Client device and data display program | |
| JP2019036219A (en) | Display control program, display control device, display control method, and distribution device | |
| JP2014182289A (en) | Advertisement information provision device | |
| CN102622164A (en) | System and method for dynamic information display and automatic layout integration | |
| JP5778558B2 (en) | Information communication equipment | |
| JP6203140B2 (en) | Display program, terminal device, display method, and distribution device |
Legal Events
| Date | Code | Title | Description |
|---|---|---|---|
| A521 | Request for written amendment filed |
Free format text: JAPANESE INTERMEDIATE CODE: A523 Effective date: 20140424 |
|
| A02 | Decision of refusal |
Free format text: JAPANESE INTERMEDIATE CODE: A02 Effective date: 20140812 |