WO1997029468A1 - Road vehicle sensing apparatus and signal processing apparatus therefor - Google Patents

Road vehicle sensing apparatus and signal processing apparatus therefor Download PDF

Info

Publication number
WO1997029468A1
WO1997029468A1 PCT/GB1997/000323 GB9700323W WO9729468A1 WO 1997029468 A1 WO1997029468 A1 WO 1997029468A1 GB 9700323 W GB9700323 W GB 9700323W WO 9729468 A1 WO9729468 A1 WO 9729468A1
Authority
WO
WIPO (PCT)
Prior art keywords
signal
sensor
magnitude
vehicle
processing apparatus
Prior art date
Legal status (The legal status is an assumption and is not a legal conclusion. Google has not performed a legal analysis and makes no representation as to the accuracy of the status listed.)
Ceased
Application number
PCT/GB1997/000323
Other languages
French (fr)
Inventor
Richard Andrew Lees
Current Assignee (The listed assignees may be inaccurate. Google has not performed a legal analysis and makes no representation or warranty as to the accuracy of the list.)
Diamond Consulting Services Ltd
Original Assignee
Diamond Consulting Services Ltd
Priority date (The priority date is an assumption and is not a legal conclusion. Google has not performed a legal analysis and makes no representation as to the accuracy of the date listed.)
Filing date
Publication date
Application filed by Diamond Consulting Services Ltd filed Critical Diamond Consulting Services Ltd
Priority to AU16114/97A priority Critical patent/AU1611497A/en
Priority to AT97902476T priority patent/ATE197202T1/en
Priority to BRPI9707364-4A priority patent/BR9707364B1/en
Priority to DE69703382T priority patent/DE69703382D1/en
Priority to US09/117,726 priority patent/US6345228B1/en
Priority to EP97902476A priority patent/EP0879457B1/en
Priority to CA002247372A priority patent/CA2247372C/en
Publication of WO1997029468A1 publication Critical patent/WO1997029468A1/en
Anticipated expiration legal-status Critical
Priority to GR20010400082T priority patent/GR3035262T3/en
Ceased legal-status Critical Current

Links

Classifications

    • G—PHYSICS
    • G08—SIGNALLING
    • G08G—TRAFFIC CONTROL SYSTEMS
    • G08G1/00—Traffic control systems for road vehicles
    • G08G1/01—Detecting movement of traffic to be counted or controlled
    • G08G1/042—Detecting movement of traffic to be counted or controlled using inductive or magnetic detectors
    • G—PHYSICS
    • G08—SIGNALLING
    • G08G—TRAFFIC CONTROL SYSTEMS
    • G08G1/00—Traffic control systems for road vehicles
    • G08G1/01—Detecting movement of traffic to be counted or controlled

Definitions

  • the present invention relates to road vehicle sensing apparatus.
  • a known road vehicle sensing apparatus comprises at least one sensor for location in at least one lane of a highway to detect vehicles travelling in said lane.
  • a signal generation circuit is connected to the sensor and is arranged to produce a sensor signal having a magnitude which varies with time through a plurality of values as a vehicle passes the sensor in said lane. When there is no vehicle near the sensor, the signal magnitude is at a base value.
  • Apparatus of this type will be referred to herein as road vehicle sensing apparatus of the type defined.
  • apparatus of the type defined are typically inductive loops located under the road surface, which are energised to provide an inductive response to metal components of a vehicle above or near the loop. The response is usually greatest, providing a maximum sensor signal magnitude, when the maximum amount of metal is directly over the loop.
  • Other types of sensor may also be employed which effectively sense the proximity of a vehicle and can provide a graduated sensor signal increasing to a maximum as the vehicle approaches and then declining again as the vehicle goes past the sensor.
  • magnetometers may be used for this purpose.
  • a multi lane highway with two or more traffic lanes for a single direction of travel, it is normal to provide separate sensors for each lane so that two vehicles travelling in lanes side by side can be separately counted.
  • the signal generation circuit is arranged to provide a separate said signal for each sensor.
  • the sensors in adjacent lanes are usually aligned across the width of the highway. Apparatus of this type with adjacent sensors in the lanes of a multi lane highway will be referred to herein as road vehicle sensing apparatus of the type defined for a multi lane highway.
  • vehicle sensing apparatus of the type defined has been used primarily for the purpose of counting the vehicles to provide an indication of traffic density.
  • the signal generation circuit of the apparatus of the type defined provides a sensor signal of varying or graduated magnitude
  • a typical prior art installation has a detection threshold set at a magnitude level above the base value to provide an indication of whether or not a vehicle is being detected by the sensor.
  • the only information available from the sensing apparatus is a binary signal indicating whether or not the sensor is currently detecting the vehicle, that is whether the sensor is "m detect”.
  • Prior art sensing apparatus using one or more inductive loops under the road surface have signal generation circuitry arranged to energise the loops at a frequency typically in the range 60 to 90 kHz.
  • a phase locked loop circuit is arranged to keep the energising frequency constant as the resonance of the loop and associated capacitance provided by the circuit is perturbed by the presence of the metal components of a road vehicle passing over the loop.
  • the sensor signal produced by such signal generation circuit is typically the correction signal generated by the phase locked loop circuit required to maintain the oscillator frequency at the desired value.
  • the correction signal may be a digital number contained in a correction counter. As a vehicle passes the loop sensor, the digital number from the counter may progressively rise from zero count up to a maximum count (which in some examples may be between 200 and 1,000) and then falls again to zero as the vehicle moves away from the sensor loop.
  • a maximum count which in some examples may be between 200 and 1,000
  • installations are arranged to set a threshold value for the sensor output signal, above which the sensor is deemed to be "in detect”.
  • the present invention in its various aspects is based on the realisation that there is far more information available in the output signals of vehicle sensing apparatus of the type defined which can be employed so as to improve the reliability of the prior art installations.
  • Prior art installations are reasonably reliable and accurate in counting vehicles, so long as the traffic is free flowing along the highway with a reasonable spacing between vehicles, and so long as the vehicles do not cross from one lane to another in the vicinity of the sensor installation.
  • a typical installation has a vehicle count accuracy of only about plus or minus one percent even in free flowing traffic conditions. In congested traffic conditions, count accuracy falls dramatically and is seldom specified.
  • the vehicle sensing apparatus should be capable of
  • the senor should be able to provide accurate information even in congested conditions.
  • Figure 1 is a plan view of a typical vehicle sensor installation for one carriageway of a two lane highway;
  • FIG. 2 is a block schematic diagram of a vehicle sensing apparatus which can embody the present invention
  • Figure 3 is a graphical illustration of the sensor signals produced by both entry and leaving sensors m one lane of the installation illustrated in Figure 1;
  • Figure 4 is a graphical illustration showing how the sensor signal magnitude can be normalised relative to the maximum amplitude of a signal
  • Figure 5 is a graphical illustration of a leading edge of a sensor signal illustrating a method of determining the point of inflexion
  • Figure 6 is a graphical illustration of the sensor signal produced by a relatively long vehicle passing the sensor
  • Figure 7 is a graphical illustration of a method for determining the length of a vehicle from the overlap between the sensor signals from two successive sensors in a single lane;
  • FIGs 8 and 9 illustrate respectively the sensor signals for vehicles which are either too long, or too short for the length to be determined by the method illustrated in Figure 7,
  • Figure 10 is a graphical illustration showing how the length of a relatively long vehicle can be
  • Figure 11 is a graphical illustration showing a more accurate method of using the overlap between successive sensor signals to determine vehicle length.
  • Figure 12 is a schematic diagram illustrating a software structure implementing an embodiment of the present invention.
  • FIGS 13A and 13B together constitute the transition diagram of the Event State Machine of the structure illustrated in Figure 12;
  • Figure 14 is the transition diagram of the
  • Figure 1 illustrates a typical sensor loop illustration on a two lane carriageway of a highway.
  • the normal direction of traffic on the carriageway is from left to right as shown by the arrow 10.
  • Entry loop 11 and leaving loop 12 are located one after the other in the direction of travel under the surface of lane 1 of the highway and entry loop 13 and leaving loop 14 are located under lane 2.
  • the entry loops 11 and 13 of the two lanes of the highway are aligned across the width of the highway and the leaving loops 12 and 14 are also aligned.
  • each of the loops has a length in the direction of travel of 2 metres and the adjacent edges of the entry and leaving loops are spaced apart also by 2 metres, so that the centres of the entry and leaving loops are spaced apart by 4 metres.
  • all the loops have a width of 2 metres and the
  • adjacent entry loops 11 and 13 have neighbouring edges about 2 metres apart, with a similar spacing for the adjacent edges of the leaving loops 12 and 14.
  • FIG. 2 a typical electronic installation for vehicle sensing apparatus of the type defined is shown.
  • the various sensor loops as illustrated in Figure 1, are represented generally by the block 20.
  • Each of the entry and leaving loops are connected to detector electronics 21 which provides the signal generation circuit for the various loops.
  • the detector electronics may be arranged to energise each of the loops at a particularly detector station (e.g. as illustrated in Figure 1) simultaneously so that four sensor signals are then produced by the detector electronics 21 continuously representing the status of each of the loops.
  • the detector electronics 21 is arranged to energise or scan each of the loops of the detector station
  • each sensor signal is thereby updated approximately every 6 mS.
  • the raw data representing the sensor signal magnitudes are supplied from the detector electronics 21 over a serial or parallel data link to processing unit 22 in which the data is processed to derive the required traffic information. Aspects of the present invention are particularly concerned with the signal processing which may be performed by the processing unit 22.
  • Processing unit 22 may be constituted by a digital data processing unit having suitable software control. It will be appreciated that many aspects of the present invention may be embodied by providing the appropriate control software for the processing unit 22.
  • the illustrated installation also includes remote reporting equipment 23 arranged to receive the traffic information derived by the
  • Time is shown along the x axis and the illustrated sensor signals, or profiles, are provided assuming a vehicle has past over the entry and leaving loops at a substantially uniform speed.
  • the y axis is calibrated in arbitrary units representing, in this example, the correction count contained in the phase locked loop control circuitry driving the respective loops.
  • the signal profile (or signature) from the entry loop is shown at 30 and the signal profile or signature from the leaving loop is shown at 31.
  • Figure 4 illustrates how the profiles from a particular loop as illustrated in Figure 3 can be normalised with respect to a maximum amplitude value
  • the sensor profile or signature has a single maximum. If this is set at a normalised value, 100, then the normalised values at the other sample points illustrated in Figure 4, can be calculated by dividing the actual magnitude value at these points by the magnitude value at the point of maximum amplitude and multiplying by one hundred. If the profile has two or more maxima or peaks, then the largest is used for normalising.
  • a significant problem with sensor installations as illustrated is the possibility of double detection.
  • a vehicle passing squarely over the detection loops in its own lane produces a significant sensor signal magnitude only from the loops in its lane.
  • vehicle 15 will produce a significant sensor signal magnitude only in entry loop 11 and leaving loop 12 in lane 1
  • vehicle 16 will produce significant sensor signals magnitudes only in entry loop 13 and leaving 14 in lane 2.
  • a vehicle passing the detector site in some road position between lanes may produce substantial sensor signal magnitudes in the loops in both lanes.
  • vehicle 17 will produce signal magnitudes in all four loops. This leads to a difficulty in discriminating between the case of two cars simultaneously passing over the two adjacent sets of loops (e.g.
  • class cars 15 and 16 in Figure 1 and the case of a single car passing at some position between the detector loops (e.g. vehicle 17 in Figure 1).
  • vehicle 17 the signal magnitude produced by this latter case (vehicle 17) would often exceed the detection thresholds of the loops m both lanes. It is important for many applications of vehicle detection that these two cases be correctly recognised.
  • a single vehicle being detected in two lanes is termed a "double detection".
  • the processing unit 22 in Figure 2 is arranged to measure the peak amplitudes of the signals from adjacent loops, that is the entry loops 11 and 13 or the leaving loops 12 and 14. The processing unit is then arranged to take the geometric mean of these two amplitude values and compare that mean against one or more threshold values.
  • a single threshold may be sufficient if the adjacent loops in the two lanes are sufficiently spaced apart so that the sensor signal magnitude from adjacent loops produced by a single vehicle between the loops is likely to be relatively low in at least one of the two adjacent loops.
  • two thresholds may be required, one set sufficiently low to identify clear double detection events with confidence, and the other threshold set rather higher to provide an indication of a possible double detection event.
  • the processing unit is then arranged in response to a possible double detection event, where the geometric mean is only below the upper threshold and not the lower threshold, by performing other tests on the signals from the loops to confirm the likelihood of double detection.
  • the further tests may include checking that the speed measured from the loop signals in the two lanes is substantially the same and also confirming that the measured length in the two lanes is substantially the same. Another check is to confirm that the signal profile from one of a pair of adjacent loops in the two lanes is contained fully within the profile from the other loop.
  • the length of the vehicle passing over a sensor site can be determined by measuring properties of the signal profile or signature obtained from one or both of the entry and leaving loops. The length may be determined either dynamically, requiring a knowledge of the vehicle speed, or statically.
  • Static measurements have an advantage over dynamic measurements in that they can be made in stop-start traffic conditions, while dynamic measurements require vehicle speed to be reasonably constant while passing over the sensor site. On the other hand dynamic measurements can in some cases be more accurate and reliable.
  • One dynamic method for determining speed relies on measuring the time between points on the leading and trailing edges of the sensor signal profile as a vehicle passes a sensor loop.
  • the processing unit may be arranged to determine the time between predefined points on the leading and trailing edges.
  • the predefined points may be points of inflexion on these edges.
  • a point of inflexion is defined as the point of maximum gradient.
  • One method of determining the timing of the points of inflexion on the leading and trailing edges is by determining the times at either side of the inflexion point where the signature slope is somewhat less than its maximum and then finding the mid point between these upper and lower points. This method is used to avoid the effect of transient distortions of the signal profile, which may for example be caused by suspension movement of the vehicle travelling over the sensor. A transient distortion could result in a single measurement of the point of maximum slope being incorrect. Several measurements could be taken at different slopes on either side of the inflexion point and then a central tendency calculation applied to these measurements to obtain the inflexion point times to be used for calculating the length of the vehicle.
  • the signal magnitude data available from the sensing apparatus may not be available continuously but only at regular time intervals corresponding to the scanning rate of the sensor energising electronics. This can produce quantisation effects so that it is not possible to obtain the timing of precise slope values on the signal profile.
  • measurements can be made at slope segments that are close to the required slopes on either side of the inflexion and the timing of the inflexion point is then corrected for the difference between them according to the equation below:
  • Time infl is the calculated time of the inflexion point
  • Time low is the time of the mid point of the low magnitude curve segment with a reduced slope close to the required value
  • Time high is the time of the mid point of the high magnitude curve segment with a reduced slope close to the required value
  • Slope low is the height on the y axis of the low magnitude curve segment used for time low .
  • Slope high is the height on the y axis of the hign amplitude curve segment used for time high ;
  • Time quantisation is the time interval between sensor signal samples forming the signal profile.
  • time differences can be determined from the signal profiles of both the entry and leaving loops of an installation such as illustrated in Figure 1.
  • speed sensing device e.g. a radar device synchronised with the loop sensors.
  • speed will be derived also from the loop sensor signals in various ways as will be described later nerein.
  • the signal processing unit may instead be arranged to measure the time between points on the respective edges at which the sensor signal has a magnitude which is a predetermined fraction of the nearest adjacent high signal magnitude.
  • the "high signal magnitude” is defined as the magnitude at the nearest minimum in the modulus of the gradient of the profile.
  • the first point at which the modulus of the gradient reduces to a minimum value and then rises again is in fact at the maximum amplitude of the signal profile. At this point, of course, the modulus of the slope falls to zero before it rises again (as the slope becomes negative).
  • the signal profiles generated by larger vehicles may have one or more "shoulders" in the leading or trailing edges of the profiles, such as is shown in the leading edge of the profile illustrated in Figure 6. These shoulders occur in larger vehicles because the vehicle is magnetically non uniform.
  • the shoulder may
  • a shoulder is taken into consideration only if it involves a significant reduction in the slope of the edge, to approximately 25% or less than the maximum slope on the edge, and if the shoulder point is at a signal magnitude that is a substantial portion of the nearest signal peak, approximately 65% or more. Also the shoulder is taken into consideration only if the slope is of significant duration for example continues to be less than 35% of the maximum slope for at least 15% of the total duration of the edge up to the first peak. Also, it is important that the shoulder is detected in the signal profiles from both the entry and leaving loops.
  • the magnitude of the signal value at the shoulder (the high signal magnitude) is taken to be the magnitude at the point of minimum slope on the shoulder.
  • the selected points on the leading and trailing edges between which the time duration is measured are selected to have magnitudes which are the same fraction of the nearest peak or shoulder.
  • the time duration is determined between a first point at time t leading25 and a second point at time t trailing25. The first point is when the signal magnitude on the leading edge reaches 25% of the magnitude at the shoulder 60. The second point is when the signal magnitude on the trailing edge
  • the length of the vehicle is then taken to be the time between these two points ( t length25 ) multiplied by the measured speed of the vehicle.
  • 25% is considered to be a fraction which can best relate to precisely when the front or rear of a vehicle crosses the centre point of the respective loop. If other fractions are used to determine the time measuring points, corrections may be built in to the calculation used for the length. The most
  • measurements thereby determined can then be combined to provide a measure of central tendency.
  • measurements may be made from the sensor signal profiles from both the entry and leaving loops.
  • a shoulder or a maximum amplitude value in a signal profile is used in the calculation only if it is found to be present in the signals from both the entry and leaving loops. For this purpose, if the normalised magnitude at the shoulder or peak is within 10% of the same value in the profiles from the two loops, then the shoulders or peaks in the two profiles are considered matched.
  • the signal processing unit can then be arranged to determine the normalised magnitude values of the signal profile at a series of times along the profile which, knowing the speed of the vehicle, corresponds to predetermined equal distances in the vehicle direction of travel.
  • Another method of determining the length of a vehicle uses the signal profiles from both the entry and leaving loops. Referring to Figure 7, the entry and leaving loops 70 and 71 are shown overlapping at a time eq . It has been found that the value of the magnitude of the profiles at the point in time when these magnitudes are equal is approximately linearly related to the length of vehicle. Preferably, the normalised profile magnitudes are used to find the point of equality on overlap of the trailing and leading edges. Thus the equal magnitude point
  • Length 3+ Level ⁇ 4 (metres) where level is expressed as a fraction of unity (e.g. 0.28 for the example of Figure 7).
  • the above described technique for determining the length of a vehicle has the advantage of providing a length measurement irrespective of the speed of the vehicle passing the sensors.
  • the above described technique for determining the length of a vehicle has the advantage of providing a length measurement irrespective of the speed of the vehicle passing the sensors.
  • processing unit is arranged to record magnitude values from the two sensor loops at least over the full trailing edge of the signal from the entry loop and the full leading edge of the signal from the leaving loop. Then the necessary calculations can be done to normalise the magnitude values once all the values have been recorded, irrespective of the speed of the vehicle and the corresponding time taken for the signals to decline back to the base value.
  • the above described method of determining the vehicle length can work only in cases where the trailing edge of the entry loop signal and the leading edge of the leaving loop signal do in fact overlap to produce an intersection point. This will generally occur only for relatively shorter vehicles.
  • the minimum vehicle length which can be measured in this way corresponds to the minimum vehicle length which continues to produce a signal in both the entry and leaving loops as the vehicle travels between the two. If the vehicle is too short there is a point at which there is no signal detected in either loop so that, as shown in Figure 9, the trailing and leading edges of the two profiles do not overlap. This corresponds to level from the above equation being zero.
  • the maximum vehicle length which can be measured is as represented in Figure 8 where the last amplitude peak in the signal profile from the entry sensor coincides with the first amplitude peak of the signal profile from the leaving sensor, so that again there is no point of intersection between the trailing and leading edges of the profiles. This corresponds to level having the value 1 in the above equation.
  • the above method is capable of measuring vehicle lengths only between three and up to about seven metres. Nevertheless, for shorter or longer vehicles, the method can still provide an indication of the maximum or minimum length respectively.
  • This method relies on the empirical knowledge of the spacing of the entry and leaving loop centres and that the leading edge of a signal profile between the point of first detection of a vehicle and the first maximum amplitude (or substantial shoulder as defined before) corresponds to a reasonably predictable total distance of movement of the front of the vehicle for any particular installation.
  • a vehicle is first detected when the front of the vehicle is typically 1 metre from the centre of the entry loop, that is
  • the signal from the loop has a normalised magnitude of 25% of the adjacent peak amplitude.
  • the signal magnitude reaches 75% of the peak when the front of the vehicle is aligned over the rear edge of the entry loop and the first peak in the profile is reached when the front of the vehicle is 1 metre beyond the rear edge of the loop, in fact at the mid point between the entry and leaving loops of the installation of Figure 1.
  • the processing unit is arranged to record the magnitude values of the sensor signals from both the entry and leaving
  • the processing unit is then further arranged to provide a profile correlating function which can compare the profile of the entry and leaving loop signals to identify points on the profile of one loop which correspond in terms of profile position to points on the profile from the other loop. This is possible because the processing unit has a record of the signal magnitude value for both profiles. It is therefore straightforward for the processing unit to track through its record of magnitude values for one profile to identify a point in the profile which corresponds to any particular point in the other profile.
  • the corresponding point 85 on the leaving loop profile can be determined by profile correlation. It should be understood that, whereas point 82 is time correlated with point 83, i.e. was recorded at the same time, point 85 is profile correlated with point 82, i.e. was recorded at a different time but is in the corresponding position in the two profiles.
  • the point 85 on the leaving loop profile corresponds to a position where the centre of the leaving loop is 4 metres from the front of the
  • the processing means can now perform a repeat time correlation to identify the time correlated point 86 on the entry loop profile which was recorded at the same time as point 85 on the leaving loop profile.
  • This newly identified point 86 on the entry loop profile may again be profile correlated with a point 87 on the leaving loop profile.
  • This point 87 now corresponds to the centre of the leaving loop being 8 metres from the front of the vehicle.
  • the point 87 may again be time correlated with a point 88 on the entry loop profile and the point 88 once again profile correlated with a point 89 on the leaving loop profile.
  • This point 89 now corresponds to the centre of the leaving loop being 12 metres from the front of the vehicle.
  • One further iteration of time correlation to point 90 and profile correlation to point 91 identifies a point on the leaving loop profile which corresponds to the front of the vehicle being 16 metres in front of the centre of the leaving loop.
  • the processing unit can determine that point 91 is in fact on the trailing edge of the leaving loop profile and can also determine the normalised magnitude of the point 91 relative to the immediately preceding peak amplitude on the profile. For example, in the example of Figure 10, point 91 is at approximately 46% of the amplitude at peak 92.
  • the processing unit can make a further calculation to determine an additional length
  • the overall length of the vehicle can be calculated as 16.42 metres.
  • An additional constant correction may be applied derived by empirical testing.
  • the above procedure may be repeated for a number of different starting positions on the leading edge of the leaving loop, with an appropriate correction being made for the empirically derived position of the point of starting the measurement from the centre of the leaving loop.
  • the various measurements derived may be combined to obtain a value for the central tendency.
  • the process has been explained by starting with a predetermined point on the leading edge of the leaving loop, the process could also be performed by starting with a predetermined position on the trailing edge of the entry loop and working forward in time along the profiles until reaching a point on the leading edge of the entry loop.
  • the above procedure can be performed irrespective of the speed of the vehicle.
  • the profile correlation can be performed using only the way in which the magnitude values of each of the two profiles varies.
  • FIG. 11 A further static method for determining vehicle lengths is illustrated in Figure 11.
  • the processing means is arranged to record the
  • individual time points can be used directly to derive a value for the length of the vehicle.
  • normalised magnitude values are measured on the trailing edge of the entry loop profile 95 at times corresponding to normalised magnitude values on the leading edge of the leaving loop profile 96 of 10%, 20%, 30%, etc. up to 100%.
  • the 10% magnitude value on the leaving loop profile 96 produces sample 1 from the trailing edge of the entry loop
  • the 20% value produces sample 2 and so forth.
  • any samples are taken at a time earlier than the last peak of the profile, then these samples are set at a normalised height of 1.0 (100%) in order to reduce the complexity of the transfer function used. This can occur, for example, if the two profiles in Figure 11 are closer together so that the 10% sample from the leading edge of profile 96 corresponds to a point on profile 95 before the peak of the profile.
  • the above described static methods of measuring vehicle lengths may be particularly useful in traffic monitoring in high congestion conditions. It is also important that the entry loop of a detection loop pair is cleared ready for a subsequent vehicle detection event as soon as the signal profile from the loop has declined substantially to zero, even if the signal from the leaving loop of the pair is still high.
  • the processing unit is arranged to capture all the data from the entry loop and hold this data available for appropriate comparisons with the data from the leaving loop once this becomes available. The processing unit is simultaneously then able to record fresh signal data from the entry loop, which would correspond to a following vehicle, even while still receiving data from the leaving loop corresponding to the preceding vehicle.
  • the signal processing unit records all the signal magnitude data from the two sensors of a road vehicle sensing
  • apparatus of the type defined with two successive sensors includes means for processing this data to derive vehicle characteristic information once all the data has been received and recorded.
  • processing unit can be arranged to separately record data from the entry sensor corresponding to a second vehicle, whilst still recording data from the trailing sensor corresponding to the first vehicle.
  • the signal processing unit is also arranged to record all the signal magnitude data from the sensors in all lanes, for subsequent processing as required.
  • a further important characteristic of a useful road vehicle sensing apparatus is to be able to identify gaps between vehicles travelling very close together so that tailgating vehicles can be separated even when their sensor profiles overlap.
  • the selected characteristic may be the signal magnitude at a minimum in the profile from the two sensors.
  • tailgating is indicated. This would arise when two vehicles following closely behind one another cross the entry and leaving sensors with different spacings between the two vehicles so that the minimum signal level in the joint profiles is different from the two sensors.
  • the processing unit is arranged to consider minima only if they satisfy this criterion.
  • Tailgating may also be detected if there is a minimum in the profile from the entry loop satisfying the required criterion and where the profile from the leaving loop drops substantially to zero before rising again. This corresponds to the case where two
  • Tailgating may also be indicated if there is a substantial minimum in the profile from the leaving loop even though the profile from the entry loop had previously dropped to zero. This would correspond to the case where a vehicle has past normally over the entry loop, clearing it before a second vehicle is detected by the entry loop, but the second vehicle then comes very close to the first vehicle before the first vehicle clears the leaving loop.
  • the threshold for detecting a minimum in this particular case lower than the predetermined threshold used for detecting
  • tailgating when minima are found in the profiles from both loops. This is necessary to avoid indicating tailgating when a single vehicle having a minimum in its profile which would be normally slightly above the main threshold used for both the entry and leaving loops but is transiently below this threshold as the vehicle passes the leaving loop, e.g. due to
  • the main threshold used for detecting minima in both entry and leaving loops can be made dependent on traffic speed.
  • a level of 30% of the profile maximum amplitude may be satisfactory as a minimum detection threshold at low speeds, dropping to zero at speeds in excess of 7 metres per second. This can achieve a high vehicle count accuracy in most conditions.
  • To reduce the minimum detection threshold at higher vehicle speeds is not essential for operation of the tailgating detection algorithm, but can slightly improve count accuracies at these higher speeds.
  • An approximate speed value can be determined by measuring the time between different predetermined normalised magnitude levels on the leading or trailing slope of a signal profile. For example, in the installation illustrated in Figure 1, it has been shown empirically that for most vehicles, the difference on the leading edge of a profile between the signal magnitude of 25% of the nearest peak (or high level) and 75% corresponds to movement of the front of a vehicle by 1 metre. Thus, if the time between the attainment of these two values on the leading edge of a profile is measured, the approximate speed of a vehicle can be determined directly. Different calculations can be made for different selected threshold levels and in different installations.
  • the time difference can be measured between corresponding features in the signal profiles from the entry and leaving loops.
  • the speed can be calculated directly.
  • the first is when the road vehicle sensing apparatus produces sensor signal values at discrete sampling times, corresponding to the scanning rate between the various loops of the installation. Then, the actual time of occurrence of a particular feature in a signal profile is
  • the second factor introducing errors is that transient distortions of the signal profile can cause a particular profile feature being used for the speed measurement to appear slightly before or after its correct time.
  • the first of these factors can be addressed by interpolating between individual signal magnitude level samples received at the sampling rate, to discover the correct timing for a particular feature (e.g. a required magnitude value).
  • a particular feature e.g. a required magnitude value
  • ordinary linear interpolation can be used to find the correct time between two samples on either side of the desired magnitude.
  • a form of interpolation can also be used using the differences between the intended peak or trough value and the magnitude values obtained which are closest to the peak or trough values. If the highest magnitude value obtained at the sampling rate is at time T 1 (or the lowest when the required feature is a trough), S 1 is the difference between this highest sample value and the preceding sample value and S 2 is the difference between the highest value and the next sample value (at time T 2 ) then the interpolated time T feature of the feature itself is given by:
  • multiple matched profile features can be used from the two loop profiles. For example, multiple levels on leading and trailing profile edges can be timed relative to corresponding levels on the edges of the other profile and a speed measurement obtained for each matched pair. Then error theory can be used to determine the central tendency of the resulting values.
  • the invention contemplated herein is constituted not only by a signal processing apparatus for
  • a road vehicle sensing apparatus of the type defined preferably for a multi lane highway and with two successive sensors in each single lane, but is also constituted by a road vehicle sensing apparatus in combination with the signal processing apparatus described.
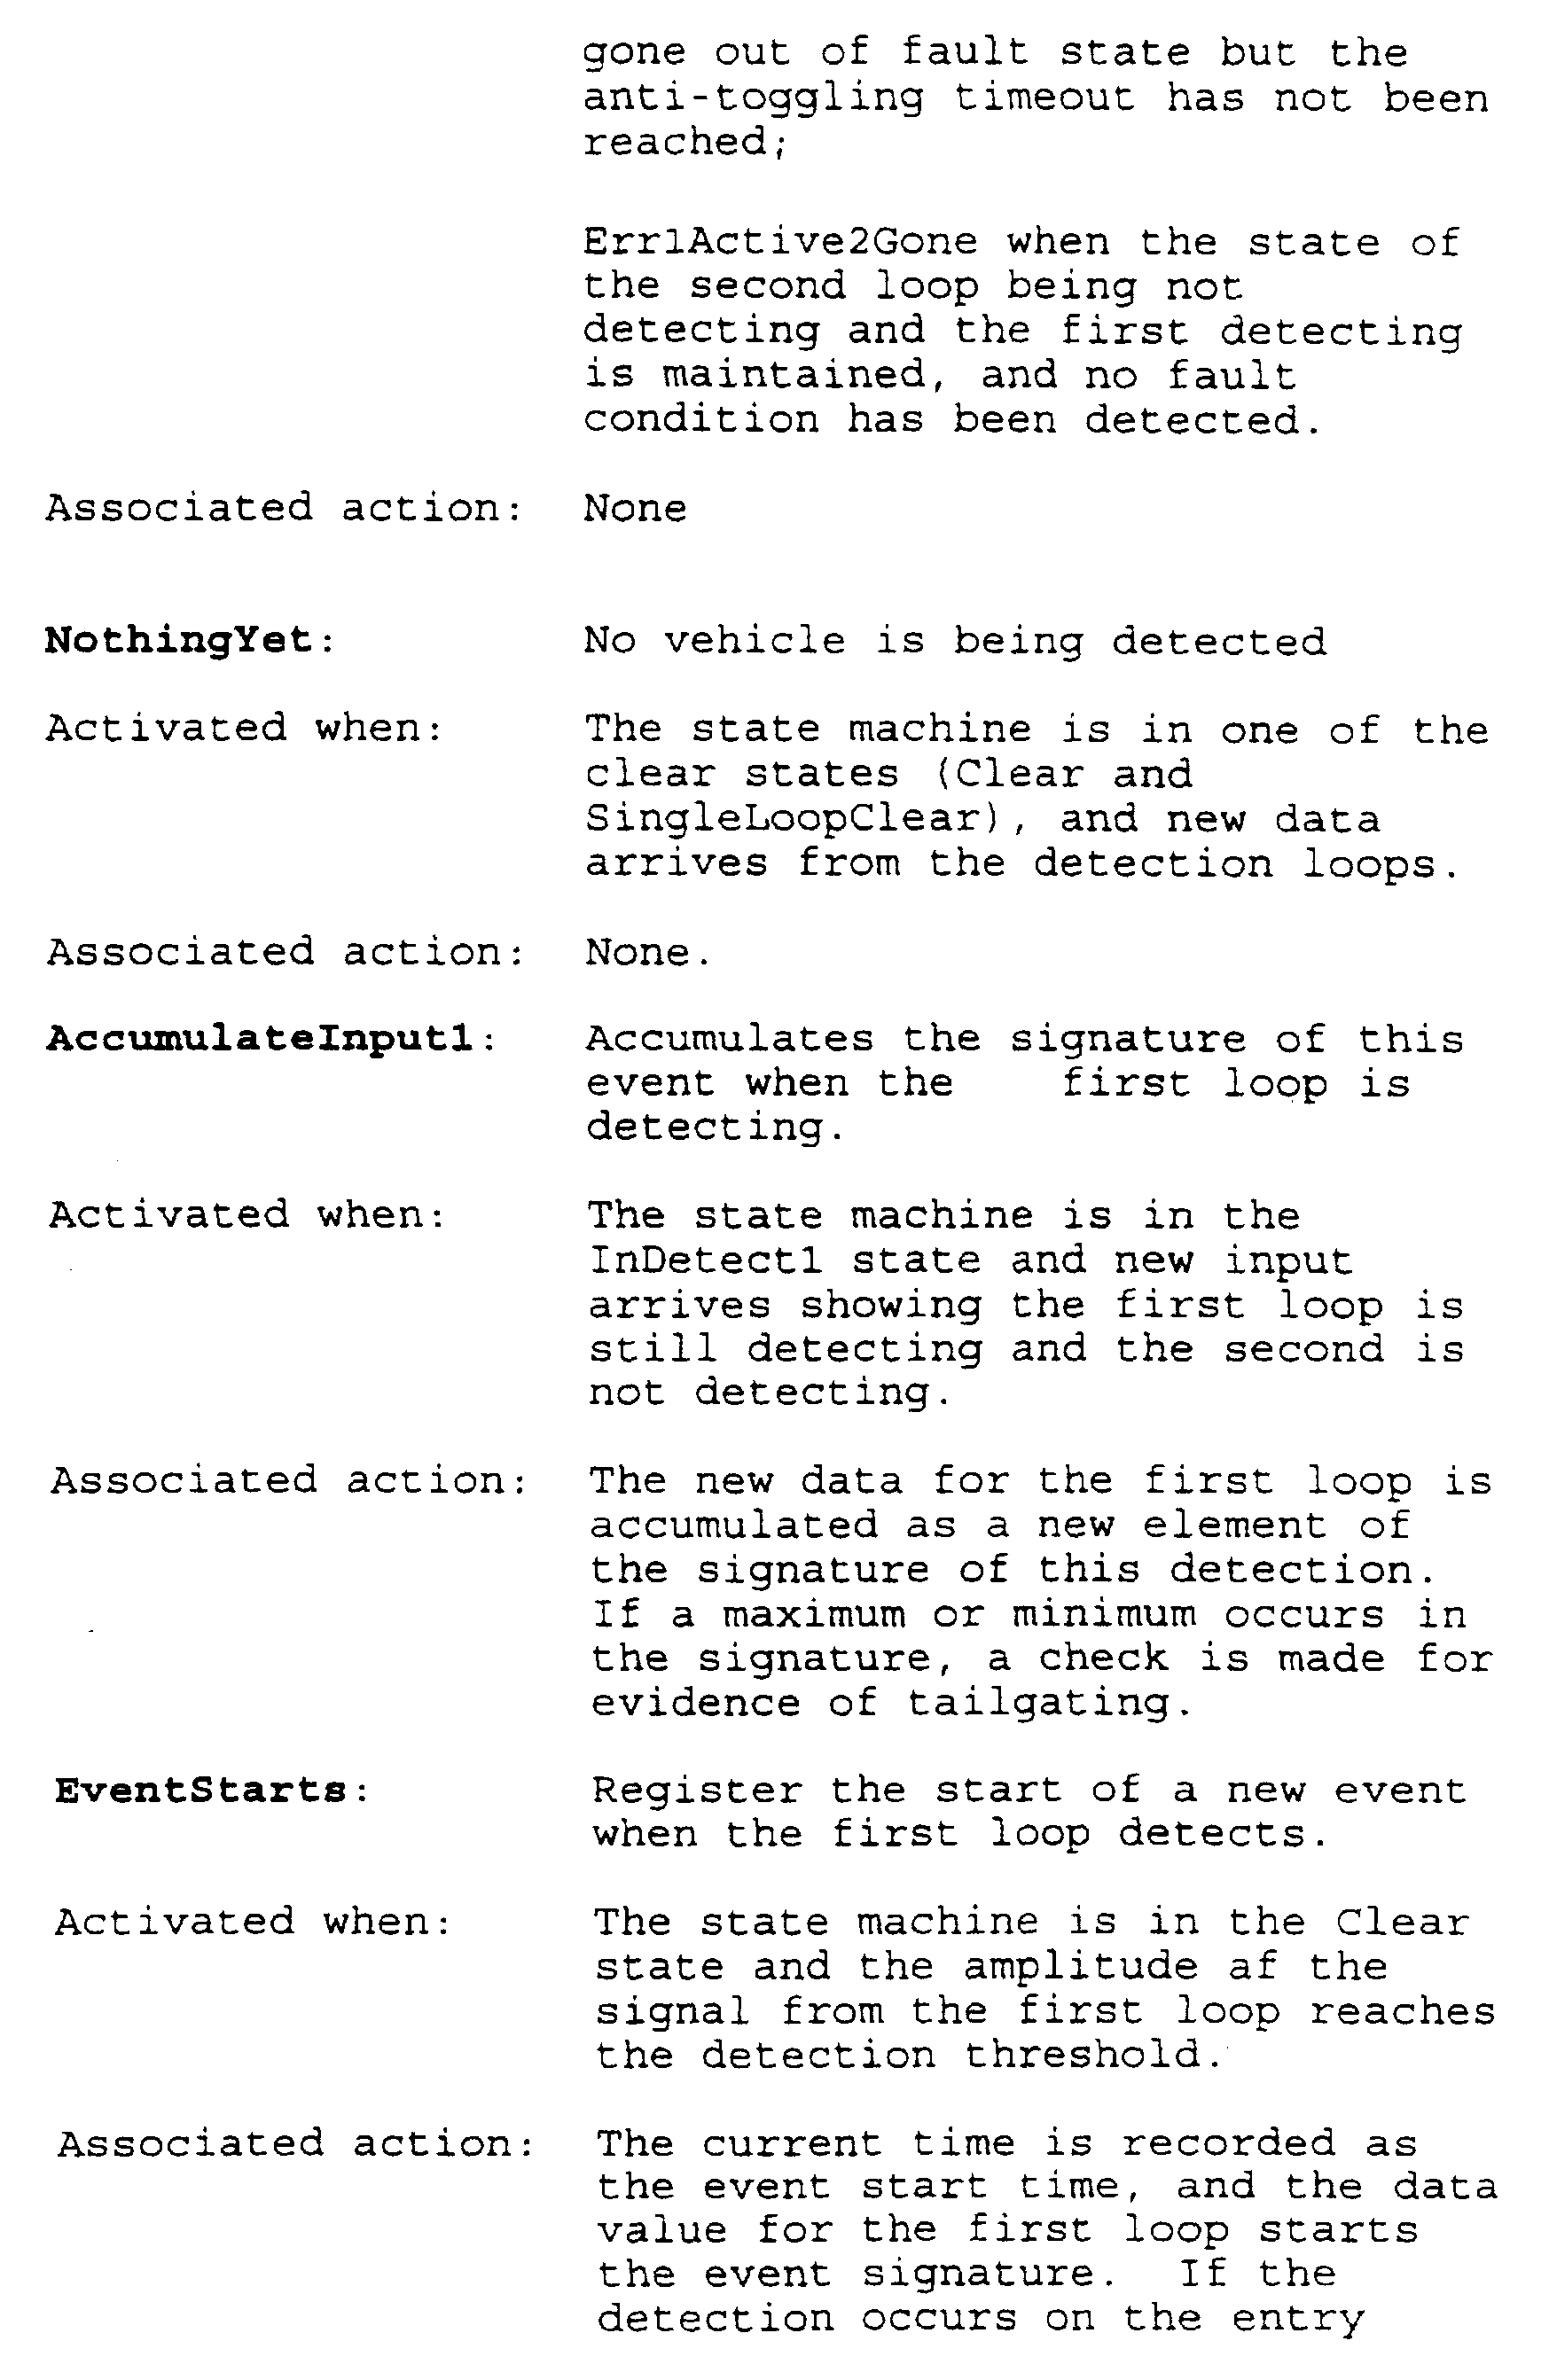
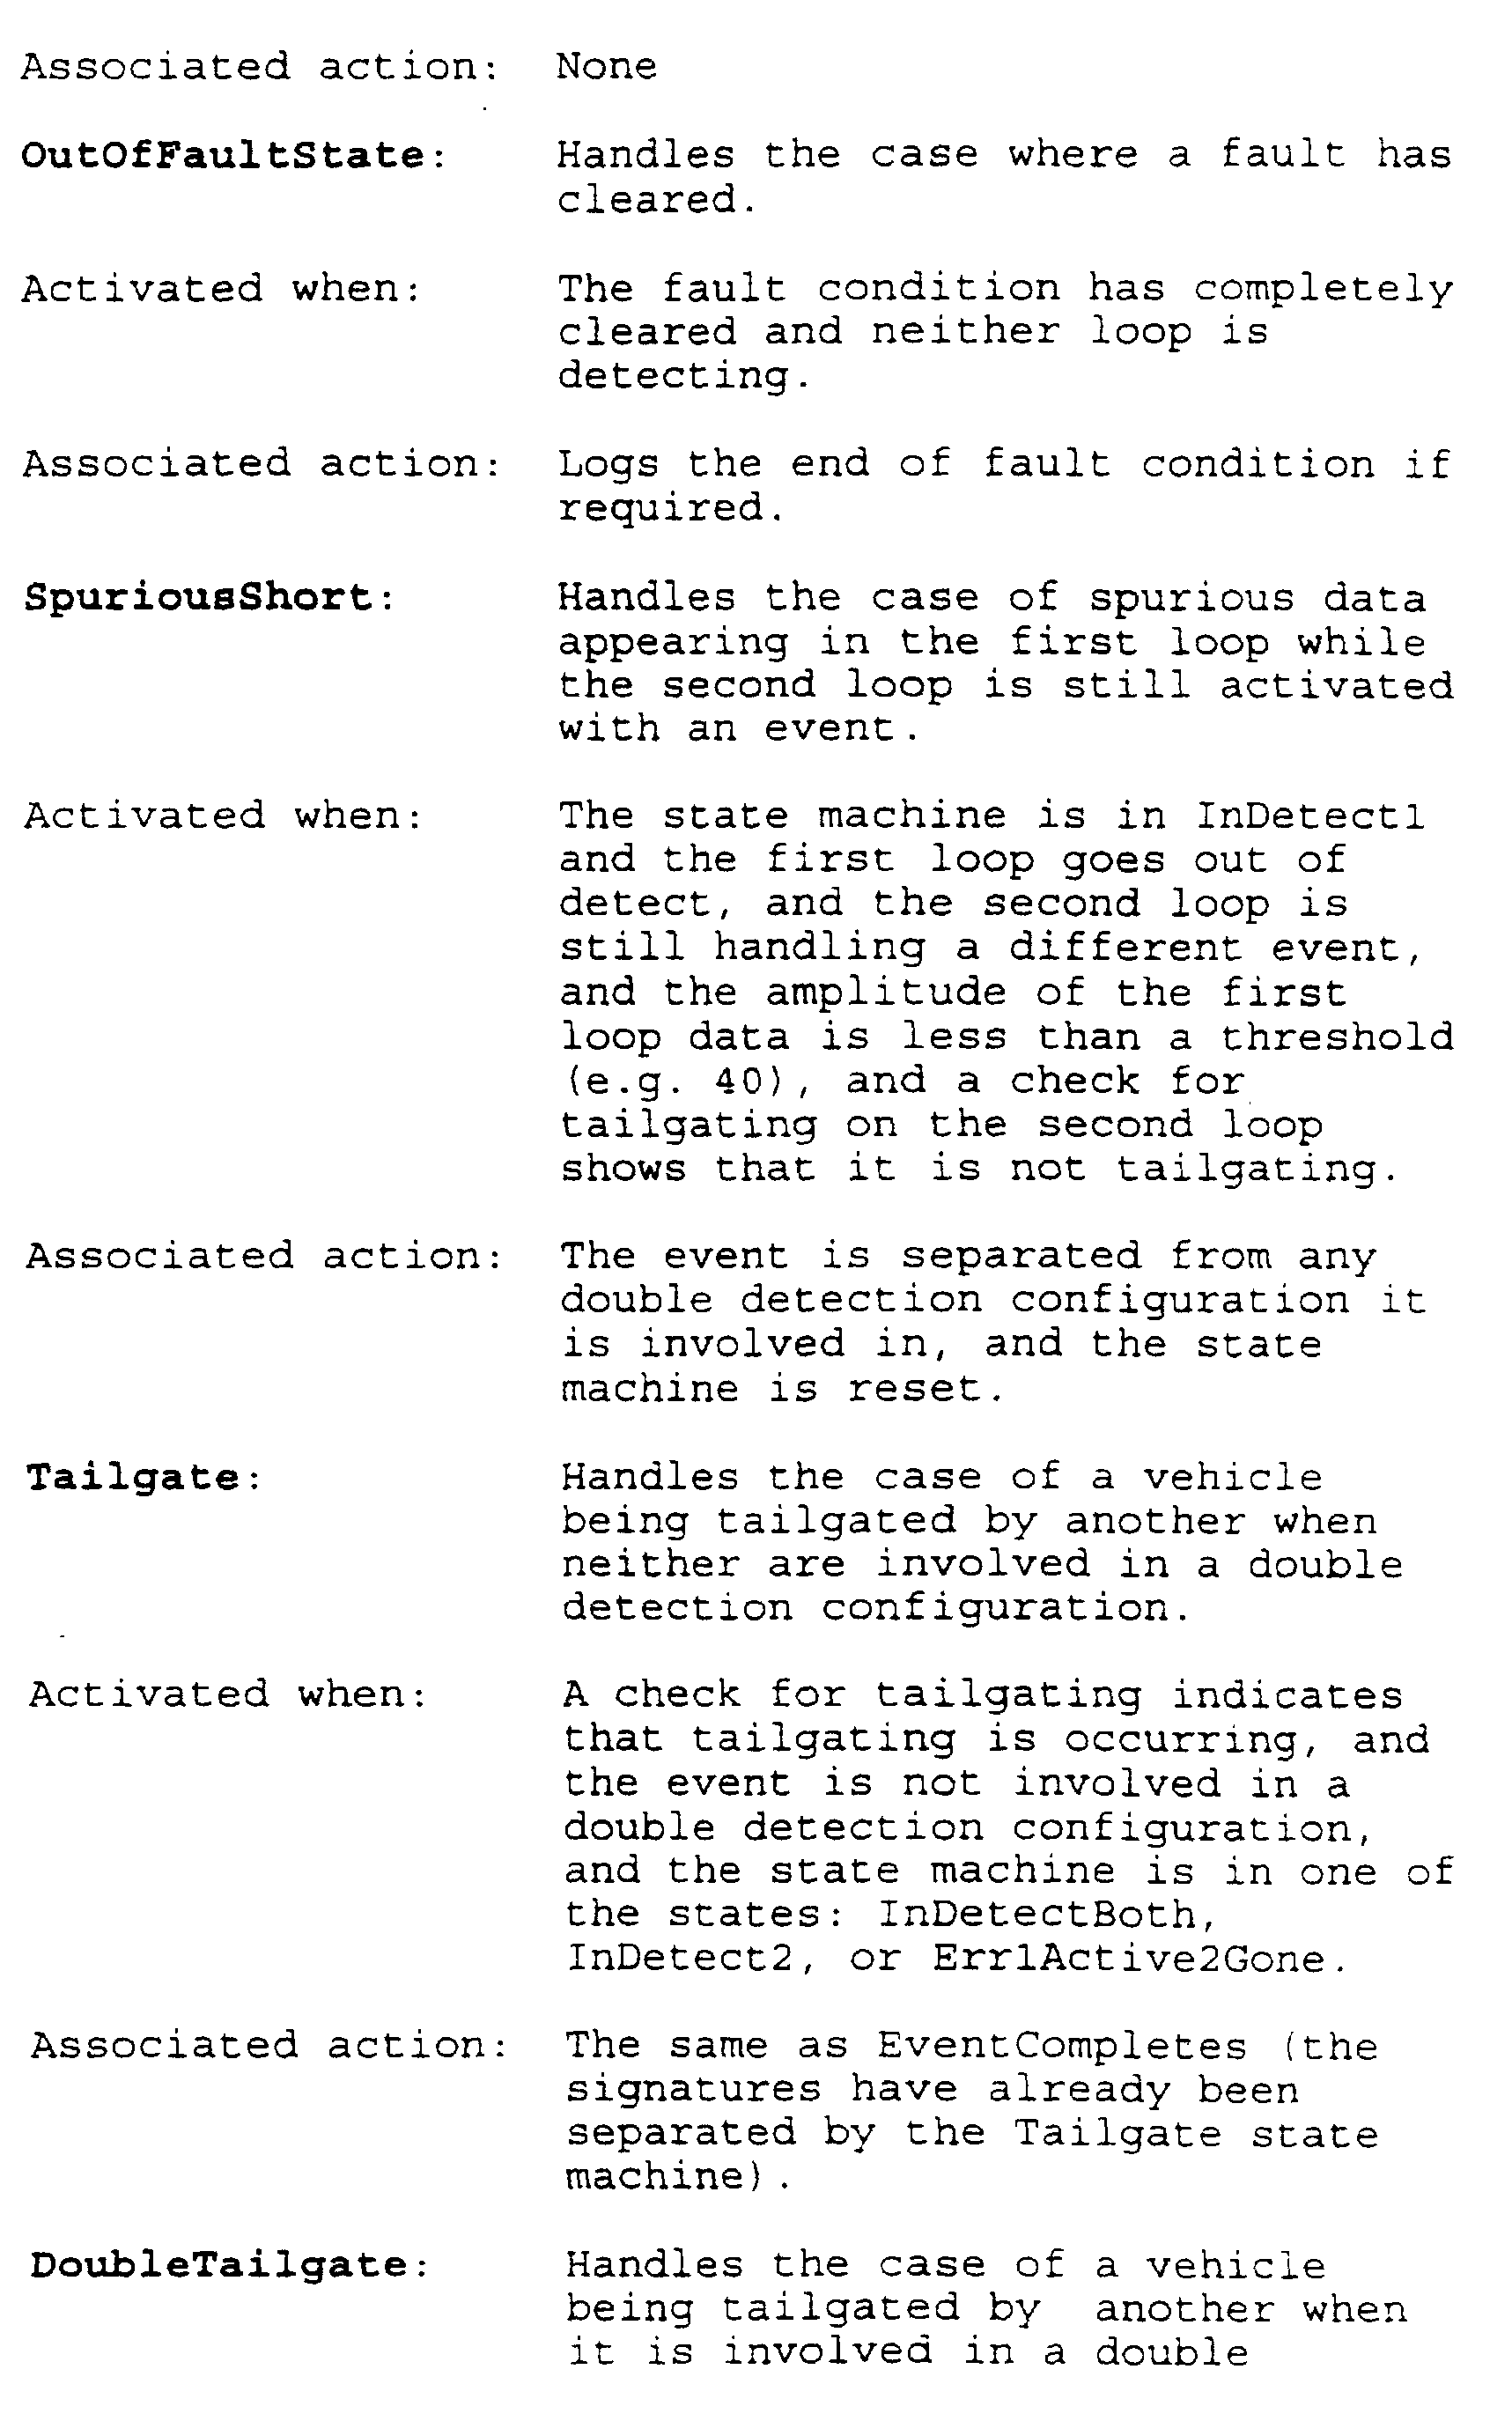
  • the system takes data from loop detectors, conditions the data via a Loop state machine if required, and processes the data from loop pairs in each lane to determine events that represent the passage of vehicles over each lane's detector site.
  • the purposes of each element in Figure 12 are:
  • Event state machine determines whether the operation of those state machines. To maintain configuration information for each lane, for example the dimensions of the detection site.
  • Tailgating state machine To interact with a Tailgating state machine to determine when a signature indicates that two vehicles are tailgating.
  • Tailgate state machine
  • the input data is normally samples of the output from the loop detectors taken at regular intervals, although other presentations can be provided.
  • the output data depends on the nature of the application, but may be:
  • data is received and conditioned by the Loop state machines, and passed to the event state machine for examinination.
  • Event state machines There are multiple event state machines simultaneously available for each lane, and several may be actively processing events in each lane at any time.
  • the need for multiple machines can be understood by mentally following the progress of vehicles over the detection site.
  • two vehicles travelling close one behind the other in a lane As the first passes over the site and is proceeding over the exit loop, the second may already be starting to pass over the entry loop.
  • an Event state machine Since the purpose of an Event state machine is to track the progress of a vehicle from entry onto the site until it is completely clear of the site, it can be seen that in this case two state machines are required. One is handling the vehicle currently moving off the site, and one the vehicle currently moving onto the site.
  • Event state machines particularly where there are more than two lanes in a carriageway.
  • a three lane carriageway that there is a long vehicle with three cars at its side, and all are straddling lanes because of an obstruction. It is not possible to be sure that the truck is not several tailgating vehicles until it has completely passed over the detection site, and all of the cars alongside must remain part of the double detection configuration until the last of the four vehicles is off the site, when the whole configuration can be fully evaluated. All of the state machines must remain active until this time, so more are needed.
  • the operation of the Event state machines depend on the data presented, previous data presented, the states of the state machines handling the lanes on either side, the mode of the system, and the state of the loop detectors.
  • the Lane Processing module directs loop data to the appropriate state machine under direction from the Event state machines
  • Event state machines are associated with a
  • Tailgate state machine when they are active, and pass information to their Tailgate state machine so that it can determine if tailgating is occurring.
  • relevent information is the locations of maxima and minima in the data, and when the loops drop out of detection.
  • Tailgate state machine determines that
  • Tailgating is occurring, it will split the signatures obtained by its associated Event state machine at the appropriate point. Frequently it will be necessary for a Tailgate state machine to find an unused Event state machine to move part of the signature to. It then sets the states of the Event state machines to be compatible with the new view of the data and directs loop data to the appropriate Event state machine.

Landscapes

  • Physics & Mathematics (AREA)
  • General Physics & Mathematics (AREA)
  • Traffic Control Systems (AREA)
  • Radar Systems Or Details Thereof (AREA)
  • Geophysics And Detection Of Objects (AREA)
  • Train Traffic Observation, Control, And Security (AREA)
  • Road Signs Or Road Markings (AREA)

Abstract

A road vehicle sensor provides an output signal having a magnitude which varies with time through a plurality of values as a vehicle passes the sensor. Signal processing apparatus monitors the timing of sensor signals generated from sensors in adjacent lanes of a highway and provides an indication when such sensor signals could correspond to a double count with a single vehicle being detected by both sensors. Then, the geometric mean of the amplitudes of the sensor signals from the sensors in adjacent lanes is calculated and is used to indicate a double count if the geometric mean is below a threshold value. Signal processing arrangements are also described to detect tailgating vehicles which may be simultaneously detected by a sensor, and for determining the length of slow moving or stationary traffic.

Description

ROAD VEHICLE SENSING APPARATUS AND
SIGNAL PROCESSING APPARATUS THEREFOR
The present invention relates to road vehicle sensing apparatus.
In the prior art a known road vehicle sensing apparatus comprises at least one sensor for location in at least one lane of a highway to detect vehicles travelling in said lane. A signal generation circuit is connected to the sensor and is arranged to produce a sensor signal having a magnitude which varies with time through a plurality of values as a vehicle passes the sensor in said lane. When there is no vehicle near the sensor, the signal magnitude is at a base value. Apparatus of this type will be referred to herein as road vehicle sensing apparatus of the type defined.
The sensors used in road vehicle sensing
apparatus of the type defined are typically inductive loops located under the road surface, which are energised to provide an inductive response to metal components of a vehicle above or near the loop. The response is usually greatest, providing a maximum sensor signal magnitude, when the maximum amount of metal is directly over the loop. Other types of sensor may also be employed which effectively sense the proximity of a vehicle and can provide a graduated sensor signal increasing to a maximum as the vehicle approaches and then declining again as the vehicle goes past the sensor. For example magnetometers may be used for this purpose.
In a multi lane highway, with two or more traffic lanes for a single direction of travel, it is normal to provide separate sensors for each lane so that two vehicles travelling in lanes side by side can be separately counted. The signal generation circuit is arranged to provide a separate said signal for each sensor. The sensors in adjacent lanes are usually aligned across the width of the highway. Apparatus of this type with adjacent sensors in the lanes of a multi lane highway will be referred to herein as road vehicle sensing apparatus of the type defined for a multi lane highway.
It is also normal practice for the sensor
installation on a single lane of highway to include two sensors installed a distance apart along the lane of the highway. Again the signal generation circuit produces a separate said signal for each sensor. This arrangement allows the direction of travel of a vehicle in the lane to be determined and also the timing of the signals from the two sensors can be used to provide a measure of vehicle speed. The first sensor in the normal direction of travel in the lane can be called the entry sensor and the second sensor can be called the leaving sensor. Apparatus of this type will be referred to herein as vehicle sensing apparatus of the type defined with two successive sensors in a single lane.
In the prior art, vehicle sensing apparatus of the type defined has been used primarily for the purpose of counting the vehicles to provide an indication of traffic density. Although the signal generation circuit of the apparatus of the type defined provides a sensor signal of varying or graduated magnitude, a typical prior art installation has a detection threshold set at a magnitude level above the base value to provide an indication of whether or not a vehicle is being detected by the sensor. Thus, in prior art installations, the only information available from the sensing apparatus is a binary signal indicating whether or not the sensor is currently detecting the vehicle, that is whether the sensor is "m detect".
Prior art sensing apparatus using one or more inductive loops under the road surface have signal generation circuitry arranged to energise the loops at a frequency typically in the range 60 to 90 kHz. In some examples, a phase locked loop circuit is arranged to keep the energising frequency constant as the resonance of the loop and associated capacitance provided by the circuit is perturbed by the presence of the metal components of a road vehicle passing over the loop. The sensor signal produced by such signal generation circuit is typically the correction signal generated by the phase locked loop circuit required to maintain the oscillator frequency at the desired value. In a typical circuit, the correction signal may be a digital number contained in a correction counter. As a vehicle passes the loop sensor, the digital number from the counter may progressively rise from zero count up to a maximum count (which in some examples may be between 200 and 1,000) and then falls again to zero as the vehicle moves away from the sensor loop. As mentioned above, prior art
installations are arranged to set a threshold value for the sensor output signal, above which the sensor is deemed to be "in detect".
The present invention in its various aspects is based on the realisation that there is far more information available in the output signals of vehicle sensing apparatus of the type defined which can be employed so as to improve the reliability of the prior art installations. Prior art installations are reasonably reliable and accurate in counting vehicles, so long as the traffic is free flowing along the highway with a reasonable spacing between vehicles, and so long as the vehicles do not cross from one lane to another in the vicinity of the sensor installation. In practice, however, a typical installation has a vehicle count accuracy of only about plus or minus one percent even in free flowing traffic conditions. In congested traffic conditions, count accuracy falls dramatically and is seldom specified.
There is an increasing need for more accurate automatic traffic monitoring. This need has been stimulated by proposals for highways to be maintained, or even constructed, with private finance, and
compensation to be paid to the
constructors/maintainers by Central Government or a Regional Authority in accordance with the number of vehicles using the highway. Even a 1% error in count accuracy would be too high. Importantly, also, the vehicle sensing apparatus should be capable of
determining the class of the vehicles using the highway, usually on the basis of vehicle length.
Also, the sensor should be able to provide accurate information even in congested conditions.
Various aspects and preferred embodiments of the present invention are defined in the appended claims.
Aspects and examples of the invention will now be described with reference to the accompanying drawings in which:
Figure 1 is a plan view of a typical vehicle sensor installation for one carriageway of a two lane highway;
Figure 2 is a block schematic diagram of a vehicle sensing apparatus which can embody the present invention;
Figure 3 is a graphical illustration of the sensor signals produced by both entry and leaving sensors m one lane of the installation illustrated in Figure 1;
Figure 4 is a graphical illustration showing how the sensor signal magnitude can be normalised relative to the maximum amplitude of a signal;
Figure 5 is a graphical illustration of a leading edge of a sensor signal illustrating a method of determining the point of inflexion;
Figure 6 is a graphical illustration of the sensor signal produced by a relatively long vehicle passing the sensor;
Figure 7 is a graphical illustration of a method for determining the length of a vehicle from the overlap between the sensor signals from two successive sensors in a single lane;
Figures 8 and 9 illustrate respectively the sensor signals for vehicles which are either too long, or too short for the length to be determined by the method illustrated in Figure 7,
Figure 10 is a graphical illustration showing how the length of a relatively long vehicle can be
determined by repeatedly comparing points on the signal profiles from the two sensors in a single lane of the highway;
Figure 11 is a graphical illustration showing a more accurate method of using the overlap between successive sensor signals to determine vehicle length.
Figure 12 is a schematic diagram illustrating a software structure implementing an embodiment of the present invention;
Figures 13A and 13B together constitute the transition diagram of the Event State Machine of the structure illustrated in Figure 12; and
Figure 14 is the transition diagram of the
Tailgate State Machine of the structure illustrated in Figure 12.
Figure 1 illustrates a typical sensor loop illustration on a two lane carriageway of a highway. The normal direction of traffic on the carriageway is from left to right as shown by the arrow 10. Entry loop 11 and leaving loop 12 are located one after the other in the direction of travel under the surface of lane 1 of the highway and entry loop 13 and leaving loop 14 are located under lane 2. In the illustrated installation, the entry loops 11 and 13 of the two lanes of the highway are aligned across the width of the highway and the leaving loops 12 and 14 are also aligned. In the illustrated example, each of the loops has a length in the direction of travel of 2 metres and the adjacent edges of the entry and leaving loops are spaced apart also by 2 metres, so that the centres of the entry and leaving loops are spaced apart by 4 metres. Again in the illustrated example, all the loops have a width of 2 metres and the
adjacent entry loops 11 and 13 have neighbouring edges about 2 metres apart, with a similar spacing for the adjacent edges of the leaving loops 12 and 14.
This is an example of a typical installation in which an entry and a leaving loop is provided in each lane of a carriageway. It is also known to provide additional combinations of entry and leaving loop so that, for example, for a two lane highway there may be three entry and leaving loop combinations with an additional loop combination located along the centre line of the highway between the two lanes. Similarly, for three lane highways, it is known to provide five entry and leaving loop combinations spread across the carriageway. Many aspects of the present invention are equally applicable to these alternative
arrangements.
Referring now to Figure 2, a typical electronic installation for vehicle sensing apparatus of the type defined is shown. The various sensor loops, as illustrated in Figure 1, are represented generally by the block 20. Each of the entry and leaving loops are connected to detector electronics 21 which provides the signal generation circuit for the various loops. The detector electronics may be arranged to energise each of the loops at a particularly detector station (e.g. as illustrated in Figure 1) simultaneously so that four sensor signals are then produced by the detector electronics 21 continuously representing the status of each of the loops. However, more commonly, the detector electronics 21 is arranged to energise or scan each of the loops of the detector station
successively, so that a sensor signal for each loop is updated on each scan at a rate determined by the scanning rate. In some examples, each sensor signal is thereby updated approximately every 6 mS.
The raw data representing the sensor signal magnitudes are supplied from the detector electronics 21 over a serial or parallel data link to processing unit 22 in which the data is processed to derive the required traffic information. Aspects of the present invention are particularly concerned with the signal processing which may be performed by the processing unit 22.
Processing unit 22 may be constituted by a digital data processing unit having suitable software control. It will be appreciated that many aspects of the present invention may be embodied by providing the appropriate control software for the processing unit 22.
In Figure 2, the illustrated installation also includes remote reporting equipment 23 arranged to receive the traffic information derived by the
processing unit 22 over a serial link.
Referring now to Figure 3, the variation in sensor signal magnitude for both entry and leaving sensor loops is illustrated graphically for a
relatively short vehicle. Time is shown along the x axis and the illustrated sensor signals, or profiles, are provided assuming a vehicle has past over the entry and leaving loops at a substantially uniform speed. The y axis is calibrated in arbitrary units representing, in this example, the correction count contained in the phase locked loop control circuitry driving the respective loops. The signal profile (or signature) from the entry loop is shown at 30 and the signal profile or signature from the leaving loop is shown at 31.
Figure 4 illustrates how the profiles from a particular loop as illustrated in Figure 3 can be normalised with respect to a maximum amplitude value In the illustrated example, the sensor profile or signature has a single maximum. If this is set at a normalised value, 100, then the normalised values at the other sample points illustrated in Figure 4, can be calculated by dividing the actual magnitude value at these points by the magnitude value at the point of maximum amplitude and multiplying by one hundred. If the profile has two or more maxima or peaks, then the largest is used for normalising.
Providing normalised magnitude values in this way is useful in performing various aspects of the present invention as will become apparent.
Referring now again to Figure 1, a significant problem with sensor installations as illustrated is the possibility of double detection. A vehicle passing squarely over the detection loops in its own lane produces a significant sensor signal magnitude only from the loops in its lane. Referring to Figure 1, vehicle 15 will produce a significant sensor signal magnitude only in entry loop 11 and leaving loop 12 in lane 1, while vehicle 16 will produce significant sensor signals magnitudes only in entry loop 13 and leaving 14 in lane 2. However, a vehicle passing the detector site in some road position between lanes may produce substantial sensor signal magnitudes in the loops in both lanes. For example, vehicle 17 will produce signal magnitudes in all four loops. This leads to a difficulty in discriminating between the case of two cars simultaneously passing over the two adjacent sets of loops (e.g. class cars 15 and 16 in Figure 1) and the case of a single car passing at some position between the detector loops (e.g. vehicle 17 in Figure 1). In prior art installations, the signal magnitude produced by this latter case (vehicle 17) would often exceed the detection thresholds of the loops m both lanes. It is important for many applications of vehicle detection that these two cases be correctly recognised. A single vehicle being detected in two lanes is termed a "double detection".
In order to differentiate between these two cases, the processing unit 22 in Figure 2 is arranged to measure the peak amplitudes of the signals from adjacent loops, that is the entry loops 11 and 13 or the leaving loops 12 and 14. The processing unit is then arranged to take the geometric mean of these two amplitude values and compare that mean against one or more threshold values.
it has been found that the geometric mean of the maximum amplitudes in adjacent sensors for a double detection event tends to be substantially below the geometric mean where separate vehicles are being detected in adjacent lanes.
Generally, it may be satisfactory in some
installations to use only a single threshold set at a level to distinguish between double detection and genuine two vehicle detection events. The threshold can be set empirically. A single threshold may be sufficient if the adjacent loops in the two lanes are sufficiently spaced apart so that the sensor signal magnitude from adjacent loops produced by a single vehicle between the loops is likely to be relatively low in at least one of the two adjacent loops.
However, in other installations two thresholds may be required, one set sufficiently low to identify clear double detection events with confidence, and the other threshold set rather higher to provide an indication of a possible double detection event. The processing unit is then arranged in response to a possible double detection event, where the geometric mean is only below the upper threshold and not the lower threshold, by performing other tests on the signals from the loops to confirm the likelihood of double detection. The further tests may include checking that the speed measured from the loop signals in the two lanes is substantially the same and also confirming that the measured length in the two lanes is substantially the same. Another check is to confirm that the signal profile from one of a pair of adjacent loops in the two lanes is contained fully within the profile from the other loop.
As mentioned above, it is desirable for vehicle sensor apparatus of the type defined to be used to provide a measure of the length of vehicles passing along the highway. The length of the vehicle passing over a sensor site can be determined by measuring properties of the signal profile or signature obtained from one or both of the entry and leaving loops. The length may be determined either dynamically, requiring a knowledge of the vehicle speed, or statically.
Static measurements have an advantage over dynamic measurements in that they can be made in stop-start traffic conditions, while dynamic measurements require vehicle speed to be reasonably constant while passing over the sensor site. On the other hand dynamic measurements can in some cases be more accurate and reliable.
One dynamic method for determining speed relies on measuring the time between points on the leading and trailing edges of the sensor signal profile as a vehicle passes a sensor loop. Thus, the processing unit may be arranged to determine the time between predefined points on the leading and trailing edges. In one example, the predefined points may be points of inflexion on these edges. A point of inflexion is defined as the point of maximum gradient.
One method of determining the timing of the points of inflexion on the leading and trailing edges is by determining the times at either side of the inflexion point where the signature slope is somewhat less than its maximum and then finding the mid point between these upper and lower points. This method is used to avoid the effect of transient distortions of the signal profile, which may for example be caused by suspension movement of the vehicle travelling over the sensor. A transient distortion could result in a single measurement of the point of maximum slope being incorrect. Several measurements could be taken at different slopes on either side of the inflexion point and then a central tendency calculation applied to these measurements to obtain the inflexion point times to be used for calculating the length of the vehicle.
In order to ensure that a point having a predetermined reduction in slope from the point of maximum slope is genuine and not due to a transient profile distortion, a further measurement can be made further along the slope away from the inflexion point to confirm that the slope reduction is sustained.
It has been mentioned above that the signal magnitude data available from the sensing apparatus may not be available continuously but only at regular time intervals corresponding to the scanning rate of the sensor energising electronics. This can produce quantisation effects so that it is not possible to obtain the timing of precise slope values on the signal profile. In this case, measurements can be made at slope segments that are close to the required slopes on either side of the inflexion and the timing of the inflexion point is then corrected for the difference between them according to the equation below:
Figure imgf000014_0001
Where:
Timeinfl is the calculated time of the inflexion point;
Timelow is the time of the mid point of the low magnitude curve segment with a reduced slope close to the required value;
Timehigh is the time of the mid point of the high magnitude curve segment with a reduced slope close to the required value;
Slopelow is the height on the y axis of the low magnitude curve segment used for timelow,
Slopehigh is the height on the y axis of the hign amplitude curve segment used for timehigh; and
Timequantisation is the time interval between sensor signal samples forming the signal profile. In order better to understand the above equation, reference should be made to Figure 5.
For the trailing edge of the signal profile the inflexion time can be determined from the following equation:
Figure imgf000015_0001
In order to improve the accuracy of the length measurement, time differences can be determined from the signal profiles of both the entry and leaving loops of an installation such as illustrated in Figure 1.
In order to determine a value for the length of the vehicle from the elapsed time measurement made as above, it is necessary to κnow the vehicle speed.
This may be provided separately by some other speed sensing device, e.g. a radar device synchronised with the loop sensors. However, more preferably, the speed will be derived also from the loop sensor signals in various ways as will be described later nerein.
It may oe appropriate to modify the length measurement obtained directly from the product of the measured elapsed time and speed by adding an
empirically derived correction constant. Other empirically derived corrections to the length
calculation may also be made to improve accuracy.
Instead of measuring the elapsed time between inflexion points on the leading and trailing edges of a signal profile, the signal processing unit may instead be arranged to measure the time between points on the respective edges at which the sensor signal has a magnitude which is a predetermined fraction of the nearest adjacent high signal magnitude. The "high signal magnitude" is defined as the magnitude at the nearest minimum in the modulus of the gradient of the profile. In a case where the signal profile is as illustrated in Figure 4, the first point at which the modulus of the gradient reduces to a minimum value and then rises again (is at a minimum) is in fact at the maximum amplitude of the signal profile. At this point, of course, the modulus of the slope falls to zero before it rises again (as the slope becomes negative). However, it has been observed that the signal profiles generated by larger vehicles may have one or more "shoulders" in the leading or trailing edges of the profiles, such as is shown in the leading edge of the profile illustrated in Figure 6. These shoulders occur in larger vehicles because the vehicle is magnetically non uniform. The shoulder may
represent a point in the signal profile where a first peak would have occurred, but the influence of a more distant but magnetically larger element of the vehicle approaching the sensor loop has overwhelmed the local effect on the loop. It has been found desirable in determining the length of such vehicles from the leading and trailing edges of the signal profile produced, to take account of these initial effects resulting from the front or rear of the vehicle first entering or leaving the sensor loop.
It will be seen that in the case of a shoulder as indicated at 60 in Figure 6, the gradient of the leading edge declines from a maximum value to a minimum slope at point 60 before increasing again. Thus, at point 60 the modulus of the slope has a minimum at point 60.
It has been found useful to take note of
shoulders in the leading or trailing slopes of the profile only if the shoulder is of sufficient
significance in relation to the whole edge up to the first magnitude maximum or peak. With this in mind, a shoulder is taken into consideration only if it involves a significant reduction in the slope of the edge, to approximately 25% or less than the maximum slope on the edge, and if the shoulder point is at a signal magnitude that is a substantial portion of the nearest signal peak, approximately 65% or more. Also the shoulder is taken into consideration only if the slope is of significant duration for example continues to be less than 35% of the maximum slope for at least 15% of the total duration of the edge up to the first peak. Also, it is important that the shoulder is detected in the signal profiles from both the entry and leaving loops.
Shoulders need only be considered when the application needs to measure the length of longer vehicles with high accuracy. Otherwise the first and last peaks greater than 15% of the overall maximum can be considered as the high signal magnitude.
Where a shoulder is taken into consideration, the magnitude of the signal value at the shoulder (the high signal magnitude) is taken to be the magnitude at the point of minimum slope on the shoulder.
In this method of determining the length of the vehicle, the selected points on the leading and trailing edges between which the time duration is measured are selected to have magnitudes which are the same fraction of the nearest peak or shoulder. Thus, looking at Figure 6, the time duration is determined between a first point at time tleading25 and a second point at time ttrailing25. The first point is when the signal magnitude on the leading edge reaches 25% of the magnitude at the shoulder 60. The second point is when the signal magnitude on the trailing edge
declines to 25% of the magnitude at the adjacent peak 61. The length of the vehicle is then taken to be the time between these two points ( tlength25) multiplied by the measured speed of the vehicle.
25% is considered to be a fraction which can best relate to precisely when the front or rear of a vehicle crosses the centre point of the respective loop. If other fractions are used to determine the time measuring points, corrections may be built in to the calculation used for the length. The most
appropriate fraction and correction to be used can be determined empirically. Further empirically derived corrections may be made to the calculated length as required. Also, the time spacing between points at several different fractions of the nearest peak or shoulder on the leading and trailing edges of a single profile can be measured and each corrected in
accordance with appropriate empirically derived factors and constants. The various length
measurements thereby determined can then be combined to provide a measure of central tendency. In addition measurements may be made from the sensor signal profiles from both the entry and leaving loops. To provide further confidence in the resulting value, a shoulder or a maximum amplitude value in a signal profile is used in the calculation only if it is found to be present in the signals from both the entry and leaving loops. For this purpose, if the normalised magnitude at the shoulder or peak is within 10% of the same value in the profiles from the two loops, then the shoulders or peaks in the two profiles are considered matched.
It is also possible to determine the length of a vehicle from a single signal profile by deriving empirically a function which relates the shape of the profile to vehicle length. It is necessary to
normalise the signal profile relative to the amplitude of the highest peak of the profile. The signal processing unit can then be arranged to determine the normalised magnitude values of the signal profile at a series of times along the profile which, knowing the speed of the vehicle, corresponds to predetermined equal distances in the vehicle direction of travel.
These normalised magnitude values at the predetermined incremental distances along the profile can then be inserted into the empirically derived function stored in the processing unit in order to derive a value for the vehicle length. In performing this calculation, it is preferable to ignore magnitude variations in a single signal profile between first and last peaks or high signal magnitudes of the profile and so it is convenient to set the magnitude value between the peaks at the normalised value for one or other of the peaks, so as to reduce the complexity of the
empirically derived function.
Another method of determining the length of a vehicle uses the signal profiles from both the entry and leaving loops. Referring to Figure 7, the entry and leaving loops 70 and 71 are shown overlapping at a timeeq. It has been found that the value of the magnitude of the profiles at the point in time when these magnitudes are equal is approximately linearly related to the length of vehicle. Preferably, the normalised profile magnitudes are used to find the point of equality on overlap of the trailing and leading edges. Thus the equal magnitude point
illustrated in Figure 7 is at 28% of the peak
amplitude of each of the profiles 70 and 71. It should be appreciated that although the profiles 70 and 71 are shown to have identical peak amplitudes in Figure 7, these are in fact the normalised profiles and the actual magnitudes of the two peaks need not be precisely the same. Variations may occur due to differences in the installation of the entry and leaving loops or due to suspension movement of the vehicle when crossing the loops, or to other causes.
In the case of a loop installation such as illustrated in Figure 1, it has been found that the vehicle length (lengtheq) can be related to the equal magnitude value at the point of overlap of the
profiles (leveleq) by the equation:
Length = 3+ Level × 4 (metres) where level is expressed as a fraction of unity (e.g. 0.28 for the example of Figure 7).
The above described technique for determining the length of a vehicle has the advantage of providing a length measurement irrespective of the speed of the vehicle passing the sensors. In practice, the
processing unit is arranged to record magnitude values from the two sensor loops at least over the full trailing edge of the signal from the entry loop and the full leading edge of the signal from the leaving loop. Then the necessary calculations can be done to normalise the magnitude values once all the values have been recorded, irrespective of the speed of the vehicle and the corresponding time taken for the signals to decline back to the base value.
It can be seen that the above described method of determining the vehicle length can work only in cases where the trailing edge of the entry loop signal and the leading edge of the leaving loop signal do in fact overlap to produce an intersection point. This will generally occur only for relatively shorter vehicles. The minimum vehicle length which can be measured in this way corresponds to the minimum vehicle length which continues to produce a signal in both the entry and leaving loops as the vehicle travels between the two. If the vehicle is too short there is a point at which there is no signal detected in either loop so that, as shown in Figure 9, the trailing and leading edges of the two profiles do not overlap. This corresponds to level from the above equation being zero.
The maximum vehicle length which can be measured is as represented in Figure 8 where the last amplitude peak in the signal profile from the entry sensor coincides with the first amplitude peak of the signal profile from the leaving sensor, so that again there is no point of intersection between the trailing and leading edges of the profiles. This corresponds to level having the value 1 in the above equation.
Thus, for an installation corresponding to that shown in Figure 1, the above method is capable of measuring vehicle lengths only between three and up to about seven metres. Nevertheless, for shorter or longer vehicles, the method can still provide an indication of the maximum or minimum length respectively.
Another method of measuring the length which can be used for relatively longer vehicles and which also does not require a speed measurement is illustrated in Figure 10.
This method relies on the empirical knowledge of the spacing of the entry and leaving loop centres and that the leading edge of a signal profile between the point of first detection of a vehicle and the first maximum amplitude (or substantial shoulder as defined before) corresponds to a reasonably predictable total distance of movement of the front of the vehicle for any particular installation.
For example in an installation corresponding to that shown in Figure 1, a vehicle is first detected when the front of the vehicle is typically 1 metre from the centre of the entry loop, that is
approximately over the front edge of the entry loop. When the front of the vehicle is directly over the centre of the entry loop (that is overlapping the loop by 1 metre from the front of the loop) the signal from the loop has a normalised magnitude of 25% of the adjacent peak amplitude. The signal magnitude reaches 75% of the peak when the front of the vehicle is aligned over the rear edge of the entry loop and the first peak in the profile is reached when the front of the vehicle is 1 metre beyond the rear edge of the loop, in fact at the mid point between the entry and leaving loops of the installation of Figure 1.
The above determinations are made empirically for any particular loop installation and the appropriate values can be determined for any particular
installation.
The position of the front of a vehicle relative to the mid point of the leaving loop is shown along the x axis of Figure 10, which illustrates the signal profiles from entry and leaving loops 80 and 81 respectively, corresponding to a relatively long vehicle.
In order to perform the length measurement technique illustrated in Figure 10, the processing unit is arranged to record the magnitude values of the sensor signals from both the entry and leaving
sensors. The magnitude values for the two profiles recorded at substantially the same times are
correlated. Thus, for example, it is possible to determine the magnitude value of a point 82 on the entry loop profile 82 which corresponds in time with a point 83 on the leading edge of the leaving loop profile 81 which has a magnitude at 25% of the
amplitude of the adjacent peak 84 on the profile 81.
The processing unit is then further arranged to provide a profile correlating function which can compare the profile of the entry and leaving loop signals to identify points on the profile of one loop which correspond in terms of profile position to points on the profile from the other loop. This is possible because the processing unit has a record of the signal magnitude value for both profiles. It is therefore straightforward for the processing unit to track through its record of magnitude values for one profile to identify a point in the profile which corresponds to any particular point in the other profile.
Thus, once the point 82 on the entry loop profile in Figure 10 has been identified, the corresponding point 85 on the leaving loop profile can be determined by profile correlation. It should be understood that, whereas point 82 is time correlated with point 83, i.e. was recorded at the same time, point 85 is profile correlated with point 82, i.e. was recorded at a different time but is in the corresponding position in the two profiles.
The shift between the points 82 and 85
corresponds to a shift along the length of the vehicle equal to the distance between the centres of the entry and leaving loops, 4 metres in the example of Figure 1. Thus, the point 85 on the leaving loop profile corresponds to a position where the centre of the leaving loop is 4 metres from the front of the
vehicle.
Having identified the point 55, the processing means can now perform a repeat time correlation to identify the time correlated point 86 on the entry loop profile which was recorded at the same time as point 85 on the leaving loop profile. This newly identified point 86 on the entry loop profile may again be profile correlated with a point 87 on the leaving loop profile. This point 87 now corresponds to the centre of the leaving loop being 8 metres from the front of the vehicle.
The point 87 may again be time correlated with a point 88 on the entry loop profile and the point 88 once again profile correlated with a point 89 on the leaving loop profile. This point 89 now corresponds to the centre of the leaving loop being 12 metres from the front of the vehicle. One further iteration of time correlation to point 90 and profile correlation to point 91 identifies a point on the leaving loop profile which corresponds to the front of the vehicle being 16 metres in front of the centre of the leaving loop.
At this point, the processing unit can determine that point 91 is in fact on the trailing edge of the leaving loop profile and can also determine the normalised magnitude of the point 91 relative to the immediately preceding peak amplitude on the profile. For example, in the example of Figure 10, point 91 is at approximately 46% of the amplitude at peak 92.
From an empirical knowledge of how the trailing edge of a profile relates to the position of the tail of a vehicle, the processing unit can make a further calculation to determine an additional length
component to be added to the 16 metres already
determined for the length of the vehicle. In an installation corresponding to that shown in Figure 1, a suitable additional component can be calculated as (46 - 25)/50 = 0.42 metres.
Accordingly, the overall length of the vehicle can be calculated as 16.42 metres.
An additional constant correction may be applied derived by empirical testing.
It may be appreciated that the above procedure may be repeated for a number of different starting positions on the leading edge of the leaving loop, with an appropriate correction being made for the empirically derived position of the point of starting the measurement from the centre of the leaving loop. The various measurements derived may be combined to obtain a value for the central tendency.
Also, although the process has been explained by starting with a predetermined point on the leading edge of the leaving loop, the process could also be performed by starting with a predetermined position on the trailing edge of the entry loop and working forward in time along the profiles until reaching a point on the leading edge of the entry loop.
Importantly, the above procedure can be performed irrespective of the speed of the vehicle. The profile correlation can be performed using only the way in which the magnitude values of each of the two profiles varies.
A further static method for determining vehicle lengths is illustrated in Figure 11. In this method, the processing means is arranged to record the
magnitude values for the profiles from the entry and leaving loops 95 and 96, at least from the amplitude peak or high signal magnitude of the entry loop profile 95 over the trailing edge of the profile, and over the leading edge of the leaving loop profile 96 up to its first amplitude peak or high signal
magnitude. Then, the normalised magnitude values in the trailing and leading edges of the two profiles at a number of different time points are measured. These pairs of normalised magnitude values taken at
individual time points can be used directly to derive a value for the length of the vehicle.
In a simplified form, the time points are
determined to correspond with predetermined normalised amplitude values on one of the two edges. Then it is necessary only to record the normalised magnitude values at these time points on the other of the two edges and use these values in an empirically derived function to provide a value for the vehicle length.
In the example illustrated in Figure 11,
normalised magnitude values are measured on the trailing edge of the entry loop profile 95 at times corresponding to normalised magnitude values on the leading edge of the leaving loop profile 96 of 10%, 20%, 30%, etc. up to 100%. Thus, the 10% magnitude value on the leaving loop profile 96 produces sample 1 from the trailing edge of the entry loop, the 20% value produces sample 2 and so forth. These samples can be directly introduced into an empirically derived function relating these sample values to vehicle length.
The advantage of this technique is that it is relatively insensitive to transient distortions of either profile, e.g. resulting from suspension
movement of the vehicle.
If any samples are taken at a time earlier than the last peak of the profile, then these samples are set at a normalised height of 1.0 (100%) in order to reduce the complexity of the transfer function used. This can occur, for example, if the two profiles in Figure 11 are closer together so that the 10% sample from the leading edge of profile 96 corresponds to a point on profile 95 before the peak of the profile.
It can be seen that this technique is again useful only for relatively shorter vehicles and for an installation corresponding to that in Figure 1, the method can be used to determine lengths only between about 3 and 7 metres.
An important part of many vehicle sensing
installations is to be able to handle high traffic flows and stop-start driving conditions. Existing installations are unreliable under these conditions.
The above described static methods of measuring vehicle lengths may be particularly useful in traffic monitoring in high congestion conditions. It is also important that the entry loop of a detection loop pair is cleared ready for a subsequent vehicle detection event as soon as the signal profile from the loop has declined substantially to zero, even if the signal from the leaving loop of the pair is still high. The processing unit is arranged to capture all the data from the entry loop and hold this data available for appropriate comparisons with the data from the leaving loop once this becomes available. The processing unit is simultaneously then able to record fresh signal data from the entry loop, which would correspond to a following vehicle, even while still receiving data from the leaving loop corresponding to the preceding vehicle.
Indeed, it is an overall unifying concept of the various aspects of this invention that the signal processing unit records all the signal magnitude data from the two sensors of a road vehicle sensing
apparatus of the type defined with two successive sensors, and includes means for processing this data to derive vehicle characteristic information once all the data has been received and recorded. The
processing unit can be arranged to separately record data from the entry sensor corresponding to a second vehicle, whilst still recording data from the trailing sensor corresponding to the first vehicle. For installations in a carriageway of a multi lane
highway, the signal processing unit is also arranged to record all the signal magnitude data from the sensors in all lanes, for subsequent processing as required.
A further important characteristic of a useful road vehicle sensing apparatus is to be able to identify gaps between vehicles travelling very close together so that tailgating vehicles can be separated even when their sensor profiles overlap.
One method of detecting tailgating involves the processing unit monitoring a characteristic of the profiles of signals from the entry and leaving sensors and comparing the characteristic of a profile from the entry sensor with the characteristic in the next following profile from the leaving sensor and
providing a tailgating indication if there is a substantial difference between these characteristics. The selected characteristic may be the signal magnitude at a minimum in the profile from the two sensors.
If a minimum occurs in the profiles from the entry and leaving sensors which has a magnitude
(normalised relative to the peak amplitude of the profiles) which is less than a predetermined
threshold, and is substantially different in the profiles from the two sensors, then tailgating is indicated. This would arise when two vehicles following closely behind one another cross the entry and leaving sensors with different spacings between the two vehicles so that the minimum signal level in the joint profiles is different from the two sensors.
It may be necessary to ensure that the detected minimum is genuine by checking also if the profile magnitude after the minimum rises above a second threshold higher than the first threshold. In one arrangement, the processing unit is arranged to consider minima only if they satisfy this criterion.
Tailgating may also be detected if there is a minimum in the profile from the entry loop satisfying the required criterion and where the profile from the leaving loop drops substantially to zero before rising again. This corresponds to the case where two
vehicles are close together when passing over the entry loop but the first vehicle clears the leaving loop before the second vehicle is detected by the leaving loop.
Tailgating may also be indicated if there is a substantial minimum in the profile from the leaving loop even though the profile from the entry loop had previously dropped to zero. This would correspond to the case where a vehicle has past normally over the entry loop, clearing it before a second vehicle is detected by the entry loop, but the second vehicle then comes very close to the first vehicle before the first vehicle clears the leaving loop.
It may be necessary to make the threshold for detecting a minimum in this particular case lower than the predetermined threshold used for detecting
tailgating when minima are found in the profiles from both loops. This is necessary to avoid indicating tailgating when a single vehicle having a minimum in its profile which would be normally slightly above the main threshold used for both the entry and leaving loops but is transiently below this threshold as the vehicle passes the leaving loop, e.g. due to
suspension movement or other variables between the two loops.
The main threshold used for detecting minima in both entry and leaving loops can be made dependent on traffic speed. A level of 30% of the profile maximum amplitude may be satisfactory as a minimum detection threshold at low speeds, dropping to zero at speeds in excess of 7 metres per second. This can achieve a high vehicle count accuracy in most conditions. To reduce the minimum detection threshold at higher vehicle speeds is not essential for operation of the tailgating detection algorithm, but can slightly improve count accuracies at these higher speeds.
In order to determine whether minima detected in the entry and leaving sensor profiles are
significantly different, a difference of about 10% in magnitude is considered sufficient.
If the method is arranged to reduce the minimum detection threshold at higher speeds, then a value for speed must be obtained. An approximate speed value can be determined by measuring the time between different predetermined normalised magnitude levels on the leading or trailing slope of a signal profile. For example, in the installation illustrated in Figure 1, it has been shown empirically that for most vehicles, the difference on the leading edge of a profile between the signal magnitude of 25% of the nearest peak (or high level) and 75% corresponds to movement of the front of a vehicle by 1 metre. Thus, if the time between the attainment of these two values on the leading edge of a profile is measured, the approximate speed of a vehicle can be determined directly. Different calculations can be made for different selected threshold levels and in different installations.
In order to measure the speed of vehicles passing over the detector loops, the time difference can be measured between corresponding features in the signal profiles from the entry and leaving loops.
Knowing the spacing of the loops in a particular installation, the speed can be calculated directly.
However, two factors can lead to the speed measured in this way being different from the actual speed of the vehicle. The first is when the road vehicle sensing apparatus produces sensor signal values at discrete sampling times, corresponding to the scanning rate between the various loops of the installation. Then, the actual time of occurrence of a particular feature in a signal profile is
indeterminate by plus or minus half the sampling period (which may be 6 mS or more). This can
represent a speed measurement error of about ±2½% at
70 mph using a base line corresponding to the spacing of the centres of the entry and leaving sensors of 4 metres.
The second factor introducing errors is that transient distortions of the signal profile can cause a particular profile feature being used for the speed measurement to appear slightly before or after its correct time.
The first of these factors can be addressed by interpolating between individual signal magnitude level samples received at the sampling rate, to discover the correct timing for a particular feature (e.g. a required magnitude value). In the particular case where the profile feature being used for the speed measurements is a particular signal magnitude, ordinary linear interpolation can be used to find the correct time between two samples on either side of the desired magnitude.
When the required feature on each profile is a profile peak or trough, then a form of interpolation can also be used using the differences between the intended peak or trough value and the magnitude values obtained which are closest to the peak or trough values. If the highest magnitude value obtained at the sampling rate is at time T1 (or the lowest when the required feature is a trough), S1 is the difference between this highest sample value and the preceding sample value and S2 is the difference between the highest value and the next sample value (at time T2) then the interpolated time Tfeature of the feature itself is given by:
Figure imgf000032_0001
In order to deal with the second factor producing errors in speed measurements, multiple matched profile features can be used from the two loop profiles. For example, multiple levels on leading and trailing profile edges can be timed relative to corresponding levels on the edges of the other profile and a speed measurement obtained for each matched pair. Then error theory can be used to determine the central tendency of the resulting values.
Throughout the preceding description, it should be understood that where examples of the invention have been described in relation to a processing unit or processing means arranged to perform the various functions, the examples could also be considered as methods or processes. In practice, the various aspects and features of the invention may all be provided as software algorithms controlling a suitable data processing unit.
The invention contemplated herein is constituted not only by a signal processing apparatus for
processing said signals from a road vehicle sensing apparatus of the type defined preferably for a multi lane highway and with two successive sensors in each single lane, but is also constituted by a road vehicle sensing apparatus in combination with the signal processing apparatus described.
There follows a description of the software structure which may be created to implement the various processing steps described above. The
following description is made in terms of various software modules, forming State Machines, which will be understood by those familiar with programming techniques.
1. SYSTEM OPERATION
Refering to Figure 12, the system takes data from loop detectors, conditions the data via a Loop state machine if required, and processes the data from loop pairs in each lane to determine events that represent the passage of vehicles over each lane's detector site. The purposes of each element in Figure 12 are:
Loop state machine:
To condition the data from each loop, for example to subtract any residual baseline from the data, to apply gain variation if the sensitivities of the loops varies, to track the baseline if it drifts.
To detect if a loop has entered a fault state.
The nature of the loop state machine, and the need for such will depend entirely on the nature of the detectors used. Lane processing:
To manage the event state machines receiving data from the loop pair in a lane. To direct the data from the loops in a lane to the appropriate event state machines, as
determined by the operation of those state machines. To maintain configuration information for each lane, for example the dimensions of the detection site. Event state machine:
To receive data from a loop pair in a lane and determine when vehicles have passed over the site.
To interact with a Tailgating state machine to determine when a signature indicates that two vehicles are tailgating.
To interact with the Event state machines
handling the data for the lanes on each side (if there are such lanes), to determine when a vehicle is straddling the two lanes.
Tailgate state machine:
To determine when a signature indicates that two vehicles are tailgating.
To determine the point in the signature where it must be split so that there are separate
signatures for each of two vehicles that are tailgating. This must be done for both loops in a lane if both loops display tailgating
signatures.
The input data is normally samples of the output from the loop detectors taken at regular intervals, although other presentations can be provided. The output data depends on the nature of the application, but may be:
• Records describing each vehicle passing over the site, for example the speed, length, time over each loop, time at which the vehicle started and ended its site traversal, and the signature of the vehicle over each loop. • A summary of the traffic over the site during a period.
• An alarm for vehicles meeting certain criteria such as speed or length. • Other data as required.
In operation, data is received and conditioned by the Loop state machines, and passed to the event state machine for examinination.
There are multiple event state machines simultaneously available for each lane, and several may be actively processing events in each lane at any time. The need for multiple machines can be understood by mentally following the progress of vehicles over the detection site. Consider the case of two vehicles travelling close one behind the other in a lane. As the first passes over the site and is proceeding over the exit loop, the second may already be starting to pass over the entry loop. Since the purpose of an Event state machine is to track the progress of a vehicle from entry onto the site until it is completely clear of the site, it can be seen that in this case two state machines are required. One is handling the vehicle currently moving off the site, and one the vehicle currently moving onto the site.
The possibility of vehicles straddling between lanes increases the need for more active Event state machines, particularly where there are more than two lanes in a carriageway. Suppose on a three lane carriageway that there is a long vehicle with three cars at its side, and all are straddling lanes because of an obstruction. It is not possible to be sure that the truck is not several tailgating vehicles until it has completely passed over the detection site, and all of the cars alongside must remain part of the double detection configuration until the last of the four vehicles is off the site, when the whole configuration can be fully evaluated. All of the state machines must remain active until this time, so more are needed.
The operation of the Event state machines depend on the data presented, previous data presented, the states of the state machines handling the lanes on either side, the mode of the system, and the state of the loop detectors. The Lane Processing module directs loop data to the appropriate state machine under direction from the Event state machines
themselves, which decide which loops in a lane each should be receiving data from, depending on the signature presented. The Event state machines are associated with a
Tailgate state machine when they are active, and pass information to their Tailgate state machine so that it can determine if tailgating is occurring. The
relevent information is the locations of maxima and minima in the data, and when the loops drop out of detection.
If the Tailgate state machine determines that
tailgating is occurring, it will split the signatures obtained by its associated Event state machine at the appropriate point. Frequently it will be necessary for a Tailgate state machine to find an unused Event state machine to move part of the signature to. It then sets the states of the Event state machines to be compatible with the new view of the data and directs loop data to the appropriate Event state machine.
Following this the processing of data proceeds as normal. Following sections describe the operation of Event and Tailgate state machines. The loop state machine is not described because it is dependent on the particular detectors used. 2. The State Machines
Figure imgf000038_0001
Figure imgf000039_0001
Figure imgf000040_0001
Figure imgf000041_0001
Figure imgf000042_0001
Figure imgf000043_0001
Figure imgf000044_0001
Figure imgf000045_0001
Figure imgf000046_0001
Figure imgf000047_0001
Figure imgf000048_0001
Figure imgf000049_0001
Figure imgf000050_0001
Figure imgf000051_0001
Figure imgf000052_0001
Figure imgf000053_0001
Figure imgf000054_0001
Figure imgf000055_0001
Figure imgf000056_0001
Figure imgf000057_0001
Figure imgf000058_0001
Figure imgf000059_0001
Figure imgf000060_0001
Figure imgf000061_0001
Figure imgf000062_0001
Figure imgf000063_0001
Figure imgf000064_0001
Figure imgf000065_0001
Figure imgf000066_0001
Figure imgf000067_0001
Figure imgf000068_0001
Figure imgf000069_0001
Figure imgf000070_0001

Claims

CLAIMS :
1. Signal processing apparatus for processing sensor signals from a road vehicle sensing apparatus of the type defined for a multi lane highway, comprises means arranged to monitor the timing of sensor signals generated from sensors in adjacent lanes of a highway and to provide an indication when such sensor signals could correspond to a double count with a single vehicle being detected by both sensors, and means arranged to respond to said indication from said monitoring means to calculate the geometric mean of the amplitudes of the sensor signals from the sensors in adjacent lanes, and to provide a double count indication if said geometric mean is below a
predetermined threshold value.
2. Signal processing apparatus as claimed in Claim
1, wherein said means arranged to respond is further arranged to provide a probable double count indication if said geometric mean is above said predetermined threshold value but below a higher predetermined threshold value, and the apparatus further comprises additional testing means responsive to said probable double count indication to test for a double count.
3. Signal processing apparatus as claimed in Claim
2, wherein said additional testing means is arranged to confirm a double count if the envelope of the sensor signal from one sensor is contained entirely within the envelope of the signal from the other sensor after allowing for any timing difference corresponding to the adjacent sensors not being aligned across the width of the highway.
4. Signal processing apparatus for processing sensor signals from a road vehicle sensing apparatus of the type defined, comprising timing means arranged to provide indications of the time between predefined points on the leading and trailing edges of a sensor signal produced by a vehicle travelling past the sensor, and calculating means arranged to calculate a value for the length of said vehicle from the product of said time and a value for the speed of the vehicle.
5. Signal processing apparatus as claimed in Claim 4, wherein said timing means is arranged such that said predefined points are points of maximum gradient on said respective edges.
6. Signal processing apparatus as claimed in Claim 4, wherein said timing means is arranged such that said predefined points are points on said respective edges at which the sensor signal has a magnitude which is a predetermined fraction of the nearest adjacent high signal magnitude, said nearest adjacent high signal magnitude being taken as the magnitude at the nearest minimum in the modulus of the gradient.
7. Signal processing apparatus as claimed in Claim 6, wherein said timing means is arranged to disregard a nearest minimum for which the minimum gradient is more than 25% of the maximum gradient in the
respective edge.
8. Signal processing apparatus as claimed in Claim 6 or 7, wherein said timing means is arranged to
disregard a nearest minimum for which the signal magnitude is less than 65% of the magnitude at the nearest maximum point where the gradient is zero.
9. Signal processing apparatus as claimed in any of Claims 6 to 8, wherein said timing means is arranged to disregard a nearest minimum for which the gradient is not less than 35% of the maximum gradient in the respective edge for at least 15% of the duration of the edge.
10. Signal processing apparatus as claimed in any of Claims 6 to 9, wherein said timing means is arranged such that said predetermined fraction is in the range 25% to 75%.
11. Signal processing apparatus for processing sensor signals from a road vehicle sensing apparatus of the type defined, comprising recording means arranged to record magnitude values for a sensor signal taken at a plurality of intervals as a vehicle passes the sensor, means arranged to provide a value for the speed of the vehicle, said intervals being selected in association with said speed value to correspond to positions having predetermined spacings along the vehicle, calculating means arranged to calculate values for said recorded magnitudes which are normalised relative to the maximum amplitude of the sensor signal, storage means containing an empirically derived function relating said normalised recorded magnitude values to the length of a vehicle producing said sensor signal, and processing means arranged to derive a value for the length of the vehicle from said function and said normalised values.
12. Signal processing apparatus as claimed in Claim 11, wherein said calculating means is arranged to determine whether the sensor signal has respective separate maxima adjacent the leading and trailing edges of the signal and then to set the recorded magnitudes for each of the intervals between said maxima at the magnitude of one of the maxima.
13. Signal processing apparatus for processing sensor signals from a road vehicle sensing apparatus of the type defined with two successive sensors in a single lane, comprising means arranged to monitor the
trailing edge of the signal from the entry sensor and the leading edge of the signal from the leaving sensor as a vehicle passes the sensors and to determine a value for the signal magnitude at the time when said magnitude values in said trailing and leading edges are substantially the same, and calculating means arranged to calculate a value for the length of the vehicle from said determined signal magnitude value.
14. Signal processing apparatus as claimed in Claim 13, wherein said means arranged to monitor is further arranged to record magnitude values for said sensor signal from the entry sensor at least from the maximum of said signal over said trailing edge, to record magnitude values for said sensor signal from the leaving sensor at least over said leading edge to the maximum of said signal, to correlate the timing of the recorded values from the two sensors, to normalise said recorded values for each of the sensor signals relative to the recorded maximum of the respective sensor signal, and to determine the normalised value at the time when said normalised recorded values in the trailing and leading edges are substantially the same, and said calculating means calculates the length value from said determined normalised value.
15. Signal processing apparatus as claimed in Claim 13, wherein said means arranged to monitor is arranged to determine the actual signal magnitude value when the values in said edges is the same, and said
calculating means calculates said length value from said determined actual value and the maximum amplitude of at least one of the sensor signals.
16. Signal processing apparatus for processing sensor signals from a road vehicle sensing apparatus of the type defined with successive sensors in a single lane, the processing apparatus being for use in determining values for the lengths of vehicles passing the sensors when the vehicles are long enough to extend fully over both sensors simultaneously whereby a first high point in the signal from the leaving sensor occurs before the last high point in the signal from the entry sensor, a high point being defined as a minimum in the modulus of the gradient of the signal, the apparatus comprising recording means arranged to record
magnitude values for the sensor signals from each of said entry and leaving sensors and to correlate the values from one sensor with the values from the other sensor recorded at the same time, identifying means for identifying at least one point on a leading edge of the signal from the leaving sensor or on the trailing edge of the signal from the entry sensor, which point is empirically known to correspond
respectively to a predetermined position of the front of the vehicle relative to the leaving sensor or the rear of the vehicle relative to the entry sensor, time correlating means arranged to correlate said
identified point on the respective above mentioned sensor signal (the first sensor signal) with a time correlated point on the other of said sensor signals (the second sensor signal), profile correlating means arranged to correlate said time correlated point on said second sensor signal with a corresponding point on the profile of said first sensor signal,
representative of the vehicle having the equivalent positions in relation to the two sensors, said time correlating means being further arranged repeatedly to correlate said profile correlated points on said first sensor signal with time correlated points on said second sensor signal and said profile correlating means being further arranged repeatedly to correlate said further time correlated points on said second sensor signal with corresponding points on the profile of said first sensor signal until points have been correlated over the full profile of the first sensor signal, and calculating means arranged to calculate a value for vehicle length from said empirically known predetermined position, the known spacing between the entry and leaving sensor, and the number of
correlations by said profile correlating means.
17. Signal processing apparatus as claimed in Claim 16, and including correction means arranged to
normalise the magnitude value of the final point correlated by said profile correlating means on said first sensor signal relative to the nearest high point in the signal and to correct the calculated length value by an amount dependent on the difference between said normalised magnitude and an empirically
determined reference magnitude.
18. Signal processing apparatus for processing sensor signals from a road vehicle sensing apparatus of the type defined with two successive sensors in a single lane, comprising recording means arranged to record, when a vehicle passes the sensors, magnitude values for the sensor signal from the entry sensor at least over the trailing edge of the signal from the adjacent high point where there is a minimum in the modulus of the gradient of the signal, to record magnitude values for the sensor signal from the leaving sensor at least over the leading edge of the signal to the adjacent high point, and to correlate the timing of the
recorded values from the two sensors, normalising means arranged to normalise the recorded magnitude values for each sensor signal relative to the
magnitude of the adjacent high point of the respective signal, selecting means to select a plurality of points on either one of the trailing edge of the entry sensor signal or the leading edge of the leaving sensor signal (said one edge), said selected points having predetermined normalised signal magnitudes, correlating means arranged to correlate said selected points on said one edge with time correlated points on the other edge and to identify the normalised
magnitude values of said time correlated points, and calculating means arranged to use an empirically derived function to calculate a value for the length of the vehicle from said identified normalised
magnitude values.
19. Signal processing apparatus for processing sensor signals from a road vehicle sensing apparatus of the type defined with two successive sensors in a lane, comprising monitoring means arranged to monitor at least one characteristic of the profiles of signals from the entry and leaving sensors and comparing means arrange to compare said monitored characteristic of a signal profile from the entry sensor with the next following signal profile from the leaving sensor and to provide a tailgating indication if said monitored characteristics in the profiles are sufficient
different to indicate that the two profiles are not produced by a single vehicle.
20. Signal processing apparatus as claimed in Claim
19, wherein said monitoring means is arranged to determine the presence of and measure the magnitude value at a signal minimum of each profile, whereby said magnitude value at the minimum constitutes said characteristic.
21. Signal processing apparatus as claimed in Claim
20, wherein said comparing means is arranged to provide a tailgating indication, if a signal minimum is detected in the signal profile from the entry sensors, but the subsequent profile from the leaving sensor drops directly from its maximum substantially to zero magnitude before rising again.
22. Signal processing apparatus as claimed in either of Claims 20 and 21, wherein said comparing means is arranged to calculate the normalised magnitudes at each signal minimum relative to the maximum amplitude of the respective signal, and to compare said
normalised magnitudes at minima.
23. Signal processing apparatus as claimed in Claim 22, wherein said monitoring means is arranged to determine the presence of a signal minimum only if the normalised magnitude drops below a first predetermined threshold and then rises again above a second
predetermined threshold above said first threshold.
24. Signal processing apparatus as claimed in Claim 23, wherein said comparing means is arranged to provide a tailgating indication if a signal minimum is detected only in the signal profile from the leaving sensor.
25. Signal processing apparatus as claimed in Claim
24, wherein said comparing means is arranged to provide said tailgating indication only if said signal minimum detected only in the profile from the leaving sensor has a normalised magnitude below a third predetermined threshold less than said first
threshold.
26. Signal processing apparatus as claimed in any of Claims 23 to 25, wherein and including speed means arranged to determine from a sensor signal a value for the speed of the vehicle passing the sensor, and said monitoring means is arranged to reduce said first threshold for higher speed values.
27. Signal processing apparatus as claimed in Claim 26, wherein said speed means is arranged to measure the time elapsing between predetermined normalised magnitudes on the leading edge of a signal profile, and to calculate said speed value from said elapsed time and an empirically determined distance
corresponding to said predetermined normalised
magnitudes.
28. Signal processing apparatus for processing sensor signals from a road vehicle sensing apparatus of the type defined, comprising recording means arranged to record, when a vehicle passes the sensor, magnitude values for the sensor signal at least over the leading edge of the signal to the adjacent high point where there is a minimum in the modulus of the gradient of the signal and to record the relative timing of the recorded magnitude values, normalising means arranged to normalise the recorded magnitude values relative to the magnitude of said adjacent high point, timing means arranged to determine from said recorded
relative timing the elapsed time between two
predetermined normalised magnitude values amongst the normalised recorded values, and calculating means arranged to calculate a value for the speed of the vehicle from said elapsed time and an empirically determined distance corresponding to said
predetermined normalised magnitude values.
29. Signal processing apparatus for processing sensor signals from a road vehicle sensing apparatus of the type defined with two successive sensors in a lane, the signal generation circuit of the sensing apparatus operating to provide discrete sensor signal magnitude values at regular timing intervals corresponding to a scanning rate of the circuit, the signal processing apparatus comprising timing means arranged to measure the elapsed time between corresponding points in the respective magnitude profiles of the two sensor signals as a vehicle passes the entry and leaving sensors, and calculating means arranged to calculate a value for the speed of the vehicle from said elapsed time and the known distance between the sensors, wherein the timing means is further arranged to interpolate between time points corresponding to said regular timing intervals.
30. Signal processing apparatus as claimed in Claim 29, wherein said corresponding points in the
respective magnitude profiles are points at a selected magnitude value on corresponding leading or trailing edges if the profiles from the two sensors and the timing means is arranged to determine the timing at least one of said points by identifying the discrete sensor signal magnitude values on either side of said selected value and using the differences between said discrete values and the selected value to calculate a fractional part of said regular timing interval by linear interpolation.
31. Signal processing apparatus for processing sensor signals from a road vehicle sensing apparatus of the type defined with two successive sensors in a lane, comprising timing means arranged to measure the elapsed time between corresponding points in the respective magnitude profiles of the two sensor signals as a vehicle passes the entry and leaving sensors, and calculating means arranged to calculate a value for the speed of the vehicle from said elapsed time and the known distance between the sensors, wherein said timing means is arranged to measure the elapsed times for a plurality of different pairs of said corresponding points and said calculating means is arranged to use the central tendency of said plurality of elapsed times to calculate a more
reliable speed value.
PCT/GB1997/000323 1996-02-06 1997-02-05 Road vehicle sensing apparatus and signal processing apparatus therefor Ceased WO1997029468A1 (en)

Priority Applications (8)

Application Number Priority Date Filing Date Title
AU16114/97A AU1611497A (en) 1996-02-06 1997-02-05 Road vehicle sensing apparatus and signal processing apparatus therefor
AT97902476T ATE197202T1 (en) 1996-02-06 1997-02-05 DEVICE FOR DETECTING ROAD VEHICLES AND SIGNAL PROCESSING DEVICE THEREFOR
BRPI9707364-4A BR9707364B1 (en) 1996-02-06 1997-02-05 signal processing apparatus for processing signals emitted by road vehicle sensing apparatus of a type defined for multi-lane highways.
DE69703382T DE69703382D1 (en) 1996-02-06 1997-02-05 DEVICE FOR DETECTING ROAD VEHICLES AND SIGNAL PROCESSING DEVICE THEREFOR
US09/117,726 US6345228B1 (en) 1996-02-06 1997-02-05 Road vehicle sensing apparatus and signal processing apparatus therefor
EP97902476A EP0879457B1 (en) 1996-02-06 1997-02-05 Road vehicle sensing apparatus and signal processing apparatus therefor
CA002247372A CA2247372C (en) 1996-02-06 1997-02-05 Road vehicle sensing apparatus and signal processing apparatus therefor
GR20010400082T GR3035262T3 (en) 1996-02-06 2001-01-17 Road vehicle sensing apparatus and signal processing apparatus therefor

Applications Claiming Priority (2)

Application Number Priority Date Filing Date Title
GB9602378.3 1996-02-06
GBGB9602378.3A GB9602378D0 (en) 1996-02-06 1996-02-06 Road vehicle sensing apparatus and signal processing apparatus therefor

Publications (1)

Publication Number Publication Date
WO1997029468A1 true WO1997029468A1 (en) 1997-08-14

Family

ID=10788201

Family Applications (1)

Application Number Title Priority Date Filing Date
PCT/GB1997/000323 Ceased WO1997029468A1 (en) 1996-02-06 1997-02-05 Road vehicle sensing apparatus and signal processing apparatus therefor

Country Status (12)

Country Link
US (1) US6345228B1 (en)
EP (4) EP0879457B1 (en)
AT (2) ATE308093T1 (en)
AU (1) AU1611497A (en)
BR (1) BR9707364B1 (en)
CA (1) CA2247372C (en)
DE (2) DE69703382D1 (en)
ES (2) ES2154023T3 (en)
GB (1) GB9602378D0 (en)
GR (1) GR3035262T3 (en)
PT (1) PT879457E (en)
WO (1) WO1997029468A1 (en)

Cited By (3)

* Cited by examiner, † Cited by third party
Publication number Priority date Publication date Assignee Title
WO2016139456A1 (en) * 2015-03-05 2016-09-09 Red Fox I.D. Ltd Vehicle detection apparatus
WO2019020306A1 (en) * 2017-07-25 2019-01-31 Red Fox I.D. Limited Apparatus and methods for assessing vehicles straddled between lanes
ES2823373A1 (en) * 2020-12-18 2021-05-06 Univ Valencia Politecnica SYSTEM AND METHOD OF MONITORING PERSONAL MOBILITY VEHICLES IN URBAN ENVIRONMENTS

Families Citing this family (44)

* Cited by examiner, † Cited by third party
Publication number Priority date Publication date Assignee Title
US7426437B2 (en) * 1997-10-22 2008-09-16 Intelligent Technologies International, Inc. Accident avoidance systems and methods
US7629899B2 (en) 1997-10-22 2009-12-08 Intelligent Technologies International, Inc. Vehicular communication arrangement and method
US8965677B2 (en) 1998-10-22 2015-02-24 Intelligent Technologies International, Inc. Intra-vehicle information conveyance system and method
US8255144B2 (en) * 1997-10-22 2012-08-28 Intelligent Technologies International, Inc. Intra-vehicle information conveyance system and method
US9558663B2 (en) 2000-10-04 2017-01-31 Intelligent Technologies International, Inc. Animal detecting and notification method and system
US8989920B2 (en) 2000-09-08 2015-03-24 Intelligent Technologies International, Inc. Travel information sensing and communication system
US6758089B2 (en) * 2001-07-09 2004-07-06 Intelligent Technologies International Inc. Wireless sensing and communication system of roadways
US9014953B2 (en) 2000-09-08 2015-04-21 Intelligent Technologies International, Inc. Wireless sensing and communication system for traffic lanes
US6973462B2 (en) * 2001-04-03 2005-12-06 Florida Atlantic University Integrated guardianship information system
US7026955B2 (en) * 2001-07-12 2006-04-11 Scott Kauffman Apparatus and method for activating an inductance loop vehicle detection system
US7764197B2 (en) * 2001-10-17 2010-07-27 United Toll Systems, Inc. System and synchronization process for inductive loops in a multilane environment
US7136828B1 (en) 2001-10-17 2006-11-14 Jim Allen Intelligent vehicle identification system
US7324015B1 (en) * 2001-10-17 2008-01-29 Jim Allen System and synchronization process for inductive loops in a multilane environment
US7734500B1 (en) 2001-10-17 2010-06-08 United Toll Systems, Inc. Multiple RF read zone system
US8331621B1 (en) 2001-10-17 2012-12-11 United Toll Systems, Inc. Vehicle image capture system
US7725348B1 (en) * 2001-10-17 2010-05-25 United Toll Systems, Inc. Multilane vehicle information capture system
US6864804B1 (en) 2001-10-17 2005-03-08 Jim Allen Ferromagnetic loop
WO2003077531A2 (en) * 2002-03-08 2003-09-18 Inductive Signature Technologies, Inc. Normalization of inductive vehicle detector outputs
GB2389947B (en) * 2002-07-25 2004-06-02 Golden River Traffic Ltd Automatic validation of sensing devices
JP4098027B2 (en) * 2002-08-01 2008-06-11 松下電器産業株式会社 Wireless base station equipment
GB2385138B (en) * 2002-10-02 2004-02-04 Golden River Traffic Ltd Verification of loop sensing devices
US20040236474A1 (en) * 2003-02-27 2004-11-25 Mahesh Chowdhary Vehicle management system
DE10323144A1 (en) * 2003-05-22 2004-12-09 Robert Bosch Gmbh Method and device for detecting objects in the vicinity of a vehicle
US7079632B2 (en) * 2003-08-28 2006-07-18 International Business Machines Corporation Voice mail profiles for dynamic voice mail response
US7116248B2 (en) * 2003-11-20 2006-10-03 Reno A & E Vehicle detector system with synchronized operation
US7482916B2 (en) 2004-03-15 2009-01-27 Anita Au Automatic signaling systems for vehicles
US7089790B2 (en) * 2004-10-18 2006-08-15 Silverbrook Research Pty Ltd Pressure sensor with laminated membrane
US7327238B2 (en) * 2005-06-06 2008-02-05 International Business Machines Corporation Method, system, and computer program product for determining and reporting tailgating incidents
US7782228B2 (en) * 2005-11-07 2010-08-24 Maxwell David C Vehicle spacing detector and notification system
US7952021B2 (en) 2007-05-03 2011-05-31 United Toll Systems, Inc. System and method for loop detector installation
US8868220B2 (en) * 2007-07-16 2014-10-21 Crucs Holdings, Llc Systems and methods for automatically changing operational states of appliances
US9076331B2 (en) * 2007-07-16 2015-07-07 Crucs Holdings, Llc System and method to monitor vehicles on a roadway and to control driving restrictions of vehicle drivers
US9997068B2 (en) 2008-01-28 2018-06-12 Intelligent Technologies International, Inc. Method for conveying driving conditions for vehicular control
US8417441B2 (en) 2008-07-18 2013-04-09 Sensys Networks, Inc. Method and apparatus generating and/or using estimates of arterial vehicular movement
DE102010013878A1 (en) * 2010-02-16 2011-08-18 Niechoj electronic GmbH, 88085 Road-integrated radar sensor
WO2012015453A1 (en) * 2010-07-29 2012-02-02 Sensys Networks, Inc. Sensor nodes acting as inductive loops for traffic sensing
ES2377613B1 (en) * 2010-08-02 2013-02-01 Universidad Carlos Iii De Madrid METHOD FOR CHARACTERIZING THE ROLLED TRAFFIC.
US8990032B2 (en) 2010-12-30 2015-03-24 Sensys Networks, Inc. In-pavement wireless vibration sensor nodes, networks and systems
JP6007395B2 (en) * 2012-03-13 2016-10-12 株式会社創発システム研究所 Traffic detection system
WO2014134558A1 (en) 2013-02-28 2014-09-04 Naztec, Inc. Wireless vehicle detection system and associated methods having enhanced response time
US9061686B2 (en) * 2013-10-29 2015-06-23 Ford Global Technologies, Llc Road grade estimation for a trailered vehicle
US11151874B2 (en) * 2020-01-23 2021-10-19 Frogparking Limited Vehicle flow monitoring system
US11351999B2 (en) 2020-09-16 2022-06-07 Xuan Binh Luu Traffic collision warning device
US12358518B2 (en) * 2021-09-24 2025-07-15 Embark Trucks, Inc. Autonomous vehicle automated scenario characterization

Citations (3)

* Cited by examiner, † Cited by third party
Publication number Priority date Publication date Assignee Title
US3983531A (en) * 1974-06-10 1976-09-28 Northern Traffic & Signal Systems Ltd. Vehicle-responsive signal means
FR2463412A1 (en) * 1979-08-09 1981-02-20 Philips Nv METHOD AND DEVICE FOR DETERMINING THE SPEED OF A VEHICLE
EP0038539A1 (en) * 1980-04-21 1981-10-28 L' Electronique des Véhicules et des Réseaux EVR ALCATEL Arrangement for road signalling dependent on the speed and dimensions of the vehicle

Family Cites Families (17)

* Cited by examiner, † Cited by third party
Publication number Priority date Publication date Assignee Title
US3863206A (en) * 1974-03-12 1975-01-28 Lee C Rabie Digital Vehicle Detector
US3943339A (en) * 1974-04-29 1976-03-09 Canoga Controls Corporation Inductive loop detector system
US3984764A (en) * 1975-03-03 1976-10-05 Canoga Controls Corporation Inductive loop structure for detecting the presence of vehicles over a roadway
US4568937A (en) * 1982-06-03 1986-02-04 Microsense Systems, Limited Induction loop vehicle detector
US4680717A (en) * 1984-09-17 1987-07-14 Indicator Controls Corporation Microprocessor controlled loop detector system
GB8432807D0 (en) * 1984-12-31 1985-02-06 Emx International Ltd Loop data link
US4943805A (en) * 1986-11-13 1990-07-24 Dennison James L Conduit-enclosed induction loop for a vehicle detector
US5089815A (en) * 1987-05-08 1992-02-18 Detector Systems, Inc. Vehicle communication system using existing roadway loops
JPH0554085A (en) 1991-08-28 1993-03-05 Fuji Xerox Co Ltd Moving image retrieval supporting device
US5408179A (en) * 1991-09-26 1995-04-18 Sampey Scientific, Ltd. Method and apparatus for analying traffic and a sensor therefor
US5455768A (en) * 1992-11-06 1995-10-03 Safetran Traffic Systems, Inc. System for determining vehicle speed and presence
US5491475A (en) * 1993-03-19 1996-02-13 Honeywell Inc. Magnetometer vehicle detector
US6208268B1 (en) * 1993-04-30 2001-03-27 The United States Of America As Represented By The Secretary Of The Navy Vehicle presence, speed and length detecting system and roadway installed detector therefor
US5648904A (en) * 1994-04-25 1997-07-15 Sony Corporation Vehicle traffic system and method
US5512891A (en) * 1994-05-04 1996-04-30 H. M. Electronics, Inc. Drive-up station vehicle detection system and method of using same
US5751225A (en) * 1994-09-12 1998-05-12 Minnesota Mining And Manufacturing Company Vehicle detector system with presence mode counting
US5617086A (en) * 1994-10-31 1997-04-01 International Road Dynamics Traffic monitoring system

Patent Citations (3)

* Cited by examiner, † Cited by third party
Publication number Priority date Publication date Assignee Title
US3983531A (en) * 1974-06-10 1976-09-28 Northern Traffic & Signal Systems Ltd. Vehicle-responsive signal means
FR2463412A1 (en) * 1979-08-09 1981-02-20 Philips Nv METHOD AND DEVICE FOR DETERMINING THE SPEED OF A VEHICLE
EP0038539A1 (en) * 1980-04-21 1981-10-28 L' Electronique des Véhicules et des Réseaux EVR ALCATEL Arrangement for road signalling dependent on the speed and dimensions of the vehicle

Non-Patent Citations (1)

* Cited by examiner, † Cited by third party
Title
GLEISSNER E: "VON VERKEHRSDURCHSAGE BIS MAUTSTATION", FUNKSCHAU, vol. 63, no. 7, 22 March 1991 (1991-03-22), pages 73 - 75, 78, XP000224977 *

Cited By (9)

* Cited by examiner, † Cited by third party
Publication number Priority date Publication date Assignee Title
WO2016139456A1 (en) * 2015-03-05 2016-09-09 Red Fox I.D. Ltd Vehicle detection apparatus
US10109187B2 (en) 2015-03-05 2018-10-23 Red Fox I.D. Ltd Vehicle detection apparatus
WO2019020306A1 (en) * 2017-07-25 2019-01-31 Red Fox I.D. Limited Apparatus and methods for assessing vehicles straddled between lanes
CN111108536A (en) * 2017-07-25 2020-05-05 红狐I.D.有限公司 Apparatus and method for evaluating vehicles straddled between riding lanes
US11263898B2 (en) 2017-07-25 2022-03-01 Red Fox I.D. Limited Apparatus and methods for assessing vehicles straddled between lanes
CN111108536B (en) * 2017-07-25 2022-08-09 红狐I.D.有限公司 Apparatus and method for evaluating vehicles between straddle lanes
ES2823373A1 (en) * 2020-12-18 2021-05-06 Univ Valencia Politecnica SYSTEM AND METHOD OF MONITORING PERSONAL MOBILITY VEHICLES IN URBAN ENVIRONMENTS
WO2022129654A1 (en) 2020-12-18 2022-06-23 Universitat Politècnica De València System and method for monitoring personal mobility vehicles in urban environments
US12243419B2 (en) 2020-12-18 2025-03-04 Universitat Politécnica De Valéncia System and method for monitoring personal mobility vehicles in urban environments

Also Published As

Publication number Publication date
ES2154023T3 (en) 2001-03-16
EP0879457A1 (en) 1998-11-25
GB9602378D0 (en) 1996-04-03
DE69703382D1 (en) 2000-11-30
EP0879457B1 (en) 2000-10-25
DE69734474D1 (en) 2005-12-01
EP1585081A3 (en) 2011-01-12
BR9707364B1 (en) 2009-01-13
DE69734474T2 (en) 2006-07-27
BR9707364A (en) 1999-07-20
EP1585081A2 (en) 2005-10-12
GR3035262T3 (en) 2001-04-30
EP2276010A1 (en) 2011-01-19
EP1028404A3 (en) 2003-10-15
ES2250070T3 (en) 2006-04-16
CA2247372C (en) 2006-08-15
EP1028404B1 (en) 2005-10-26
ATE308093T1 (en) 2005-11-15
CA2247372A1 (en) 1997-08-14
AU1611497A (en) 1997-08-28
US6345228B1 (en) 2002-02-05
EP1028404A2 (en) 2000-08-16
ATE197202T1 (en) 2000-11-15
PT879457E (en) 2001-04-30

Similar Documents

Publication Publication Date Title
EP0879457B1 (en) Road vehicle sensing apparatus and signal processing apparatus therefor
Petty et al. Accurate estimation of travel times from single-loop detectors
Cleghorn et al. Improved data screening techniques for freeway traffic management systems
US5791063A (en) Automated track location identification using measured track data
US20050203697A1 (en) Automatic verification of sensing devices
Rajab et al. Vehicle classification and accurate speed calculation using multi-element piezoelectric sensor
US3675195A (en) Apparatus for detecting traffic information
CN103935383A (en) Train speed measuring method and device
US5508698A (en) Vehicle detector with environmental adaptation
Cheevarunothai et al. Identification and correction of dual-loop sensitivity problems
Kessler et al. Detection rate of congestion patterns comparing multiple traffic sensor technologies
EP3910301B1 (en) Rail fracture decision system and method for deciding rail fracture using the same
US3059232A (en) Traffic monitoring system
JP3328437B2 (en) Travel time determination method
Nihan et al. Improving dual-loop truck (and speed) data: quick detection of malfunctioning loops and calculation of required adjustments
Khoury et al. Performance comparison of automatic vehicle identification and inductive loop traffic detectors for incident detection
EP3652719B1 (en) Apparatus and methods for assessing vehicles straddled between lanes
KR102423140B1 (en) The vehicle detecting system and the control method thereof
JP3602226B2 (en) Method and apparatus for measuring the number of passing vehicles
CN119252038B (en) Truck abnormal road occupation identification method based on road side millimeter wave radar
Wei et al. Optimal loop placement and models for length-based vehicle classification and stop-and-go traffic
KR100312211B1 (en) Method of acquiring vehicle information using ultrasonic traffic volume detector
Sakamoto et al. Comparative study for performance level between two types of vehicle detector: comprehensive results
Coifman Traffic data measurement and validation
Coifman Quantifying Loop Detector Sensitivity and Correcting Detection Problems on Freeways

Legal Events

Date Code Title Description
AK Designated states

Kind code of ref document: A1

Designated state(s): AL AM AT AU AZ BA BB BG BR BY CA CH CN CU CZ DE DK EE ES FI GB GE HU IL IS JP KE KG KP KR KZ LC LK LR LS LT LU LV MD MG MK MN MW MX NO NZ PL PT RO RU SD SE SG SI SK TJ TM TR TT UA UG US UZ VN YU AM AZ BY KG KZ MD RU TJ TM

AL Designated countries for regional patents

Kind code of ref document: A1

Designated state(s): KE LS MW SD SZ UG AT BE CH DE DK ES FI FR GB GR IE IT LU MC NL PT SE BF BJ CF

DFPE Request for preliminary examination filed prior to expiration of 19th month from priority date (pct application filed before 20040101)
121 Ep: the epo has been informed by wipo that ep was designated in this application
WWE Wipo information: entry into national phase

Ref document number: 1997902476

Country of ref document: EP

ENP Entry into the national phase

Ref document number: 2247372

Country of ref document: CA

Ref document number: 2247372

Country of ref document: CA

Kind code of ref document: A

WWE Wipo information: entry into national phase

Ref document number: 09117726

Country of ref document: US

Ref document number: PA/A/1998/006331

Country of ref document: MX

WWP Wipo information: published in national office

Ref document number: 1997902476

Country of ref document: EP

NENP Non-entry into the national phase

Ref document number: 97528275

Country of ref document: JP

REG Reference to national code

Ref country code: DE

Ref legal event code: 8642

WWG Wipo information: grant in national office

Ref document number: 1997902476

Country of ref document: EP