WO2002067005A1 - Magnetic resonance spectroscopy to identify and classify microorganisms - Google Patents
Magnetic resonance spectroscopy to identify and classify microorganisms Download PDFInfo
- Publication number
- WO2002067005A1 WO2002067005A1 PCT/CA2002/000216 CA0200216W WO02067005A1 WO 2002067005 A1 WO2002067005 A1 WO 2002067005A1 CA 0200216 W CA0200216 W CA 0200216W WO 02067005 A1 WO02067005 A1 WO 02067005A1
- Authority
- WO
- WIPO (PCT)
- Prior art keywords
- spectra
- species
- classifier
- microorganisms
- magnetic resonance
- Prior art date
- Legal status (The legal status is an assumption and is not a legal conclusion. Google has not performed a legal analysis and makes no representation as to the accuracy of the status listed.)
- Ceased
Links
Classifications
-
- G—PHYSICS
- G01—MEASURING; TESTING
- G01R—MEASURING ELECTRIC VARIABLES; MEASURING MAGNETIC VARIABLES
- G01R33/00—Arrangements or instruments for measuring magnetic variables
- G01R33/20—Arrangements or instruments for measuring magnetic variables involving magnetic resonance
- G01R33/44—Arrangements or instruments for measuring magnetic variables involving magnetic resonance using nuclear magnetic resonance [NMR]
- G01R33/46—NMR spectroscopy
- G01R33/4625—Processing of acquired signals, e.g. elimination of phase errors, baseline fitting, chemometric analysis
-
- G—PHYSICS
- G01—MEASURING; TESTING
- G01R—MEASURING ELECTRIC VARIABLES; MEASURING MAGNETIC VARIABLES
- G01R33/00—Arrangements or instruments for measuring magnetic variables
- G01R33/20—Arrangements or instruments for measuring magnetic variables involving magnetic resonance
- G01R33/44—Arrangements or instruments for measuring magnetic variables involving magnetic resonance using nuclear magnetic resonance [NMR]
- G01R33/46—NMR spectroscopy
- G01R33/465—NMR spectroscopy applied to biological material, e.g. in vitro testing
Definitions
- the present invention relates to identifying and classifying microorganisms, such as bacteria and fungi, using magnetic resonance spectroscopy, with multivariate analysis.
- Microbial taxonomic classification of micro-organisms involves the grouping of those with like characteristics, based on detection of multiple metabolities/compounds or analysis of genetic material (DNA), from microbial cells. "Gene trees” derived from sequences of the so-called ancestral ribosomal DNA gene, can distinguish between and within all living organisms down to species and, sometimes, individual strain level. Numerical algorithms and "trees" can also be constructed from profiles of microbial metabolities, provided the conditions of culture have been carefully standardised. In the medical setting, identification of microbial pathogens allows the clinician to predict and initiate appropriate therapy and to provide prognostic information to
- Sites of infected tissue are composites of microbial cells, host immune cells and usually, cells of the organ or tissue where the infection is localized.
- Pathological diagnosis traditionally is time- consuming and labour-intensive, being reliant on histopathological examination and microbial identification by morphology and culture, or, sometimes, other methods.
- MRS magnetic resonance spectroscopy
- Pattern recognition techniques which detect gross spectral characteristics associated with a-priori defined classes (such as pathological conditions), have been successfully applied to MRS of both tissues and body fluids.
- Accurate and reliable classifiers based on multivariate analyses of 1H MR spectroscopic data, have been developed and validated for objective diagnosis of thyroid (21), ovarian (23), prostate (9), breast (13), and brain tumours (20).
- MRS is able to detect malignancy before morphological manifestations are visible by light microscopy (17).
- Cryptococcosis caused by C. neoformans, is a potentially life-threatening mycosis of immunocompromised and healthy hosts.
- C. neoformans is the commonest cause of fungal meningitis (1) and circumscribed lesions (cryptococcomas) can occur in both lung and brain (2, 3).
- Cerebral cryptococcomas have been reported in up to fourteen percent of Australian patients presenting with cryptococcosis, depending on host immune status at diagnosis (4).
- Brian lesions are usually diagnosed after C. neoformans has been identified in tissue or fluids obtained from other body sites, or in cerebrospinal fluid (CSF).
- CSF cerebrospinal fluid
- Brain biopsy is required for diagnosis when lesions are confined to the brain (3) or in the absence of other diagnostic material, as the pathology of infective lesions cannot be reliably distinguished by modalities such as computed tomography (5) or magnetic resonance imaging (MRI) (6).
- MRI magnetic resonance imaging
- 5 Proton magnetic resonance spectroscopy ( ⁇ MRS) has been applied to tumours, stroke and bacterial infections (7-14).
- In vivo MRS of the brain was developed and comprehensively tested for the diagnosis of human tumours (7, 9, 13) based on initial ex vivo and in vivo studies in animal models (15).
- MRS has identified tumour pathology in human biopsies with a very high sensitivity and specificity (16-20).
- MR-visible compounds from micro-organisms and/or cells recruited during the host immune response may give rise to diagnostic and prognostic markers.
- Extracellular carbohydrates and other products of C. neoformans have been identified in CSF from patients with cryptococcal meningitis (21).
- Cells of C. neoformans are distinguished from those of other invasive fungal pathogens by an external polysaccharide capsule, which comprises a high percentage of the biomass in cryptococcomas.
- the purified capsular material has been studied by 1H and 13 C MRS (22). More recent studies have identified extracellular products of C. neoformans cultured in vitro using MRS (23).
- Pathogenic bacteria and fungi are normally identified and classified on the basis of their cellular morphology and biochemistry. Traditional methods are usually time-consuming, as several physiological tests are required for unequivocal identification. Where only minor pheno- and
- microorganism means any microscopic organism (i.e., any unicellular or multicellular living entity) including bacteria, fungi, parasites, viruses, protozoa and algae.
- a one-dimensional ⁇ MR spectrum of a microorganism such as a bacterial cell suspension provides an overview of hydrogen-containing compounds. Consequently, the 1H MR spectrum is more representative of the physiology of the cell (metabolite pools) than its structure (comprising immobile components such as the cell wall). While many different bacterial groups may express and utilize essentially identical metabolic pathways, differing levels of enzyme expression and activity in different groups could give rise to distinctly different levels of particular metabolities when dissimilar groups are grown in similar environments. It was, therefore, proposed that significantly different metabolite pool sizes could be detected as differences between the 1H MR spectra of the different bacterial groups.
- LDA linear discriminant analysis
- a new fingerprinting technique for identification of microorganisms, bacteria, by combining proton magnetic resonance spectroscopy (1H MRS) with multivariate statistical analysis. This has resulted in an objective identification strategy for common clinical isolates belonging to the bacterial species Staphylococcus aureus,
- Staphylococcus epidermidis Enterococcus faecalis, Streptococcus pneumoniae, Streptococcus pyogenes, Streptococcus agalactiae, and the Streptococcus milleri group.
- a total of 312 cultures of 104 different isolates were examined using ⁇ MRS.
- An optimized classifier was developed using a bootstrapping process and LDA to provide objective classification of the spectra.
- MRS is able to identify metabolites that identify and distinguish between micro-organisms.
- MRS can identify species of
- MRS with LDA enabled identification of pathogenic micro-organisms that are taxonomically closer related then shown by Bourne et al(63).
- five pathogenic Candida species as well as the two varieties the pathogenic yeast species Cryptococcus neoformans can be identified according to the invention.
- a method for obtaining a statistical classifier for classifying microorganisms of unknown species into known species comprising (a) obtaining a plurality of magnetic resonance spectra of each of a plurality of different species of microorganisms whose species is known, (b) locating a plurality of maximally discriminatory subregions in the magnetic resonance spectra obtained, and (c) cross-validating the spectra by selecting a first portion of the spectra from each species, developing linear discriminant analysis classifiers from the first portion of the spectra from each species, and validating the remainder of the spectra from each species using the classifiers from the first portion of the spectra from each species to obtain optimized linear discriminant analysis coefficients and classifier spectra for each of the known species of microorganisms, which coefficients and classifier spectra can be used to determine the species of microorganisms whose species are unknown.
- a method for determining the species of a microorganism of unknown species comprising obtaining magnetic resonance spectra of the microorganism of unknown species, and comparing the spectra obtained with a species classifier, said classifier having been obtained by (a) obtaining a plurality of magnetic resonance spectra of each of a plurality of different species of microorganisms whose species is known; (b) locating a plurality of maximally discriminatory subregions in the magnetic resonance spectra obtained, and (c) cross-validating the spectra by selecting a first portion of the spectra from each species, developing linear discriminant analysis classifiers from the first portion of the spectra from each species, and validating the remainder of the spectra from each species using the classifiers from the first portion of the spectra from each species to obtain optimized linear discriminant analysis coefficients and classifier spectra for each of the known species of microorganisms, and selecting, as the species of the unknown species of microorganism,
- a method for obtaining a statistical classifier for classifying microorganisms of unknown species into known species comprising (a) obtaining a plurality of magnetic resonance spectra of each of a plurality of different species of microorganisms whose species is known, (b) locating a plurality of maximally discriminatory subregions in the magnetic resonance spectra obtained, and (c) cross-validating the spectra by selecting a first portion of the spectra from each species, developing linear discriminant analysis classifiers from the first portion of the spectra from each species, and validating the remainder of the spectra from each species using the classifiers from the first portion of the spectra from each species to obtain optimized linear discriminant analysis coefficients and classifier spectra for each of the known species of microorganisms, which coefficients and classifier spectra can be used to determine the species of microorganisms whose species are unknown.
- Figure 1A shows representative ⁇ MR spectra: of E. faecalis, S. milleri, S. pneumoniae and S. pyogenes isolates. Refer to Table 3 for the identity of the major metabolites contributing to the spectra in each integration region.
- Figure IB shows representative 1H MR spectra of: S epidermidis, S. aureus and S. agalactiae isolates.
- the intense betaine peaks in the spectra of S. aureus and S. epidermidis and the GPC peak of S. agalactiae have been truncated to show details of the less intense peaks.
- the relative intensities of the betaine and GPC peaks can be seen in Fig. 2.
- Figures 2 A and 2B show Range of measured integral intensities for each species group
- Figure 3 shows: ID 1H MR spectra from in vitro cell cultures: A) Crytococcus neoformans, B) Candida albicans, C) Aspergillus fumigatus, D) Saccharomyces cerevisiae and E) C6 cell line. Identification of the resonances: AA, amino acids, ac, acetate; CH, nonspecific carbohydrate resonances; lip, lipids; NCH, contributions from creatine, GABA, lys residues; N(CH 3 ) 3 , contributions from choline containing compounds (chol, PC, GPC), betaine and tau; tre, a,a- trehalose. Note the prominent trehalose resonances in the spectrum from C.
- Figure 4 shows ID and 2D COSY MR spectra from cerebral rat tissue samples: (a) control brain tissue, (b) tissue infected with C. neoformans, and (c) tissue with glioma.
- A-G triglyceride resonances (32), AA, amino acid residues; ac, acetate; ala, alanine; chol, choline; EA, ethanolamine; eth, ethanol; GABA, y-amino butanoic acid; glu/ gin, glutamate/ glutamine; GPC, glycerol-phosphocholine; h-tau, hypo-taurine; ile, isoleucine; lac, lactate; leu, leucine; lip, lipid; lys, lysine; ml, myo-inositol; NAA, N-acetyl aspartate; NCH n , contributions from creatine, phospho-creatine, GABA, lysine; N(CH 3 ) 3j contributions from choline containing compojnds (choline, PC, gPC), betaine and taurine PC, phosphocholine; PE, phosphoethanolamine
- Figure 5 is a block diagram of a system according to the invention.
- a method for obtaining a statistical classifier for classifying microorganisms of unknown species into known species comprising (a) obtaining a plurality of magnetic resonance spectra of each of a plurality of different species of microorganisms whose species is known, (b) locating a plurality of maximally discriminatory subregions in the magnetic resonance spectra obtained, and (c) cross-validating the spectra by selecting a first portion of the spectra from each species, developing linear discriminant analysis classifiers from the first portion of the spectra from each species, and validating the remainder of the spectra from each species using the classifiers from the first portion of the spectra from each species to obtain optimized linear discriminant analysis coefficients and classifier spectra for each of the known species of microorganisms, which coefficients and classifier spectra can be used to determine the species of microorganisms whose species are unknown.
- the method preferably further comprises the step of repeating step (c) a plurality of times, each time selecting as the first portion of the spectra a different portion of the spectra from the species, to obtain a different set of optimized linear discriminant analysis coefficients for the species, and obtaining a weighted average of the linear discriminant analysis coefficients to obtain final classifier spectra.
- the step of cross- validating the spectra preferably comprises cross validating the spectra by randomly selecting about half of the spectra.
- the step of repeating step (c) a plurality of times preferably comprises repeating step (c) about 1000 times.
- the method preferably includes the steps of obtaining a plurality of classifier spectra independently, and aggregating the results of the independent classifiers to obtain a consensus diagnosis.
- the microorganisms may include bacteria, including the species of Staphylococcus aureus, Staphylococcus epidermidis, Enterococcus faecalis, Enterococcus casseliflavus, Enterococcus gallinarum, Streptococcus pneumoniae, Streptococcus pyogeries and Streptococcus agalachae.
- the microorganisms may include fungi, including pathogenic yeasts such as Candida albicans, Candida parapsilosis, Candida tropicalis, Candida krusei, and Candida glabrata, and Cryptococcus varieties of neoformans and gattli.
- the microorganisms may include cultured bacterial infections, and/or specimens from a mammal containing bacterial infections.
- the plurality of magnetic resonance spectra of each different species is preferably at least 10,
- a method for determining the species of a microorganism of unknown species comprising obtaining magnetic resonance spectra of the microorganism of unknown species, and comparing the spectra obtained with a species classifier, said classifier having been obtained by (a) obtaining a plurality of magnetic resonance spectra of each of a plurality of different species of microorganisms whose species is known; (b) locating a plurality of maximally discriminatory subregions in the magnetic resonance spectra obtained, and (c) cross-validating the spectra by selecting a first portion of the spectra from each species, developing linear discriminant analysis classifiers from the first portion of the spectra from each species, and validating the remainder of the spectra from each species using the classifiers from the first portion of the spectra from each species to obtain optimized linear discriminant analysis coefficients and classifier spectra for each of the known species of microorganisms, and selecting, as the species of the unknown species of microorganism,
- the method preferably further comprises the step of repeating step (c) a plurality of times, each time selecting as the first portion of the spectra a different portion of the spectra from the species, to obtain a different set of optimized linear discriminant analysis coefficients for the species, and obtaining a weighted average of the linear discriminant analysis coefficients to obtain final classifier spectra.
- the step of cross-validating the spectra preferably comprises cross validating the spectra by randomly selecting about half of the spectra.
- the step of repeating step (c) a plurality of times comprises repeating step (c) about 1000 times.
- the method preferably includes the steps of obtaining a plurality of classifier spectra independently, and aggregating the results of the independent classifiers to obtain a consensus diagnosis.
- the microorganisms may include bacteria, including the species of Staphylococcus aureus, Staphylococcus epidermidis, Enterococcus faecalis, Enterococcus casseliflavus, Enterococcus gallinarum, Streptococcus pneumoniae, Streptococcus pyogeries and Streptococcus agalachae.
- the microorganisms may include fungi, including pathogenic yeasts such as Candida albicans, Candida parapsilosis, Candida tropicalis, Candida krusei, Candida glabrata, and Cryptococcus varieties of neoformans and gattli.
- the microorganisms may include cultured bacterial infections, and/or specimens from a mammal containing bacterial infections.
- the plurality of magnetic resonance spectra of each different species is preferably at least 10, and may be at least 30.
- a statistical classifier for classifying microorganisms of unknown species into known species comprising (a) a spectrometer for obtaining a plurality of magnetic resonance spectra of each of a plurality of different species of microorganisms whose species is known, (b) a locator for locating a plurality of maximally discriminatory subregions in the magnetic resonance spectra obtained, and (c) a cross-validator for cross-validating the spectra by selecting a first portion of the spectra from each species, developing linear discriminant analysis classifiers from the first portion of the spectra from each species, and validating the remainder of the spectra from each species using the classifiers from the first portion of the spectra from each species to obtain optimized linear discriminant analysis coefficients and classifier spectra for each of the known species of microorganisms, which coefficients and classifier spectra can be used to determine the species of microorganisms whose species are unknown.
- the cross- validator preferably repeats step (c) a plurality of times, each time selecting as the first portion of the spectra a different portion of the spectra from the species, to obtain a different set of optimized linear discriminant analysis coefficients for the species, and obtaining a weighted average of the linear discriminant analysis coefficients to obtain final classifier spectra.
- the cross-validator preferably cross validates the spectra by randomly selecting about half of the spectra.
- the classifier preferably repeats step (c) about 1000 times.
- the classifier preferably obtains a plurality of classifier spectra independently, and aggregates the results of the independent classifiers to obtain a consensus diagnosis.
- the microorganisms may include bacteria, such as Staphylococcus aureus, Staphylococcus epidermidis, Enterococcus faecalis, Enterococcus casseliflavus, Enterococcus gallinarum, Streptococcus pneumoniae, Streptococcus pyogeries, and Streptococcus agalachae.
- bacteria such as Staphylococcus aureus, Staphylococcus epidermidis, Enterococcus faecalis, Enterococcus casseliflavus, Enterococcus gallinarum, Streptococcus pneumoniae, Streptococcus pyogeries, and Streptococcus agalachae.
- the microorganisms may include fungi, including pathogenic yeasts such as Candida albicans, Candida parapsilosis, Candida tropicalis, Candida krusei, Candida glabrata, and Cryptococcus varieties of neoformans and gattli.
- the microorganisms may include cultured bacterial infections and/or specimens from a mammal containing bacterial infections.
- the plurality of magnetic resonance spectra of each different species is preferably at least 10 and may be at least 30.
- Isolates were obtained from the collection of the Centre for Infectious Diseases and Microbiology (CIDM), Institute of Clinical Pathology and Medical Research, Sydney and the American Type Culture Collection, or were recent clinical isolates from the clinical identification laboratory of the CEDM Laboratory services. Stored isolates were suspended in 10% glycerol in nutrient broth at -70°C.
- Horse blood agar (HBA) was prepared by addition of sterile horse blood to autoclaved blood agar base (Oxoid (UK) or Amyl Media (Australia)). Isolates retrieved from storage were subcultured on to 5% horse blood agar and incubated in 5% CO 2 for 18-24 hours at 37°C. New isolates and isolates subcultured on HBA after storage were streaked onto duplicate HBA plates and incubated at 37°C for 18-24 hours and then stored at ambient temperature (20-30°C) for 3-9 hrs before spectroscopy.
- Staphylococcus aureus was identified on the basis of positive coagulase (using rabbit or human plasma) and DNase tests. Staphylococcus epidermidis was identified using the API ID32 staph test (BioMerieux, France). Streptococcus and Enterococcus species were identified by conventional methods - optochin sensitivity (Streptococcus pneumoniae), salt tolerance and bile- esculin positivity (Enterococcus spp.), latex agglutination (Streptococcus agalactiae), and by API ID32 strep test (BioMerieux). All tests were carried out according to the manufacturers' instructions. In general, isolates were identified only once upon receipt in the microbiology laboratory and prior to storage. Some isolates retrieved from storage were reidentified by conventional tests.
- Avance 360 MHz MR spectrometer using H/ C 5 mm probe head ID spectra were acquired with acquisition parameters as follows: frequency 360.13 MHz, pulse angle 90° (6-7 ms), repetition time Is, 8k data points, 256 or 512 transients, spectral width 3600 Hz, total acquisition time 10 or 20 min.
- the field was locked to D 2 0.
- Water suppression was effected by a selective excitation field gradient method (DPFGSE, (3)). Spectra of cells suspended in PBS/D 2 0 were stable for at least two hours at 37°C.
- Two dimensional (2D) homo- and heteronuclear correlation spectra were acquired for at least two isolates per species to assign ID MR resonances to specific compounds.
- ⁇ 1H, 1H ⁇ gradient COSY experiments were performed in magnitude-mode. Acquisition parameters were: sweep width in t 2 3600 Hz, t 2 time domain 2K, 256 increments of 32 or 48 acquisition each, repetition time Is.
- Sine-bell window functions were applied in the t ⁇ dimension, and Gaussian-Lorentzian window functions were applied in the t 2 dimension. Zero filling was used to expand the data matrix to 1 K in the ti dimension.
- TOCSY spectra with mixing times of 40 ms and 150ms were acquired with 256 increments of 2K data points and 32 acquisitions (1).
- HMBC Heteronuclear Multiple Bond Correlation spectra
- Spectra were processed using Bruker XWINNMR spectrometer software. Zero filling was performed to extend the free induction decay data set to 16K. An exponential window function was applied before Fourier transformation yielding a line broadening of 1 Hz. Chemical shift calibration was performed by setting the center of the spectrum to 4.64ppm (nominal position of the water resonance with respect to tetramethylsilane in PBS/D 2 0 at 37°C). Spectra were manually phase corrected to achieve a linear and flat baseline.
- classification refers to assignment of an individual spectrum from a bacterial culture to a species group.
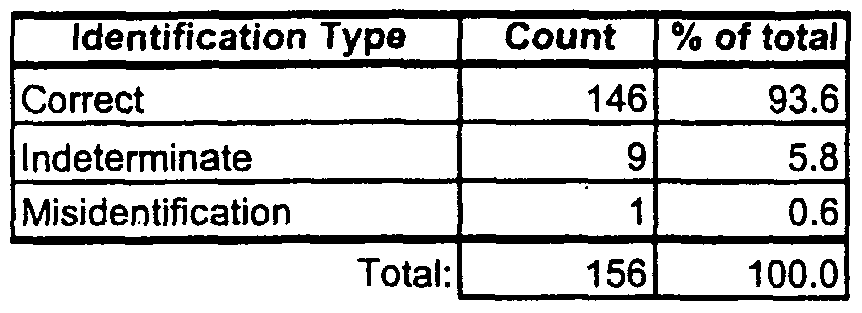
- Identification refers to
- Indeterminate classification refers to assignment of a spectrum to any species group with percent classification probability ⁇ 75%.
- Correct identification refers to assignment of both spectra of duplicate cultures according to conventional identification and with average of percent classification probability > 75%.
- Misidentification refers to assignment of both spectra of duplicate cultures to the same species group but different from conventional identification and 5 with average of percent classification probability >75%.
- Indeterminate identification refers to assignment of spectra of duplicate cultures to different groups, or the same group with average classification probability ⁇ 75%.
- An optimized classifier for all 7 species groups was developed based on the Robust Bootstrap (RBS) method of Somorjai et al. (19), (2).
- the B values W m used for the weights are those obtained not for the bootstrap training sets, but for the less optimistic test sets.
- the optimized classifier was then used to classify all 312 spectra. Classifier outcome is reported as a percent class probability.
- the RBS classification software was written using STATISTICA, Microsoft EXCEL and Microsoft VISUAL BASIC for APPLICATIONS (NBA) and run on a Pentium-based personal computer.
- Fig. 2 shows the range of normalized integral intensities (mean ⁇ SD) measured for each species group.
- Results for classification of 312 spectra and identification of 104 isolates from the seven species [5 groups based on the optimized classifier are shown in Table 1.
- a summary of results in terms of classification and identification performance is shown in Table 2.
- Less than 2% of spectra were misclassified and less than 1% of isolates misidentified.
- Of the 9 isolates which showed indeterminate identification 5 were correctly identified in subsequent or previous cultures at different dates (the remaining 4 isolates 0 were not retained in culture storage and could not be retested).
- the advantage of this procedure is that the resultant independent variables may be assigned a specific biochemical significance (i.e., an independent variable may be associated with a particular metabolite or group of metabolites) if the metabolites contributing to the signal in each integration region can be identified.
- Table 3 identifies some of the major metabolites contributing to the spectra in Fig. 1
- the bacterial identification method applied here does not depend on identification or quantitation of the metabolites contributing to the MR signal. It is, however, important to note that the measured cellular characteristics on which the classification is based are substantially different from those detected during routine identification and also different from those measured by other whole organism fingerprinting techniques.
- Classification based on LDA requires that a set of functions derived by LDA of a training set of data be used to classify a test set of data, which is preferably independent of the training set (cross-validation).
- the function of the training set is to describe, in terms of the n independent variables derived from the MR spectra, the region of n-dimensional data space occupied by each of the a priori defined groups. If the defined groups in the training set are well separated in data space, then the LDA will produce classification functions which assign every member of the training set to its a priori defined group.
- the region of data space associated with a particular group will increase with phenotype variation between the members of a particular species group, and also with procedural (environmental, biochemical and methodological) variation associated with repeated culture and classification of spectra of a specific member of a group.
- a training set comprising only a small number of randomly selected members of a particular group is thus unlikely to accurately represent the data space (phenotype range) occupied by all members of that species group. If the training set contains only a single measurement of each isolate member then it may also not account for procedural variability. Consequently, it is to be expected that some misclassifications will occur when a classification function based on a training subset of a group is used to classify group members which are not members of the training set.
- the number of spectra per species group in the training set be 5-10 times more than the number of independent variables (19).
- Such large data set appear to be rare, and are usually difficult to acquire, especially if the derived classifier is to be validated against a test set independent of the training set.
- the Robust Bootstrap method attenuates this problem by allowing cross-validated classifier development with all of the available data (19).
- the growth conditions for the samples are not strictly controlled.
- the precise constitution of the growth medium may vary from batch to batch (base media from two different manufacturers and multiple batches of horse blood were used).
- the size of the inoculum may vary from plate to plate. Growth of bacteria on an agar plate is inherently inhomogeneous, due to crowding and slow diffusion of oxygen and other nutrients through colonies and agar. Early experiments with triplicate cultures of all isolates demonstrated a lack of variation in spectra from cells grown on single batches of medium. Due to large variations between species in the amount of growth obtained overnight on HBA plates (growth of S. milleri was usually very poor) the wet weight of cells resuspended varied from 2-200 mg.
- the method would be applicable to hospital laboratories which require rapid identification of infectious agents to expedite appropriate and safe treatment. In industrial situations the method would improve process reliability and efficiency.
- MRS was used to characterize clinical isolates of C. neoformans and a glioma cell-line in culture and in experimental rats.
- ID and 2D ⁇ MR spectra were acquired from fungi cultured in vitro (16 isolates of Cryptococcus neoformans, 3 of Candida albicans, 3 of Aspergillus fumigatus, 3 of Saccharomyces cerevisiae) and a C6 glioma cell line.
- Cerebral biopsies were obtained from healthy rats and animals with experimental infections or gliomas (19 healthy brains, 19 cryptococcomas and 20 gliomas).
- C. neoformans serotype A clinical isolates from lung, blood, CSF and brain
- serotype B clinical isolates from serotype B
- veterinary and environmental isolates 1 clinical isolate of the teleomorph of C. neoformans, Filobasidiella neoformans var. bacilliformis (American Type Culture Collection 32609).
- yeasts Candida albicans clinical isolates
- Saccharomyces cerevisiae environmental isolates and type cultures
- the fungus Aspergillus fumigatus clinical isolates
- Yeasts were identified biochemically using the API 20C AUX system (BioMerieux, March l'Etoile, France).
- Cryptococci were biotyped (45) and serotyped (Crypto Check agglutination test, latron Labs).
- Fungi were cultured for 24-48 h on Sabouraud's dextrose agar (SDA, Difco Labs, Detroit, MI, USA), then either in Brain Hear Infusion broth at 30°C (A. fumigatus) or in yeast nitrogen broth (Difco) containing 1% glucose, buffered at pH 7.0 with 0.345% w/ v MOPS (Sigma Chemical Co., St. Louis, MO, USA), at 27, 30 and/or 37°C, C6, a rat glioma cell line, was maintained as described (51) and used within 3-30 passages.
- SDA Sabouraud's dextrose agar
- MOPS yeast nitrogen broth
- logarithmic phase fungal cells or C6 glioma cells, were washed and resuspended in dulbecco's phosphate-buffered saline (PBS, Difco) for animal models or in PBS made up with 99.5% deuterium oxide (D 2 0 for MRS.
- PBS dulbecco's phosphate-buffered saline
- D 2 0 deuterium oxide
- C. neoformans serotype B (WM276, WM430, Mc Bride) and the C6 glioma cell line were used for animal experiments.
- Male Wistar-furth and female Fischer 344 rats (150- 250g, Animal Research Council, Perth, WA) were anaesthetized by inhalation of 4% halothane in 100% oxygen prior to intraperitoneal injectin of ketamine (11.6 mg/kg, Apex Laboratories, Sydney) and xylazine (1.2 mg/kg, Apex Laboratories, Sydney), and allowed to breathe room air spontaneously.
- the animal head was fixed in a sterotactic frame (David Kopf Instruments, Tajunga, CA, USA); 5 ⁇ l of a suspension of C. neoformans serotype B, or c6 glioma cells, was injected through a straight, flat-ended 26 gauge needle at a rate of 3-6 ⁇ l/ min.
- Control tissue was obtained from saline-injected rats. At appropriate times, rats were sacrificed, the brain was removed and cut transversely at the site of the lesion. Brain tissue was fixed in formalin, and embedded in paraffin. 7 ⁇ m sections were taken and stained with haematoxylin and cosin or periodic acid- Schiff reagent (PAS) for light microscopy.
- PAS acid- Schiff reagent
- Brain tissue samples (diameter up to 4 mm) from each of the animals with cryptococcomas or gliomas and from controls were suspended in PBS/D 2 0, snap-frozen in liquid nitrogen, and stored at 70°C for up to 4 months for MRS analysis.
- ⁇ MR spectra were obtained on a Bruker Avance 360 MHz spectrometer equipped with a 5 -mm ⁇ 1H, 13 C ⁇ inverse-detection dual-frequency probe. The temperature was maintained at 37°C. Residual water signal was suppressed by selective gated irradiation (46) or by selective excitation using pulse field gradients (47). Chemical shifts were referenced to external sodium 3-(trimethylsilyl) propanesulfonate (TSP) at 0.00 ppm or internal water (4.65 ppm), respectively.
- i ID 1H MR spectra were acquired with a spectral width 3600 Hz, time domain 8k, 128 or 256 acquisitions, relaxation delay Is.
- a line broadening of 1 or 3 Hz was applied for cell culture and tissue samples, respectively, prior to Fourier transformation. Resonance ratios from fully relaxed 1H MR spectra were used for comparison of cell types. Packed cell suspensions and samples were spun at 20 Hz to avoid the cells settling in the MR tube. A relaxation delay of 5 s was j applied to allow full relaxation.
- Two-dimensional MR spectra were acquired for unequivocal signal assignment. ⁇ 1H, 1H ⁇ COSY experiments were performed in magnitude-mode (48). Acquisition parameters were: sweep width in t 2 3600 Hz, t 2 time domain 2k, 256 increments of 32 or 48 acquisitions each, relaxation 5 delay Is. Sine-bell window functions were applied in the ti dimension, and Gaussian-Lorentzian window functions were applied in the t 2 dimension. Zero filling was used to expand the data matrix to 1 K in the tj dimension. Cross-peak volumes were determined as described (49).
- TOCSY spectra with mixing times of 40ms and 120ms were acquired with 256 increments of 2K 0 data points and 48 scans per increment for confirmation of assignments (1).
- I 3 C ⁇ one-bond shift correlation spectra were obtained in the 1H detection mode using an HSQC pulse sequence (50) for some samples to confirm signal assignments.
- the 1H MR spectra width was 3600Hz and the 13 C NMR spectral width was 15000 Hz.
- 3 C MR decoupling during 5 acquisition was achieved by GARP-1 (8).
- the evolution time (ti) was incremented to obtain 256 FIDs, each of 80 acquisition and consisting of 2K data points.
- the relaxation delay was Is.
- a sine-bell function was applied in the t 2 dimension and a Gaussian-Lorentzian function was 5 applied in the t dimension. Zero filling to 1 K was used in the t ⁇ dimension prior to Fourier transformation.
- ⁇ MR spectra and 2D ⁇ , ⁇ COSY were acquired from all fungal isolates, the C6 glioma cell line and rat brain samples (20 with cryptococcomas, 19 with gliomas and 19 controls). Signal assignment was confirmed by TOCSY and HSQC for at least one isolate or sample of
- Typical one (ID) and two-dimensional (2D) MR spectra from fungi cultured in vitro and the C6 glioma cell line are compared in Fig. 3.
- Major cross-peaks from the 2D spectra are summarized
- MRS of two other clinically important, pathogenic fungi, Candida albicans and Aspergillus fumigatus, and the yeast Saccharomyces cerevisiae were investigated, and found to be different from C. neoformans.
- N-acetyl aspartate Spectra from control brain tissue were dominated by N-acetyl aspartate (NAA) at 2.00 ppm. Characteristic signals of lower intensity included composite peaks at 2.0-2.2 ppm (glutamine/ glutamate), at 3.0 ppm (creatine, phosphocreatine, ( ⁇ -amino) butanoic acid (GABA) and lys residues); at 3.2 ppm [N(CH 3 ) 3 groups of choline, PC and GPC etc] and at 3.6 to 3.9 ppm (Ha of amino acid residues and myo-inositol), amino acids GABA, chol, Pcand GPC signals were also present in COSY spectra. Lactate signals of variable intensity were found at 1.3 ppm, resulting from anaerobic metabolism occurring in the time between excision and freezing.
- Cryptococcoma gave ID and COSY MR spectra with the typical pattern of cryptococcal trehalose and lipids described above.
- the intensity of the lipid resonance at 5.38 ppm to the trehalose resonance at 5.19 ppm varied over a wide range (Table 6).
- the 3.2 : 3.0 ppm resonance ratio was elevated compared with normal brain tissue.
- the NAA signal decreased dramatically and was undetectable in some samples.
- a distinct cross peak arose from GPC which was of much higher intensity than in control and glioma spectra.
- the wvo-inositol and GABA cross-peak intensities in the COSY spectra were reduced relative to the amino acid cross-peaks when compared with those in control brain tissue.
- lys, leu, etc. were those of taurine (3.28-3.50 ppm), choline (3.50-4.07 ppm), PC (3.61-4.19 ppm) and phosphoethanolamine (3.22-3.98 ppm).
- C. neoformans was distinguished unequivocally from other yeasts, the filamentous fungus A. fumigatus and C6 glioma cells by MRS, due to an abundance of the non-reducing disaccharide, trehalose. These differences were recorded in spectra from cells cultured in vitro, as well as from affected tissue from rat cortex, where the diagnosis was confirmed histologically. MRS has thus provided a means of distinguishing cryptococcomas from healthy brain and brain tumour tissue in biopsy samples.
- GXM glucuroxylomannans
- Trehalose is present in yeasts, and other fungi (60) and is therefore not a unique characteristic of c. neoformans, per se. It is an important protectant induced by conditions of heat (57), osmotic stress (61), dehydration (56), dessication and other (for review see (54) and (55)). Trehalose levels in C. neoformans cultured at 25°C, however, exceeded those n S. cerevisiae under conditions of heat stress (37 C) by at least 20 times. Altered culture conditions did not reduce the intensity of the trehalose signal in C. neoformans.
- trehalose The large amount of trehalose relative to other MR-visible compounds in the spectra of C. neoformans defines trehalose as one marker that can be used to distinguish C. neoformans from other fungi. It is possible that such high levels of trehalose in cryptococci are an evolutionary response to environmental stress, particularly temperature, dehydration and starvation. Adaptation to survival and growth at physiological temperatures, a recognized virulence determinant of C. neoformans (62) is consistent with high intracellular concentrations of trehalose.
- Acetate is produced by bacteria and has been identified by MRS in bacterial abscesses (34, 35, 39) as well as in this study, in C. neoformans and cryptococcomas.
- -trehalose recorded from cyptococcomas provides a basis for the path for the pathological diagnosis of cerebral cyptococcomas.
- cerebral cyptococcomas will no longer be mistaken for malignancies by conventional imaging modalities.
- An early and conect diagnosis will reduce the high morbidity and mortality (27) that occurs when diagnosis is delayed.
- Using in vivo MRS as a non-invasive method of diagnosis of infective lesions in the brain will reduce the risk and expense of unnecessary surgery or biopsy and expedite patient management decision.
- Cryptococci were biotyped and serotyped (Crypto Check agglutination test, latron Labs).
- PCR fingerprinting was used to compare the genotype of the respective species.
- Statistical Classification Strategy (SCS)(9) The five Candida species were subdivided into two groups containing cultures from 2 or 3 species, respectively. Pair-wise classification was performed to distinguish between these groups and later to distinguish between the species in each group. Pair-wise classification was performed for the two C. neoformans varieties. Magnitude MR spectra were normalized to the total integral and analyzed by a genetic-
- MR spectra of all yeasts were dominated by signals of lipids, carbohydrates (trehalose, glucose), polyols (glycerol, mannitol, glucitol and others), ethanol and amino acid residues.
- Candida species Visual analysis of the ID MR spectra of Candida species allowed a distinction into two groups: (A) C. krusei and C. glabrata; (B) C. albicans, C. parapsilosis and C. tropicalis. These differences were mainly due to a higher carbohydrate and ethanol content in group A. These groups are consistent with a phylogenetic tree based on partial actin gene
- MRS data analyzed by SCS were compared with currently used biochemical identification tests and molecular biological methods (PCR fingerprinting).
- PCR fingerprinting biochemical identification tests and molecular biological methods
- Different species and varieties of fungi could be identified by applying a Statistical Classification Strategy to MR spectra.
- identification of fungi was possible below the taxonomic rank of species with a high degree of accuracy in these particular systems.
- SCS-based analysis of MR data can identify both species and varieties of fungi faster than other conventional methods, with a high degree of accuracy.
- Figure 5 shows a spectrometer 10, which may be a Bruker Avance 360 MHz MR spectrometer, with equipped computer.
- the statistical classification strategy (SCS) computer 12 stores the SCS and other programs described therein.
- the clinical data base includes the information from the data acquisition and the identity of known microorganisms and the like which is used by the computer 12 to develop the classifier 16.
- the present invention can be used for in vivo analysis, in which case a more powerful magnet may be obtained in the spectrometer.
- Allografts Application of a Three-Stage Classification Strategy to MR and IR of Urine. Vibrational Spectroscopy. (in press). 5
- Chemiak R Sundstrom IB. Polysacchari.de antigens of the capsule of Crytococcus neoformans. Infect. Imtnun 1 94; 62:1507-1512.
- E. faecalis ATCC 29212 100, 100 100. 100 100, 100 100, 100 100, 100 100, 100, 99
- aureus ATCC 25923 100, 100, 100, 100, 100, 100, 100, 100, 100, 100, 100, 100, 100, 100, 100, 100, 100, 100, 100, 100
- S. epidermidis ATCC 12228 100. 100 100, 100 100, 98 100, 100 50, 84 INDETERMINATE
- the error group is the species to which a spectrum was incorrectly assigned Isolate Identification Result
- GPC glycerol phosphocholine
- GPE glycerol phosphoethanolamine
- EA ethanolamine
- E. faecalis ATCC 29212 100, 100 100, 100 100, 100 100. 100 100, 100, 100, 100
- E. gallinarum 182-2747 100, 100, 100, 100, 100
- Table 5 S Major components in tbe COSY spectra Identified by tbeir cross peak volumes.
- GPC glywpk>spbochoUne; lys, . lysi.ne; i.nos, myo _- j in m o.si !# toil., M N.
- Control brain 19 1.2 ⁇ 0.3 (0.8-1.7) nd. n.d. 2.110.4(1.5-3.0) n.d.
- Glioma 19 1.9 ⁇ 0.4 (1.2-2.4) n.d. 1.3 ⁇ 0.7 (0.2-3.0) 0.9 ⁇ 0.7 (n.d.-2) n.d.
Landscapes
- Physics & Mathematics (AREA)
- Engineering & Computer Science (AREA)
- Signal Processing (AREA)
- Spectroscopy & Molecular Physics (AREA)
- High Energy & Nuclear Physics (AREA)
- Condensed Matter Physics & Semiconductors (AREA)
- General Physics & Mathematics (AREA)
- Measuring Or Testing Involving Enzymes Or Micro-Organisms (AREA)
- Apparatus Associated With Microorganisms And Enzymes (AREA)
Abstract
Description


Claims
Priority Applications (3)
| Application Number | Priority Date | Filing Date | Title |
|---|---|---|---|
| EP02701129A EP1364224A1 (en) | 2001-02-21 | 2002-02-21 | Magnetic resonance spectroscopy to identify and classify microorganisms |
| CA002439030A CA2439030A1 (en) | 2001-02-21 | 2002-02-21 | Magnetic resonance spectroscopy to identify and classify microorganisms |
| JP2002566678A JP2004532009A (en) | 2001-02-21 | 2002-02-21 | Magnetic resonance spectroscopy for identifying and classifying microorganisms |
Applications Claiming Priority (2)
| Application Number | Priority Date | Filing Date | Title |
|---|---|---|---|
| US27036701P | 2001-02-21 | 2001-02-21 | |
| US60/270,367 | 2001-02-21 |
Publications (1)
| Publication Number | Publication Date |
|---|---|
| WO2002067005A1 true WO2002067005A1 (en) | 2002-08-29 |
Family
ID=23031056
Family Applications (1)
| Application Number | Title | Priority Date | Filing Date |
|---|---|---|---|
| PCT/CA2002/000216 Ceased WO2002067005A1 (en) | 2001-02-21 | 2002-02-21 | Magnetic resonance spectroscopy to identify and classify microorganisms |
Country Status (6)
| Country | Link |
|---|---|
| US (1) | US20030097059A1 (en) |
| EP (1) | EP1364224A1 (en) |
| JP (1) | JP2004532009A (en) |
| CN (1) | CN1582400A (en) |
| CA (1) | CA2439030A1 (en) |
| WO (1) | WO2002067005A1 (en) |
Cited By (1)
| Publication number | Priority date | Publication date | Assignee | Title |
|---|---|---|---|---|
| EP1515151A1 (en) * | 2003-09-12 | 2005-03-16 | Bruker BioSpin GmbH | Method of resonance spectroscopy for the analysis of statistical properties of samples |
Families Citing this family (15)
| Publication number | Priority date | Publication date | Assignee | Title |
|---|---|---|---|---|
| CN1914332A (en) * | 2003-12-15 | 2007-02-14 | 快速实验室微系统公司 | Assay for the identification of microorganisms |
| US8060183B2 (en) * | 2004-10-13 | 2011-11-15 | Suros Surgical Systems, Inc. | Site marker visible under multiple modalities |
| US20060079805A1 (en) * | 2004-10-13 | 2006-04-13 | Miller Michael E | Site marker visable under multiple modalities |
| US8280486B2 (en) * | 2004-10-13 | 2012-10-02 | Suros Surgical Systems, Inc. | Site marker visable under multiple modalities |
| US8442623B2 (en) * | 2004-10-13 | 2013-05-14 | Suros Surgical Systems, Inc. | Site marker visible under multiple modalities |
| US8433391B2 (en) * | 2004-10-13 | 2013-04-30 | Suros Surgical Systems, Inc. | Site marker |
| US10337046B2 (en) * | 2008-02-19 | 2019-07-02 | Becton, Dickinson And Company | High confidence in positive status determination |
| EP2498677A4 (en) * | 2009-11-13 | 2017-12-13 | The Government of the United States of America as represented by the Secretary of the Department of Health and Human Services | System for magnetic resonance spectroscopy of brain tissue for pattern-based diagnostics |
| US9365883B2 (en) | 2011-12-19 | 2016-06-14 | Opticul Diagnostics Ltd. | Spectroscopic means and methods for identifying microorganisms in culture |
| CN107110938B (en) * | 2014-11-14 | 2019-12-17 | 皇家飞利浦有限公司 | Magnetic resonance fingerprinting using spin-echo pulse sequences with additional 180-degree RF pulses |
| CN108342447B (en) * | 2017-01-22 | 2021-10-15 | 中国科学院青岛生物能源与过程研究所 | A method for screening strains with phenotypes similar to known strains |
| US10837926B2 (en) * | 2017-09-01 | 2020-11-17 | Case Western Reserve University | Multi-modal spectroscopic analysis |
| FR3103900B1 (en) * | 2019-11-29 | 2024-07-19 | Univ Du Mans | Method for rapid identification of microorganisms by analysis of excitation-emission matrices |
| CN111840510A (en) * | 2020-06-28 | 2020-10-30 | 华中科技大学 | Application of food-borne polypeptides |
| WO2022118381A1 (en) * | 2020-12-01 | 2022-06-09 | 日本電信電話株式会社 | Detection device, detection method, and program |
-
2002
- 2002-02-21 EP EP02701129A patent/EP1364224A1/en not_active Withdrawn
- 2002-02-21 CN CN02808627.9A patent/CN1582400A/en active Pending
- 2002-02-21 WO PCT/CA2002/000216 patent/WO2002067005A1/en not_active Ceased
- 2002-02-21 CA CA002439030A patent/CA2439030A1/en not_active Abandoned
- 2002-02-21 JP JP2002566678A patent/JP2004532009A/en active Pending
- 2002-02-21 US US10/081,838 patent/US20030097059A1/en not_active Abandoned
Non-Patent Citations (3)
| Title |
|---|
| J.C. WALLACE ET AL.: "Classification of 1H Spectra of Biopsies ...", MAGNETIC RESONANCE IN MEDICINE, vol. 38, 1997, pages 569 - 576, XP000955430 * |
| P. HAHN ET AL.: "The Classification of Benign and Malignant Human Prostate Tissue...", CANCER RESEARCH, vol. 57, 1997, pages 3398 - 3401, XP000982466 * |
| R.L. SOMORJAI ET AL.: "Computerized Consensus Diagnosis ...", MAGNETIC RESONANCE IN MEDICINE, vol. 33, 1995, pages 257 - 263, XP000955431 * |
Cited By (2)
| Publication number | Priority date | Publication date | Assignee | Title |
|---|---|---|---|---|
| EP1515151A1 (en) * | 2003-09-12 | 2005-03-16 | Bruker BioSpin GmbH | Method of resonance spectroscopy for the analysis of statistical properties of samples |
| US7076383B2 (en) | 2003-09-12 | 2006-07-11 | Bruker Biospin Gmbh | Method of resonance spectroscopy for the analysis of statistical properties of samples |
Also Published As
| Publication number | Publication date |
|---|---|
| US20030097059A1 (en) | 2003-05-22 |
| JP2004532009A (en) | 2004-10-21 |
| CN1582400A (en) | 2005-02-16 |
| EP1364224A1 (en) | 2003-11-26 |
| CA2439030A1 (en) | 2002-08-29 |
Similar Documents
| Publication | Publication Date | Title |
|---|---|---|
| US20030097059A1 (en) | Magnetic resonance spectroscopy to identify and classify microorganisms | |
| Martineau et al. | Absolute quantification of metabolites in breast cancer cell extracts by quantitative 2D 1H INADEQUATE NMR | |
| Weybright et al. | Gradient, high‐resolution, magic angle spinning 1H nuclear magnetic resonance spectroscopy of intact cells | |
| Bourne et al. | Identification of Enterococcus, Streptococcus, and Staphylococcus by multivariate analysis of proton magnetic resonance spectroscopic data from plate cultures | |
| Himmelreich et al. | Rapid identification of Candida species by using nuclear magnetic resonance spectroscopy and a statistical classification strategy | |
| CA2431905A1 (en) | Methods for spectral analysis and their applications: spectral replacement | |
| Solanky et al. | Metabolic changes in Atlantic salmon exposed to Aeromonas salmonicida detected by 1H-nuclear magnetic resonance spectroscopy of plasma | |
| JP2009036758A (en) | System and method for alignment of objects in an image | |
| Kirk et al. | Transgressive segregation of primary and secondary metabolites in F2 hybrids between Jacobaea aquatica and J. vulgaris | |
| Heude et al. | Metabolic characterization of caviar specimens by 1H NMR spectroscopy: towards caviar authenticity and integrity | |
| CN109557165A (en) | Method for monitoring the quality of mass spectrum imaging preparation work process | |
| Lin et al. | Robustness of deep learning for accelerated MRI: benefits of diverse training data | |
| AU2002234460A1 (en) | Magnetic resonance spectroscopy to identify and classify microorganisms | |
| CN108426910A (en) | A method of it is pathogenic whether identification Vibrio harveyi has | |
| Mlynáriková et al. | Evaluation of capacity to detect ability to form biofilm in Candida parapsilosis sensu stricto strains by MALDI-TOF MS | |
| Bourne et al. | Leakage of metabolites from tissue biopsies can result in large errors in quantitation by MRS | |
| Sotelo et al. | Metabolomics using nuclear magnetic resonance (NMR) | |
| Banerjee et al. | Elliptical magnetic resonance spectroscopic imaging with GRAPPA for imaging brain tumors at 3 T | |
| Zhang et al. | Metabolomics: Concept, methods and potential prospect in marine biology | |
| Dzendrowskyj et al. | Diagnosis of cerebral cryptococcoma using a computerized analysis of 1H NMR spectra in an animal model | |
| Sorrell et al. | The role of nuclear magnetic resonance in medical mycology | |
| from Plate | Enterococcus, Identification of | |
| Galante et al. | Quantitative magnetic resonance imaging technology as an effective tool for monitoring post-harvest decay of Tuber aestivum ascomata | |
| García-Álvarez et al. | Applications of 1H nuclear magnetic resonance spectroscopy in clinical microbiology | |
| Brigante et al. | 1H-NMR metabolomic fingerprinting for differentiation of organic and conventional Italian brown and white rice |
Legal Events
| Date | Code | Title | Description |
|---|---|---|---|
| AK | Designated states |
Kind code of ref document: A1 Designated state(s): AE AG AL AM AT AU AZ BA BB BG BR BY BZ CA CH CN CO CR CU CZ DE DK DM DZ EC EE ES FI GB GD GE GH GM HR HU ID IL IN IS JP KE KG KP KR KZ LC LK LR LS LT LU LV MA MD MG MK MN MW MX MZ NO NZ OM PH PL PT RO RU SD SE SG SI SK SL TJ TM TN TR TT TZ UA UG US UZ VN YU ZA ZM ZW |
|
| AL | Designated countries for regional patents |
Kind code of ref document: A1 Designated state(s): GH GM KE LS MW MZ SD SL SZ TZ UG ZM ZW AM AZ BY KG KZ MD RU TJ TM AT BE CH CY DE DK ES FI FR GB GR IE IT LU MC NL PT SE TR BF BJ CF CG CI CM GA GN GQ GW ML MR NE SN TD TG |
|
| 121 | Ep: the epo has been informed by wipo that ep was designated in this application | ||
| WWE | Wipo information: entry into national phase |
Ref document number: 2439030 Country of ref document: CA Ref document number: 2002566678 Country of ref document: JP |
|
| DFPE | Request for preliminary examination filed prior to expiration of 19th month from priority date (pct application filed before 20040101) | ||
| WWE | Wipo information: entry into national phase |
Ref document number: 2002234460 Country of ref document: AU |
|
| WWE | Wipo information: entry into national phase |
Ref document number: 2002701129 Country of ref document: EP Ref document number: 01504/DELNP/2003 Country of ref document: IN |
|
| WWE | Wipo information: entry into national phase |
Ref document number: 028086279 Country of ref document: CN |
|
| WWP | Wipo information: published in national office |
Ref document number: 2002701129 Country of ref document: EP |
|
| REG | Reference to national code |
Ref country code: DE Ref legal event code: 8642 |
|
| WWW | Wipo information: withdrawn in national office |
Ref document number: 2002701129 Country of ref document: EP |