WO2003023383A2 - Imaging apparatus and method - Google Patents
Imaging apparatus and method Download PDFInfo
- Publication number
- WO2003023383A2 WO2003023383A2 PCT/GB2002/003534 GB0203534W WO03023383A2 WO 2003023383 A2 WO2003023383 A2 WO 2003023383A2 GB 0203534 W GB0203534 W GB 0203534W WO 03023383 A2 WO03023383 A2 WO 03023383A2
- Authority
- WO
- WIPO (PCT)
- Prior art keywords
- sample
- parameter
- time
- value
- radiation
- Prior art date
- Legal status (The legal status is an assumption and is not a legal conclusion. Google has not performed a legal analysis and makes no representation as to the accuracy of the status listed.)
- Ceased
Links
Classifications
-
- G—PHYSICS
- G01—MEASURING; TESTING
- G01N—INVESTIGATING OR ANALYSING MATERIALS BY DETERMINING THEIR CHEMICAL OR PHYSICAL PROPERTIES
- G01N21/00—Investigating or analysing materials by the use of optical means, i.e. using sub-millimetre waves, infrared, visible or ultraviolet light
- G01N21/17—Systems in which incident light is modified in accordance with the properties of the material investigated
- G01N21/25—Colour; Spectral properties, i.e. comparison of effect of material on the light at two or more different wavelengths or wavelength bands
- G01N21/31—Investigating relative effect of material at wavelengths characteristic of specific elements or molecules, e.g. atomic absorption spectrometry
- G01N21/35—Investigating relative effect of material at wavelengths characteristic of specific elements or molecules, e.g. atomic absorption spectrometry using infrared light
- G01N21/3581—Investigating relative effect of material at wavelengths characteristic of specific elements or molecules, e.g. atomic absorption spectrometry using infrared light using far infrared light; using Terahertz radiation
- G01N21/3586—Investigating relative effect of material at wavelengths characteristic of specific elements or molecules, e.g. atomic absorption spectrometry using infrared light using far infrared light; using Terahertz radiation by Terahertz time domain spectroscopy [THz-TDS]
-
- A—HUMAN NECESSITIES
- A61—MEDICAL OR VETERINARY SCIENCE; HYGIENE
- A61B—DIAGNOSIS; SURGERY; IDENTIFICATION
- A61B5/00—Measuring for diagnostic purposes; Identification of persons
- A61B5/0033—Features or image-related aspects of imaging apparatus, e.g. for MRI, optical tomography or impedance tomography apparatus; Arrangements of imaging apparatus in a room
- A61B5/0037—Performing a preliminary scan, e.g. a prescan for identifying a region of interest
-
- G—PHYSICS
- G01—MEASURING; TESTING
- G01N—INVESTIGATING OR ANALYSING MATERIALS BY DETERMINING THEIR CHEMICAL OR PHYSICAL PROPERTIES
- G01N21/00—Investigating or analysing materials by the use of optical means, i.e. using sub-millimetre waves, infrared, visible or ultraviolet light
- G01N21/17—Systems in which incident light is modified in accordance with the properties of the material investigated
- G01N21/47—Scattering, i.e. diffuse reflection
- G01N21/4795—Scattering, i.e. diffuse reflection spatially resolved investigating of object in scattering medium
-
- G—PHYSICS
- G01—MEASURING; TESTING
- G01N—INVESTIGATING OR ANALYSING MATERIALS BY DETERMINING THEIR CHEMICAL OR PHYSICAL PROPERTIES
- G01N22/00—Investigating or analysing materials by the use of microwaves or radio waves, i.e. electromagnetic waves with a wavelength of one millimetre or more
Definitions
- the present invention relates to the field of imaging samples with radiation in the infra-red (IR) and Terahertz frequency range and specifically using radiation in the higher Gigahertz (GHz) and the Terahertz (THz) frequency ranges.
- IR infra-red
- GHz gigahertz
- THz Terahertz
- Such radiation is non-ionising and, as a result, it is particularly of use in medical applications.
- the radiation is generally reflected from or transmitted through the patient.
- Components of the sample being imaged will have a frequency dependent absorption coefficient and refractive index, thus each component of a sample subjected to radiation will leave its own characteristic fingerprint in the detected radiation.
- researchers have attempted to image samples using a plurality of frequencies to create an image from spectral information.
- Measurements have been made using both frequency domain techniques, (where the amplitude of each frequency components is analysed), and time domain techniques, (where the radiation is analysed as a function of the delay time introduced by the sample into the path of the radiation).
- Time domain imaging is described in earlier patent GB 2 347 835.
- a time domain spectra is obtained for each pixel of the sample. It is then necessary to obtain a single parameter from each spectra to plot for each pixel. Previous attempts at producing images from such spectra have used the amplitude of the highest maximum or lowest minimum. It is an object of the present invention to provide a method and apparatus which derives a parameter from time domain spectra to allow an image with enhanced contrast to be generated.
- the image can be a two dimensional image of an area of a sample, or it may be a profile of a line passing through the sample.
- the present invention provides a method of imaging a sample, the method comprising:
- step (d) generating an image by plotting the value calculated in step (c) for different points of the sample.
- the image may be just a profile through the sample or a full 2D image of an area of the sample or even a 3D image of a volume of the sample.
- BCC Basal Cell Carcinoma
- the value of the first parameter at a first time value is calculated relative to the value of the first parameter of the second time value.
- the second time value is chosen to coincide with a physical feature of the dataset with respect to time such as a minima, maxima, zero-crossing point, point of inversion, discontinuity etc.
- the second time value preferably corresponds to a predetermined maxima or minima of the first parameter with respect to time.
- the value of the first parameter at the first time value i.e. E(t) may be divided or multiplied by the value of the first parameter at the second time value i.e. E(t 2 ).
- these two values may be added or subtracted from one another.
- ti is chosen as one of the time values ascending or descending to or from a local maxima or minima where t 2 is chosen to coincide with this local maxima or minima.
- the first time value is chosen from the subsequent time values ascending from a local minima, where t 2 is chosen to coincide with that minima.
- t is tied to a physical feature of the time domain plot of the first parameter which may move in time from point to point.
- t 2 may coincide with a minima which shifts slightly from point to point.
- the first time value X ⁇ may be fixed in time or may be located at a fixed time interval ⁇ t from t 2 such that ti moves with t 2 from point to point of the sample.
- the first time value may be chosen to coincide with the signal received from a point of interest within the sample. For example, if the sample is measured using reflection geometry, the first value may coincide with the time in which the reflected pulse takes the reach the part of interest in the sample, e.g. if the sample is a BCC sample, the time which it takes to be reflected from the tumour. If t 2 is chosen to coincide with a main minima obtained using reflection geometry, ⁇ t may be chosen as approximately the time which the radiation takes to travel from the sample surface to the tumour and back to the surface. In practice, due to variations in the composition of the sample, ti will be determined experimentally.
- the method further comprises the step of determining the first parameter for a plurality of first time values and calculating these values of the first parameter relative to the value of the first parameter at the second time value. The method then further comprising the step of generating an image of the sample for each of the said first time values.
- each image may be analysed by means of a computer in order to derive the best value oft] using computer means.
- the image may be optimised by finding the optimum value of the fixed tj. If ti is a located fixed time interval ⁇ t from t 2 for each point in the image, then the image may optimised by finding the optimum value of the time interval, ⁇ t.
- the present invention provides a method of imaging a sample, the method comprising:
- step (d) generating an image by plotting the value calculated in step (c) for different points of the sample, wherein the time interval between the first and second time values is constant for all points used to generate the image.
- the value of the first parameter for the first time value with respect to the second time value may be calculated using any of the methods suggested in relation to the first aspect.
- the image acquisition time may be substantially reduced. However, in some cases, it may be necessary to still acquire the data for more than two time values in order to derive the first parameter.
- the first parameter may be the amplitude of the radiation itself. However, preferably, the detected amplitude is processed in order to obtain a first parameter.
- a flat surface is provided for receiving the radiation.
- This is typically provided by a member such as a window which is transparent to the irradiating radiation.
- the sample is then pressed against this window to provide a flat analysis surface.
- the window itself can cause its own problems. This is because the window, has two interfaces, a front interface upon which the irradiating radiation is directly incident and a back surface which abuts the sample. Both of these surfaces will reflect radiation given rise to at least two unwanted signals in the detected reflected radiation. We refer to at least two reflections because multiple internal reflections may occur within the window giving even further unwanted effects.
- step (a) comprises a step of irradiating the sample through a member which is transparent to the irradiating radiation and which abuts the sample
- the method preferably further comprises the step of obtaining a baseline signal by irradiating a member in the absence of the sample and detecting the amplitude of the reflected radiation.
- the first parameter is then determined by subtracting the baseline signal from the detected amplitude of the reflected radiation from both the member and the sample.
- the baseline signal can be subtracted from the amplitude of the detected reflected radiation in the time domain or the frequency domain.
- the frequency domain signal is created by Fourier transforming the time domain signal.
- a reference signal which is obtained by replacing the sample with the reference object of known reflectance or transmittance and measuring the amplitude of radiation reflected from the reference object (if the sample is to be measured in reflectance mode) or the transmittance of the object (if the sample is to be measured in transmission mode).
- the first parameter is then derived by dividing the detected amplitude of the radiation from the sample with the reference signal in the frequency domain.
- the baseline signal is subtracted from both the sample signal and the reference signal and the baseline subtracted sample signal is then divided by the baseline subtracted reference signal. This division is performed in the frequency domain.
- the baseline signal may be obtained by replacing the sample with an object of known reflectance or transmittance, for example, a Quartz window and the reference signal may be obtained in the absence of a sample or a reference object.
- the amplitude of the detected radiation or the amplitude of the detected radiation which has been baseline subtracted and/or divided by a reference signal is then filtered. More preferably, this is achieved by multiplying the amplitude which may have been baseline subtracted and/or divided by a reference signal in the by the complex Fourier transform of a filter function F(f), where F(t) is a non-zero function whose integral between time limits t a and t b is zero, and where t a and t b are chosen to encompass the part of interest of the reflected or transmitted pulse of radiation.
- radiation is supplied to the sample in the form of a pulse.
- the pulse will have a finite length. As the pulse passes through free space and through the sample, the length of the pulse may change. It is important to set t a and t so that integration is performed over the part of the pulse of interest.
- t a will be set to a negative value which has a magnitude is equal to or larger than the expected value of this time delay.
- T will generally, be set to the positive value of t a .
- t a will be set to a negative value which has a magnitude is equal to or larger than the expected value of this time delay introduced by the pulse being reflected from the deepest point of interest in the sample, t will generally, be set to the positive value of t a .
- the method of the above aspect of the present invention will be performed using the above described apparatus where the radiation is measured using a reference beam and wherein a scanning delay line is introduced into the path of the reference beam or irradiating beam in order to measure the phase change introduced by the sample.
- t a and t b will be the negative and positive limits of the scanning delay line. These may be set to the duration of the pulse or possibly a shorter time range.
- function F(t) comprises a Gaussian component.
- t a and t b are symmetric about 0, preferably F(t) is also symmetric about zero.
- F(t) As the signal is usually digitally sampled, strictly a summation is performed as opposed to an integral.
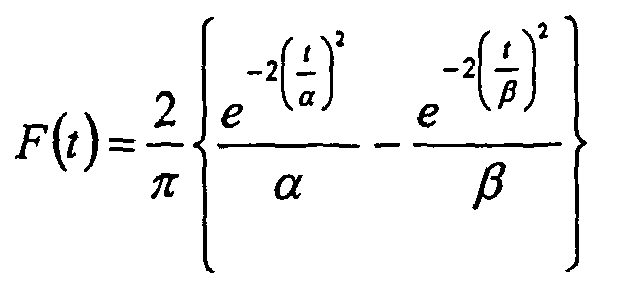
- a particularly preferable form of F(t) is provided by:
- Preferable ⁇ is substantially equal to the shortest pulse length of the beam of pulsed radiation and ⁇ is set to be much longer than the pulse length, typically 5 to 100 times the pulse length. However, both of these values will generally be optimised by the operator.
- F(t) can take the simplified form:
- ⁇ is a constant which is substantially equal to the shortest pulse length of the beam and T is substantially equal to the time which it takes the beam of radiation to penetrate to the deepest point of interest in the sample.
- a sample signal which has been baseline subtracted, divided by a reference signal and filtered is referred to as the impulse function.
- the first parameter is the impulse function.
- the first time value may be determined by:
- n regions of said sample where n is an integer of at least 2;
- step (iii) determining the first time value by comparing at least two of the n spectra derived in step (ii).
- each spectra is normalised to the value of the second parameter at a time value which coincides with a physical feature of the second parameter with respect to time, prior to comparing the spectra.
- a physical feature of the spectra of the second parameter may be a minimum, maximum, point of inflection etc.
- the same physical feature is chosen which identifies the second time value.
- the spectra may be compared by performing a mathematical operation on at least two of the spectra. For example, the spectra may be divided by or subtracted from one another.
- the selected regions may be lines o ⁇ areas of the sample. They may be continuous lines or areas or discontinuous lines or areas. The regions may be of the same size of different sizes and may comprise any number of pixels.
- the preliminary imaging parameter may be any parameter which can be used to generate an image of the sample, for example, it may be the value of the first parameter and/or a second parameter, at a minima, maxima or point of inflection, etc. Alternatively, it may be the value of the first parameter or second parameter at an arbitrary time value or a time value which has previously been used to show contrast in the sample or similar samples.
- the method may also be used to optimise contrast between 3 or more different regions.
- three regions are chosen, the value of the preliminary imaging parameter differing between said three selected regions, the first time value being chosen to coincide with a region where there is a difference between the three spectra.
- the first parameter and second parameter may be the same or different.
- the second parameter may be preferably chosen from any of the parameters previously described in relation to the first parameter.
- Regions of the sample may be chosen at random or, alternatively, regions of the sample may be chosen where some contrast has already been observed.
- the n areas are chosen such that the level of the preliminary imaging parameter within each region is substantially constant and the level of the preliminary imaging parameter is different between at least two of the regions.
- a standard deviation of about 30% in the primary imaging parameter is allowed within a selected region, more preferably 20%, even more preferably 10%.
- the areas may be selected randomly by a person.
- the area selection may be automated.
- a processor may be used to select n regions at random or sequentially and then compare the spectra from these regions in order to optimise the time value.
- the processor is preferably configured to select each area such that the preliminary imaging parameter is substantially constant within each area as previously described.
- the processor may further be configured to vary the size of the selected region in order to select regions which fall within the above criteria.
- the present invention provides a method of imaging a sample, the method comprising: (a) irradiating a sample with a pulse of electromagnetic radiation, said pulse having a plurality of frequencies in the range from 25 GHz to 100 THz;
- step (iii) determining the first time value by comparing at least two of the n spectra derived in step (ii).
- the present invention provides imaging apparatus comprising: a source for irradiating a sample with a pulse of electro-magnetic radiation, said pulse having a plurality of frequencies in the range from 25 GHz to 100 THz; a detector for detecting the amplitude of radiation which is either reflected from or transmitted by the sample; means for determining a first parameter which is related to the amplitude of the reflected and/or transmitted radiation in the time domain; calculating means for calculating the value of the first parameter at a first time value relative to the value of the first parameter at a second time value, wherein the second time value coincides with a physical feature of the dataset of the first parameter with respect to time; and means for generating an image by plotting the value calculated by the calculating means for different points of the sample.
- the present invention provides an apparatus for imaging a sample, the apparatus comprising: a source for irradiating a sample with a pulse of electro-magnetic radiation, said pulse having a plurality of frequencies in the range from 25GHz to lOOTHz; detector means for detecting the amplitude of radiation reflected from and/or transmitted by the sample; means for determining a first parameter related to the amplitude of the radiation in the time domain; calculating means for calculating the value of the first parameter at a first time value with respect to the value of the first parameter at a second time value, and imaging means for generating an image by plotting the value calculated by the calculating means for different parts of the sample, wherein the time interval between the first and second time intervals is constant for all points used to generate the image.
- the detector may be a direct detector of THz radiation or an apparatus according to any of the above three aspects of the invention, the detector may be a direct detector of THz radiation or it may be of the type which converts THz radiation into an easily readable signal.
- the detector may comprise a non-linear crystal which is configured such that upon irradiation of a probe beam and a THz beam, the polarisation of the probe beam is rotated.
- the probe beam can be of a frequency which can be easily measured (for example near infra-red).
- Typical crystals which exhibit this effect, the so-called "AC Pockels" effect are GaAs, GaSe, NH 4 H 2 PO , ADP, KH 2 PO 4 , KH 2 ASO , Quartz, AlPO 4 , ZnO, CdS, GaP, BaTiO 3 , LiTa0 3 , LiNbO 3 , Te, Se, ZnTe, ZnSe, Ba 2 NaNb 5 Oi5, AgAsS 3 , proustite, CdSe, CdGeAs 2 , AgGaSe 2 , AgSbS 3 , ZnS, organic crystals such as DAST (4-N-methyIstilbazoliurn. This type of detection mechanism is generally referred to as 'Electro-optic sampling' or EOS.
- the detector could be a so-called photoconducting detector.
- the detector comprises a photoconductive material such as low temperature grown GaAs, Arsenic implanted GaAs or radiation damaged Si on Sapphire.
- a pair of electrodes for example in a bow-tie configuration or in a transmission line configuration are provided on a surface of the photoconductive material.
- the source comprises a frequency conversion member and a source of a pump beam.
- the frequency conversion member may comprise a non-linear member, which is configured to emit a beam of emitted radiation in response to irradiation by a pump beam.
- the pump beam comprises at least two frequency components, (or two pump beams having different frequencies are used), the non- linear member can be configured to emit an emitted beam having a frequency which is the difference of the at least two frequencies of the pump beam or beams.
- Typical non-linear members are: GaAs or Si based semiconductors. More preferably, a crystalline structure is used. The following are further examples of possible materials :
- the at least two frequencies of the pump beam or beams are in the near infrared regime.
- frequencies between 0.1xl0 12 Hz and 5xlO ,4 Hz are used.
- the frequency conversion member is a photoconducting emitter, such an emitter comprises a photoconductive material such as low temperature grown or arsenic implanted GaAs or radiation damaged Si or Sapphire.
- Electrodes which may be of any shape such as a dipole arrangement, a double dipole arrangement, a bow-tie arrangement or transmission line arrangement are provided on the surface of the photoconductive material. At least two electrodes are provided. Upon application of a bias between the electrodes and irradiation of a pump beam(s) having at least two different frequency components, a beam of radiation is emitted having a frequency different to that of the at least two frequency components of the pump beam or beams.
- a time domain signal can be established by measuring the amplitude of the detected radiation with respect to time.
- a scanning delay line is inserted into either the path of the probe or pump beam.
- the delay line can be configured to scan over the whole length of the pulse.
- the first time value can be selected in order to optimise contrast in the image.
- the first time value may be fixed with respect to zero across an image, or it may be fixed with respect to the second time value.
- the apparatus further comprises means for generating a plurality of images corresponding to different first time values, the apparatus also comprising means for scanning through said images by varying said first time value in order to determine a first time value which allows the best contrast.
- the apparatus preferably further comprises:
- (iii) means determining the first time value by comparing at least two of the n spectra.
- n regions of said sample where n is an integer of at least 2;
- the means for selecting regions may be automatic means. For example, a program may be executed to select two or more regions of the sample at random or two or more regions of the sample which have the largest difference between their mean colour levels, the standard deviation of these areas may be calculated to ensure that the selected area does not cover an area of high contrast.
- the apparatus may be provided with means which allow an operator to select two or more areas.
- the apparatus may be configured to support a cursor which the operator may use to select particular areas of the image.
- Figure 1 is a schematic of a reflection imaging system which may be used in accordance with an embodiment of the present invention
- Figure 2 is a is a schematic of a transmission imaging system which maybe used in accordance with an embodiment of the present invention
- Figure 3a is a perspective view of a sample holder and figure 3b is a plan view of a sample holder which may be used in accordance with an embodiment of the present invention
- Figure 4 illustrates a plurality of deconvoled impulse functions for a sample of a skin tumour
- Figure 5 is a schematic illustrating the analysis of an impulse function in accordance with an embodiment of the present invention.
- Figure 6a illustrates a visible image of a skin tumour
- figure 6b illustrates a corresponding Terahertz image of the same sample produced in accordance with an embodiment of the present invention
- figure 6c is a plot of the mean value of the THz signal of the image of figure 6b plotted for four pixels of the image;
- Figure 7a is a vertical histology section of a skin tumour and figure 7b is a corresponding section through a Terahertz image obtained in accordance with an embodiment of the present invention
- Figure 8 is a schematic illustrating the analysis of an impulse function in accordance with a further embodiment of the present invention.
- Figure 9 is a schematic illustrating the analysis of an impulse function in accordance with a yet further embodiment of the present invention.
- Figure 10 is a schematic illustrating the analysis of an impulse function in accordance with an even further embodiment of the present invention
- Figure 11 is an apparatus which can optimise the contrast of a THz image in accordance with an embodiment of the present invention
- Figure 12 is an image of a tumour generated using E(t)/E(min) as explained with reference to Figure 5;
- Figure 13 illustrates two time domain spectra averaged over areas "a" and "b" of Figure 12;
- Figure 14 illustrates a spectra derived from the difference between the two spectra of Figure 13;
- Figure 15 illustrates a spectra derived by dividing one spectra of Figure 13 by the other spectra of Figure 13;
- Figure 16 illustrates a plot of two time domain spectra derived by plotting E(t) E(min), the spectra are similar to those of Figure 13 but have been normalised to the value E(min);
- Figure 17 illustrates a time domain spectra derived from the difference of the two spectra of Figure 16;
- Figure 18 illustrates a time domain spectra derived from dividing one spectra of Figure 16 by the other spectra of Figure 16;
- Figure 19 illustrates an image of a tumour derived by plotting the magnitude of the main minima of the impulse function for each pixel in the x and y direction;
- Figure 20 illustrates the mean value of the minimum view averaged over each of the areas si, s2, dl, d2, hi and h2 indicated in Figure 19;
- Figure 21 illustrates a plot of the mean impulse function in the time domain for areas si, s2, dl, d2, hi and h2 of Figure 19;
- Figure 22 illustrates a plot similar to that of Figure 21 where the spectra have been normalised to the value E(min);
- Figure 23 illustrates a detail of the plot of Figure 21
- Figure 24 illustrates a detail of the plot of Figure 22
- Figure 25 is a plot identical to that of Figure 21 but repeated to allow easy comparison;
- Figure 26 is a plot identical to that of Figure 22 but repeated to allow easy comparison
- Figure 27 illustrates a detail of the plot of Figure 25
- Figure 26 illustrates a detail of the plot of Figure 26
- Figure 29 illustrates a spectra of two time domain spectra, the upper spectra being produced by subtracting the spectra obtained from area hi in Figure 19 from the spectra obtained from the diseased tissue areas dl and d2; the lower plot is a spectra obtained by subtracting a mean spectra obtained from healthy tissue area hi of Figure 19 from inflamed tissue areas si and s2;
- Figure 1 shows a basic THz reflection imaging system.
- the system can be split into three main sections: a generation section 1, an imaging section 3 and a detection section 5.
- a THz beam of radiation is produced in generating section 1.
- Generation section 1 comprises an optically amplified Ti:Sapphire laser 7 to produce a beam 9 of 250 fs pulses at 800 nm.
- the optically amplified laser 7 comprises a solid state pump laser 11 and an amplified Ti:Sapphire section 13. Beam 9 is divided by 50:50 beam splitter 15. Beam splitter 15 divides the beam into a pump pulse 17 which is used to generate THz radiation and a probe pulse 19 which is used in the detection of the radiation reflected from the sample.
- THz pulses are generated by optical excitation and charge acceleration of biased GaAs strip line antenna 21 which outputs THz pulses 23 which have a bandwidth of 0.1 THz to 3 THz.
- the emitted beam 23 is then passed into imaging section 3.
- the irradiating THz beam 23 is then directed via first off-axis parabolic mirror 25 onto second off-axis parabolic mirror 27 and then focussed to a 400 ⁇ m spot on sample 29.
- Sample 29 is mounted on motorised stage 31.
- the sample mount 31 is computer controlled and can be configured to move the sample such that each section (pixel) of the sample in question can be imaged.
- the reflected radiation is then collected via third off-axis parabolic mirror 33 and reflected via planar mirror 35 into the detection system 5.
- the reflected radiation 37 is reflected off-axis parabolic mirror 39.
- Off-axis parabolic mirror 39 has a hole through it which allows the reflected beam 37 to be combined with the probe beam 19 obtained by beam splitter 15.
- the probe beam 19 Prior to combining the probe beam 19 with the reflected radiation 37 at off-axis parabolic mirror 39, the probe beam 19 is reflected off planar mirror 41 into scanning delay line 43.
- Scanning delay line comprises cuboid mirror 45 which moves back and forth under computer control 47 in order to vary the pulse length of the probe beam 19 with respect to the pump beam 17 and hence the irradiating and reflected radiation.
- the relative phase of the probe beam 19 can be varied with respect to the pump pulse 19.
- the combined probe beam and reflected radiation 49 is then collimated and focused onto ZnTe detection crystal 49.
- the THz radiation is detected using the linear electro-optic Pockel's effect.
- the linearly polarised probe beam 19 has its polarisation oriented such that it has components along both the ordinary and extra-ordinary axis of detection crystal 49. Each of the axis has distinct refractive indices no and n t along the ordinary and extraordinary axis of the crystal 49 respectively. In the absence of reflected radiation 37, the linearly polarised probe beam 19 passes through the detection crystal with a negligible change in its polarisation.
- variable retardation waveplate for example, quarter waveplate 51.
- the beam emitted by detection crystal 49 is converted into circularly polarised beam by quarter waveplate 51.
- the beam is then split into two linearly polarised beams by Wollaston prism 53 (or an equivalent device for separating orthogonal polarisation components) which directs the two orthogonal components of the polarised beam onto a balance photo diode assembly 55.
- the balance photo diode signal is adjusted using waveplate 51 so that the difference in outputs between the two diodes is zero when only the probe beam 19 is incident on the detection crystal 49.
- the detector also detects reflected radiation 37, the angle through which the polarisation is rotated by is not negligible. This is because the THz electric field modifies the refractive index of the probe beam 19 along one of the axis n ⁇ , ri o . This results in the physical field emitted by detection crystal 49 being elliptical. Therefore, the polarisation components separated by prism 53 are not equal and the difference in voltage between the output diodes of balance photo-diode assembly 55 gives a detection voltage.
- the delay line 43 is swept under control of computer 47 in order to sweep the phase of the probe beam 19 with respect to the reflected radiation 37 and hence detect the delay time of each of the frequency components of reflected radiation 37. This produces a so-called time-domain signal.
- Computer control 47 also is used to control the movement of stage 31 in order to ensure that a full data set is collected for each pixel of interest of sample 29.
- first 25 and second 27 parabolic mirrors are configured to focus radiation onto sample 29.
- the third parabolic mirror 23 then collects the transmitted radiation and directs it into detection section 5.
- the generation 1 and detection 5 sections are the same as those for the reflection apparatus of Figure 1.
- Figure 3 illustrates a preferred mounting method for a sample of this type.
- Figure 3a shows a perspective view of the sample holder whereas
- Figure 3b shows a cross section of the sample holder.
- Figures 3a and 3b show two samples 61 and 63 located in sample holder 65.
- the sample holder 65 is based on a modified liquid cell of the type used for Fourier transform infra-red spectrometry.
- the liquid cell is cylindrical in shape and comprises a hollow cylindrical container 66, a 2mm thick Quartz plate 67 with a diameter of 25mm, is placed at the base of container 66.
- the THz radiation irradiates the sample through Quartz window 67.
- a polythene window 63 is provided on the opposing side of the sponge to the Quartz window and in contact with the sponge.
- the polythene window is held in place by retainer plate 75 which is screwed into the sample holder 65. This construction provides an airtight holder for the sample which prevents the sample from drying out during imaging.
- Figure 4 illustrates a time domain impulse function for diseased and healthy tissue.
- Figure 4 shows the impulsed function along the y axis plotted against time delay (arbitrary units) along the x axis. Five traces are shown in Figure 4 for five different pixels.
- the entire THz waveform is recorded and averaged over four readings to reduce any fluctuations arising from the laser.
- the signal to noise ratio is approximately 1 ,000 to 1.
- the impulse function is derived from the amplitude of the reflected radiation.
- two further measurements are made in addition to a measurement of the sample.
- the apparatus of Figure 3 uses a Quartz window 67 through which the samples 61 and 63 are illuminated. Quartz window 67 has a lower interface 79 which will cause spurious reflections and also an upper interface 81 which will cause spurious reflections.
- a second Quartz window (not shown) is placed in the sample holder instead of sample 61 and 63.
- the amplitude of the detected THz signal is measured for each pixel so that a baseline signal is obtained through each pixel.
- Variations in Quartz window 67 and also variations in the incident angle of the irradiating radiation may cause artificial variations of the measurements of the sample. Therefore, the baseline is obtained for each pixel.
- the baseline measurement was averaged twenty times to obtain baseline signal B(t).
- a reference spectrum is also measured. This is measured by using the sample holder with just Quartz window 67 on its own. This reference signal will be represented in the time domain as R(t).
- the baseline signal B(t) is subtracted from the measured time domain waveform S(t). This operation can be formed in either the time domain or frequency domain.
- This baseline subtracted waveform should provide data where the spurious reflections due to the lower 79 and upper 81 interfaces of Quartz window 67 have been eliminated.
- the baseline signal is again subtracted from the reference waveform R(t). This subtraction operation can be performed in either the time domain or the frequency domain. The result is then complex Fourier transformed to give:
- the baseline subtracted measured data is then divided by the baseline subtracted reference signal in the frequency domain to give:
- the data is then filtered.
- a filter function will be described by F(t) and is complex Fourier transform will be represented by a F'(v).
- a filter function preferably is used because the THz pulse system can generate and detect pulses comprising frequencies over some finite range, typically from less than lOOGHz to over 3Thz. There is a high frequency limit above which the THz signal falls below the noise level of the detection system.
- the parameters ⁇ and ⁇ are selected to control the high and low frequency roll- off of the function, ⁇ is set approximately the shortest THz pulse length (half cycle) obtainable within the THz system, ⁇ is set to be much longer than the THz pulse.
- the two parameters are optimised manually by the operator to obtain the best compromise between bandwidth and noise.
- the above function comprises two Gaussian functions with similar areas but opposite signs, the above function ensures that the integral of the filter function for all time is zero.
- the filter function is multiplied by the complex Fourier transform of the signal which is being corrected by the baseline and the reference.
- Figure 5 shows a schematic impulse function for just one pixel.
- a meaningful parameter we mean a parameter which can be used to indicate and emphasise variations in the sample.
- the inventors have surprisingly found that the following method of deriving a parameter provides an image with a remarkable sharp contrast for illustrating a number of variations in the sample but has found to be of particular use for indicating the presence of Basal Cell Carcinoma.
- the value of the impulse function at the minima is measured.
- the value of the impulse function at a time t is chosen from the times which correspond to ascending values of the first parameter after the minima.
- a parameter Z is derived by dividing the first parameter at a time t by the value of the first parameter at the minima i.e.
- each value of Z is assigned a colour and a full colour map is generated by plotting z on the z axis against x and y which define the pixel positions.
- t is chosen in order to give the best contrast, "t" is fixed for the image.
- Figure 6a illustrates a visual image of a non-recurrent tumour present on a nasal tip.
- the tumour is 7mm in diameter.
- the tumour 91 is shown on the left of the image with healthy tissue 93 shown on the front of the image.
- a histology cut is indicated on both diagrams 6a and 6b with a dotted line. The importance of this will be described with reference to Figure 7.
- the false colour THz image 6b shows a strong contrast between the diseased and healthy tissue.
- the healthy tissue 93 shows a fairly uniform greyscale contrast throughout.
- the strong contrast between the diseased and healthy tissue which is illustrated in Figure 6b is not present in the visible image where it is difficult to differentiate between the two.
- Figure 6b Four areas, dl, d2, hi and h2 corresponding to two areas of diseased tissue and two areas of healthy tissue are indicated on Figure 6b.
- Figure 6c illustrates a plot of the main value of the impulse function for each of these areas. It can be seen that the mean value for the two diseased areas is much higher than that of the mean value for the two healthy areas. The standard derivation is used to illustrate an error bar for each of the regions. It can be seen that even in the worse case scenario, it is possible to clearly distinguish the diseased areas dl and d2 from healthy areas hi and h2.
- the epidermis is shown as a thick line 101 of histology section 7a. It is noted that the epidermis is missing in the centre of the section. This is because the tissue is preferentially scraped prior to excision. As a result of increased vascularisation around the tumour site and the changing composition of the skin structure within this region, the epidermis is more delicate and susceptible to preferential bleeding in the surrounding healthy tissue. This effect is utilised by the surgeons in assisting identifying the location of the tumour. The tumour had not broken through to the surface before preferential scrapping.
- Tumour shrinkage is due to desification, a result of the histological preparation process.
- the tumour is highly cellular and has a fibrous casing.
- the epidermis is pushed to one side by the tumour and as a result, thickened.
- the upper line indicated on the plot is the mean value for the diseased tissue.
- the lower line is the mean value for the healthy tissue.
- the THz image is taken in the same direction as that of the histology section. In other words, it is just a slice through the greyscale image of Figure 6b taken along the dotted line. Towards the right hand side of the trace, diseased tissue is seen which corresponds to the histology section. Towards the left hand side of the trace, the healthy tissue is seen as shown in the histology section.
- the impulse function is derived in the same manner as that described with reference to Figure 5.
- the minima may move in time from point to point across the sample, t is defined relative to E(min), thus t moves with the minima.
- the parameter ⁇ t is optimised as ⁇ t is fixed for each image.
- Figure 9 shows a variation on the analysis technique described with reference to Figure 8. Again, the impulse function is derived in the same manner as described with reference to Figure 5.
- Figure 10 shows a yet further technique for deriving Z.
- the impulse function is derived as a function of time.
- Z is then calculated by dividing the value of the first parameter at a time t which equals t ⁇ ,j ⁇ + ⁇ t divided by the value of the first parameter at the minima.
- FIG 11 shows a schematic view of such a system.
- the system comprises a controller 111, a THz imaging system 113.
- the THz imaging system is of the type described with reference to either of Figures 1 and 2. To avoid unnecessary repetition, details of it will not be repeated here and the whole system will be represented by box 113.
- Controller 111 has a screen 115 which the operator can use to view a false colour THz image of the sample under test as explained with reference to Figures 4 and 5 and as illustrated in Figure 6b.
- the controller 111 has two modes of operation. A set-up mode and a fixed imaging mode. The controller switches between these two modes using switch 117.
- the full THz spectrum and hence impulse function is derived for each pixel of the sample.
- the image is then derived by calculating Z for a given t.
- t may be a fixed value for all pixels or may be fixed from a second time value which may correspond to a physical feature of the data set.
- the user can then tum dialler 119 and watch the contrast of the image displayed on screen 115 change as t or ⁇ t is varied. The operator can thus choose an optimum value oft or ⁇ t.
- the controller itself may be provided with its own means for determining the optimum contrast as a function oft. For example, the controller can calculate the mean value of Z for each pixel and choose a value oft where the variation in Z is at its largest. Alternatively, more complex statistical techniques may be employed where only representative values of the impulse function are considered in determining the best contrast.
- the operator can then switch 117 to switch the controller 111 onto fixed mode. In this fixed mode, the controller will instruct imaging apparatus 113 to only take data at the minima and at the preferred value oft. This technique substantially reduces the acquisition time for the image.
- t Once t has been determined for a sample, it can be used for that whole sample. It has also been found that the cell value oft can be used as samples of the same type. For example, for samples which are Basal Cell Carcinoma, the operator would expect to use the same value oft.
- Controller 111 can be pre-programmed with t values which are known to provide optimum contrast for certain samples.
- controller 1 11 may be provided with a look-up table such that the operator can enter the type of sample which is to imaged and the controller can automatically select the co ⁇ ect t or ⁇ t value.
- E being the impulse function and n being the number of pixels in area "a”.
- the mean impulse function for area "b" is calculated in the same manner and plotted.
- the width of the curves represents the standard deviation since the waveform is calculated over an area.
- the image may be produced by plotting E(t), E(t) E(min), E(t)- E(min) etc.
- Figure 15 illustrates the case where the two waveforms are compared by dividing the waveform for healthy tissue with that from diseased tissue. This comparison method also allows a value of "t" to be determined which can be used as the first time value.
- E being the impulse function and n being the number of pixels in area a.
- the normalised mean impulse function for area 'b is calculated in the same manner and plotted.
- Figure 17 illustrates the spectra of Figure 16 subtracted from one another whereas Figure 18 illustrates the spectra from Figure 16 divided by one another.
- values of "t" may be derived from the spectra of Figures 17 and 18 which produce an image with good contrast.
- the present invention may also be used to compare three different types of tissue within the sample and different t values may be selected to identify different types of tissue.
- the image of Figure 19 is generated by plotting the minima of the impulse function for each pixel in the x and y directions i.e. Emin is plotted. The minimum mean impulse function for each of these areas, averaged across each area, is then plotted and the graph shown in Figure 20. The vertical error bars represent the standard deviation.
- Figure 21 illustrates the mean impulse function E(t) for healthy tissue (calculated from areas hi, h2), inflamed tissue (calculated from areas si and s2) and diseased tissue (calculated from areas dl and d2) derived from the sample illustrated in figure 19.
- Figure 22 illustrates the spectra of figure 21 which has been normalised to the value of E m j n i.e E(t)/E(min). The width of the spectra represents the standard deviation. It can be seen by viewing figures 20 and 21 side by side that the shape of the waveforms change between a plot of mean E(t) and mean E(t)/E m in- The changes between these two waveforms may be used to distinguish between different tissue types.
- Figures 25 and 26 are identical to figures 21 and 22, but are repeated in order to allow comparison with figures 27 and 28.
- Figures 27 and 28 show a detail of the plots of figures 25 and 26 between lps and 6 ps.
- Figure 29 illustrates two spectra.
- the upper spectra is produced by subtracting the spectra formed by calculating E(t)lE m ⁇ n for healthy tissue from the spectra formed by calculating E(t)/E m i n for diseased tissue.
- the lower spectra is produced by subtracting the spectra formed by calculating E(f)lE m n for healthy tissue from the spectra formed by calculating E(f)/E m j n for inflamed tissue.
- a time value should be chosen where the magnitude of the upper spectra is greatest.
- a time value should be chosen where the magnitude of the lower spectra is greatest.
- both traces show a large negative value at about 0.7 ps.
- this value oft will produce an image where there is good contrast between healthy tissue and diseased tissue and between healthy tissue and inflamed tissue, such an image is unlikely to show contrast between diseased tissue and inflamed tissue.
Landscapes
- Health & Medical Sciences (AREA)
- Physics & Mathematics (AREA)
- Life Sciences & Earth Sciences (AREA)
- Pathology (AREA)
- General Health & Medical Sciences (AREA)
- Biochemistry (AREA)
- Immunology (AREA)
- General Physics & Mathematics (AREA)
- Analytical Chemistry (AREA)
- Chemical & Material Sciences (AREA)
- Spectroscopy & Molecular Physics (AREA)
- Radiology & Medical Imaging (AREA)
- Nuclear Medicine, Radiotherapy & Molecular Imaging (AREA)
- Molecular Biology (AREA)
- Medical Informatics (AREA)
- Public Health (AREA)
- Veterinary Medicine (AREA)
- Surgery (AREA)
- Toxicology (AREA)
- Biophysics (AREA)
- Animal Behavior & Ethology (AREA)
- Heart & Thoracic Surgery (AREA)
- Biomedical Technology (AREA)
- Engineering & Computer Science (AREA)
- Optics & Photonics (AREA)
- Electromagnetism (AREA)
- Investigating Or Analysing Materials By Optical Means (AREA)
- Studio Devices (AREA)
Abstract
Description


Claims


Priority Applications (3)
| Application Number | Priority Date | Filing Date | Title |
|---|---|---|---|
| EP02751361A EP1428011A2 (en) | 2001-09-12 | 2002-07-29 | Imaging apparatus and method |
| JP2003527406A JP2005504959A (en) | 2001-09-12 | 2002-07-29 | Image processing apparatus and method |
| US10/489,542 US7335883B2 (en) | 2001-09-12 | 2002-07-29 | Imaging apparatus and method |
Applications Claiming Priority (4)
| Application Number | Priority Date | Filing Date | Title |
|---|---|---|---|
| GB0122052.4 | 2001-09-12 | ||
| GB0122052A GB0122052D0 (en) | 2001-09-12 | 2001-09-12 | Imaging apparatus and method |
| GB0201614A GB2380920B (en) | 2001-09-12 | 2002-01-24 | Imaging apparatus and method |
| GB0201614.5 | 2002-01-24 |
Publications (3)
| Publication Number | Publication Date |
|---|---|
| WO2003023383A2 true WO2003023383A2 (en) | 2003-03-20 |
| WO2003023383A3 WO2003023383A3 (en) | 2003-07-10 |
| WO2003023383A8 WO2003023383A8 (en) | 2004-11-11 |
Family
ID=26246536
Family Applications (1)
| Application Number | Title | Priority Date | Filing Date |
|---|---|---|---|
| PCT/GB2002/003534 Ceased WO2003023383A2 (en) | 2001-09-12 | 2002-07-29 | Imaging apparatus and method |
Country Status (4)
| Country | Link |
|---|---|
| US (1) | US7335883B2 (en) |
| EP (1) | EP1428011A2 (en) |
| JP (1) | JP2005504959A (en) |
| WO (1) | WO2003023383A2 (en) |
Cited By (13)
| Publication number | Priority date | Publication date | Assignee | Title |
|---|---|---|---|---|
| GB2397207A (en) * | 2003-01-10 | 2004-07-14 | Teraview Ltd | Imaging chemical samples |
| JP2005172779A (en) * | 2003-12-10 | 2005-06-30 | Semiconductor Res Found | Method and apparatus for measuring bacteria, virus and toxic substance by irradiation with electromagnetic wave |
| WO2006051728A1 (en) * | 2004-11-09 | 2006-05-18 | Tochigi Nikon Corporation | Measuring equipment |
| JP2007503576A (en) * | 2003-08-22 | 2007-02-22 | テラビュー リミテッド | Method and apparatus for investigating a sample |
| JP2008510980A (en) * | 2004-08-26 | 2008-04-10 | テラビュー リミテッド | Suppression of scattering-related characteristics by impulse waveform averaging across multiple sample points in terahertz time-domain spectroscopy |
| JP2009075134A (en) * | 2009-01-05 | 2009-04-09 | Junichi Nishizawa | Identification device for bacterium or toxic substance |
| US7608827B2 (en) * | 2006-02-09 | 2009-10-27 | Alcatel-Lucent Usa Inc. | Near-field terahertz imaging |
| CN102297848A (en) * | 2011-05-16 | 2011-12-28 | 中国科学院西安光学精密机械研究所 | Data Acquisition Method for Terahertz Pulse Rapid Imaging |
| WO2013086608A1 (en) * | 2011-12-11 | 2013-06-20 | Tetechs Inc. | Methods and apparatus for identifying and sorting materials using terahertz waves |
| WO2016131047A1 (en) * | 2015-02-13 | 2016-08-18 | The Regents Of The University Of California | Scanning method for uniform, normal-incidence imaging of spherical surface with a single beam |
| CN106370109A (en) * | 2016-08-19 | 2017-02-01 | 南开大学 | Bridge foundation pile steel reinforcement cage length detection apparatus and detection method |
| US10939844B2 (en) | 2016-04-15 | 2021-03-09 | The Regents Of The University Of California | THz sensing of corneal tissue water content |
| US11660012B2 (en) | 2016-04-15 | 2023-05-30 | The Regents Of The University Of California | Assessment of wound status and tissue viability via analysis of spatially resolved THz reflectometry maps |
Families Citing this family (28)
| Publication number | Priority date | Publication date | Assignee | Title |
|---|---|---|---|---|
| GB2399626B (en) * | 2003-03-21 | 2006-04-05 | Teraview Ltd | Spectroscopy apparatus and associated technique |
| GB2405466B (en) * | 2003-08-27 | 2006-01-25 | Teraview Ltd | Method and apparatus for investigating a non-planner sample |
| US8620132B2 (en) * | 2006-09-27 | 2013-12-31 | Anis Rahman | Terahertz scanning reflectometer |
| US9909986B2 (en) | 2003-10-15 | 2018-03-06 | Applied Research And Photonics, Inc. | Thickness determination and layer characterization using terahertz scanning reflectometry |
| US7449695B2 (en) * | 2004-05-26 | 2008-11-11 | Picometrix | Terahertz imaging system for examining articles |
| US8050734B2 (en) * | 2005-09-07 | 2011-11-01 | General Electric Company | Method and system for performing patient specific analysis of disease relevant changes of a disease in an anatomical structure |
| FR2904434B1 (en) * | 2006-07-28 | 2011-04-15 | Univ Savoie | OPTICAL DEVICE FOR IMAGING OR CHARACTERIZING A MATERIAL SAMPLE IN MICROSCOPY OR SPECTROSCOPY IN REFLECTION IN THE TERAHERTZ SPECTRAL DOMAIN |
| WO2008094373A2 (en) * | 2007-01-30 | 2008-08-07 | New Jersey Institute Of Technology | Methods and apparatus for the non-destructive detection of variations in a sample |
| WO2009009785A1 (en) * | 2007-07-12 | 2009-01-15 | Picometrix, Llc | System and method to measure the transit time position(s) of pulses in a time domain data |
| US7641343B1 (en) * | 2007-07-26 | 2010-01-05 | Motamedi Manouchehr E | Method and apparatus for early diagnosis of Alzheimer's using non-invasive eye tomography by terahertz |
| JP5328319B2 (en) | 2008-01-29 | 2013-10-30 | キヤノン株式会社 | Inspection apparatus and inspection method using terahertz waves |
| US9029775B2 (en) | 2008-05-19 | 2015-05-12 | Joseph R. Demers | Terahertz frequency domain spectrometer with phase modulation of source laser beam |
| US10393914B2 (en) | 2009-02-05 | 2019-08-27 | Us Gov't Represented By Secretary Of The Navy Chief Of Naval Research | Systems and methods for detecting concealed nuclear material |
| DE102010003239A1 (en) * | 2010-03-25 | 2011-09-29 | Robert Bosch Gmbh | Vorrichtunng and method for the detection of skin cancer by THz radiation |
| US8378304B2 (en) * | 2010-08-24 | 2013-02-19 | Honeywell Asca Inc. | Continuous referencing for increasing measurement precision in time-domain spectroscopy |
| US9086487B2 (en) * | 2011-03-17 | 2015-07-21 | Uchicago Argonne, Llc | Radar detection of radiation-induced ionization in air |
| JP5710355B2 (en) * | 2011-04-18 | 2015-04-30 | 株式会社東芝 | Inspection apparatus and inspection method using terahertz waves |
| US9494512B2 (en) * | 2011-06-02 | 2016-11-15 | Dong Ho Wu | Methods and systems for remotely detecting hazardous materials using electromagnetic energy |
| JP5749628B2 (en) * | 2011-10-27 | 2015-07-15 | 株式会社東芝 | Inspection apparatus using terahertz wave and inspection method |
| US9103715B1 (en) | 2013-03-15 | 2015-08-11 | Joseph R. Demers | Terahertz spectrometer phase modulator control using second harmonic nulling |
| US9400214B1 (en) | 2013-03-15 | 2016-07-26 | Joseph R. Demers | Terahertz frequency domain spectrometer with a single photoconductive element for terahertz signal generation and detection |
| US9404853B1 (en) | 2014-04-25 | 2016-08-02 | Joseph R. Demers | Terahertz spectrometer with phase modulation |
| US9086374B1 (en) | 2014-04-25 | 2015-07-21 | Joseph R. Demers | Terahertz spectrometer with phase modulation and method |
| CN105021289B (en) * | 2014-04-30 | 2018-10-19 | 热映光电股份有限公司 | Non-contact temperature measuring device |
| US9239264B1 (en) | 2014-09-18 | 2016-01-19 | Joseph R. Demers | Transceiver method and apparatus having phase modulation and common mode phase drift rejection |
| US9429473B2 (en) | 2014-10-16 | 2016-08-30 | Joseph R. Demers | Terahertz spectrometer and method for reducing photomixing interference pattern |
| JP6595815B2 (en) * | 2015-06-22 | 2019-10-23 | 学校法人慶應義塾 | Polarization analyzer and polarization analysis method |
| JP2019007802A (en) * | 2017-06-22 | 2019-01-17 | 株式会社東芝 | Optical inspection apparatus and optical inspection method |
Family Cites Families (4)
| Publication number | Priority date | Publication date | Assignee | Title |
|---|---|---|---|---|
| US5939721A (en) | 1996-11-06 | 1999-08-17 | Lucent Technologies Inc. | Systems and methods for processing and analyzing terahertz waveforms |
| US6078047A (en) * | 1997-03-14 | 2000-06-20 | Lucent Technologies Inc. | Method and apparatus for terahertz tomographic imaging |
| GB9904166D0 (en) | 1999-02-23 | 1999-04-14 | Toshiba Res Europ Ltd | Radiation imaging |
| GB2360186B (en) | 2000-03-03 | 2003-05-14 | Toshiba Res Europ Ltd | Apparatus and method for investigating a sample |
-
2002
- 2002-07-29 EP EP02751361A patent/EP1428011A2/en not_active Withdrawn
- 2002-07-29 JP JP2003527406A patent/JP2005504959A/en active Pending
- 2002-07-29 WO PCT/GB2002/003534 patent/WO2003023383A2/en not_active Ceased
- 2002-07-29 US US10/489,542 patent/US7335883B2/en not_active Expired - Lifetime
Non-Patent Citations (1)
| Title |
|---|
| None |
Cited By (18)
| Publication number | Priority date | Publication date | Assignee | Title |
|---|---|---|---|---|
| GB2397207A (en) * | 2003-01-10 | 2004-07-14 | Teraview Ltd | Imaging chemical samples |
| GB2397207B (en) * | 2003-01-10 | 2005-04-13 | Teraview Ltd | Imaging techniques and associated apparatus |
| JP2007503576A (en) * | 2003-08-22 | 2007-02-22 | テラビュー リミテッド | Method and apparatus for investigating a sample |
| JP2005172779A (en) * | 2003-12-10 | 2005-06-30 | Semiconductor Res Found | Method and apparatus for measuring bacteria, virus and toxic substance by irradiation with electromagnetic wave |
| JP2008510980A (en) * | 2004-08-26 | 2008-04-10 | テラビュー リミテッド | Suppression of scattering-related characteristics by impulse waveform averaging across multiple sample points in terahertz time-domain spectroscopy |
| WO2006051728A1 (en) * | 2004-11-09 | 2006-05-18 | Tochigi Nikon Corporation | Measuring equipment |
| JP2006133178A (en) * | 2004-11-09 | 2006-05-25 | Tochigi Nikon Corp | measuring device |
| US7847931B2 (en) | 2004-11-09 | 2010-12-07 | Tochigi Nikon Corporation | Measuring equipment |
| US7608827B2 (en) * | 2006-02-09 | 2009-10-27 | Alcatel-Lucent Usa Inc. | Near-field terahertz imaging |
| JP2009075134A (en) * | 2009-01-05 | 2009-04-09 | Junichi Nishizawa | Identification device for bacterium or toxic substance |
| CN102297848A (en) * | 2011-05-16 | 2011-12-28 | 中国科学院西安光学精密机械研究所 | Data Acquisition Method for Terahertz Pulse Rapid Imaging |
| WO2013086608A1 (en) * | 2011-12-11 | 2013-06-20 | Tetechs Inc. | Methods and apparatus for identifying and sorting materials using terahertz waves |
| US9239286B2 (en) | 2011-12-11 | 2016-01-19 | Tetechs Inc. | Methods and apparatus for identifying and sorting materials using terahertz waves |
| WO2016131047A1 (en) * | 2015-02-13 | 2016-08-18 | The Regents Of The University Of California | Scanning method for uniform, normal-incidence imaging of spherical surface with a single beam |
| US10517477B2 (en) | 2015-02-13 | 2019-12-31 | The Regents Of The University Of California | Scanning method for uniform, normal-incidence imaging of spherical surface with a single beam |
| US10939844B2 (en) | 2016-04-15 | 2021-03-09 | The Regents Of The University Of California | THz sensing of corneal tissue water content |
| US11660012B2 (en) | 2016-04-15 | 2023-05-30 | The Regents Of The University Of California | Assessment of wound status and tissue viability via analysis of spatially resolved THz reflectometry maps |
| CN106370109A (en) * | 2016-08-19 | 2017-02-01 | 南开大学 | Bridge foundation pile steel reinforcement cage length detection apparatus and detection method |
Also Published As
| Publication number | Publication date |
|---|---|
| JP2005504959A (en) | 2005-02-17 |
| US20050082479A1 (en) | 2005-04-21 |
| EP1428011A2 (en) | 2004-06-16 |
| WO2003023383A8 (en) | 2004-11-11 |
| US7335883B2 (en) | 2008-02-26 |
| WO2003023383A3 (en) | 2003-07-10 |
Similar Documents
| Publication | Publication Date | Title |
|---|---|---|
| US7335883B2 (en) | Imaging apparatus and method | |
| EP1259795B1 (en) | Imaging apparatus and method | |
| US7214940B2 (en) | Apparatus and method for investigating a sample | |
| US6957099B1 (en) | Method and apparatus for terahertz imaging | |
| US7612341B2 (en) | Image of sample using terahertz time domain spectroscopy in reflection mode to identify in a first material like normal breast tissue a second material like cancerous tissue by evaluating the phase change at the interface between the sample and a window like a quartz window, against which the sample is pressed | |
| US20100108888A1 (en) | Reducing scattering related features in terhertz time domain spectroscopy bz averaging the impulse waveform over a plurality of sample points | |
| Woodward et al. | Terahertz pulse imaging in reflection geometry of skin tissue using time-domain analysis techniques | |
| GB2380920A (en) | Terahertz radiation imaging | |
| AU2002362239A1 (en) | Imaging apparatus and method | |
| GB2435509A (en) | Terahertz pulsed spectroscopy method | |
| Ferguson et al. | Terahertz imaging of biological tissue using a chirped probe pulse | |
| Hunsche et al. | Terahertz T-ray tomography | |
| Yokus et al. | Identification of tissue interaction of terahertz radiation toward functional tissue imaging | |
| Foulds et al. | Terahertz imaging of wound healing | |
| Zhang | T-ray computed tomography | |
| Gregory et al. | Multichannel continuous-wave terahertz imaging | |
| AU2002217350A1 (en) | Apparatus and method for investigating a sample |
Legal Events
| Date | Code | Title | Description |
|---|---|---|---|
| AK | Designated states |
Kind code of ref document: A2 Designated state(s): AE AG AL AM AT AU AZ BA BB BG BY BZ CA CH CN CO CR CU CZ DE DM DZ EC EE ES FI GB GD GE GH HR HU ID IL IN IS JP KE KG KP KR LC LK LR LS LT LU LV MA MD MG MN MW MX MZ NO NZ OM PH PL PT RU SD SE SG SI SK SL TJ TM TN TR TZ UA UG US UZ VN YU ZA ZM |
|
| AL | Designated countries for regional patents |
Kind code of ref document: A2 Designated state(s): GH GM KE LS MW MZ SD SL SZ UG ZM ZW AM AZ BY KG KZ RU TJ TM AT BE BG CH CY CZ DK EE ES FI FR GB GR IE IT LU MC PT SE SK TR BF BJ CF CG CI GA GN GQ GW ML MR NE SN TD TG |
|
| 121 | Ep: the epo has been informed by wipo that ep was designated in this application | ||
| DFPE | Request for preliminary examination filed prior to expiration of 19th month from priority date (pct application filed before 20040101) | ||
| WWE | Wipo information: entry into national phase |
Ref document number: 2003527406 Country of ref document: JP |
|
| WWE | Wipo information: entry into national phase |
Ref document number: 2002362239 Country of ref document: AU |
|
| WWE | Wipo information: entry into national phase |
Ref document number: 2002751361 Country of ref document: EP |
|
| WWP | Wipo information: published in national office |
Ref document number: 2002751361 Country of ref document: EP |
|
| WWE | Wipo information: entry into national phase |
Ref document number: 10489542 Country of ref document: US |
|
| CFP | Corrected version of a pamphlet front page | ||
| CR1 | Correction of entry in section i |
Free format text: IN PCT GAZETTE 12/2003 UNDER (30) REPLACE "21 JANUARY 2002 (21.01.2002)" BY "24 JANUARY 2002 (24.01.2002)" |