WO2004087966A2 - Genomic profiling of regulatory factor binding sites - Google Patents

Genomic profiling of regulatory factor binding sites Download PDF

Info

Publication number
WO2004087966A2
WO2004087966A2 PCT/US2004/009201 US2004009201W WO2004087966A2 WO 2004087966 A2 WO2004087966 A2 WO 2004087966A2 US 2004009201 W US2004009201 W US 2004009201W WO 2004087966 A2 WO2004087966 A2 WO 2004087966A2
Authority
WO
WIPO (PCT)
Prior art keywords
database
gene
information
genome
binding sites
Prior art date
Legal status (The legal status is an assumption and is not a legal conclusion. Google has not performed a legal analysis and makes no representation as to the accuracy of the status listed.)
Ceased
Application number
PCT/US2004/009201
Other languages
French (fr)
Other versions
WO2004087966A3 (en
Inventor
Jie Zhang
Hsiu-Ying Wei
Leslie Margaret Mcevoy
Current Assignee (The listed assignees may be inaccurate. Google has not performed a legal analysis and makes no representation or warranty as to the accuracy of the list.)
Anesiva Inc
Original Assignee
Corgentech Inc
Priority date (The priority date is an assumption and is not a legal conclusion. Google has not performed a legal analysis and makes no representation as to the accuracy of the date listed.)
Filing date
Publication date
Application filed by Corgentech Inc filed Critical Corgentech Inc
Priority to EP04758363A priority Critical patent/EP1608786B1/en
Priority to AU2004225474A priority patent/AU2004225474A1/en
Priority to CA002519674A priority patent/CA2519674A1/en
Priority to DE602004018115T priority patent/DE602004018115D1/en
Priority to MXPA05010276A priority patent/MXPA05010276A/en
Publication of WO2004087966A2 publication Critical patent/WO2004087966A2/en
Publication of WO2004087966A3 publication Critical patent/WO2004087966A3/en
Anticipated expiration legal-status Critical
Ceased legal-status Critical Current

Links

Classifications

    • CCHEMISTRY; METALLURGY
    • C12BIOCHEMISTRY; BEER; SPIRITS; WINE; VINEGAR; MICROBIOLOGY; ENZYMOLOGY; MUTATION OR GENETIC ENGINEERING
    • C12QMEASURING OR TESTING PROCESSES INVOLVING ENZYMES, NUCLEIC ACIDS OR MICROORGANISMS; COMPOSITIONS OR TEST PAPERS THEREFOR; PROCESSES OF PREPARING SUCH COMPOSITIONS; CONDITION-RESPONSIVE CONTROL IN MICROBIOLOGICAL OR ENZYMOLOGICAL PROCESSES
    • C12Q1/00Measuring or testing processes involving enzymes, nucleic acids or microorganisms; Compositions therefor; Processes of preparing such compositions
    • C12Q1/68Measuring or testing processes involving enzymes, nucleic acids or microorganisms; Compositions therefor; Processes of preparing such compositions involving nucleic acids
    • C12Q1/6876Nucleic acid products used in the analysis of nucleic acids, e.g. primers or probes
    • C12Q1/6883Nucleic acid products used in the analysis of nucleic acids, e.g. primers or probes for diseases caused by alterations of genetic material
    • GPHYSICS
    • G16INFORMATION AND COMMUNICATION TECHNOLOGY [ICT] SPECIALLY ADAPTED FOR SPECIFIC APPLICATION FIELDS
    • G16BBIOINFORMATICS, i.e. INFORMATION AND COMMUNICATION TECHNOLOGY [ICT] SPECIALLY ADAPTED FOR GENETIC OR PROTEIN-RELATED DATA PROCESSING IN COMPUTATIONAL MOLECULAR BIOLOGY
    • G16B20/00ICT specially adapted for functional genomics or proteomics, e.g. genotype-phenotype associations
    • G16B20/30Detection of binding sites or motifs
    • GPHYSICS
    • G16INFORMATION AND COMMUNICATION TECHNOLOGY [ICT] SPECIALLY ADAPTED FOR SPECIFIC APPLICATION FIELDS
    • G16BBIOINFORMATICS, i.e. INFORMATION AND COMMUNICATION TECHNOLOGY [ICT] SPECIALLY ADAPTED FOR GENETIC OR PROTEIN-RELATED DATA PROCESSING IN COMPUTATIONAL MOLECULAR BIOLOGY
    • G16B30/00ICT specially adapted for sequence analysis involving nucleotides or amino acids
    • GPHYSICS
    • G16INFORMATION AND COMMUNICATION TECHNOLOGY [ICT] SPECIALLY ADAPTED FOR SPECIFIC APPLICATION FIELDS
    • G16BBIOINFORMATICS, i.e. INFORMATION AND COMMUNICATION TECHNOLOGY [ICT] SPECIALLY ADAPTED FOR GENETIC OR PROTEIN-RELATED DATA PROCESSING IN COMPUTATIONAL MOLECULAR BIOLOGY
    • G16B50/00ICT programming tools or database systems specially adapted for bioinformatics
    • G16B50/20Heterogeneous data integration

Definitions

  • the present invention relates generally to methods, systems and data structures that provide profiles of regulatory factor binding sites of all the known genes, and more particularly to methods, data structures and systems for identifying and characterizing regulatory factors binding sites in order to develop systematical analysis on identified binding sites for further therapeutic strategies development.
  • TFs transcription factors
  • the transcription starting site is the position where its' mRNA starts to be transcribed from DNA by RNA polymerase II.
  • the gene regulatory region is associated and bound by certain regulatory factors. These bound factors together with other transcription proteins formed a transcription complex that can initialize the transcription process. More specifically, this typically includes the transcription factor binding sites that are the short consensus genomic sequences.
  • One of the most important regulatory regions is the core promoter usually located immediately before or flanking TSS. Thus, identifying TSS is important to define the transcription regulatory region for each gene.
  • TSS transcription starting site
  • the present invention retrieved all the full-length genes from various public available databases (such as, NCBI refseq, NIH MGC consortium, DBTSS database of Japan, and so on) and then mapped these gene's TSSs on the most updated Human Genome Working Draft (such as Assembly version July, 2003, or NCBI build 34). Then it defined the most upstream TSS for each gene by comparing all the possible TSSs generated by mapping the position of this gene.
  • the transcription regulatory region (TRR), such as core promoter regions were defined based on the most 5' TSS positions, and their corresponding genomic sequences were retrieved from most updated human genome for further analysis.
  • the profiled TRR for all the known genes were stored in a database for further drug-target related statistic analysis and for further therapeutic strategies development.
  • an object of the present invention is to provide improved methods for genomic-profiling regulatory factor binding sites, as well as data structures and systems associated with the methods. h another object of the present invention, methods for profiling regulatory factor binding sites, as well as data structures and systems associated with the methods, are provided that employ genome-wide probability mapping relative to profiled binding sites.
  • Yet another object of the present invention is to provide improved methods for biomedical research, as well as data structures and systems associated with the methods.
  • a further object of the present invention is to provide improved methods for pre- clinical development, as well as data structures and systems associated with the methods.
  • Still another object of the present invention is to provide improved methods for drug screening applications, as well as data structures and systems associated with the methods.
  • Another object of the present invention is to provide improved methods for target discovering and target validation, as well as data structures and systems associated with the methods.
  • Yet another object of the present invention is to provide improved methods for profiling of a regulatory region, as well as data structures and systems associated with the methods.
  • a further object of the present invention is to provide improved methods for building the genome or tissue wide connections between regulatory profilings of different genes, as well as data structures and systems associated with the methods.
  • Still a further object of the present invention is to provide improved methods for understanding the genome or tissue or cell background of various known transcription profiling understanding the genome or tissue or cell background of various known transcription profiling, as well as data structures and systems associated with the methods.
  • a complete gene is located on genome for mapping gene regulatory regions. Genomic sequences of gene regulatory regions are defined and retrieved. DNA sequence information of each retrieved gene regulatory region is screened for identifying putative regulatory factor binding sites. The putative regulatory factor binding sites are profiled.
  • a method for profiling identified binding sites provides a database that includes profiled identified binding sites for all known genes. Probability statistic analysis is applied to the profiled binding sites.
  • a data structure tangibly stored on a computer readable medium is provided. The data structure includes a database with profiled identified binding sites. The profiled identified binding sites are created by screening DNA sequence information of gene regulatory regions. The database is searchable by gene identifiers.
  • a computer implemented system for displaying profiled regulatory factor binding sites includes a database that includes profiled identified binding sites.
  • the profiled identified binding sites are created by screening DNA sequence information of gene regulatory regions.
  • the database is searchable by gene identifiers.
  • a user interface is provided that includes one or more selectable user inputs.
  • An input device is operable by a user.
  • a display is included that displays at least one output in response to the profiled identified binding sites.
  • Figure 1 is a flow chart illustrating one of the embodiment of the present invention for profiling regulatory factor binding sites.
  • Figure 2 is a flow chart that described how to define the transcription regulatory region of a gene (example Gene X).
  • Figure 3 is a flow chart illustrating calculating the frequency of TF binding sites.
  • Figure 4 illustrates that the core promoter region can include 200-300 bases upstream and about 50-100 bases downstream of the TSS.
  • Figure 5 is a description of one embodiment of a structure of a database of the present invention.
  • Figure 6 is a flow chart illustrating the Figure 5 database.
  • Figure 7 lists the complete sequences for gene DLD retrieved from the refseq database (SEQ ID NO 59).
  • Figure 8 lists the complete sequences for gene DLD retrieved from the MGC database
  • Figure 9 lists the complete sequences for gene DLD retrieved from the DBTSS database (SEQ ID NO 61).
  • Figure 10 lists the stored sequence for gene DLD (SEQ JO NO 62).
  • Figure 11 is a screen shot of a query form that can be used with the Figure 7 database.
  • Figure 12 is a screen shot of one embodiment of a database query result from the Figure 5 database.
  • Figure 13 illustrates one embodiment of a system of the present invention.
  • the present invention provides methods for genome wide profiling regulatory factor binder sites, data structures tangibly stored on a computer readable medium, and associated systems.
  • regulatory factor binder sites include but are not limited to, sequence AGGGGACTTTCCCA (SEQ ID NO 1) as the binding sites for transcription factor NF-kappa B; sequence TTTGGCGG (SEQ ID NO 2) as the binding sites for transcription factor E2F-1, and the like.
  • genomic sequences of gene regulatory regions are retrieved and are mapped to human genome. Based on the mapped genes, the most 5 prime position of TSS for each gene is identified and the corresponding regulatory region for the gene is identified. DNA sequence information for each retrieved gene regulatory region is screened to identify putative regulatory factor binding sites. The putative regulatory factor binding sites are then profiled.
  • Information retrieved from the database can be utilized for a variety of different purposes and applications including but not limited to, biomedical research, pre-clinical development, drug screening applications, target discovering and target validation, profiling of a regulatory region, building the genome or tissue wide connections between regulatory profilings of different genes, understanding the genome or tissue background of various known transcription profiling understanding the genome or tissue background of various known transcription profiling, and the like.
  • probability mapping is applied to the identified binding sites.
  • the probability mapping describes the identification of existences of a specific transcription regulatory factor binding sites, such as all the putative E2F-1 sites, in the regulatory region of all the genes or in the genes that expressed in certain tissue or cell.
  • the probability mapping tells how many genes are possibly transcription-regulated by a specific regulatory factor. It also indicates that how much biological system wide, genome wide, cell wide, or tissue wide, effect a specific regulator factor could have. This information is very useful for bio-medical research based therapeutic method development.
  • a full-length gene is mapped for purposes of mapping gene regulatory regions. It will be appreciated that for purposes of this specification, full length extends to the length of the gene.
  • all of the available full-length gene is used in a comparison in order to obtain the most 5' TSS.
  • the regulatory regions of genes are defined and the genomic sequences of gene regulatory regions are retrieved. DNA sequence information is screened for each retrieved gene regulatory region to identify putative regulatory factor binding sites. The putative regulatory factor binding sites are mapped to the human genome. Full-length genes are retrieved to provide sequences information for retrieved genes.
  • the retrieved genes can be mapped to a recently updated human genome using a tool provided by a public available UCSC genome browser databases, self-developed scripts, and the like.
  • the transcription start site is mapped.
  • the TSS is mapped by taking the most 5' TSS of each gene after comparing all available TSS's for the gene, illustrated in Figure 2.
  • a genomic sequence of a regulatory region can be retrieved for each retrieved gene with the most 5' TSS from the most updated human genome.
  • the 5' regulatory region is the sequences upstream of the TSS and downsfream of the TSS.
  • the gene regulatory regions include but are not limit to, the core promoter region, the upstream enhancer region, a downstream regulatory region, and the like, as illustrated in Figure 4.
  • the core promoter region can include 200-300 bases upstream and about 50-100 bases downstream of the TSS. Corresponding sequences relative to TSS can be cut and stored.
  • the corresponding sequences relative to TSS can be cut and stored with the use of self-developed scripts from genomic sequences based on a specific release, older, updated and future releases, including but not limited to the UCSC genome browser, NCBI genome database, the Ensembl database, other genomic sequence databases and the like.
  • the DNA sequence information is screened using a MATCH program that is licensed from TRANSFAC database.
  • the DNA sequence information screening can include selecting the TF matrix, scores of matrix similarity, scores of core similarity, and the like.
  • a genomic or tissue-specific frequency of each binding site can be determined.
  • the frequency can be the existence of specific TF binding sites in regulatory regions of at least one of, (i) all the genes genome wide, (ii) all the genes specific cell wide, (iii) all the genes specific-tissue wide, (iv) all the genes specific-defined.
  • the frequency can be the existence of specific TF binding sites in regulatory regions of tissue specific genes.
  • the frequency can also be considered with a conservation score or an expression level score.
  • the identified binding sites can be considered differently based on their corresponding conservation score or their corresponding gene expression level. For example, a binding site with higher conservation score or the corresponding gene with higher expression level could play a more significant role than those with lower scores.
  • the conservation score for each binding site can be created.
  • the conservation score is selected to cover regions where the TF binding sites are identified as well as any other measurements that indicate conservation levels between the two species including but not limited to mouse and human.
  • the position of each binding site can be determined. The position can be based on a human genome working draft. The position is a converted position in a human genome working draft. As more sequence pieces are added, the total length for each chromosome grows. This shifts the position reading for each base on the chromosome. However, the position can be easily converted and the relative position of a regulatory region to the position of the gene remains unchanged.
  • the genome position of a start and end can be determined. A distance of each binding site to the TSS can be determined.
  • the distance is relative to a number of bases between a binding site and the TSS.
  • the distance is that of the last base between defined binding sites to the base of TSS's 23 base. In this example, there are 23 bases between these two specific bases.
  • the 5 prime regulatory sequences from most updated Human Genome Working Draft are retrieved for all the available genes using self developed computer scripts and programs. These retrieved sequences include but not limited to 250-base 5 prime upstream and 50-base 3 prime downsfream of TSS for each gene.
  • All the regulatory region sequences can be analyzed using well-characterized transcription factor binding consensus sequence patterns (or, position weighted matrix) created by licensed TRANSFAC databases (TRANSFAC professional 6.3 version, Wingender et al., Nucleic Acids Res. 29, 281).
  • TRANSFAC databases TRANSFAC professional 6.3 version, Wingender et al., Nucleic Acids Res. 29, 281.
  • the sites with high score matching with binding matrix will be selected. These sites include their positions in the genome (relative to specific genome assemble version) and their lengths and their synergism information with flanking sites.
  • mice All the binding sites result from above are further analyzed by comparing their conservation scores with mouse.
  • the mouse genome and relative conservation information will be retrieved from public available NCBI and UCSC genome databases, and the conservation comparison with human transcription factor binding sites will be done using self-generated scripts and programs.
  • the resulted transcription factor binding site sequences information from above include their genomic positions (start, end), length, distant to TSS of each gene, and the flanking regions (include but not limit to 10-base both 5 prime and 3 prime) will be deposited into a database.
  • the related reference links such as gene name, function, annotation, et al are also added.
  • All the possible transcription decoys can be computational generated based on the database.
  • the decoys can further be experimentally screened by using high-throughput methods, such as oligo-array, capillary-elecfrophoresis, et al for binding efficiency optimization. All the optimized decoy information will be deposited into the database.
  • the partial information in the database can be used in future versions of the database.
  • Profiles of the regulatory regions of genes include but are not limited to, (i) probability mapping of each regulatory factor binding site, (ii) target genes identification for each known regulatory factor; (iii) statistic analysis of regulatory factor binding profiles of genes identified from various differential expressed genes, and the like.
  • a length of each binding site is determined. Sequence information about regions adjacent to the binding site can also be determined. Again by illustration and without limitation, one example is agcgtcagaAGGGGACTTTCCCaagagaggccgaga, (SEQ ID NO 3) with the small case base letters flanking the core binding sites, in upper case.
  • binding sites are profiled for a regulatory region of the gene and often more than one binding site is identified from a single region.
  • the number of binding sites can be, by way of example, fifteen to twenty from a single region.
  • the cluster of the binding sites and their positions can be determined.
  • FIGs 5 and 6 another embodiment of the present invention is a data structure tangibly stored on a computer readable medium that includes a database with the profiled identified binding site information.
  • the database includes a core table with identifiers, binding sites and the like.
  • Binding site information includes but is not limited to, sequence, length, position, direction, frequency, and the like.
  • One supporting table includes TSS position of all genes.
  • a sequence table provides the sequences of regulatory regions of genes. Additional support tables include but are not limited to frequency of TF, target genes of TF for each TF, and the like.
  • All of the tables are linked by one or more identifiers, hi one embodiment, several instead of one perl CGI script are used to reach and search the database and then display the corresponding information.
  • a web-browser interface is provided.
  • the database is searchable by a variety of different means, including but not limited to gene identifiers, gene symbol, or self-developed identifiers and the like.
  • Gene identifiers can be selected from the NCBI database, which can be a, Unigene Cluster LD, LoucsLink ID, international approved gene symbols, and the like.
  • the database includes genomic frequencies information for TF, and can be sorted by at least a TF name or TF frequencies.
  • the TF frequencies can include genome frequencies and tissue specific frequencies.
  • the database contains the profiles of regulatory factor binding sites for all the known genes (about 15,450 total).
  • one gene (symbol: DLD, dihydrolipoamide dehydrogenase) is used to briefly show how the database is built.
  • the retrieved genes are mapped to a recently updated human genome.
  • a self-developed script is used to fetch the above retrieved sequence to UCSC genome browser database to map their genomic position.
  • the retrieved different version of gene DLD are mapped to the recently updated human genome using a tool provided by at least one of public available UCSC genome browser databases.
  • mapping positions are retrieved using self-developed script from the above referenced UCSC genome browser database.
  • the summary result of mapping is listed in table 1.
  • the full length gene DLD sequence from NCBI refseq database was mapped to the human genome working draft (released June 2002 by UCSC genome browser) at the chromosome 7 sense strand or positive strand, starting at the chromosome position of 106015510, ending at the chromosome position of 106044308.
  • Table 1 name chromosome strand start end
  • the TSS is mapped by making the most 5-prime TSS of each gene after comparing all available TSS'S for the gene.
  • this mapping is facilitated by using self-generated script.
  • 106015488 is taken as the most 5' position for TSS of gene DLD.
  • a genomic sequence of a regulatory region for each retrieved gene with the most 5'TSS is retrieved from the most updated human genome.
  • the 5' regulatory region is the sequences upstream of the TSS and downstream of the TSS. More specifically, for gene DLD, the regulatory region or core promoter region is the sequence includes 200-300 bases upstream and the sequence about 50-100 bases downstream of the TSS. Therefore, the corresponding sequences relative to TSS of gene DLD are cut and stored with the use of self-developed scripts from at least one of the UCSC genome browser or NCBI genome database.
  • the stored sequence for gene DLD is listed in Figure 10 (SEQ ID NO 62).
  • the stored sequence for regulatory region of gene DLB is screened using a match program.
  • the MATCH program is the sequence-analyzing tool embedded inside the licensed TRANSFAC database. The analysis is done with the proper setting for both the scores of matrix similarity and scores of core similarity in order to reduce the false positive and false negative matching during screening.
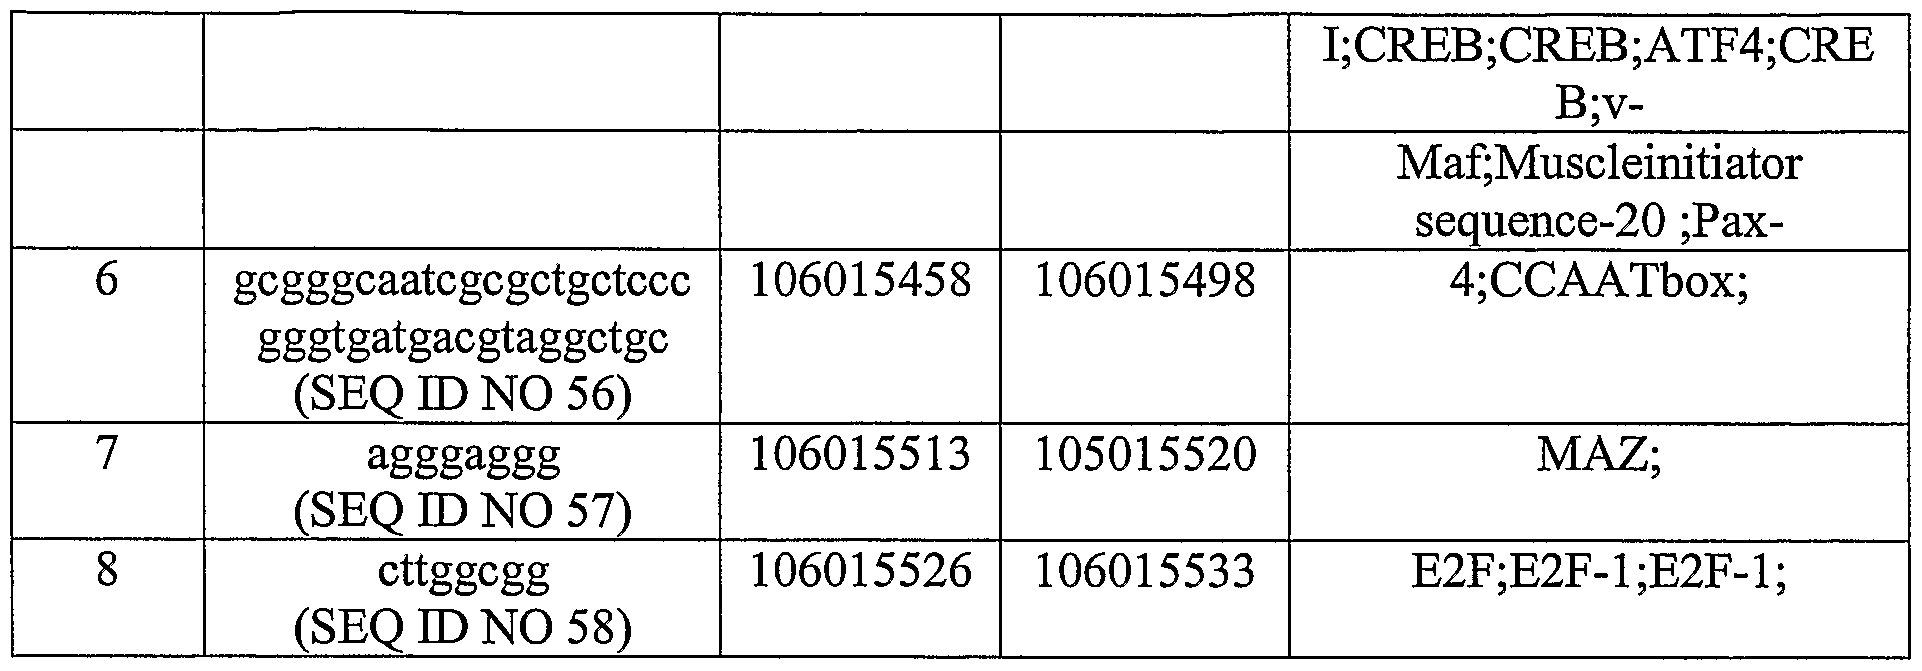
  • the result of the screening for the regulatory region of gene DLD is shown in table 2 where the positions of identified binding sites are listed.
  • a genomic or tissue specific frequency of each binding site is determined.
  • the frequency is the existence of specific TF binding sites in regulatory regions of all the genes or tissue specific genes. After analysis of the regulatory region of all the genes, the frequency or probability of existence of TF binding sites is easy established. Some of these frequencies information are listed for gene DLD in table 3: Table 3:
  • the conservation scores for whole genome comparison between human and mouse are retrieved from UCSC genome browser database.
  • the conservation score is selected to cover regions where the TF binding sites are identified.
  • the conservation scores for the TF binding sites identified in the regulatory region of gene DLD are listed in table 4.
  • the adjacent or overlapped binding sites are clustered by using self- generated script and the corresponding position and TF are listed in the table 5 for the gene DLD.
  • Binding profiles are collected in the database.
  • the database is searchable by gene identifiers.
  • Figure 11 illustrates a screen shot of a query form that can be used with the database.
  • Figure 12 illustrates a screen shot of a database query result.
  • another embodiment of the present invention is a computer implemented system for displaying the profiled regulatory factor binding sites.
  • the system includes the database, a user interface that includes one or more selectable user inputs, an input device operable by a user, and a display for displaying at least one output in response to the profiled identified binding sites. Examples of outputs include but are not limited to, gene name, identifier, identified
  • the system also includes a memory, a microprocessor, data files, scripts, supporting available software, including but not limited to MS windows, red hat linux, Apache HTTP sever, Perl compiler program, and the like.

Landscapes

  • Life Sciences & Earth Sciences (AREA)
  • Health & Medical Sciences (AREA)
  • Physics & Mathematics (AREA)
  • Engineering & Computer Science (AREA)
  • Bioinformatics & Cheminformatics (AREA)
  • Biophysics (AREA)
  • Chemical & Material Sciences (AREA)
  • Biotechnology (AREA)
  • General Health & Medical Sciences (AREA)
  • Bioinformatics & Computational Biology (AREA)
  • Evolutionary Biology (AREA)
  • Medical Informatics (AREA)
  • Spectroscopy & Molecular Physics (AREA)
  • Theoretical Computer Science (AREA)
  • Proteomics, Peptides & Aminoacids (AREA)
  • Analytical Chemistry (AREA)
  • Genetics & Genomics (AREA)
  • Molecular Biology (AREA)
  • Bioethics (AREA)
  • Databases & Information Systems (AREA)
  • Organic Chemistry (AREA)
  • Zoology (AREA)
  • Wood Science & Technology (AREA)
  • Immunology (AREA)
  • Microbiology (AREA)
  • Pathology (AREA)
  • Biochemistry (AREA)
  • General Engineering & Computer Science (AREA)
  • Information Retrieval, Db Structures And Fs Structures Therefor (AREA)
  • Measuring Or Testing Involving Enzymes Or Micro-Organisms (AREA)
  • Management, Administration, Business Operations System, And Electronic Commerce (AREA)
  • Image Processing (AREA)
  • Electrotherapy Devices (AREA)
  • Image Generation (AREA)

Abstract

A method is provided for profiling regulatory factor binding sites. A complete gene is located on genome for mapping gene regulatory regions. The genomic position of the most up-stream transcription start sites (TSS) of gene is identified. Genomic sequences of gene regulatory regions are defined and retrieved based on the identified TSS. DNA sequence information of each retrieved gene regulatory region is screened for identifying putative regulatory factor binding sites. The putative regulatory factor binding sites and their genomic occurrences are profiled.

Description

GENOMIC PROFILING OF REGULATORY FACTOR BINDING SITES
BACKGROUND OF THE INVENTION
Field of the Invention
The present invention relates generally to methods, systems and data structures that provide profiles of regulatory factor binding sites of all the known genes, and more particularly to methods, data structures and systems for identifying and characterizing regulatory factors binding sites in order to develop systematical analysis on identified binding sites for further therapeutic strategies development.
Description of the Related Art
Altering gene expression level has become an important and efficient approach to address the human disorders. The expression level of each gene is controlled by the transcription machinery, in which some specific proteins called transcription factors (TFs) bind to the regulatory region of the gene, and in turn to initialize the transcription processes. Thus, the corresponding TFs and their binding sites on gene regulatory region can play the essential role in controlling the transcription level of gene. Therefore, transcription factors and their related transcription mechanisms have become the "hot" spots in modern bio- medical research and development efforts.
For each gene, the transcription starting site (TSS) is the position where its' mRNA starts to be transcribed from DNA by RNA polymerase II. During this process, the gene regulatory region is associated and bound by certain regulatory factors. These bound factors together with other transcription proteins formed a transcription complex that can initialize the transcription process. More specifically, this typically includes the transcription factor binding sites that are the short consensus genomic sequences. One of the most important regulatory regions is the core promoter usually located immediately before or flanking TSS. Thus, identifying TSS is important to define the transcription regulatory region for each gene. Currently, many specific researches and developments focus their efforts on the specific TFs and corresponding binding sites, which provided many solid data but still failed to meet the large requirement of the development of genomic-related biomedical needs. To meet the fast growing transcription factors related drug discovery business and challenge, it is very important to identify all putative regulatory factors and characterize their corresponding binding sites in genome. Especially, with the finish of human genome project and occurrences of large amount of disease-related gene expression data (such as microarray- based data), the genome wide profiling of regulatory factor binding sites become urgent.
The present invention retrieved all the full-length genes from various public available databases (such as, NCBI refseq, NIH MGC consortium, DBTSS database of Japan, and so on) and then mapped these gene's TSSs on the most updated Human Genome Working Draft (such as Assembly version July, 2003, or NCBI build 34). Then it defined the most upstream TSS for each gene by comparing all the possible TSSs generated by mapping the position of this gene. The transcription regulatory region (TRR), such as core promoter regions were defined based on the most 5' TSS positions, and their corresponding genomic sequences were retrieved from most updated human genome for further analysis. The profiled TRR for all the known genes were stored in a database for further drug-target related statistic analysis and for further therapeutic strategies development.
SUMMARY OF THE INVENTION
Accordingly, an object of the present invention is to provide improved methods for genomic-profiling regulatory factor binding sites, as well as data structures and systems associated with the methods. h another object of the present invention, methods for profiling regulatory factor binding sites, as well as data structures and systems associated with the methods, are provided that employ genome-wide probability mapping relative to profiled binding sites.
Yet another object of the present invention is to provide improved methods for biomedical research, as well as data structures and systems associated with the methods. A further object of the present invention is to provide improved methods for pre- clinical development, as well as data structures and systems associated with the methods.
Still another object of the present invention is to provide improved methods for drug screening applications, as well as data structures and systems associated with the methods.
Another object of the present invention is to provide improved methods for target discovering and target validation, as well as data structures and systems associated with the methods.
Yet another object of the present invention is to provide improved methods for profiling of a regulatory region, as well as data structures and systems associated with the methods. A further object of the present invention is to provide improved methods for building the genome or tissue wide connections between regulatory profilings of different genes, as well as data structures and systems associated with the methods.
Still a further object of the present invention is to provide improved methods for understanding the genome or tissue or cell background of various known transcription profiling understanding the genome or tissue or cell background of various known transcription profiling, as well as data structures and systems associated with the methods.
These and other objects of the present invention are achieved in a method for profiling regulatory factor binding sites. A complete gene is located on genome for mapping gene regulatory regions. Genomic sequences of gene regulatory regions are defined and retrieved. DNA sequence information of each retrieved gene regulatory region is screened for identifying putative regulatory factor binding sites. The putative regulatory factor binding sites are profiled.
In another embodiment of the present invention, a method for profiling identified binding sites provides a database that includes profiled identified binding sites for all known genes. Probability statistic analysis is applied to the profiled binding sites. hi another embodiment of the present invention, a data structure tangibly stored on a computer readable medium is provided. The data structure includes a database with profiled identified binding sites. The profiled identified binding sites are created by screening DNA sequence information of gene regulatory regions. The database is searchable by gene identifiers.
In another embodiment of the present invention, a computer implemented system for displaying profiled regulatory factor binding sites includes a database that includes profiled identified binding sites. The profiled identified binding sites are created by screening DNA sequence information of gene regulatory regions. The database is searchable by gene identifiers. A user interface is provided that includes one or more selectable user inputs. An input device is operable by a user. A display is included that displays at least one output in response to the profiled identified binding sites. BRIEF DESCRIPTION OF THE DRAWINGS
Figure 1 is a flow chart illustrating one of the embodiment of the present invention for profiling regulatory factor binding sites. Figure 2 is a flow chart that described how to define the transcription regulatory region of a gene (example Gene X).
Figure 3 is a flow chart illustrating calculating the frequency of TF binding sites.
Figure 4 illustrates that the core promoter region can include 200-300 bases upstream and about 50-100 bases downstream of the TSS. Figure 5 is a description of one embodiment of a structure of a database of the present invention.
Figure 6 is a flow chart illustrating the Figure 5 database.
Figure 7 lists the complete sequences for gene DLD retrieved from the refseq database (SEQ ID NO 59). Figure 8 lists the complete sequences for gene DLD retrieved from the MGC database
(SEQ ID NO 60).
Figure 9 lists the complete sequences for gene DLD retrieved from the DBTSS database (SEQ ID NO 61).
Figure 10 lists the stored sequence for gene DLD (SEQ JO NO 62). Figure 11 is a screen shot of a query form that can be used with the Figure 7 database.
Figure 12 is a screen shot of one embodiment of a database query result from the Figure 5 database.
Figure 13 illustrates one embodiment of a system of the present invention.
DESCRIPTION OF THE PREFERRED EMBODIMENTS
In various embodiments, the present invention provides methods for genome wide profiling regulatory factor binder sites, data structures tangibly stored on a computer readable medium, and associated systems. Examples of regulatory factor binder sites include but are not limited to, sequence AGGGGACTTTCCCA (SEQ ID NO 1) as the binding sites for transcription factor NF-kappa B; sequence TTTGGCGG (SEQ ID NO 2) as the binding sites for transcription factor E2F-1, and the like.
Referring to the flow charts of Figures 1 and 2, in one embodiment of the present invention, genomic sequences of gene regulatory regions are retrieved and are mapped to human genome. Based on the mapped genes, the most 5 prime position of TSS for each gene is identified and the corresponding regulatory region for the gene is identified. DNA sequence information for each retrieved gene regulatory region is screened to identify putative regulatory factor binding sites. The putative regulatory factor binding sites are then profiled. Information retrieved from the database can be utilized for a variety of different purposes and applications including but not limited to, biomedical research, pre-clinical development, drug screening applications, target discovering and target validation, profiling of a regulatory region, building the genome or tissue wide connections between regulatory profilings of different genes, understanding the genome or tissue background of various known transcription profiling understanding the genome or tissue background of various known transcription profiling, and the like.
Referring to Figure 3, probability mapping is applied to the identified binding sites. The probability mapping describes the identification of existences of a specific transcription regulatory factor binding sites, such as all the putative E2F-1 sites, in the regulatory region of all the genes or in the genes that expressed in certain tissue or cell. The probability mapping tells how many genes are possibly transcription-regulated by a specific regulatory factor. It also indicates that how much biological system wide, genome wide, cell wide, or tissue wide, effect a specific regulator factor could have. This information is very useful for bio-medical research based therapeutic method development. In another embodiment of the present invention a full-length gene is mapped for purposes of mapping gene regulatory regions. It will be appreciated that for purposes of this specification, full length extends to the length of the gene. This can cause a slight shift of the genomic position of the transcription start sites of the different versions of the same gene. In one embodiment, all of the available full-length gene is used in a comparison in order to obtain the most 5' TSS. Based on the most 5' TSS, the regulatory regions of genes are defined and the genomic sequences of gene regulatory regions are retrieved. DNA sequence information is screened for each retrieved gene regulatory region to identify putative regulatory factor binding sites. The putative regulatory factor binding sites are mapped to the human genome. Full-length genes are retrieved to provide sequences information for retrieved genes.
The retrieved genes can be mapped to a recently updated human genome using a tool provided by a public available UCSC genome browser databases, self-developed scripts, and the like. In one embodiment, the transcription start site is mapped. In one embodiment, the TSS is mapped by taking the most 5' TSS of each gene after comparing all available TSS's for the gene, illustrated in Figure 2.
A genomic sequence of a regulatory region can be retrieved for each retrieved gene with the most 5' TSS from the most updated human genome. The 5' regulatory region is the sequences upstream of the TSS and downsfream of the TSS. hi various embodiments, the gene regulatory regions include but are not limit to, the core promoter region, the upstream enhancer region, a downstream regulatory region, and the like, as illustrated in Figure 4. The core promoter region can include 200-300 bases upstream and about 50-100 bases downstream of the TSS. Corresponding sequences relative to TSS can be cut and stored. The corresponding sequences relative to TSS can be cut and stored with the use of self-developed scripts from genomic sequences based on a specific release, older, updated and future releases, including but not limited to the UCSC genome browser, NCBI genome database, the Ensembl database, other genomic sequence databases and the like. In one embodiment, the DNA sequence information is screened using a MATCH program that is licensed from TRANSFAC database. The DNA sequence information screening can include selecting the TF matrix, scores of matrix similarity, scores of core similarity, and the like.
Cut-off is applied to reduce the false positive and false negative matching during screening. A genomic or tissue-specific frequency of each binding site and can be determined. The frequency can be the existence of specific TF binding sites in regulatory regions of at least one of, (i) all the genes genome wide, (ii) all the genes specific cell wide, (iii) all the genes specific-tissue wide, (iv) all the genes specific-defined. The frequency can be the existence of specific TF binding sites in regulatory regions of tissue specific genes. Additionally, the frequency can also be considered with a conservation score or an expression level score. By way of illustration, and without limitation, the identified binding sites can be considered differently based on their corresponding conservation score or their corresponding gene expression level. For example, a binding site with higher conservation score or the corresponding gene with higher expression level could play a more significant role than those with lower scores.
The conservation score for each binding site can be created. The conservation score is selected to cover regions where the TF binding sites are identified as well as any other measurements that indicate conservation levels between the two species including but not limited to mouse and human. The position of each binding site can be determined. The position can be based on a human genome working draft. The position is a converted position in a human genome working draft. As more sequence pieces are added, the total length for each chromosome grows. This shifts the position reading for each base on the chromosome. However, the position can be easily converted and the relative position of a regulatory region to the position of the gene remains unchanged. The genome position of a start and end can be determined. A distance of each binding site to the TSS can be determined. The distance is relative to a number of bases between a binding site and the TSS. By way of illustration, and without limitation, in one embodiment the distance is that of the last base between defined binding sites to the base of TSS's 23 base. In this example, there are 23 bases between these two specific bases.
In one embodiment of the present invention, based on the positions of most 5 prime TSSs, the 5 prime regulatory sequences from most updated Human Genome Working Draft are retrieved for all the available genes using self developed computer scripts and programs. These retrieved sequences include but not limited to 250-base 5 prime upstream and 50-base 3 prime downsfream of TSS for each gene.
All the regulatory region sequences can be analyzed using well-characterized transcription factor binding consensus sequence patterns (or, position weighted matrix) created by licensed TRANSFAC databases (TRANSFAC professional 6.3 version, Wingender et al., Nucleic Acids Res. 29, 281). The sites with high score matching with binding matrix will be selected. These sites include their positions in the genome (relative to specific genome assemble version) and their lengths and their synergism information with flanking sites.
All the binding sites result from above are further analyzed by comparing their conservation scores with mouse. The mouse genome and relative conservation information will be retrieved from public available NCBI and UCSC genome databases, and the conservation comparison with human transcription factor binding sites will be done using self-generated scripts and programs.
The resulted transcription factor binding site sequences information from above, include their genomic positions (start, end), length, distant to TSS of each gene, and the flanking regions (include but not limit to 10-base both 5 prime and 3 prime) will be deposited into a database. The related reference links such as gene name, function, annotation, et al are also added.
All the possible transcription decoys can be computational generated based on the database. The decoys can further be experimentally screened by using high-throughput methods, such as oligo-array, capillary-elecfrophoresis, et al for binding efficiency optimization. All the optimized decoy information will be deposited into the database. The partial information in the database can be used in future versions of the database.
Profiles of the regulatory regions of genes include but are not limited to, (i) probability mapping of each regulatory factor binding site, (ii) target genes identification for each known regulatory factor; (iii) statistic analysis of regulatory factor binding profiles of genes identified from various differential expressed genes, and the like.
In one embodiment, a length of each binding site is determined. Sequence information about regions adjacent to the binding site can also be determined. Again by illustration and without limitation, one example is agcgtcagaAGGGGACTTTCCCaagagaggccgaga, (SEQ ID NO 3) with the small case base letters flanking the core binding sites, in upper case.
Co-existence information of other binding' sites can also be ascertained. The transcription machinery usually requires the formation of the complex by several different transcription related proteins and includes the several different DNA binding factors. When the present invention, the binding sites are profiled for a regulatory region of the gene and often more than one binding site is identified from a single region. The number of binding sites can be, by way of example, fifteen to twenty from a single region. The cluster of the binding sites and their positions can be determined. Referring now to Figures 5 and 6, another embodiment of the present invention is a data structure tangibly stored on a computer readable medium that includes a database with the profiled identified binding site information. The database includes a core table with identifiers, binding sites and the like. Binding site information includes but is not limited to, sequence, length, position, direction, frequency, and the like. One supporting table includes TSS position of all genes. A sequence table provides the sequences of regulatory regions of genes. Additional support tables include but are not limited to frequency of TF, target genes of TF for each TF, and the like.
All of the tables are linked by one or more identifiers, hi one embodiment, several instead of one perl CGI script are used to reach and search the database and then display the corresponding information. A web-browser interface is provided.
The database is searchable by a variety of different means, including but not limited to gene identifiers, gene symbol, or self-developed identifiers and the like. Gene identifiers can be selected from the NCBI database, which can be a, Unigene Cluster LD, LoucsLink ID, international approved gene symbols, and the like. hi one embodiment, the database includes genomic frequencies information for TF, and can be sorted by at least a TF name or TF frequencies. The TF frequencies can include genome frequencies and tissue specific frequencies. In one specific example, the database contains the profiles of regulatory factor binding sites for all the known genes (about 15,450 total).
Byway of illustration, and without limitation, one gene (symbol: DLD, dihydrolipoamide dehydrogenase) is used to briefly show how the database is built.
1. Retrieving of full length genes for an example gene DLD to provide sequences information.
As illustrated in Figure 2, three different versions of full-length mRNA sequences can be retrieved from NCBI database (refseq), MGC database (MGC), Japan DBTSS database (DBTSS), and the like. The completely sequences for gene DLD retrieved from refseq database is listed in Figure 7 (SEQ LD NO 59), and the one retrieved from MGC is listed in Figure 8 (SEQ ID NO 60), and the one retrieved from DBTSS is listed in Figure 9 (SEQ ID NO 61).
2. The retrieved genes are mapped to a recently updated human genome.
A self-developed script is used to fetch the above retrieved sequence to UCSC genome browser database to map their genomic position. The retrieved different version of gene DLD are mapped to the recently updated human genome using a tool provided by at least one of public available UCSC genome browser databases.
3. The position of the TSS is mapped.
The mapped positions are retrieved using self-developed script from the above referenced UCSC genome browser database. The summary result of mapping is listed in table 1. For example, the full length gene DLD sequence from NCBI refseq database was mapped to the human genome working draft (released June 2002 by UCSC genome browser) at the chromosome 7 sense strand or positive strand, starting at the chromosome position of 106015510, ending at the chromosome position of 106044308. Table 1: name chromosome strand start end
DLD from refseq 7 + 106015510 106044308
DLD from MGC 7 + 106015541 106044089
DLD from DBTSS 7 + 106015488 106044308
4. The TSS is mapped by making the most 5-prime TSS of each gene after comparing all available TSS'S for the gene.
Referring again to Figure 2, this mapping is facilitated by using self-generated script.
For gene DLD, since it is located on "+" strand of chromosome 7. The start position
106015488 is taken as the most 5' position for TSS of gene DLD.
5. A genomic sequence of a regulatory region for each retrieved gene with the most 5'TSS is retrieved from the most updated human genome.
The 5' regulatory region is the sequences upstream of the TSS and downstream of the TSS. More specifically, for gene DLD, the regulatory region or core promoter region is the sequence includes 200-300 bases upstream and the sequence about 50-100 bases downstream of the TSS. Therefore, the corresponding sequences relative to TSS of gene DLD are cut and stored with the use of self-developed scripts from at least one of the UCSC genome browser or NCBI genome database. The stored sequence for gene DLD is listed in Figure 10 (SEQ ID NO 62).
The stored sequence for regulatory region of gene DLB is screened using a match program.
The MATCH program is the sequence-analyzing tool embedded inside the licensed TRANSFAC database. The analysis is done with the proper setting for both the scores of matrix similarity and scores of core similarity in order to reduce the false positive and false negative matching during screening. The result of the screening for the regulatory region of gene DLD is shown in table 2 where the positions of identified binding sites are listed.
Figure imgf000012_0001
Figure imgf000013_0001
7. A genomic or tissue specific frequency of each binding site is determined.
The frequency is the existence of specific TF binding sites in regulatory regions of all the genes or tissue specific genes. After analysis of the regulatory region of all the genes, the frequency or probability of existence of TF binding sites is easy established. Some of these frequencies information are listed for gene DLD in table 3: Table 3:
Figure imgf000014_0001
8. A conservation score for each binding site is created.
The conservation scores for whole genome comparison between human and mouse are retrieved from UCSC genome browser database. The conservation score is selected to cover regions where the TF binding sites are identified. The conservation scores for the TF binding sites identified in the regulatory region of gene DLD are listed in table 4.
Table 4:
Figure imgf000015_0001
Figure imgf000016_0001
Figure imgf000017_0001
9. A determination is made of the clustering of the binding sites and their positions.
The adjacent or overlapped binding sites are clustered by using self- generated script and the corresponding position and TF are listed in the table 5 for the gene DLD.
Figure imgf000017_0002
Figure imgf000018_0001
10. Binding profiles are collected in the database.
All the binding profiles listed above are been collected in the database. The example list of the entry for gene DLD is shown in Table 6.
Table 6:
Figure imgf000018_0002
Figure imgf000019_0001
11. The database is searchable by gene identifiers.
Figure 11 illustrates a screen shot of a query form that can be used with the database. Figure 12 illustrates a screen shot of a database query result. As illustrated in Figure 13, another embodiment of the present invention is a computer implemented system for displaying the profiled regulatory factor binding sites. The system includes the database, a user interface that includes one or more selectable user inputs, an input device operable by a user, and a display for displaying at least one output in response to the profiled identified binding sites. Examples of outputs include but are not limited to, gene name, identifier, identified
TF binding site, TF names, genomic positions, length, distance, conservation score, binding scores, frequencies information, and binding sites sequences. Examples of inputs includes, the gene identifiers, such as gene symbols, unigene cluster ID, or locuslink ID, and the like. The system also includes a memory, a microprocessor, data files, scripts, supporting available software, including but not limited to MS windows, red hat linux, Apache HTTP sever, Perl compiler program, and the like.
The foregoing description of a preferred embodiment of the invention has been presented for purposes of illustration and description. It is not intended to be exhaustive or to limit the invention to the precise forms disclosed. Obviously, many modifications and variations will be apparent to practitioners skilled in this art. It is intended that the scope of the invention be defined by the following claims and their equivalents.

Claims

What is claimed is:CLAIMS
1. A method for profiling regulatory factor binding sites; locating a complete and most 5' full-length gene for mapping gene regulatory regions; retrieving genomic sequences of regulatory regions of genes; screening DNA sequence information for each retrieved gene regulatory region to identify putative regulatory factor binding sites; and profiling the putative regulatory factor binding sites.
2. The method of claim 1, wherein mapping includes retrieving full-length genes to provide sequences information for retrieved genes.
3. The method of claim 2, wherein mapping includes, mapping the retrieved genes to a recently updated human genome.
4. The method of claim 3, wherein the retrieved genes are mapped to the recently updated human genome using a tool provided by at least one of public available UCSC genome browser databases and self-developed scripts.
5. The method of claim 3, wherein the transcription start site (TSS) is mapped.
6. The method of claim 5, wherein the TSS is mapped by taking the most 5' TSS of each gene after comparing all available TSSs for the gene.
7. The method of claim 1 , wherein a genomic sequence of a regulatory region for each retrieved gene with the most 5' TSS is retrieved from the most updated human genome.
8. The method of claim 7, wherein the 5' regulatory region is the sequences located upstream of the TSS and downstream of the TSS.
9. The method of claim 1 , wherein a retrieved sequence of a gene regulatory region is the core promoter region.
10. The method of claim 9, wherein the core promoter region is includes 200-300 bases upstream and the sequence about 50-100 bases downstream of the TSS.
11. The method of claim 5, wherein a genomic sequence of a gene is the upstream enhancer region.
12. The method of claim 3, wherein a genomic sequence of a gene regulatory region is a downstream regulatory region.
13. The method of claim 7, further comprising: cutting and storing the corresponding sequences relative to TSS.
14. The method of claim 13, wherein the corresponding sequences relative to TSS are cut and stored with the use of self-developed scripts from at least one of the UCSC genome browser or NCBI genome database.
15. The method of claim 1 , wherein the DNA sequence information is screened using a MATCH program or the similar Position Weighted Matrix Programs for motif searching.
16. The method of claim 1, wherein the DNA sequence information screening includes selecting the TF matrix, scores of matrix similarity and scores of core similarity.
17. The method of claim 1, wherein cut-off is applied to reduce the false positive and false negative matching during screening.
18. The method of claim 1 , further comprising: determining at least one of a genomic or tissue-specific frequency of each binding site.
19. The method of claim 1 , wherein the frequency is the existence of specific TF binding sites in regulatory regions of all the genes.
20. The method of claim 1, wherein the frequency is the existence of specific TF binding sites in regulatory regions of tissue specific genes.
21. The method of claim 16, further comprising: creating a conservation score for each binding site.
22. The method of claim 17, wherein the conservation scores are selected to cover regions where the TF binding sites are identified.
23. The method of claim 17, further comprising: determining a position of each binding site.
24. The method of claim 23, wherein the position is based on a human genome working draft.
25. The method of claim 24, wherein the position is a converted position in a human genome working draft.
26. The method of claim 23, wherein the genome position of a start and end is determined.
27. The method. of claim 23, further comprising: detennining a distance of each binding site to the TSS.
28. The method of claim 27, wherein the distance is relative to a number of bases between a binding site and the TSS
29. The method of claim 27, further comprising: determining a length of each binding site.
30. The method of claim 29, further comprising: determining sequence information about regions adjacent to the binding site.
31. The method of claim 30, further comprising: determining co-existence information of other binding sites.
32. The method of claim 31 , further comprising: determining cluster of the binding sites and their positions.
33. The method of claim 1 , further comprising: collecting the binding profiles in a database.
34. The method of claim 33, wherein the database includes TF binding profiles for the regulatory region of each gene.
35. The method of claim 33, wherein the database is searchable by gene identifiers.
36. The method of claim 35, wherein the gene identifiers are selected from the NCBI database.
37. The method of claim 36, wherein the NCBI database includes at least one of Unigene Cluster ID, LoucsLink ID and international approved gene symbols.
38. The method of claim 35, wherein the database includes genomic frequencies information for TF.
39. The database of claim 38, wherein the database ca be sorted by at least one of TF name and TF frequencies
40. The method of claim 39, wherein the TF frequencies include genome frequencies and tissue specific frequencies.
41. The method of claim 33, further comprising: retrieving information from the database for biomedical research.
42. The method of claim 33, further comprising: retrieving information from the database for pre-clinical development.
43. The method of claim 33, further comprising: retrieving information from the database for drug screening applications.
44. The method of claim 33, further comprising: retrieving information from the database for target discovering and target validation.
45. The method of claim 33 , further comprising: retrieving information from the database for profiling of a regulatory region.
46. The method of claim 33, further comprising: retrieving information from the database for building the genome or tissue wide connections between regulatory profilings of different genes.
47. The method of claim 33, further comprising: retrieving information from the database for understanding the genome or tissue background of various known transcription profiling understanding the genome or tissue background of various known transcription profiling.
48. A method for profiling identified binding sites, comprising: providing a database that includes profiled identified binding sites for known genes; and applying probability mapping to the profiled binding sites.
49. The method of claim 48, wherein the database includes TF binding profiles for the regulatory region of each gene.
50. The method of claim 48, wherein the database is searchable by gene identifiers.
51. The method of claim 50, wherein the gene identifiers are selected from the NCBI database.
52. The method of claim 51 , wherein the NCBI database includes at least one of Unigene Cluster ID, LoucsLink ID and international approved gene symbols.
53. The method of claim 51, wherein the database includes genomic frequencies information for vertebrate transcription regulatory factors.
54. The method of claim 53, wherein the database can be sorted by at least one of TF name and TF frequencies
55. The method of claim 54, wherein the TF frequencies include genome frequencies and tissue specific frequencies.
56. The method of claim 48, further comprising: retrieving information from the database for biomedical research.
57. The method of claim 48, further comprising: retrieving information from the database for pre-clinical development.
58. The method of claim 48, further comprising: retrieving information from the database for drug screening applications.
59. The method of claim 48, further comprising: retrieving information from the database for target discovering and target validation.
60. The method of claim 48, further comprising: retrieving information from the database for profiling of a regulatory region.
61. The method of claim 48, further comprising: retrieving information from the database for building the genome or tissue wide connections between regulatory pro filings of different genes.
62. The method of claim 48, further comprising: retrieving information from the database for understanding the genome or tissue background of various known transcription profiling understanding the genome or tissue background of various known transcription profiling.
63. A data structure tangibly stored on a computer readable medium, comprising: a database that includes profiled identified binding sites, the profiled identified binding sites being created by screening DNA sequence information for gene regulatory regions, and wherein the database is searchable by gene identifiers.
64. The data structure of claim 63, wherein the gene identifiers are selected from the NCBI GeneBank identifiers.
65. The method of claim 64, wherein the NCBI database includes at least one of Unigene Cluster ID, LoucsLink LD and international approved gene symbols.
66. The data structure of claim 63, wherein the database includes TF binding profiles for the regulatory region of each gene.
67. The data structure of claim 63, wherein the database includes genomic frequencies information for vertebrate transcription regulatory factors.
68. The database of claim 63, wherein the database can be sorted by at least one of TF name and TF frequencies
69. The data structure of claim 68, wherein the TF frequencies include genome frequencies and tissue specific frequencies.
70. The data structure of claim 63, wherein the database includes information for biomedical research.
71. The data structure of claim 63, wherein the database includes information for pre-clinical development.
72. The data structure of claim 63, wherein the database includes information for drug screening applications.
73. The data structure of claim 63, wherein the database includes information for target discovering and target validation.
74. The data structure of claim 63, wherein the database includes information for profiling of a regulatory region.
75. The data structure of claim 63, wherein the database includes information for building the genome or tissue wide connections between regulatory pro filings of different genes.
76. The data structure of claim 63, wherein the database includes information for understanding the genome or tissue background of various known transcription profiling understanding the genome or tissue background of various known transcription profiling.
77. A computer implemented system for profiling regulatory factor binding sites, comprising: a database that includes profiled identified binding sites, the profiled identified binding sites being created by screening DNA sequence information for gene regulatory regions, and wherein the database is searchable by gene identifiers; a user interface that includes one or more selectable user inputs; a input device operable by a user; and a display for displaying at least one output in response to the profiled identified binding sites.
78. The system of claim 77, wherein the gene identifiers are selected from the NCBI GeneBank identifiers.
79. The system of claim 78, wherein the NCBI database includes at least one of Unigene Cluster LD, LoucsLink ID and international approved gene symbols.
80. The system of claim 77, wherein the database includes TF binding profiles for the regulatory region of each gene.
81. The system of claim 77, wherein the database includes genomic frequencies information for vertebrate transcription regulatory factors.
82. The system of claim 77, wherein the database can be sorted by at least one of TF name and TF frequencies
83. The system of claim 68, wherein the TF frequencies include genome frequencies and tissue specific frequencies.
84. The system of claim 77, wherein the database includes information for biomedical research.
85. The system of claim 77, wherein the database includes information for pre- clinical development.
86. The system of claim 77, wherein the database includes information for drug screening applications.
87. The system of claim 77, wherein the database includes information for target discovering and target validation.
88. The system of claim 77, wherein the database includes information for profiling of a regulatory region.
89. The system of claim 77, wherein the database includes information for building the genome or tissue wide connections between regulatory pro filings of different genes.
90. The system of claim 77, wherein the database includes information for understanding the genome or tissue background of various known transcription profiling understanding the genome or tissue background of various known transcription profiling.
91. The system of claim 77, wherein the at least one output includes at least include one of, a gene name, an identifier, an identified TF binding site, TF names, genomic positions, length, distance, conservation score, binding scores, frequencies information, and binding sites sequences.
92. The system of claim 77, further comprising: a memory; and a microprocessor
PCT/US2004/009201 2003-03-28 2004-03-24 Genomic profiling of regulatory factor binding sites Ceased WO2004087966A2 (en)

Priority Applications (5)

Application Number Priority Date Filing Date Title
EP04758363A EP1608786B1 (en) 2003-03-28 2004-03-24 Genomic profiling of regulatory factor binding sites
AU2004225474A AU2004225474A1 (en) 2003-03-28 2004-03-24 Genomic profiling of regulatory factor binding sites
CA002519674A CA2519674A1 (en) 2003-03-28 2004-03-24 Genomic profiling of regulatory factor binding sites
DE602004018115T DE602004018115D1 (en) 2003-03-28 2004-03-24 CREATING A GENOMIC PROFILE OF REGULATORY FACTOR BINDING STATIONS
MXPA05010276A MXPA05010276A (en) 2003-03-28 2004-03-24 Genomic profiling of regulatory factor binding sites.

Applications Claiming Priority (2)

Application Number Priority Date Filing Date Title
US10/402,689 US20040191781A1 (en) 2003-03-28 2003-03-28 Genomic profiling of regulatory factor binding sites
US10/402,689 2003-03-28

Publications (2)

Publication Number Publication Date
WO2004087966A2 true WO2004087966A2 (en) 2004-10-14
WO2004087966A3 WO2004087966A3 (en) 2004-12-09

Family

ID=32989771

Family Applications (1)

Application Number Title Priority Date Filing Date
PCT/US2004/009201 Ceased WO2004087966A2 (en) 2003-03-28 2004-03-24 Genomic profiling of regulatory factor binding sites

Country Status (12)

Country Link
US (1) US20040191781A1 (en)
EP (1) EP1608786B1 (en)
JP (3) JP2004303201A (en)
KR (1) KR20060015484A (en)
CN (1) CN1784498A (en)
AT (1) ATE416261T1 (en)
AU (1) AU2004225474A1 (en)
CA (1) CA2519674A1 (en)
DE (1) DE602004018115D1 (en)
MX (1) MXPA05010276A (en)
RU (1) RU2005133192A (en)
WO (1) WO2004087966A2 (en)

Families Citing this family (11)

* Cited by examiner, † Cited by third party
Publication number Priority date Publication date Assignee Title
WO2008025093A1 (en) * 2006-09-01 2008-03-06 Innovative Dairy Products Pty Ltd Whole genome based genetic evaluation and selection process
US20090049856A1 (en) * 2007-08-20 2009-02-26 Honeywell International Inc. Working fluid of a blend of 1,1,1,3,3-pentafluoropane, 1,1,1,2,3,3-hexafluoropropane, and 1,1,1,2-tetrafluoroethane and method and apparatus for using
CN101930502B (en) * 2010-09-03 2011-12-21 深圳华大基因科技有限公司 Method and system for detection of phenotype genes and analysis of biological information
EP2643784A4 (en) * 2010-11-25 2017-03-15 Portable Genomics, Inc. Organization, visualization and utilization of genomic data on electronic devices
AU2013274036B2 (en) * 2012-06-14 2017-08-17 Dana-Farber Cancer Institute, Inc. Genome-wide method of assessing interactions between chemical entities and their target molecules
US9989528B2 (en) * 2013-08-28 2018-06-05 Oregon Health & Science University Synthetic olgononucleotides for detection of nucleic acid binding proteins
CN103870719B (en) * 2014-04-09 2017-06-16 苏州大学 A kind of process for recognising human gene promoter and system
CN104156635B (en) * 2014-07-08 2017-07-07 华南师范大学 The OPSM method for digging of the gene chip expression data based on common subsequence
BR112017012087A2 (en) * 2014-12-10 2018-01-16 Koninklijke Philips Nv methods of identifying coding and non-coding genes coexpressed, and system
CN105912886A (en) * 2016-03-29 2016-08-31 上海师范大学 Method of predicting binding site of protein in RNA virus gene
CN118866104B (en) * 2024-09-26 2025-02-25 烟台大学 A method, system, device and storage medium for comparing long genome sequences

Family Cites Families (1)

* Cited by examiner, † Cited by third party
Publication number Priority date Publication date Assignee Title
US6519583B1 (en) * 1997-05-15 2003-02-11 Incyte Pharmaceuticals, Inc. Graphical viewer for biomolecular sequence data

Non-Patent Citations (6)

* Cited by examiner, † Cited by third party
Title
AERTS STEIN ET AL: "Toucan: Deciphering the cis-regulatory logic of coregulated genes." NUCLEIC ACIDS RESEARCH, vol. 31, no. 6, 15 March 2003 (2003-03-15), pages 1753-1764, XP002297446 ISSN: 0305-1048 *
BERMAN BENJAMIN P ET AL: "Exploiting transcription factor binding site clustering to identify cis-regulatory modules involved in pattern formation in the Drosophila genome" PROCEEDINGS OF THE NATIONAL ACADEMY OF SCIENCES OF THE UNITED STATES OF AMERICA, vol. 99, no. 2, 22 January 2002 (2002-01-22), pages 757-762, XP002297448 ISSN: 0027-8424 *
ELKON RAN ET AL: "Genome-wide in silico identification of transcriptional regulators controlling the cell cycle in human cells." GENOME RESEARCH, vol. 13, no. 5, May 2003 (2003-05), pages 773-780, XP002297449 ISSN: 1088-9051 *
LIANG J ET AL: "Computational analysis of microarray gene expression profiles: clustering, classification, and beyond" CHEMOMETRICS AND INTELLIGENT LABORATORY SYSTEMS, ELSEVIER SCIENCE PUBLISHERS B.V. AMSTERDAM, NL, vol. 62, no. 2, 28 May 2002 (2002-05-28), pages 199-216, XP004354187 ISSN: 0169-7439 *
WASSERMAN W W ET AL: "Identification of regulatory regions which confer muscle-specific gene expression" JOURNAL OF MOLECULAR BIOLOGY, LONDON, GB, vol. 278, no. 1, 24 April 1998 (1998-04-24), pages 167-181, XP004453985 ISSN: 0022-2836 *
ZHU ZHOU ET AL: "Computational identification of transcription factor binding sites via a transcription-factor-centric clustering (TFCC) algorithm" JOURNAL OF MOLECULAR BIOLOGY, vol. 318, no. 1, 19 April 2002 (2002-04-19), pages 71-81, XP002297447 ISSN: 0022-2836 *

Also Published As

Publication number Publication date
EP1608786A2 (en) 2005-12-28
EP1608786B1 (en) 2008-12-03
DE602004018115D1 (en) 2009-01-15
CN1784498A (en) 2006-06-07
MXPA05010276A (en) 2006-03-17
ATE416261T1 (en) 2008-12-15
WO2004087966A3 (en) 2004-12-09
JP2006031728A (en) 2006-02-02
KR20060015484A (en) 2006-02-17
CA2519674A1 (en) 2004-10-14
JP2008293505A (en) 2008-12-04
JP2004303201A (en) 2004-10-28
RU2005133192A (en) 2006-02-27
AU2004225474A1 (en) 2004-10-14
US20040191781A1 (en) 2004-09-30

Similar Documents

Publication Publication Date Title
Li et al. A hidden Markov model for analyzing ChIP-chip experiments on genome tiling arrays and its application to p53 binding sequences
Molina et al. Genome wide analysis of Arabidopsis core promoters
Down et al. NestedMICA: sensitive inference of over-represented motifs in nucleic acid sequence
JP2008293505A (en) Genomic profiling of regulatory factor binding sites
Boeva et al. Short fuzzy tandem repeats in genomic sequences, identification, and possible role in regulation of gene expression
Frith et al. Detection of functional DNA motifs via statistical over‐representation
Pavesi et al. Weeder Web: discovery of transcription factor binding sites in a set of sequences from co-regulated genes
Tran et al. A survey of motif finding Web tools for detecting binding site motifs in ChIP-Seq data
Meyers et al. Arabidopsis MPSS. An online resource for quantitative expression analysis
Zambelli et al. Using Weeder, Pscan, and PscanChIP for the discovery of enriched transcription factor binding site motifs in nucleotide sequences
Genovese et al. Dot2dot: accurate whole-genome tandem repeats discovery
Contreras-Moreira et al. FootprintDB: analysis of plant cis-regulatory elements, transcription factors, and binding interfaces
Minniti et al. TFinder: A Python Web Tool for Predicting Transcription Factor Binding Sites
Wei et al. Comparative analysis of regulatory motif discovery tools for transcription factor binding sites
Kankainen et al. MATLIGN: a motif clustering, comparison and matching tool
Washietl Prediction of structural noncoding RNAs with RNAz
Bortoluzzi et al. A multistep bioinformatic approach detects putative regulatory elements in gene promoters
Bülow et al. Bioinformatic identification of conserved cis-sequences in coregulated genes
JP3563315B2 (en) Dendrogram display method and dendrogram display system
Muino et al. PRI-CAT: a web-tool for the analysis, storage and visualization of plant ChIP-seq experiments
Donaldson et al. CoMoDis: composite motif discovery in mammalian genomes
CN120072049B (en) Transcription factor analysis method, apparatus, electronic device and storage medium
Nobuta et al. Methods for analysis of gene expression in plants using MPSS
Mariño-Ramírez et al. Promoter analysis: Gene regulatory motif identification with A-GLAM
Tsou et al. Biological data warehousing system for identifying transcriptional regulatory sites from gene expressions of microarray data

Legal Events

Date Code Title Description
AK Designated states

Kind code of ref document: A2

Designated state(s): AE AG AL AM AT AU AZ BA BB BG BR BW BY BZ CA CH CN CO CR CU CZ DE DK DM DZ EC EE EG ES FI GB GD GE GH GM HR HU ID IL IN IS JP KE KG KP KR KZ LC LK LR LS LT LU LV MA MD MG MK MN MW MX MZ NA NI NO NZ OM PG PH PL PT RO RU SC SD SE SG SK SL SY TJ TM TN TR TT TZ UA UG US UZ VC VN YU ZA ZM ZW

AL Designated countries for regional patents

Kind code of ref document: A2

Designated state(s): BW GH GM KE LS MW MZ SD SL SZ TZ UG ZM ZW AM AZ BY KG KZ MD RU TJ TM AT BE BG CH CY CZ DE DK EE ES FI FR GB GR HU IE IT LU MC NL PL PT RO SE SI SK TR BF BJ CF CG CI CM GA GN GQ GW ML MR NE SN TD TG

121 Ep: the epo has been informed by wipo that ep was designated in this application
WWE Wipo information: entry into national phase

Ref document number: 2004225474

Country of ref document: AU

WWE Wipo information: entry into national phase

Ref document number: 2519674

Country of ref document: CA

WWE Wipo information: entry into national phase

Ref document number: PA/a/2005/010276

Country of ref document: MX

WWE Wipo information: entry into national phase

Ref document number: 1020057018232

Country of ref document: KR

WWE Wipo information: entry into national phase

Ref document number: 2004758363

Country of ref document: EP

ENP Entry into the national phase

Ref document number: 2004225474

Country of ref document: AU

Date of ref document: 20040324

Kind code of ref document: A

WWP Wipo information: published in national office

Ref document number: 2004225474

Country of ref document: AU

WWE Wipo information: entry into national phase

Ref document number: 2005133192

Country of ref document: RU

WWE Wipo information: entry into national phase

Ref document number: 20048126273

Country of ref document: CN

WWP Wipo information: published in national office

Ref document number: 2004758363

Country of ref document: EP

WWP Wipo information: published in national office

Ref document number: 1020057018232

Country of ref document: KR