WO2008013492A1 - Embryonic stem cell markers for cancer diagnosis and prognosis - Google Patents

Embryonic stem cell markers for cancer diagnosis and prognosis Download PDF

Info

Publication number
WO2008013492A1
WO2008013492A1 PCT/SE2007/000689 SE2007000689W WO2008013492A1 WO 2008013492 A1 WO2008013492 A1 WO 2008013492A1 SE 2007000689 W SE2007000689 W SE 2007000689W WO 2008013492 A1 WO2008013492 A1 WO 2008013492A1
Authority
WO
WIPO (PCT)
Prior art keywords
cancer
genes
tumor
expression
group
Prior art date
Legal status (The legal status is an assumption and is not a legal conclusion. Google has not performed a legal analysis and makes no representation as to the accuracy of the status listed.)
Ceased
Application number
PCT/SE2007/000689
Other languages
French (fr)
Inventor
Chunde Li
Current Assignee (The listed assignees may be inaccurate. Google has not performed a legal analysis and makes no representation or warranty as to the accuracy of the list.)
Prostatype Genomics AB
Original Assignee
Chundsell Medicals AB
Priority date (The priority date is an assumption and is not a legal conclusion. Google has not performed a legal analysis and makes no representation as to the accuracy of the date listed.)
Filing date
Publication date
Application filed by Chundsell Medicals AB filed Critical Chundsell Medicals AB
Priority to US12/375,177 priority Critical patent/US20100009858A1/en
Priority to EP07769001A priority patent/EP2052089A4/en
Priority to AU2007277508A priority patent/AU2007277508A1/en
Priority to CA 2659231 priority patent/CA2659231A1/en
Publication of WO2008013492A1 publication Critical patent/WO2008013492A1/en
Priority to IL196774A priority patent/IL196774A0/en
Anticipated expiration legal-status Critical
Ceased legal-status Critical Current

Links

Classifications

    • CCHEMISTRY; METALLURGY
    • C12BIOCHEMISTRY; BEER; SPIRITS; WINE; VINEGAR; MICROBIOLOGY; ENZYMOLOGY; MUTATION OR GENETIC ENGINEERING
    • C12QMEASURING OR TESTING PROCESSES INVOLVING ENZYMES, NUCLEIC ACIDS OR MICROORGANISMS; COMPOSITIONS OR TEST PAPERS THEREFOR; PROCESSES OF PREPARING SUCH COMPOSITIONS; CONDITION-RESPONSIVE CONTROL IN MICROBIOLOGICAL OR ENZYMOLOGICAL PROCESSES
    • C12Q1/00Measuring or testing processes involving enzymes, nucleic acids or microorganisms; Compositions therefor; Processes of preparing such compositions
    • C12Q1/68Measuring or testing processes involving enzymes, nucleic acids or microorganisms; Compositions therefor; Processes of preparing such compositions involving nucleic acids
    • C12Q1/6876Nucleic acid products used in the analysis of nucleic acids, e.g. primers or probes
    • C12Q1/6883Nucleic acid products used in the analysis of nucleic acids, e.g. primers or probes for diseases caused by alterations of genetic material
    • C12Q1/6886Nucleic acid products used in the analysis of nucleic acids, e.g. primers or probes for diseases caused by alterations of genetic material for cancer
    • CCHEMISTRY; METALLURGY
    • C12BIOCHEMISTRY; BEER; SPIRITS; WINE; VINEGAR; MICROBIOLOGY; ENZYMOLOGY; MUTATION OR GENETIC ENGINEERING
    • C12QMEASURING OR TESTING PROCESSES INVOLVING ENZYMES, NUCLEIC ACIDS OR MICROORGANISMS; COMPOSITIONS OR TEST PAPERS THEREFOR; PROCESSES OF PREPARING SUCH COMPOSITIONS; CONDITION-RESPONSIVE CONTROL IN MICROBIOLOGICAL OR ENZYMOLOGICAL PROCESSES
    • C12Q2600/00Oligonucleotides characterized by their use
    • C12Q2600/106Pharmacogenomics, i.e. genetic variability in individual responses to drugs and drug metabolism
    • CCHEMISTRY; METALLURGY
    • C12BIOCHEMISTRY; BEER; SPIRITS; WINE; VINEGAR; MICROBIOLOGY; ENZYMOLOGY; MUTATION OR GENETIC ENGINEERING
    • C12QMEASURING OR TESTING PROCESSES INVOLVING ENZYMES, NUCLEIC ACIDS OR MICROORGANISMS; COMPOSITIONS OR TEST PAPERS THEREFOR; PROCESSES OF PREPARING SUCH COMPOSITIONS; CONDITION-RESPONSIVE CONTROL IN MICROBIOLOGICAL OR ENZYMOLOGICAL PROCESSES
    • C12Q2600/00Oligonucleotides characterized by their use
    • C12Q2600/112Disease subtyping, staging or classification
    • CCHEMISTRY; METALLURGY
    • C12BIOCHEMISTRY; BEER; SPIRITS; WINE; VINEGAR; MICROBIOLOGY; ENZYMOLOGY; MUTATION OR GENETIC ENGINEERING
    • C12QMEASURING OR TESTING PROCESSES INVOLVING ENZYMES, NUCLEIC ACIDS OR MICROORGANISMS; COMPOSITIONS OR TEST PAPERS THEREFOR; PROCESSES OF PREPARING SUCH COMPOSITIONS; CONDITION-RESPONSIVE CONTROL IN MICROBIOLOGICAL OR ENZYMOLOGICAL PROCESSES
    • C12Q2600/00Oligonucleotides characterized by their use
    • C12Q2600/118Prognosis of disease development

Definitions

  • the present invention relates to embryonic stem cell (ES) gene markers for use in diagnosis and prognosis of cancer, in particular prostate cancer.
  • ES embryonic stem cell
  • Bioinformatic analyses based on published or unpublished high throughput proteomic data have not yet reached robust and high resolution as compared with high throughput DNA and RNA analyses.
  • Bioinformatic analyses based on published and unpublished high throughput genome-scale DNA analyses provide a list of DNA markers in the form gene copy number changes (deletions, gains and amplifications), mutations and polymorphisms, and methylations. DNA is comparatively stable and easy to be handled in analytical process. However, these DNA changes have to be detected by different methods. It is still an open question why cancer originating from the same kind of tissue progresses slowly in one person and rapidly in another.
  • Prostate cancer is a major cause of death worldwide in male adults. Accurately predicting the outcome of prostate cancer at an early stage of tumor development is crucial for providing the proper kind of treatment, and is still an unresolved question. The correct choice of treatment is most important in younger patients (11). It is estimated that of 232,090 American men with newly diagnosed prostate cancer in 2005, roughly 210,000 or approximately 90% will be diagnosed at an early stage with 100% survival for 5 years. In contrast, the estimated deaths from prostate cancer are much less, about 30,350 (12). Online data from the Swedish National Board of Health and Welfare have shown that 7,702 out of 4,427,107 Swedish men in 2001 had newly diagnosed prostate cancer.
  • Humphrey PA has given a comprehensive review of Gleason grading and current status of clinical methods in diagnosis and prognosis of prostate cancer (15-16).
  • Gleason score of needle core biopsy is currently the key method for confirming the diagnosis of prostate cancer, and has demonstrated strong association with cancer specific survival.
  • Gleason grading is not satisfactory for predicting cancer outcome when tumors are small, in particular when tumors are moderately differentiated with a biopsy Gleason score 6, the most common Gleason sum in clinical biopsy cases (15).
  • a diagnosis of prostate cancer is uncertain due to insufficient, or lack of, malignant structures, rendering further prediction of cancer outcome impossible (15).
  • genomic changes involved include DNA sequence changes, such as base change, deletion, copy number gain, amplification and translocation, as well as DNA modification such as promoter methylation.
  • DNA sequence changes such as base change, deletion, copy number gain, amplification and translocation
  • DNA modification such as promoter methylation.
  • genomic changes cause gene expression alterations that further cause biological alterations in the cell, such as accelerated cell cycle, alteration of cell-cell contact and signalling, increase of genomic instability, escape from apoptosis, increase of cell mobility, activation of angiogenesis and escape from immune surveillance.
  • a highly relevant problem is how to predict the outcome of a tumor in a patient.
  • Predictive methods available today are based on the concept that all tumor cells in a specific tumor are of the same functional importance. New data has shown that the total tumor cell population can be divided into two populations, i.e., a small tumor stem cell population and a large partially differentiated tumor cell population.
  • Tumor stem cells are malignant cells that can proliferate, invade and metastasize, whereas differentiated tumor cells do not possess these properties.
  • the present invention is based on the concept that a method for predicting the development of cancer should be based on the genetic profile of tumor stem cells, notwithstanding that they do comprise only a small portion of the total tumor cell population.
  • Embryonic stem cell (ES) gene markers of the invention are herein referred to as ES tumor predictor genes (ESTP genes).
  • EST expressed sequence tag
  • the IMAGE clone ID or the UniGene cluster ID is given.
  • the present invention is further based on the concept that embryonic stem cells are the origin of all tissue cells including so called progenitor cells of various specific cell lineages or cell types.
  • Tumor cells may be derived from a few tissue stem cells whose regulatory system to guide time- and space-specific differentiation is disabled due to incorrectly repaired DNA damage. Despite impaired differentiation, other stem cell functional properties are more or less maintained or even enhanced, such as proliferation and metastasis. Thus, the more stem cell properties are conserved in the tumor cells, the more aggressive they will be biologically and clinically.
  • the datasets are derived from gene expression profiling studies in embryonic cell lines and cancers of the prostate, breast, lung, brain, stomach, kidney, ovary and blood.
  • the expression profile of ESTP genes that is, genes strongly regulated in ES tumor cells, allows to predict histological as well as biological subtypes with different clinical outcomes.
  • strongly regulated applies to ESTP genes with a specific high expression level but also to ESTP genes with a specific low expression level.
  • the present invention is additionally based on the hypothesis that strongly regulated ESTP genes in ES tumor cells, play a crucial role in tumor development and that, more specifically, different patterns of expression alterations of these ESTP genes determine tumor aggressiveness. According to the present invention this hypothesis is validated by using a large series of published datasets of genome-wide gene expression profiling in ES cells and in normal and tumor tissues for identifying ES genes of high prognostic power, that is, ESTP genes:
  • arrays can be used to predict pathological and clinical characteristics of a tumor in a patient by applying a simple hierarchical cluster method to a corresponding dataset obtained for the respective tumor.
  • high prognostic accuracy was obtained for all tumor types investigated, in particular prostate cancer but also gastric cancer, lung cancer, and leukaemia.
  • prognostic accuracy was also obtained for breast cancer, ovary cancer, brain tumor, soft tissue tumor, and kidney cander.
  • prognostic analysis is based on the genes with highest and lowest level of expression, that is, genes within ranges of expression which are near or comprise the level of maximal expression and of minimal expression.
  • the present invention provides a prognostic method of predicting tumor pathological and clinical characteristics in a patient based on a restricted number of ES genes, such as less than 2,500 ES genes, more preferred less than 1,000, even more preferred from 500 to 750 ES genes, in particular from 600 to 680 ES genes, most preferred about 641 ES genes.
  • ES genes used for prediction such as about 641 ES genes
  • their specific functionality in stem cell biology allows errors due to biological and methodological background noise to be reduced or even eliminated.
  • Virtual experimental methods based on such a restricted number of ES genes can be used for the diagnosis and prognosis of a broad spectrum of tumors. In contrast methods known in the art usually rely on few markers restricted to different tumor types.
  • ESTP genes of the invention Based on the ESTP genes of the invention, a variety of robust analytical methods can be designed and applied in tumor diagnosis and prognosis using trace amounts of RNA derived from small tumor samples. For most tumors, such as prostate cancer, there is no method known in the art capable of predicting with good accuracy clinical outcome at an early stage of tumor development. It is in particular here that the prognostic method of the invention solves an important clinical problem.
  • a first preferred aspect comprises selecting ES genes of predictive significance, that is, ESTP genes that constitute a minor proportion of all ES genes, in a cancer;
  • genes with weak prediction power are eliminated from the list of ES genes identified by the method of the invention and thus from consideration, thereby reducing the number of ESTP genes and improving prediction accuracy;
  • ESTP genes with high specificity are selected from the ES gene list obtained by the method of the invention for application to a specific type of tumor, such as prostate cancer or breast cancer;
  • a specific type of tumor such as prostate cancer or breast cancer;
  • methods known in the art used in diagnosis and prognosis of tumors are based on one or several ESTP genes identified by the method of the invention, such as multiplex or high throughput RT-PCR (reverse transcriptase polymerase chain reaction) using small amounts of tumor samples, a specific DNA microarray platform, and other low or high throughput RNA analytical methods.
  • FNA biopsy for clinical diagnosis and prognosis allows sampling multiple areas to cover a large volume of a tumor due to its minimal morbidity, thus being superior in overcoming tumor heterogeneity.
  • FNA biopsy is a preferred method for obtaining pure tumor samples for molecular diagnosis and prognosis from small tumors, in particular from early stage prostate tumors.
  • Conventional cDNA array experiments require approximately 40 ⁇ g total RNA.
  • FNA biopsy yields 100-2,000 ng total RNA (57-59). This small amount of RNA is sufficient for analyses by using a small array platform as well as by multiplex or other high throughput RT-PCR methods.
  • a method of predicting the development of a cancer in a patient comprising:
  • a method of predicting the development of a cancer in a patient comprising:
  • genes in the first group and/or the second group are consecutive, that is, ranked consecutively, in respect of their expression levels.
  • the total number of genes in the first and second groups is substantially smaller than the number of the genes in the third group, in particular less than a fifth of the number of the genes in the third group.
  • the total number of genes in the first and second groups is preferably from 500 to 750, more preferred from 600 to 680, most preferred about 641.
  • the genes pertaining to the first and second groups are preferably identified by employing a q value of from 0.01 to 0.1, more preferred of from 0.025 to 0.075, most preferred of about 0.05, in a one class significant analysis of microarrays (SAM) on a centered embryonic stem cell gene dataset by which all genes are ranked according to their expression levels
  • SAM microarrays
  • the method of the invention is applicable to cancer of any kind, in particular to prostate cancer, gastric cancer, lung cancer, and leukaemia.
  • a second preferred aspect of the invention is disclosed the use of an embryonic stem cell gene DNA or RNA microarray for predicting the development of a cancer tumor in a patient.
  • the microarray comprises DNA or RNA of a first group of embryonic stem cell genes with high level of expression in the tumor and of a second group of embryonic stem cell genes with a low level of expression in the tumor but not comprising DNA or RNA, respectively, of embryonic stem cell genes with an intermediate level of expression in the tumor.
  • the genes in the first and second groups to be those ranked according to their expression levels, in particular in a consecutive manner.
  • a preferred method of ranking is a one class significant analysis of microarray s (SAM) on a centered embryonic tumor stem cell gene dataset by employing a q value of from 0.01 to 0.1, more preferred of from 0.025 to 0.075, most preferred of about 0.05.
  • the embryonic stem cell gene DNA or RNA microarray can be used for the predictions of the development of any cancer, in particular of prostate cancer, gastric cancer, lung cancer, and leukaemia and, furthermore, of breast cancer, ovary cancer, brain tumor, soft tissue tumor, and kidney tumour.
  • a microarray comprising a fragment of embryonic stem cell gene DNA or RNA derived from a first group of embryonic stem cell genes with high level of expression in a cancer tumor and from a second group of embryonic stem cell genes with a low level of expression in said cancer tumor but not comprising a fragment of embryonic stem cell gene DNA/RNA with an intermediate level of expression in the tumor. It is particularly preferred for the genes in the first group and/or the second group to be ranked consecutively in respect of their expression levels.
  • the genes in the first and second groups are those ranked according to their expression levels by a one class significant analysis of microarrays (SAM) on a centered embryonic tumor stem cell gene dataset by employing a q value of from 0.01 to 0.1, more preferred of from 0.025 to 0.075, most preferred of about 0.05.
  • the cancer can be any cancer, in particular prostate cancer, gastric cancer, lung cancer, and leukaemia but also breast cancer, ovary cancer, brain tumor, soft tissue tumour, and kidney tumor.
  • a probe comprising any of DNA, DNA fragment, DNA oligomer, DNA primer, RNA, RNA fragment, RNA oligomer of a first group of embryonic stem cell genes with high level of expression in a cancer tumor and of a second group of embryonic stem cell genes with a low level of expression in said cancer tumor but not comprising DNA, DNA fragment, DNA oligomer, DNA primer, RNA, RNA fragment, RNA oligomer, respectively, of embryonic stem cell genes with an intermediate level of expression in said cancer tumor.
  • the genes in the first and second groups are those ranked, preferably consecutively, according to their expression levels by a one class significant analysis of microarrays (SAM) on a centered embryonic tumor stem cell gene dataset by employing a q value of from 0.01 to 0.1, more preferred of from 0.025 to 0.075, most preferred of about 0.05.
  • the cancer can be any cancer, in particular prostate cancer, gastric cancer, lung cancer, and leukaemia but also breast cancer, ovary cancer, brain tumor, soft tissue tumor, and kidney cancer.
  • a fifth preferred aspect of the invention is disclosed the use of a multitude of embryonic stem cell genes in a method of assessing the prognosis of a cancer tumor, wherein said multitude comprises a first group of embryonic stem cell genes with high level of expression in the tumor and of a second group of embryonic stem cell genes with a low level of expression in the tumor but does not comprise embryonic stem cell genes with an intermediate level of expression. It is preferred for the genes in the first and second groups to be ranked consecutively according to their expression levels and to constitute a fraction of the embryonic stem cell genes expressed in the tumor, in particular a fraction of 20 per cent or less of the embryonic stem cell genes expressed in the tumor.
  • SAM microarrays
  • the use relates to any type of cancer, preferably prostate cancer, gastric cancer, lung cancer, and leukaemia but also breast cancer, ovary cancer, brain tumor, soft tissue tumor, and kidney cancer.
  • the ESTP genes in the first group and the second group can be for analysis of clinical tumor tissue biopsies or tumor cell aspirate samples using high throughput DNA microarrays for clinical diagnosis and prognosis.
  • a gene microarray for probing the 641 or, less preferred, the aforementioned 1,000 or from 500 to 750 or, in particular, from 600 to 680 ESTP genes by spotting a DNA fragment (PCR products or oligos) of each of them on a glass or other suitable support.
  • RNA isolated from tumor tissue biopsies or tumor cell aspirates can be labelled and hybridized with the ESTP gene microarray.
  • the expression changes of all the 641 ES genes can be determined and compared with a group of standard reference cases with well defined data of clinical parameters such as histology, pathology and outcomes. The clinical outcomes of the new cases can thus be predicted.
  • a second preferred use relies on a gene solution array, for instance one based on the xMAP technology (http://www.luminexcorp.com).
  • Probes that specifically bind to RNA of the ESTP genes can be designed, synthesized and immobilized on the surface of of a microsphere or microbead support. RNA isolated from clinical tumor tissue biopsies or tumor cell aspirates can be bound to the support. Upon illuminating the beads/spheres with light of varying wavelength under laser beam activation the expression levels of the various ESTP genes in the tumor samples can be simultaneously and accurately measured. This method is simple, sensitive, and accurate and of high throughput; the expression levels of up to 100 genes can be in one experiment.
  • a third preferred use comprises the design of probes for assembling an ESTP gene microarray or chip of any kinds, for the purpose of application in clinical diagnosis and prognosis of common cancers.
  • high throughput PT-PCR can be used for analysis of clinical tumor tissue biopsies or tumor cell aspirate samples.
  • design primers for each gene can be designed to carry out multiplex RT-PCR for determining the expression level of each gene in a tumor tissue or aspirate sample. Since the common RT-PCR platform can analyze 96 or multiple sets of 96 samples simultaneously, a small number of multiplex RT-PCR suffice to achieve high throughput measurement of the expression levels of the most preferred 641 ESTP genes or the less preferred 1000 or from 500 to 750 or, in particular, from 600 to 680 ESTP genes in a large set of clinical tumor tissue biopsies or aspirates.
  • clinical tumor tissue biopsy samples and tumor cell aspirate samples can be analyzed using high throughput protein/antibody microarrays or an ELISA method.
  • the protein sequence or a portion thereof can be retrieved from publicly available human genome sequence resources and used to produce specific monoclonal antibodies for targeting the proteins encoded by the respective ESTP genes.
  • the specific antibodies can be assembled into an ES protein array or incorporated into a high throughput ELISA system to measure the protein expression levels of the most preferred 641 ESTP genes and the less preferred 1000 or from 500 to 750 or, in particular, from 600 to 680 ESTP genes in clinical tumor tissue biopsies and tumor cell aspirates.
  • Fig. 1 is a graph illustrating the identification of ES predictor genes by a one-class SAM ranking test
  • Fig. 2 is a gene expression profile obtained from biopsies of healthy and cancerous prostate tissue, and from embryonic stem cell lines, with a hierarchial clustering of the biopsies;
  • Fig. 3 is a gene expression profile obtained from biopsies of healthy and cancerous lung tissue biopsies, and from embryonic stem cell lines, with a hierarchial clustering of the biopsies;
  • Fig. 4 is a graph illustrating survival for the patients related to major cancerous lung tissue clusters of Fig. 3;
  • Fig. 5 is a gene expression profile obtained from biopsies of healthy and cancerous stomach tissue biopsies, and from embryonic stem cell lines, with a hierarchial clustering of the biopsies;
  • Fig. 6 is a graph illustrating survival for the patients related to major cancerous gastric tissue clusters of Fig. 5;
  • Fig. 7 is a gene expression profile obtained from leukocytes of acute myeloid leukaemia patients, and from embryonic stem cell lines, with a hierarchial clustering of the leukocyte samples;
  • Fig. 8 is a graph illustrating survival for the patients pertaining to the major acute myeloid leukaemia subtype clusters of Fig. 7.
  • the method of the invention is based on published gene data such as the data sets published and deposited in the Stanford Microarray Database (SMD) (http://genome-www5.stanford.edu/). All array experiments used the same two-dye cDNA array platform with a common RNA reference, which enables reliable combination of or comparison with data from different experiments.
  • SMD Stanford Microarray Database
  • All array experiments used the same two-dye cDNA array platform with a common RNA reference, which enables reliable combination of or comparison with data from different experiments.
  • These datasets include genome- wide expression data for embryonic stem cells (60), normal tissues from most of the human organs (61), and tumors from the prostate (62), breast, lung (63), stomach (64), liver (65), blood (66), brain (67), kidney (68), soft tissue (69), ovary (70; 71) and pancreas (72). In total about 1000 arrays were included in the analysis.
  • Each array (tissue) in these datasets is denoted with corresponding basic clinical
  • Data Collapse /Retrieval Raw data are retrieved and averaged by SUID; UID column contains NAME; Retrieved Log(base2) of R/G Normalized Ratio (Mean).
  • Data filtering options Selected Data Filters: Spot is not flagged by experimenter.
  • Data filters for GENEPIX result sets: Channel 1 Mean Intensity / Median Background Intensity > 1.5 AND Channel 2 Normalized (Mean Intensity / Median Background Intensity) > 1.5.
  • the ES cell data set was combined with each of a number of other data sets. Genes and array batches were centered separately in each combined dataset as previously described (61 ; 62).
  • ES predictor genes After centering a data set containing ES cells and normal tissues from most human organs, the ES data set was separated from the normal tissue data set. A one-class SAM (significant analysis of microarrays) was carried out using the centered ES dataset, by which all genes were ranked according to their expression levels in the ES cells (73). Using a q value equal to or less than 0.05 as cut-off, top 328 genes with highest level and top 313 genes with lowest level of expression in the ES cells were identified (Table 1). These 641 ES genes are named ES tumor predictor genes (ESTP genes).
  • ESTP genes ES tumor predictor genes
  • Prediction of clinical and pathological tumor types After centering each combined data set, a sub-dataset containing only the 641 ESTP genes was isolated from the original dataset. A simple hierarchical clustering was carried out based on this sub-dataset using genes with 70% qualified data in all samples (78). The sample grouping was directly correlated with the clinical and pathological information of each individual tissue sample. Prediction examples for a number of tumor types are given below. Prediction in other datasets is carried out in essentially the same manner. In the one class SAM analysis, numbers of genes selected is in correlation with q value. There were 201 genes selected when q value at 0.01, 641 genes selected when q value at 0.05, and 1368 genes selected when q value at 0.1.
  • an increased q value would result in increased number of selected genes as well as increased number of genes that would not be associated with the transcriptional regulation in the ES cells.
  • the 641 genes selected by q value at 0.05 had best classification (prediction) results, as shown in the prostate cancer (Table 2) and lung cancer (Table 3) materials. The difference was particularly obvious in respect of lung cancer (Table 3).
  • the 641 genes selected by q value at 0.05 was the best choice of gene selection when both stem cell association and tumor classification are taken into consideration.
  • the ESTP genes were derived from the ES cell dataset. The power of this set of genes in the classification of a broad spectrum of tumors was then validated in each independent tumor dataset.
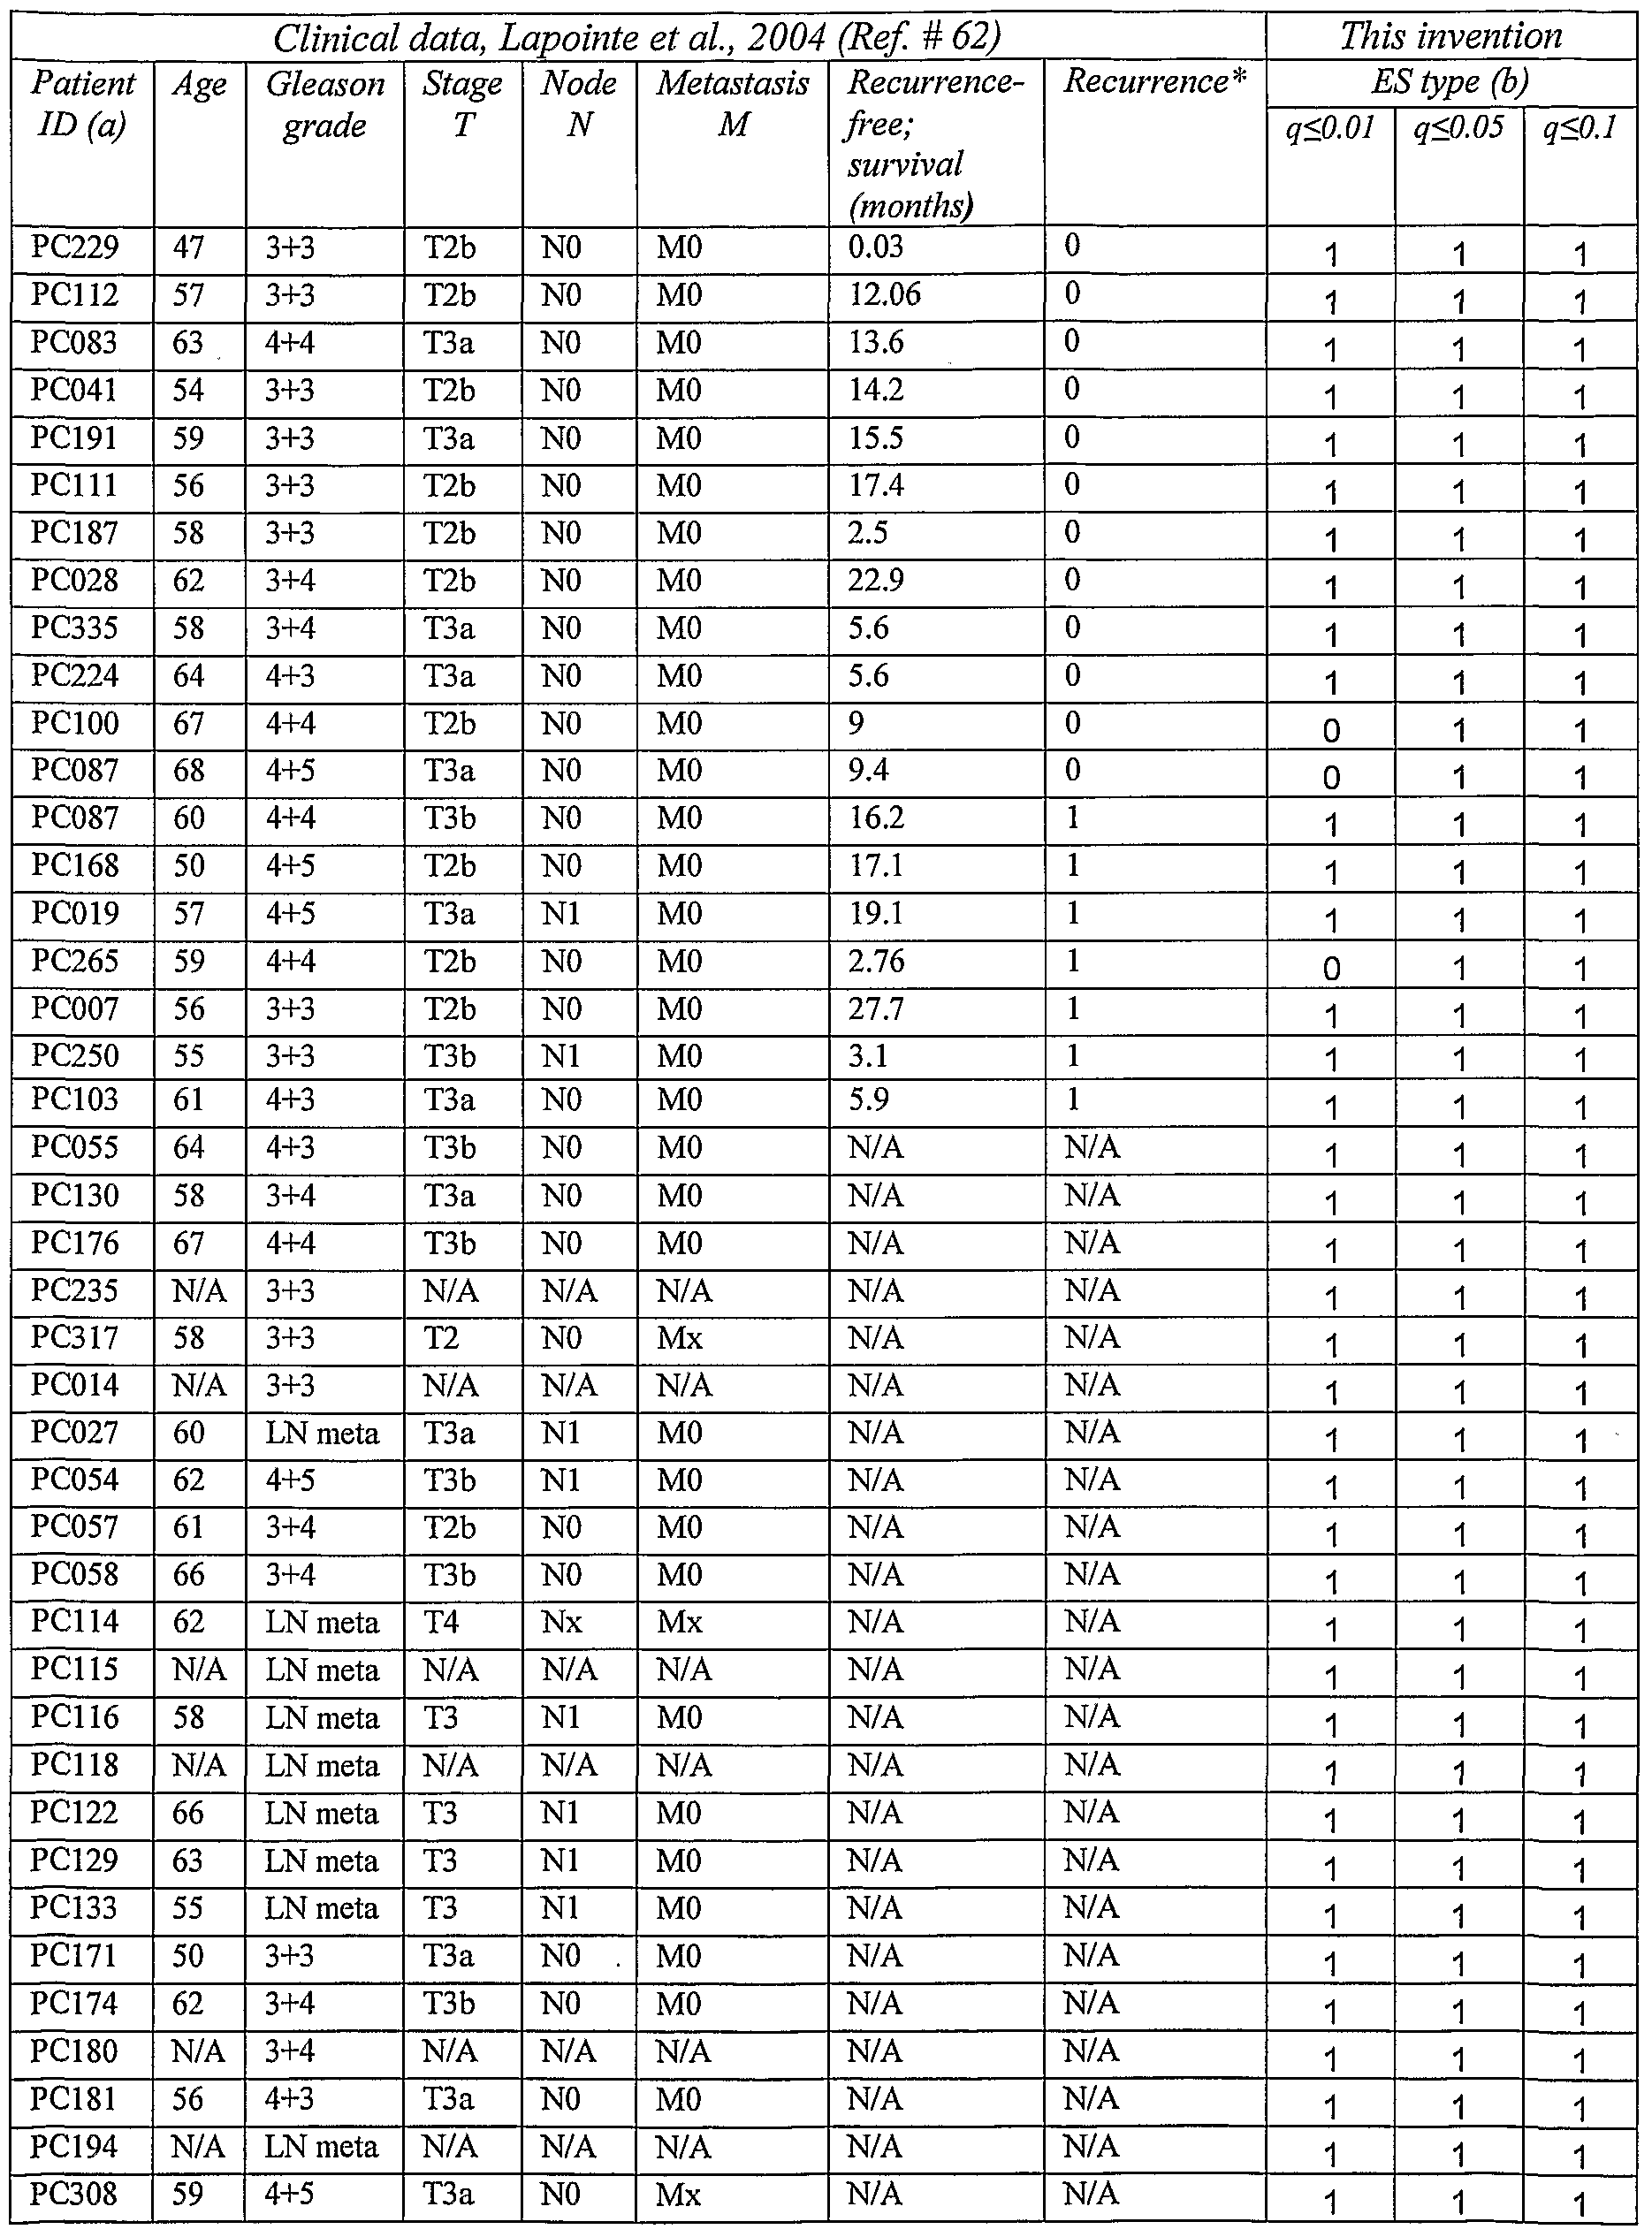
  • Prostate cancer Published clinical data and predicted tumor subtype by ESTP genes of the invention for prostate cancer are listed in Table 2: Gleason grade, stage, biological subtype and short term recurrence (prostate specific antigen (PSA) survival) after radical surgery. Of the 641 ESTP genes, 505 had good data in 70% of all samples. In the gene expression profile of Fig. 2, the expression level (range in log ratio between -5.06 and 6.15) was transformed into a transitional color presentation, with red indicating above 0, black equal to 0 and green for less than 0; in Fig. 2 and the other figures illustrating gene expression profiles the colors are rendered in white, black, and grey (see, DESCRIPTION OF THE FIGURES).
  • Prediction value for choice of treatment Patients with a tumor predicted to be of a recurrent type (pertaining to the recurrent group) should be treated by radical surgery at a very early stage even in case of a moderate or low Gleason score. Patients with a very early stage tumor predicted to be of a non-recurrent type (pertaining to the non-recurrent group) should be kept under regular PSA and other examination control, because most of the tumors in this group are in fact indolent or very slow-progressive.
  • Lung cancer Lung cancer. Published clinical data and predicted tumor subtype by ESTP genes of the invention are shown in Table 3. Prediction of histological type and survival in lung cancer is illustrated in Fig. 3, tissue clustering by ESTP genes. Of the 641 ES predictor genes, 316 had qualified data in 70% or more of the samples.
  • Lung cancer tissue samples were predictively sorted into two major groups, an adenocarcinoma group (a) that mainly contained adenocarcinomas, some normal lung tissues, ES cells and a few non- adenocarcinomas, and a (b) non-adenocarcinoma group that contained most non- adenocarcinomas including squamous cell carcinoma, large cell lung cancer and small cell lung cancer, together with a fraction of adenocarcinomas.
  • adenocarcinoma has a better prognosis than other types of lung cancer. Survival analysis based on lung adenocarcinoma subtypes is illustrated in Fig. 4.
  • adenocarcinoma cases in the non-adenocarcinoma group (b) further showed shorter survival than adenocarcinoma cases in the adenocarcinoma group (a) as shown in Fig. 3, adenocarcinoma subtypes by ES predictor genes associated with survival.
  • tumors predicted to pertain to the adenocarcinoma group seem to have a generally favorable outcome after radical surgery at a very early stage; whereas tumors in the non-adenocarcinoma group may respond relatively better to chemotherapy such as to Iressa or radiation.
  • Gastric cancer Gastric cancer. Published clinical data and tumor subtype predicted by ESTP genes of the invention are illustrated in Table 4. The prediction of histological types and survival in gastric cancer is illustrated in Figure 5: (a) tissue clustering by ES predictor genes; (b) issue subtypes by ES predictor genes associated with survival.
  • Prediction of subtypes of gastric cancer by ESTP genes of the 641 ESTP genes 613 had qualified data in 70% of all samples.
  • Gastric tumors were classified into two major subtypes, type 1 enriched in tumors with diffuse and mix histological types generally with poor prognosis, type 0 together with most normal gastric tissue samples.
  • the survival time for gastric cancer patients pertaining to these groups is compared in Fig. 6.
  • the subtype 0 tumors can be further divided into two sub-subtypes, one with the A subtype enriched in EB virus positive tumors, the other not.
  • Predictive value a) EBV infection is linked to gastric cancer via stem cell biology.
  • Preventing an EBV infection by vaccination may have preventive effect on gastric cancer; b) Diffused type of gastric cancer has very strong hereditary tendency.
  • Fig. 7 illustrates the prediction of subtypes of acute mononucleocyte leukemia associated with chromosome aberration and survival: (a) classification by ESTP genes; (b) AML subtypes associated with survival. Prediction of acute myeloid leukemia (AML) by ESTP genes: of the 641 ES predictor genes, 324 had qualified data in 70% of all samples.
  • AML acute myeloid leukemia
  • AML cases were classified into two major subtypes, type 1 enriched in cases with t(8;21) and del7q chromosomal aberrations, and type 0, which was further divided into two sub-subtypes A and B the first with a subtype enriched with inv(16), the second enriched with t(15;17).
  • Type 1 cases showed shorter overall survival than type 0 as presented in Figure 8. Survival analysis was based on AML subtypes predicted in Fig. 4a and the published clinical data in Table 5.
  • Predictive value for treatment choices AML with different chromosomal aberrations responds to different chemotherapies; in particular all-trans retinoic acid can induce differentiation of AML with t(l 5; 17) translocation. It is suggested that AML in the group enriched with t(15;17) but without the translocation detected by cytogenetic diagnostic method may show good response to all-trans retinoic acid due to the same stem cell biological alteration.
  • ES typing according to the present invention is significantly better than conventional histological grading in the prognosis of lung adenocarcinoma.
  • cases # 222-97 and # 226-97 were of grade 3 that would be poorly differentiated with poor outcome according to conventional clinical prognostic methods.
  • the cases are classified as being of ES type 0 that would have a relatively good outcome.
  • the patients were recurrence-free more than 48 months after radical surgery.
  • ES typing by the method of the invention is more accurate than by conventional histological grading.
  • FIG. 1 Identification of ESTP genes by a one-class SAM ranking test. There were 24361 genes with qualified expression data in 75% of the 6 embryonic stem (ES) cell lines. These 24361 genes were ranked according to their homogenous expression levels in the ES cells by a one-class SAM (significant analysis of microarrays) method as shown in this figure. At delta 0.23, q value ⁇ 0.05, 328 genes with highest expression levels and 313 genes with lowest expression levels were identified. The expression changes of these 641 genes in different tumor samples showed also strongest classification power as compared to genes located within the cut-off lines.
  • ES embryonic stem
  • the expression level (range in log ratio between -5.06 and 6.15) was transformed into a transitional gray-black scale presentation, with black indicating above 1, median gray indicate equal to 1 and green for less than 1.
  • all samples were classified by hierarchical clustering into distinct groups as normal prostate, prostate cancer aggressive group type 1 that contained all cases with recurrence, prostate cancer non-aggressive group type 0 that contained only cases without recurrence.
  • a healthy tissue sample was provided from an unaffected prostate area.
  • These normal samples formed the "normal” cluster in Fig. 1.
  • ES embryonic stem
  • EC embryonic carcinoma
  • patients whose tumor is predicted in the aggressive group type 1 should be treated by radical surgery at very early stage even if the tumor Gleason score is not high; whereas patients whose tumor is predicted in the non-aggressive group type 0 should be under regular PSA and other examination control if the tumor is at very early stage, because most of the tumors in this group are in fact indolent or progress very slowly.
  • FIG. 3 Prediction of lung cancer tissue type. Of the 641 ESTP genes, 316 had qualified data in 70% or more of the samples. Lung cancer tissue samples were predicted into two major groups, adenocarcinoma group type 0 that mainly contained adenocarcinomas, some normal lung tissues, ES cells and a few non-adenocarcinomas, and non-adenocarcinoma group type 1 that contained most non-adenocarcinomas including squamous cell carcinoma, large cell lung cancer and small cell lung cancer, together with a fraction of adenocarcinomas. In general, adenocarcinoma has relatively better prognosis than other types of lung cancer.
  • the adenocarcinoma cases in the non- adenocarcinoma group type 1 further showed shorter survival than adenocarcinoma cases in the adenocarcinoma group type 0 as shown in Fig. 4.
  • ES embryonic stem
  • EC embryonic carcinoma
  • FIG. 5 Prediction of subtypes of gastric cancer by ESTP genes. Of the 641 ESTP genes, 613 had qualified measuring in 70% of all samples. Gastric tumors were classified into two major subtypes, type 1 enriched with diffuse type and mix type tumors generally with poor prognosis, type 0 together with most normal gastric tissue samples. Type 0 tumors was further divided into two subtypes with the a subtype enriched with tumors with EB virus-positive. One tumor sample was provided from each gastric cancer patient. From some of the patients also a normal sample was taken from an unaffected stomach area. These "normal" samples formed the normal cluster in Fig. 5. There were 6 embryonic stem (ES) cell lines from non-prostate cancer subjects. In addition 10 embryonic carcinoma (EC) cell lines from patients with embryonic carcinoma were also included. These ES and EC cell lines were used as reference to indicate different patterns of gene expression.
  • ES embryonic stem
  • EC embryonic carcinoma
  • EBV infection is linked to gastric cancer via stem cell biology. Preventing EBV infection by vaccination may have preventing effect on gastric cancer; b) diffused type of gastric cancer has a very strong hereditary tendency.
  • FIG. 6 Gastric cancer survival analysis. The analysis was based on gastric cancer subtypes predicted in Fig. 5 and on the published clinical data reproduced in Table 4. Time unit: months.
  • FIG. 7 Prediction of acute myeloid leukemia (AML) by ESTP genes.
  • AML cases were classified into two major subtypes, type 1 enriched in cases with t(8;21) and del7q chromosomal aberrations, type 0 that was further divided into two subtypes a and b with a subtype enriched inv(16) and b subtype enriched with t(15;17).
  • Type 1 cases showed shorter overall survival than type 0 as presented in Fig. 5. From each patient one leukocyte sample was harvested. There were 6 embryonic stem (ES) cell lines from non-prostate cancer subjects.
  • ES embryonic stem
  • embryonic carcinoma (EC) cell lines from patients with embryonic carcinoma were also included. These ES and EC cell lines were used as reference to indicate different patterns of gene expression. Importance of the prediction for treatment choices: AML with different chromosomal aberrations respond to different chemotherapies, in particular all-trans retinoic acid can induce differentiation of AML with t(15;17) translocation. It is highly possible that AML in the group enriched with t(15;17) but without the translocation detected by cytogenetic diagnostic method can show good response to all-trans retinoic acid due to the same stem cell biological alteration.
  • Figure 8 Leukemia survival analysis. The analysis was based on AML subtypes predicted in Fig. 7 and on the published clinical data reproduced in Table 5. Time unit: months.
  • van de Vijver MJ et al. A gene-expression signature as a predictor of survival in breast cancer. N Engl J Med, 2002; 347(25): 1999-2009. 6. van 't Veer LJ et al., Gene expression profiling predicts clinical outcome of breast cancer. Nature, 2002; 415(6871): 530-536.
  • Johansson JE et al. Natural history of early, localized prostate cancer. Jama, 2004; 291(22): 2713-2719.
  • Partin AW et al. Combination of prostate-specific antigen, clinical stage, and Gleason score to predict pathological stage of localized prostate cancer. A multi-institutional update. Jama, 1997; 277(18): 1445-1451. 18. Partin AW et al, The use of prostate specific antigen, clinical stage and
  • Chetcuti A et al. Identification of differentially expressed genes in organ- confined prostate cancer by gene expression array. Prostate, 2001; 47(2): 132- 140.
  • LN meta lymph node metastasis.
  • N/A non available.
  • Table 3 presents clinical data from lung adenocarcinoma cases only.
  • cases with non-adenocarcinoma are included, comprising large cell lung cancer, small cell lung cancer, and squamous cell lung cancer.
  • the non-adenocarcinoma cases were analyzed by gene expression profiling in the original publication but lacked clinical follow-up data.
  • (b) By choosing different q value cut-off at 0.01, 0.05 and 0.1, 201, 641, and 1386, respectively, significant ES genes were selected. Using the expression profile of the corresponding gene lists for tumor aggressiveness prediction provided slightly different results as shown Table 3. The q ⁇ 0.05 gene list gave the best prediction.
  • the ES type was determined by using the gene list of 641 ES predictor genes selected at q ⁇ 0.05 in the one-class SAM.
  • the ES type was determined by using the gene list of 641 ES predictor genes selected at q ⁇ 0.05 in the one-class SAM.
  • RNASEL ribonuclease L (2',5'-oligoisoadenylate synthetase-dependent)/hereditary prostate
  • AML acute myeloid leukemia AML acute myeloid leukemia
  • AML acute myeloid leukemia AML acute myeloid leukemia.

Landscapes

  • Chemical & Material Sciences (AREA)
  • Life Sciences & Earth Sciences (AREA)
  • Health & Medical Sciences (AREA)
  • Organic Chemistry (AREA)
  • Proteomics, Peptides & Aminoacids (AREA)
  • Engineering & Computer Science (AREA)
  • Immunology (AREA)
  • Pathology (AREA)
  • Analytical Chemistry (AREA)
  • Zoology (AREA)
  • Genetics & Genomics (AREA)
  • Wood Science & Technology (AREA)
  • Physics & Mathematics (AREA)
  • Biotechnology (AREA)
  • Microbiology (AREA)
  • Molecular Biology (AREA)
  • Hospice & Palliative Care (AREA)
  • Biophysics (AREA)
  • Oncology (AREA)
  • Biochemistry (AREA)
  • Bioinformatics & Cheminformatics (AREA)
  • General Engineering & Computer Science (AREA)
  • General Health & Medical Sciences (AREA)
  • Measuring Or Testing Involving Enzymes Or Micro-Organisms (AREA)

Abstract

A method of predicting the development of a cancer in a patient, comprises procuring a sample of tumour tissue from the patient, determining the expression pattern of embryonic stem cell genes in the tissue, comparing the expression pattern with the corresponding expression pattern of embryonic stem cell genes in tumour tissue of reference patients with known disease histories. Also disclosed are microarrays and DNA/RNA probes for use in the method.

Description

EMBRYONIC STEM CELL MARKERS FOR CANCER DIAGNOSIS AND PROGNOSIS
FIELD OF THE INVENTION
The present invention relates to embryonic stem cell (ES) gene markers for use in diagnosis and prognosis of cancer, in particular prostate cancer.
BACKGROUND OF THE INVENTION
Gene expression profiling in cancer cells of various kind as well as in embryonic stem (ES) cells using high throughput DNA microarrays is known in the art. A direct link between tumor and ES cell expression signatures has however not been established.
Bioinformatic analyses based on published or unpublished high throughput proteomic data have not yet reached robust and high resolution as compared with high throughput DNA and RNA analyses. Bioinformatic analyses based on published and unpublished high throughput genome-scale DNA analyses provide a list of DNA markers in the form gene copy number changes (deletions, gains and amplifications), mutations and polymorphisms, and methylations. DNA is comparatively stable and easy to be handled in analytical process. However, these DNA changes have to be detected by different methods. It is still an open question why cancer originating from the same kind of tissue progresses slowly in one person and rapidly in another. Recent expression profiling analyses have provided quite complete and specific molecular portraits of many cancers, especially of subtypes of a particular cancer differing in clinical outcome (1-4). Some studies even provided short lists of genes, the expression of which is predictive of the outcome of the respective cancer (5-6). These expression profiling results have led to further functional studies of selected markers or genes (7). However, in general, the selection of "important" genes is based on a pure statistical approach (8-9). Despite many new theories and methods trying to coup with the challenge of huge amounts of data-provided by high throughput experiments, the statistics in this field is still very much under development. Most studies therefore turn into a lottery from a list of "markers", and their result is largely confined to a molecular phenotypic level (10). Prostate cancer is a major cause of death worldwide in male adults. Accurately predicting the outcome of prostate cancer at an early stage of tumor development is crucial for providing the proper kind of treatment, and is still an unresolved question. The correct choice of treatment is most important in younger patients (11). It is estimated that of 232,090 American men with newly diagnosed prostate cancer in 2005, roughly 210,000 or approximately 90% will be diagnosed at an early stage with 100% survival for 5 years. In contrast, the estimated deaths from prostate cancer are much less, about 30,350 (12). Online data from the Swedish National Board of Health and Welfare have shown that 7,702 out of 4,427,107 Swedish men in 2001 had newly diagnosed prostate cancer. In a randomized clinical observation of 348 patients with early stage and well to moderately- well differentiated prostate cancer, 108 (31%) showed local progression, 54 (15.5%) had distant metastases and only 31 (8.9%) had deceased from prostate cancer after 8 years follow-up (13). Some early stage prostate cancers can be indolent during 8 years of follow-up and display accelerated progression later after a follow-up of more than 15 years. However, these late-progressive tumors only constitute up to 17% of all early stage cases (14). Current clinical diagnostic and prognostic methods can not accurately distinguish this small group of early stage cancer with aggressive potential from the more common less-aggressive early stage tumors (15).
Humphrey PA has given a comprehensive review of Gleason grading and current status of clinical methods in diagnosis and prognosis of prostate cancer (15-16).
Today, the Partin Table is the most widely used method for choosing proper treatment (17- 18) integrating important clinical parameters to predict the pathological stage. Important parameters are Gleason score of needle core biopsy, serum PSA level and clinical stage. Of all parameters, cytological grade or Gleason grading of biopsy samples is currently the key method for confirming the diagnosis of prostate cancer, and has demonstrated strong association with cancer specific survival. However, Gleason grading is not satisfactory for predicting cancer outcome when tumors are small, in particular when tumors are moderately differentiated with a biopsy Gleason score 6, the most common Gleason sum in clinical biopsy cases (15). Quite often, a diagnosis of prostate cancer is uncertain due to insufficient, or lack of, malignant structures, rendering further prediction of cancer outcome impossible (15). Waiting time for capturing confirmative malignant structure by repeated biopsy procedures may miss the right time window to cure patients with life-threatening cancer at very early stage. On the other hand, uncertain outcome prediction causes reduction of life quality in patients with virtually harmless cancer when they are treated with radical surgery. There is currently a strong need for a new diagnostic and prognostic method that can complement and improve Gleason grading system in three aspects (19): firstly, it should directly reflect biological aggressiveness, i.e. be able to predict different outcome of tumors with the same Gleason grade, in particular tumors with Gleason score 6; secondly, it should apply to small biopsy samples; thirdly, it should be able to predict tumor aggressiveness using biopsy samples from cancerous prostate with insufficient malignant structure, overcoming problems with small tumors and heterogeneous tumors that limit the accuracy of histopathological evaluation of biopsy samples.
An abundance of experimental data shows that cancer is caused by genomic alterations. Weinberg RA and associates as well as Vogelstein S and associates reviewed these data and developed them into generally accepted theories of the molecular genetics and biology of cancer (20-26). Briefly, the genomic changes involved include DNA sequence changes, such as base change, deletion, copy number gain, amplification and translocation, as well as DNA modification such as promoter methylation. These genomic changes cause gene expression alterations that further cause biological alterations in the cell, such as accelerated cell cycle, alteration of cell-cell contact and signalling, increase of genomic instability, escape from apoptosis, increase of cell mobility, activation of angiogenesis and escape from immune surveillance. It has been shown that five to six genomic alterations are needed to establish a malignant phenotype of invasion and metastasis, meaning that multiple biological functional alterations are required. Different initial and subsequent key genomic events may determine different potential of invasion and metastasis, a basis for using molecular genetic markers to predict clinical outcome of cancer (20-26). So far, only a few genetic or epigenetic alterations have been identified in prostate cancer at individual gene level, such as germline mutations of RNASEL (HPCl) and ELAC2 (HPC2) in patients with hereditary prostate cancer, somatic mutations of PTEN, EPHB2 and AR in sporadic prostate cancer, and promoter methylation of GSTPl in prostate cancer tissues (27-34). Nelson WG, De Mazo A and Isaacs WB have concisely reviewed the current status of prostate cancer molecular genetic and biological studies (11; 35-36). Tricoli JV and associates have summarized all putative diagnostic and prognostic markers of prostate cancer (19). An important question remains: no single molecular biomarker has turned out to be superior to the Gleason grading system. This is due to the fact that Gleason grading is a morphological profiling indirectly reflecting most important biological alterations, whereas a single biomarker may merely reflect alterations of one or two biological pathways in cancer cells. The broad spectrum of tumor genotype alterations and phenotype variations has hindered successful translation of findings from most single marker analysis into useful clinical markers for predicting disease outcome.
In contrast, high throughput methods such as DNA arrays allow profiling of molecular signatures indicating alterations of multiple cellular processes (37). There is an increasing body of studies of using gene expression profiling to extract specific expression patterns or signatures attributed to different biological forms of cancer, and further using these gene expression features to predict clinical outcome of early stage cancer, e.g. breast cancer (5; 6). There are also several publications on gene expression profiling of human prostate cancer (1; 7; 38-54). Their quality differs by array complexity, number of cases and tissue samples studied, but they share two limitations: (i) they used a small number of cases selected by surgery with short time follow-up; (ii) antibody availability limited the use of immunohistochemistry to verify clinical importance of most new genes in a large series of tissue arrays. Proteins as markers do not always reflect RNA alterations.
Despite these disadvantages, previous studies have identified several new markers that are potentially useful in clinics, such as AMACR in distinguishing cancer from non-cancer lesions, HPN, PIMl and EZH2 in prognosis, as well as AZGPl and MUCl in distinguishing different forms of primary tumors. However, none of these markers is superior to Gleason grading.
In earlier co-operative work with Stanford University the present inventor carried out gene expression profiling in a large set of normal prostate tissues, prostate tumors and lymph node metastases. Using various statistical approaches, a few hundreds genes were identified, the expression of which allows to distinguish low grade from high grade tumors, and even to predict the risk of short-term recurrence after radical surgery. High throughput tissue microarray analysis with a series of selected markers has found that MUCl showed significant increased expression in tumors with poor prognosis and AZGP 1 showed increased expression in tumors with good prognosis. However, even the two markers in combination do not have the same predictive power as histopathological evaluation using the Gleason grading system. This indicates the limitation of this marker lottery approach (1). Thus, with the advancement of biological and genetic research, knowledge about initiation and progression of cancer has greatly increased in recent time. Successful use of such knowledge in clinical diagnosis, prognosis and treatment for cancer patients, however, has been limited so far.
A highly relevant problem is how to predict the outcome of a tumor in a patient. Predictive methods available today are based on the concept that all tumor cells in a specific tumor are of the same functional importance. New data has shown that the total tumor cell population can be divided into two populations, i.e., a small tumor stem cell population and a large partially differentiated tumor cell population. Tumor stem cells are malignant cells that can proliferate, invade and metastasize, whereas differentiated tumor cells do not possess these properties.
Most conventional methods in this field rely on one or a few tumor markers only for diagnosis and prognosis. Tumor initiation and progression is however a complex biological process involving multiple genetic and functional changes in the tumor stem cells, which can not be simply reflected by one or a few tumor markers. Therefore using one or a few tumor markers to predict tumor outcome cannot reach a level of accuracy required by clinicians and patients for proper choice of treatment alternatives. On the other hand, the indiscriminate use of all rumor markers available in a prediction method results in high experimental and methodical complexity, and thus is time consuming and costly. It is this deficiency that the present invention seeks to remedy.
OBJECTS OF THE INVENTION
It is an object of the invention to provide a method for predicting the development of cancer at an early stage of tumor development. It is another object of the invention to provide a method for identifying, in a group of persons diagnosed to have a cancer, a sub-group of persons in which the cancer should be treated.
It is a further object of the invention to provide a method for assigning a suitable treatment to a person pertaining to a group of persons in which the cancer should be treated.
Still further objects of the invention will become evident from the study of the following description of the invention and a number of preferred embodiments thereof, and of the appended claims.
SUMMARY OF THE INVENTION
The present invention is based on the concept that a method for predicting the development of cancer should be based on the genetic profile of tumor stem cells, notwithstanding that they do comprise only a small portion of the total tumor cell population. Embryonic stem cell (ES) gene markers of the invention are herein referred to as ES tumor predictor genes (ESTP genes). The gene symbols for the ESTP genes of the invention are given according to their standard symbols in the National Center for Biotechnology Information's gene database (littp://www.ncbi.nlm.nih.gov/entrez/querv.fcgi?db=:gene&cmd== search&term). For expressed sequence tag (EST) without gene symbol, the IMAGE clone ID or the UniGene cluster ID is given.
The present invention is further based on the concept that embryonic stem cells are the origin of all tissue cells including so called progenitor cells of various specific cell lineages or cell types. Tumor cells may be derived from a few tissue stem cells whose regulatory system to guide time- and space-specific differentiation is disabled due to incorrectly repaired DNA damage. Despite impaired differentiation, other stem cell functional properties are more or less maintained or even enhanced, such as proliferation and metastasis. Thus, the more stem cell properties are conserved in the tumor cells, the more aggressive they will be biologically and clinically.
Based on this hypothesis a series of published original datasets in the Stanford Microarray Database (SMD) was analyzed according to the present invention. The datasets are derived from gene expression profiling studies in embryonic cell lines and cancers of the prostate, breast, lung, brain, stomach, kidney, ovary and blood. The expression profile of ESTP genes, that is, genes strongly regulated in ES tumor cells, allows to predict histological as well as biological subtypes with different clinical outcomes. In this application, "strongly regulated" applies to ESTP genes with a specific high expression level but also to ESTP genes with a specific low expression level.
Thus the present invention is additionally based on the hypothesis that strongly regulated ESTP genes in ES tumor cells, play a crucial role in tumor development and that, more specifically, different patterns of expression alterations of these ESTP genes determine tumor aggressiveness. According to the present invention this hypothesis is validated by using a large series of published datasets of genome-wide gene expression profiling in ES cells and in normal and tumor tissues for identifying ES genes of high prognostic power, that is, ESTP genes:
By a simple one class ranking test method, a list of 641 genes was identified, of which 328 display with highest level of expression and 313 with lowest level of expression in ES tumor cells (p<0.05). The gene expression data of these ESTP genes were derived from a variety of normal and tumor tissue samples, in total about 1000 tissue samples η
(arrays). They can be used to predict pathological and clinical characteristics of a tumor in a patient by applying a simple hierarchical cluster method to a corresponding dataset obtained for the respective tumor. By this method high prognostic accuracy was obtained for all tumor types investigated, in particular prostate cancer but also gastric cancer, lung cancer, and leukaemia. Moreover, prognostic accuracy was also obtained for breast cancer, ovary cancer, brain tumor, soft tissue tumor, and kidney cander.
Most important, according to the present invention, prognostic analysis is based on the genes with highest and lowest level of expression, that is, genes within ranges of expression which are near or comprise the level of maximal expression and of minimal expression.
Identification of pathological and clinical tumor characteristics by the ES gene expression profile of a tumor according to the present invention is competitive with and may be even superior to that obtained by complex statistical methods known in the art using the original expression datasets in a complete genome-wide scale analysis comprising over 20,000 genes. The present invention provides a prognostic method of predicting tumor pathological and clinical characteristics in a patient based on a restricted number of ES genes, such as less than 2,500 ES genes, more preferred less than 1,000, even more preferred from 500 to 750 ES genes, in particular from 600 to 680 ES genes, most preferred about 641 ES genes. The relatively small number of ES genes used for prediction, such as about 641 ES genes, and their specific functionality in stem cell biology allows errors due to biological and methodological background noise to be reduced or even eliminated. Virtual experimental methods based on such a restricted number of ES genes can be used for the diagnosis and prognosis of a broad spectrum of tumors. In contrast methods known in the art usually rely on few markers restricted to different tumor types. Based on the ESTP genes of the invention, a variety of robust analytical methods can be designed and applied in tumor diagnosis and prognosis using trace amounts of RNA derived from small tumor samples. For most tumors, such as prostate cancer, there is no method known in the art capable of predicting with good accuracy clinical outcome at an early stage of tumor development. It is in particular here that the prognostic method of the invention solves an important clinical problem.
In the following are disclosed preferred aspects of limiting the number of ESTP genes on which the method of the invention is based. (I) A first preferred aspect comprises selecting ES genes of predictive significance, that is, ESTP genes that constitute a minor proportion of all ES genes, in a cancer;
(II) According to a second preferred other statistical methods can be applied to derive substantially similar ES genes for the prediction of rumor pathological and clinical characteristics as described above;
(III) According to a third preferred aspect of the invention genes with weak prediction power are eliminated from the list of ES genes identified by the method of the invention and thus from consideration, thereby reducing the number of ESTP genes and improving prediction accuracy;
(IV) According to a fourth preferred aspect of the invention a number of ESTP genes with high specificity are selected from the ES gene list obtained by the method of the invention for application to a specific type of tumor, such as prostate cancer or breast cancer; (V) According to a fifth preferred aspect of the invention methods known in the art used in diagnosis and prognosis of tumors are based on one or several ESTP genes identified by the method of the invention, such as multiplex or high throughput RT-PCR (reverse transcriptase polymerase chain reaction) using small amounts of tumor samples, a specific DNA microarray platform, and other low or high throughput RNA analytical methods.
FNA (Fine Needle Aspiration) biopsy for clinical diagnosis and prognosis allows sampling multiple areas to cover a large volume of a tumor due to its minimal morbidity, thus being superior in overcoming tumor heterogeneity. Once the needle is inserted into a tumor lesion, it allows to obtain very pure cytological aspirates from the tumor with minimal stromal or normal epithelial cell contamination. FNA biopsy is a preferred method for obtaining pure tumor samples for molecular diagnosis and prognosis from small tumors, in particular from early stage prostate tumors. Conventional cDNA array experiments require approximately 40 μg total RNA. FNA biopsy yields 100-2,000 ng total RNA (57-59). This small amount of RNA is sufficient for analyses by using a small array platform as well as by multiplex or other high throughput RT-PCR methods.
Thus, according to the present invention is disclosed a method of predicting the development of a cancer in a patient, comprising:
(i) procuring a sample of tumour tissue from the patient;
(ii) determining the expression pattern of embryonic stem cell genes in the tissue; (iii) comparing said expression pattern with the corresponding expression pattern of embryonic stem cell genes in tumour tissue of reference patients with known disease histories.
According to the present invention is disclosed, in particular, a method of predicting the development of a cancer in a patient, comprising:
(a) procuring a tumour tissue from the patient;
(b) determining an expression pattern of embryonic stem cell genes listed in Table 1;
(c) comparing said expression pattern with a corresponding expression pattern of embryonic stem cell genes in tumour tissue of reference patients with known disease histories;
(d) identifying the patient or patients with known disease histories whose expression pattern optimally matches the patient's expression pattern;
(e) assigning, in a prospective manner, the disease history of said patient(s) to the patient in which the development of cancer shall be predicted. It is preferred for the determination of the expression pattern of said embryonic stem cell genes to comprise that of a first group genes with high level of expression and that of a group of genes with a low level of expression, said first and second group of genes not comprising by a third group of genes with intermediate levels of expression.
It is particularly preferred for the genes in the first group and/or the second group to be consecutive, that is, ranked consecutively, in respect of their expression levels.
According to a preferred aspect of the invention it is preferred for the total number of genes in the first and second groups to be substantially smaller than the number of the genes in the third group, in particular less than a fifth of the number of the genes in the third group. The total number of genes in the first and second groups is preferably from 500 to 750, more preferred from 600 to 680, most preferred about 641.
The genes pertaining to the first and second groups are preferably identified by employing a q value of from 0.01 to 0.1, more preferred of from 0.025 to 0.075, most preferred of about 0.05, in a one class significant analysis of microarrays (SAM) on a centered embryonic stem cell gene dataset by which all genes are ranked according to their expression levels
The method of the invention is applicable to cancer of any kind, in particular to prostate cancer, gastric cancer, lung cancer, and leukaemia. According to a second preferred aspect of the invention is disclosed the use of an embryonic stem cell gene DNA or RNA microarray for predicting the development of a cancer tumor in a patient. Preferably the microarray comprises DNA or RNA of a first group of embryonic stem cell genes with high level of expression in the tumor and of a second group of embryonic stem cell genes with a low level of expression in the tumor but not comprising DNA or RNA, respectively, of embryonic stem cell genes with an intermediate level of expression in the tumor. It is also preferred for the genes in the first and second groups to be those ranked according to their expression levels, in particular in a consecutive manner. A preferred method of ranking is a one class significant analysis of microarray s (SAM) on a centered embryonic tumor stem cell gene dataset by employing a q value of from 0.01 to 0.1, more preferred of from 0.025 to 0.075, most preferred of about 0.05. The embryonic stem cell gene DNA or RNA microarray can be used for the predictions of the development of any cancer, in particular of prostate cancer, gastric cancer, lung cancer, and leukaemia and, furthermore, of breast cancer, ovary cancer, brain tumor, soft tissue tumor, and kidney tumour.
According to a third preferred aspect of the invention is disclosed a microarray comprising a fragment of embryonic stem cell gene DNA or RNA derived from a first group of embryonic stem cell genes with high level of expression in a cancer tumor and from a second group of embryonic stem cell genes with a low level of expression in said cancer tumor but not comprising a fragment of embryonic stem cell gene DNA/RNA with an intermediate level of expression in the tumor. It is particularly preferred for the genes in the first group and/or the second group to be ranked consecutively in respect of their expression levels. It is preferred for the genes in the first and second groups to be those ranked according to their expression levels by a one class significant analysis of microarrays (SAM) on a centered embryonic tumor stem cell gene dataset by employing a q value of from 0.01 to 0.1, more preferred of from 0.025 to 0.075, most preferred of about 0.05. The cancer can be any cancer, in particular prostate cancer, gastric cancer, lung cancer, and leukaemia but also breast cancer, ovary cancer, brain tumor, soft tissue tumour, and kidney tumor.
According to a fourth preferred aspect of the invention is disclosed a probe comprising any of DNA, DNA fragment, DNA oligomer, DNA primer, RNA, RNA fragment, RNA oligomer of a first group of embryonic stem cell genes with high level of expression in a cancer tumor and of a second group of embryonic stem cell genes with a low level of expression in said cancer tumor but not comprising DNA, DNA fragment, DNA oligomer, DNA primer, RNA, RNA fragment, RNA oligomer, respectively, of embryonic stem cell genes with an intermediate level of expression in said cancer tumor. It is preferred for the genes in the first and second groups to be those ranked, preferably consecutively, according to their expression levels by a one class significant analysis of microarrays (SAM) on a centered embryonic tumor stem cell gene dataset by employing a q value of from 0.01 to 0.1, more preferred of from 0.025 to 0.075, most preferred of about 0.05. The cancer can be any cancer, in particular prostate cancer, gastric cancer, lung cancer, and leukaemia but also breast cancer, ovary cancer, brain tumor, soft tissue tumor, and kidney cancer.
According to a fifth preferred aspect of the invention is disclosed the use of a multitude of embryonic stem cell genes in a method of assessing the prognosis of a cancer tumor, wherein said multitude comprises a first group of embryonic stem cell genes with high level of expression in the tumor and of a second group of embryonic stem cell genes with a low level of expression in the tumor but does not comprise embryonic stem cell genes with an intermediate level of expression. It is preferred for the genes in the first and second groups to be ranked consecutively according to their expression levels and to constitute a fraction of the embryonic stem cell genes expressed in the tumor, in particular a fraction of 20 per cent or less of the embryonic stem cell genes expressed in the tumor. It is furthermore preferred to identify the multitude by a one class significant analysis of microarrays (SAM) on a centered embryonic tumor stem cell gene dataset by employing a q value of from 0.01 to 0.1, more preferred of from 0.025 to 0.075, most preferred of about 0.05. The use relates to any type of cancer, preferably prostate cancer, gastric cancer, lung cancer, and leukaemia but also breast cancer, ovary cancer, brain tumor, soft tissue tumor, and kidney cancer.
According to a sixth preferred aspect of the invention the ESTP genes in the first group and the second group can be for analysis of clinical tumor tissue biopsies or tumor cell aspirate samples using high throughput DNA microarrays for clinical diagnosis and prognosis.
In a first preferred use is designed a gene microarray for probing the 641 or, less preferred, the aforementioned 1,000 or from 500 to 750 or, in particular, from 600 to 680 ESTP genes by spotting a DNA fragment (PCR products or oligos) of each of them on a glass or other suitable support. RNA isolated from tumor tissue biopsies or tumor cell aspirates can be labelled and hybridized with the ESTP gene microarray. The expression changes of all the 641 ES genes can be determined and compared with a group of standard reference cases with well defined data of clinical parameters such as histology, pathology and outcomes. The clinical outcomes of the new cases can thus be predicted. A second preferred use relies on a gene solution array, for instance one based on the xMAP technology (http://www.luminexcorp.com). Probes that specifically bind to RNA of the ESTP genes can be designed, synthesized and immobilized on the surface of of a microsphere or microbead support. RNA isolated from clinical tumor tissue biopsies or tumor cell aspirates can be bound to the support. Upon illuminating the beads/spheres with light of varying wavelength under laser beam activation the expression levels of the various ESTP genes in the tumor samples can be simultaneously and accurately measured. This method is simple, sensitive, and accurate and of high throughput; the expression levels of up to 100 genes can be in one experiment. A third preferred use comprises the design of probes for assembling an ESTP gene microarray or chip of any kinds, for the purpose of application in clinical diagnosis and prognosis of common cancers.
According to a seventh preferred aspect of the invention high throughput PT-PCR can be used for analysis of clinical tumor tissue biopsies or tumor cell aspirate samples. Based on the ESTP gene list, design primers for each gene can be designed to carry out multiplex RT-PCR for determining the expression level of each gene in a tumor tissue or aspirate sample. Since the common RT-PCR platform can analyze 96 or multiple sets of 96 samples simultaneously, a small number of multiplex RT-PCR suffice to achieve high throughput measurement of the expression levels of the most preferred 641 ESTP genes or the less preferred 1000 or from 500 to 750 or, in particular, from 600 to 680 ESTP genes in a large set of clinical tumor tissue biopsies or aspirates.
According to an eight preferred aspect of the invention clinical tumor tissue biopsy samples and tumor cell aspirate samples can be analyzed using high throughput protein/antibody microarrays or an ELISA method. Based on the most preferred 641 ESTP genes or the less preferred 1000 or from 500 to 750 or, in particular, from 600 to 680 ESTP genes, the protein sequence or a portion thereof can be retrieved from publicly available human genome sequence resources and used to produce specific monoclonal antibodies for targeting the proteins encoded by the respective ESTP genes. The specific antibodies can be assembled into an ES protein array or incorporated into a high throughput ELISA system to measure the protein expression levels of the most preferred 641 ESTP genes and the less preferred 1000 or from 500 to 750 or, in particular, from 600 to 680 ESTP genes in clinical tumor tissue biopsies and tumor cell aspirates.
The invention will now be explained in greater detail by reference to preferred embodiments illustrated in a drawing. DESCRIPTION OF THE FIGURES
Fig. 1 is a graph illustrating the identification of ES predictor genes by a one-class SAM ranking test;
Fig. 2 is a gene expression profile obtained from biopsies of healthy and cancerous prostate tissue, and from embryonic stem cell lines, with a hierarchial clustering of the biopsies;
Fig. 3 is a gene expression profile obtained from biopsies of healthy and cancerous lung tissue biopsies, and from embryonic stem cell lines, with a hierarchial clustering of the biopsies; Fig. 4 is a graph illustrating survival for the patients related to major cancerous lung tissue clusters of Fig. 3;
Fig. 5 is a gene expression profile obtained from biopsies of healthy and cancerous stomach tissue biopsies, and from embryonic stem cell lines, with a hierarchial clustering of the biopsies; Fig. 6 is a graph illustrating survival for the patients related to major cancerous gastric tissue clusters of Fig. 5;
Fig. 7 is a gene expression profile obtained from leukocytes of acute myeloid leukaemia patients, and from embryonic stem cell lines, with a hierarchial clustering of the leukocyte samples; Fig. 8 is a graph illustrating survival for the patients pertaining to the major acute myeloid leukaemia subtype clusters of Fig. 7.
DESCRIPTION OF PREFERRED EMBODIMENTS
EXAMPLE 1
Data Retrieval. The method of the invention is based on published gene data such as the data sets published and deposited in the Stanford Microarray Database (SMD) (http://genome-www5.stanford.edu/). All array experiments used the same two-dye cDNA array platform with a common RNA reference, which enables reliable combination of or comparison with data from different experiments. These datasets include genome- wide expression data for embryonic stem cells (60), normal tissues from most of the human organs (61), and tumors from the prostate (62), breast, lung (63), stomach (64), liver (65), blood (66), brain (67), kidney (68), soft tissue (69), ovary (70; 71) and pancreas (72). In total about 1000 arrays were included in the analysis. Each array (tissue) in these datasets is denoted with corresponding basic clinical and pathological information such as histopathological type, tumor grade, clinical stage, and even survival data in a significant fraction of tumor cases.
Gene Selection. All genes or clones on arrays are selected. Control spots and empty spots are not included.
Data Collapse /Retrieval. Raw data are retrieved and averaged by SUID; UID column contains NAME; Retrieved Log(base2) of R/G Normalized Ratio (Mean). Data filtering options: Selected Data Filters: Spot is not flagged by experimenter. Data filters for GENEPIX result sets: Channel 1 Mean Intensity / Median Background Intensity > 1.5 AND Channel 2 Normalized (Mean Intensity / Median Background Intensity) > 1.5.
Data centering. The ES cell data set was combined with each of a number of other data sets. Genes and array batches were centered separately in each combined dataset as previously described (61 ; 62).
EXAMPLE 2
Identification of ES predictor genes. After centering a data set containing ES cells and normal tissues from most human organs, the ES data set was separated from the normal tissue data set. A one-class SAM (significant analysis of microarrays) was carried out using the centered ES dataset, by which all genes were ranked according to their expression levels in the ES cells (73). Using a q value equal to or less than 0.05 as cut-off, top 328 genes with highest level and top 313 genes with lowest level of expression in the ES cells were identified (Table 1). These 641 ES genes are named ES tumor predictor genes (ESTP genes). Previous studies used a small number of sample matrices to normalize the expression data of ES cells (60; 74); this may lead to erroneous identification of ESTP genes. In this invention, the expression data of ES genes from ES cells were centered by a matrix of over 100 normal tissues from most human organs (62). This greatly reduced erroneous identification of ESTP genes.
EXAMPLE 3
Prediction of clinical and pathological tumor types. After centering each combined data set, a sub-dataset containing only the 641 ESTP genes was isolated from the original dataset. A simple hierarchical clustering was carried out based on this sub-dataset using genes with 70% qualified data in all samples (78). The sample grouping was directly correlated with the clinical and pathological information of each individual tissue sample. Prediction examples for a number of tumor types are given below. Prediction in other datasets is carried out in essentially the same manner. In the one class SAM analysis, numbers of genes selected is in correlation with q value. There were 201 genes selected when q value at 0.01, 641 genes selected when q value at 0.05, and 1368 genes selected when q value at 0.1. In other words, an increased q value would result in increased number of selected genes as well as increased number of genes that would not be associated with the transcriptional regulation in the ES cells. Importantly, when the prediction powers were compared, the 641 genes selected by q value at 0.05 had best classification (prediction) results, as shown in the prostate cancer (Table 2) and lung cancer (Table 3) materials. The difference was particularly obvious in respect of lung cancer (Table 3). Thus the 641 genes selected by q value at 0.05 was the best choice of gene selection when both stem cell association and tumor classification are taken into consideration.
Definition of prediction. As described above, the ESTP genes were derived from the ES cell dataset. The power of this set of genes in the classification of a broad spectrum of tumors was then validated in each independent tumor dataset.
EXAMPLE 4
Prostate cancer. Published clinical data and predicted tumor subtype by ESTP genes of the invention for prostate cancer are listed in Table 2: Gleason grade, stage, biological subtype and short term recurrence (prostate specific antigen (PSA) survival) after radical surgery. Of the 641 ESTP genes, 505 had good data in 70% of all samples. In the gene expression profile of Fig. 2, the expression level (range in log ratio between -5.06 and 6.15) was transformed into a transitional color presentation, with red indicating above 0, black equal to 0 and green for less than 0; in Fig. 2 and the other figures illustrating gene expression profiles the colors are rendered in white, black, and grey (see, DESCRIPTION OF THE FIGURES). Based on these expression data, all samples were classified by hierarchical clustering into distinct groups as normal prostate, embryonic stem (ES) cells, prostate cancer group that contained all cases (66) with recurrence (PCa recurrent), Prostate cancer group that contained only cases without recurrence (PCa non-recurrent), and ES carcinoma cells. The classification is significantly (Fisher's exact test, p=0.001) correlated with the previous classification by using 5000 genes (Lapointe J et al., 2004). It should be W 2
16
noted that the PCa non-recurrent group predicted by the present invention is also significantly correlated with low Gleason score <6 (Fisher's exact test, p=0.028) and early stage (T<T3) (Fisher's exact test, ρ=0.007).
Prediction value for choice of treatment. Patients with a tumor predicted to be of a recurrent type (pertaining to the recurrent group) should be treated by radical surgery at a very early stage even in case of a moderate or low Gleason score. Patients with a very early stage tumor predicted to be of a non-recurrent type (pertaining to the non-recurrent group) should be kept under regular PSA and other examination control, because most of the tumors in this group are in fact indolent or very slow-progressive.
EXAMPLE 5
Lung cancer. Published clinical data and predicted tumor subtype by ESTP genes of the invention are shown in Table 3. Prediction of histological type and survival in lung cancer is illustrated in Fig. 3, tissue clustering by ESTP genes. Of the 641 ES predictor genes, 316 had qualified data in 70% or more of the samples. Lung cancer tissue samples were predictively sorted into two major groups, an adenocarcinoma group (a) that mainly contained adenocarcinomas, some normal lung tissues, ES cells and a few non- adenocarcinomas, and a (b) non-adenocarcinoma group that contained most non- adenocarcinomas including squamous cell carcinoma, large cell lung cancer and small cell lung cancer, together with a fraction of adenocarcinomas. In general, adenocarcinoma has a better prognosis than other types of lung cancer. Survival analysis based on lung adenocarcinoma subtypes is illustrated in Fig. 4.
The adenocarcinoma cases in the non-adenocarcinoma group (b) further showed shorter survival than adenocarcinoma cases in the adenocarcinoma group (a) as shown in Fig. 3, adenocarcinoma subtypes by ES predictor genes associated with survival.
Predictive value for choice of treatment strategy: tumors predicted to pertain to the adenocarcinoma group seem to have a generally favorable outcome after radical surgery at a very early stage; whereas tumors in the non-adenocarcinoma group may respond relatively better to chemotherapy such as to Iressa or radiation.
EXAMPLE 6
Gastric cancer. Published clinical data and tumor subtype predicted by ESTP genes of the invention are illustrated in Table 4. The prediction of histological types and survival in gastric cancer is illustrated in Figure 5: (a) tissue clustering by ES predictor genes; (b) issue subtypes by ES predictor genes associated with survival.
Prediction of subtypes of gastric cancer by ESTP genes: of the 641 ESTP genes 613 had qualified data in 70% of all samples. Gastric tumors were classified into two major subtypes, type 1 enriched in tumors with diffuse and mix histological types generally with poor prognosis, type 0 together with most normal gastric tissue samples. The survival time for gastric cancer patients pertaining to these groups is compared in Fig. 6. The subtype 0 tumors can be further divided into two sub-subtypes, one with the A subtype enriched in EB virus positive tumors, the other not. Predictive value: a) EBV infection is linked to gastric cancer via stem cell biology. Preventing an EBV infection by vaccination may have preventive effect on gastric cancer; b) Diffused type of gastric cancer has very strong hereditary tendency. One should specifically exclude gastric cancer in a relative to a patient whose tumor is predicted to pertain to this group, so that possible tumor can be treated radically at a very early stage.
EXAMPLE 7
Leukemia. Published clinical data and predicted tumor subtype by ESTP genes of the invention are listed in Table 5. Fig. 7 illustrates the prediction of subtypes of acute mononucleocyte leukemia associated with chromosome aberration and survival: (a) classification by ESTP genes; (b) AML subtypes associated with survival. Prediction of acute myeloid leukemia (AML) by ESTP genes: of the 641 ES predictor genes, 324 had qualified data in 70% of all samples. AML cases were classified into two major subtypes, type 1 enriched in cases with t(8;21) and del7q chromosomal aberrations, and type 0, which was further divided into two sub-subtypes A and B the first with a subtype enriched with inv(16), the second enriched with t(15;17). Type 1 cases showed shorter overall survival than type 0 as presented in Figure 8. Survival analysis was based on AML subtypes predicted in Fig. 4a and the published clinical data in Table 5.
Predictive value for treatment choices: AML with different chromosomal aberrations responds to different chemotherapies; in particular all-trans retinoic acid can induce differentiation of AML with t(l 5; 17) translocation. It is suggested that AML in the group enriched with t(15;17) but without the translocation detected by cytogenetic diagnostic method may show good response to all-trans retinoic acid due to the same stem cell biological alteration. EXAMPLE 8
Case history and retrospective cancer treatment strategy suggested by the method of the invention.
(a) Prostate cancer patient # PC007 (Table 5) aged 56 y at diagnosis. Gleason score of prostate cancer was 3+3=6; tumor stage was T2b, suggesting a well differentiated tumor at an early stage by conventional clinical pathological examination. In spite of this the tumor recurred as diagnosed by a re-increased PSA level 27.7 months after radical surgery. According to the predictive method of the invention, the tumor is predicted to be of ES type 1 with poor prognosis. This case illustrates a typical situation in which ES type prediction can outperform conventional clinical pathological methods in predicting clinical outcome. A similar case is patient PC250 (Table 5).
(b) Prostate cancer patient # PC037 (Table 5). This 57 year-old patient had a Gleason 4+3 tumor, a high grade tumor that would have a poor prognosis according to conventional clinical concepts. But, according to the predictive method of the invention, the tumor is classified as being of ES type 0 and thus would have had a better prognosis. The patient had a radical surgery without any signs of recurrence after 16.2 months. This case provides also an example for the situation that the ES typing in the present invention is superior to conventional Gleason grading.
(c) Prostate cancer patient # PC092 (Table 5). This patient was aged 68 y at diagnosis. His tumor had Gleason 3+3=6 and staged T2b, suggesting a well differentiated tumor at an early stage. By the method of the present invention the tumor is classified as being of ES type 0 with good prognosis. The patient was treated by radical surgery. No signs of recurrence were observed 13.7 months post surgery. There is good agreement between Gleason grading and ES typing according to the present invention. The ES typing result also suggests that the patient could have been safely kept under regular PSA control instead of immediate radical surgery.
EXAMPLE 9
Prognosis of lung adenocarcinoma. In addition to the prostate cancer cases from Table 5 elucidated above, it is seen that ES typing according to the present invention is significantly better than conventional histological grading in the prognosis of lung adenocarcinoma. For example, cases # 222-97 and # 226-97 were of grade 3 that would be poorly differentiated with poor outcome according to conventional clinical prognostic methods. By the method of the present invention the cases are classified as being of ES type 0 that would have a relatively good outcome. The patients were recurrence-free more than 48 months after radical surgery. Again ES typing by the method of the invention is more accurate than by conventional histological grading.
Legends to Figures
Figure 1. Identification of ESTP genes by a one-class SAM ranking test. There were 24361 genes with qualified expression data in 75% of the 6 embryonic stem (ES) cell lines. These 24361 genes were ranked according to their homogenous expression levels in the ES cells by a one-class SAM (significant analysis of microarrays) method as shown in this figure. At delta 0.23, q value < 0.05, 328 genes with highest expression levels and 313 genes with lowest expression levels were identified. The expression changes of these 641 genes in different tumor samples showed also strongest classification power as compared to genes located within the cut-off lines. Increasing the delta value (decreasing the q value) can increase the specificity in selecting genes representing the transcriptional regulation in the ES cells whereas it can decrease the number of selected genes. A decrease in significant genes selected could result in a decrease in the corresponding tumor classification power. By successively changing the cut-offline it was shown that the 641 genes selected at delta 0.23, q value < 0.05 was the best choice for both stem cell association and tumor classification. Figure 2. Prediction of prostate cancer - Gleason grade, stage, biological subtype and short term recurrence (prostate specific antigen (PSA) survival) after radical surgery. Of the 641 ESTP genes, 505 had good data in 70% of all samples. In this gene expression profile, the expression level (range in log ratio between -5.06 and 6.15) was transformed into a transitional gray-black scale presentation, with black indicating above 1, median gray indicate equal to 1 and green for less than 1. Based on these expression data, all samples were classified by hierarchical clustering into distinct groups as normal prostate, prostate cancer aggressive group type 1 that contained all cases with recurrence, prostate cancer non-aggressive group type 0 that contained only cases without recurrence. The classification significantly (Fisher's exact test, p=0.001) correlated with the previous classification by using 5000 genes (Lapointe J et al., 2004). The non-aggressive group predicted by the present invention was also significantly correlated with low Gleason score <6 (Fisher's exact test, p=0.028) and early stage (T<T3) (Fisher's exact test, ρ=0.007).
One tumor sample was provided for each prostate cancer patient. For some prostate cancer patients also a healthy ("normal") tissue sample was provided from an unaffected prostate area. These normal samples formed the "normal" cluster in Fig. 1. There were 6 embryonic stem (ES) cell lines from non-prostate cancer subjects. In addition 10 embryonic carcinoma (EC) cell lines from patients with embryonic carcinoma were included. These ES and EC cell lines were used as reference to illustrate different patterns of gene expression. Importance of this prediction for treatment choices: patients whose tumor is predicted in the aggressive group type 1 should be treated by radical surgery at very early stage even if the tumor Gleason score is not high; whereas patients whose tumor is predicted in the non-aggressive group type 0 should be under regular PSA and other examination control if the tumor is at very early stage, because most of the tumors in this group are in fact indolent or progress very slowly.
Figure 3. Prediction of lung cancer tissue type. Of the 641 ESTP genes, 316 had qualified data in 70% or more of the samples. Lung cancer tissue samples were predicted into two major groups, adenocarcinoma group type 0 that mainly contained adenocarcinomas, some normal lung tissues, ES cells and a few non-adenocarcinomas, and non-adenocarcinoma group type 1 that contained most non-adenocarcinomas including squamous cell carcinoma, large cell lung cancer and small cell lung cancer, together with a fraction of adenocarcinomas. In general, adenocarcinoma has relatively better prognosis than other types of lung cancer. In this invention, the adenocarcinoma cases in the non- adenocarcinoma group type 1 further showed shorter survival than adenocarcinoma cases in the adenocarcinoma group type 0 as shown in Fig. 4.
All lung cancer patients had a tumor sample. A few patients had also a normal sample from the unaffected lung areas. These a few normal samples clustered together as shown in this figure. There were 6 embryonic stem (ES) cell lines from non-prostate cancer subjects. In addition 10 embryonic carcinoma (EC) cell lines from patients with embryonic carcinoma were also included. These ES and EC cell lines were used as reference to indicate different patterns of gene expression.
Importance of the prediction for treatment strategy: tumors predicted in the adenocarcinoma group may have favourable outcome after radical surgery at very early stage. Figure 4. Lund adenocarcinoma survival analysis. The analysis is based on lung adenocarcinoma subtypes predicted in Fig. 3 and the published clinical data reproduced in Table 3. Time unit: months.
Figure 5. Prediction of subtypes of gastric cancer by ESTP genes. Of the 641 ESTP genes, 613 had qualified measuring in 70% of all samples. Gastric tumors were classified into two major subtypes, type 1 enriched with diffuse type and mix type tumors generally with poor prognosis, type 0 together with most normal gastric tissue samples. Type 0 tumors was further divided into two subtypes with the a subtype enriched with tumors with EB virus-positive. One tumor sample was provided from each gastric cancer patient. From some of the patients also a normal sample was taken from an unaffected stomach area. These "normal" samples formed the normal cluster in Fig. 5. There were 6 embryonic stem (ES) cell lines from non-prostate cancer subjects. In addition 10 embryonic carcinoma (EC) cell lines from patients with embryonic carcinoma were also included. These ES and EC cell lines were used as reference to indicate different patterns of gene expression.
Importance of the prediction: a) EBV infection is linked to gastric cancer via stem cell biology. Preventing EBV infection by vaccination may have preventing effect on gastric cancer; b) diffused type of gastric cancer has a very strong hereditary tendency. One should specifically exclude gastric cancer in a relative to a patient, whose tumor is predicted in this group, so that a tumor, if detected, can be treated radically at very early stage.
Figure 6. Gastric cancer survival analysis. The analysis was based on gastric cancer subtypes predicted in Fig. 5 and on the published clinical data reproduced in Table 4. Time unit: months.
Figure 7. Prediction of acute myeloid leukemia (AML) by ESTP genes. Of the 641 ES predictor genes, 324 had qualified data in 70% of all samples. AML cases were classified into two major subtypes, type 1 enriched in cases with t(8;21) and del7q chromosomal aberrations, type 0 that was further divided into two subtypes a and b with a subtype enriched inv(16) and b subtype enriched with t(15;17). Type 1 cases showed shorter overall survival than type 0 as presented in Fig. 5. From each patient one leukocyte sample was harvested. There were 6 embryonic stem (ES) cell lines from non-prostate cancer subjects. In addition 10 embryonic carcinoma (EC) cell lines from patients with embryonic carcinoma were also included. These ES and EC cell lines were used as reference to indicate different patterns of gene expression. Importance of the prediction for treatment choices: AML with different chromosomal aberrations respond to different chemotherapies, in particular all-trans retinoic acid can induce differentiation of AML with t(15;17) translocation. It is highly possible that AML in the group enriched with t(15;17) but without the translocation detected by cytogenetic diagnostic method can show good response to all-trans retinoic acid due to the same stem cell biological alteration.
Figure 8. Leukemia survival analysis. The analysis was based on AML subtypes predicted in Fig. 7 and on the published clinical data reproduced in Table 5. Time unit: months.
References
1. Lapointe J et al., Gene expression profiling identifies clinically relevant subtypes of prostate cancer. Proc Natl Acad Sci U S A, 2004; 101(3): 811-816.
2. Perou CM, et al., Molecular portraits of human breast tumours. Nature, 2000; 406(6797): 747-752.
3. Singh R et al., Microarray based comparison of three amplification methods for nanogram amounts of total RNA. Am J Physiol Cell Physiol, 2004. 4. Sorlie T et al., Gene expression patterns of breast carcinomas distinguish tumor subclasses with clinical implications. Proc Natl Acad Sci U S A, 2001; 98(19):
10869-10874. 5. van de Vijver MJ et al., A gene-expression signature as a predictor of survival in breast cancer. N Engl J Med, 2002; 347(25): 1999-2009. 6. van 't Veer LJ et al., Gene expression profiling predicts clinical outcome of breast cancer. Nature, 2002; 415(6871): 530-536.
7. Varambally S et al., The polycomb group protein EZH2 is involved in progression of prostate cancer. Nature 2002; 419(6907): 624-629.
8. Eisen MB et al., Cluster analysis and display of genome-wide expression patterns. Proc Natl Acad Sci U S A, 1998; 95(25): 14863-14868.
9. Tusher VG et al., Significance analysis of microarrays applied to the ionizing radiation response. Proc Natl Acad Sci U S A, 2001; 98(9): 5116-5121.
10. Sherlock G, Of fish and chips. Nat Methods, 2005; 2(5): 329-330.
11. Isaacs W et al., Focus on prostate cancer. Cancer Cell, 2002; 2(2): 113-116. 12. Jemal A et al., Cancer Statistics, 2005. CA Cancer J Clin, 2005; 55(1): 10-30.
13. Holmberg L et al., A randomized trial comparing radical prostatectomy with watchful waiting in early prostate cancer. N Engl J Med, 2002; 347(11): 781- 789.
14. Johansson JE et al., Natural history of early, localized prostate cancer. Jama, 2004; 291(22): 2713-2719.
15. Humphrey PA, Gleason grading and prognostic factors in carcinoma of the prostate. Mod Pathol, 2004; 17(3): 292-306.
16. Gleason DF and Mellinger GT5 Prediction of prognosis for prostatic adenocarcinoma by combined histological grading and clinical staging. J Urol,
1974; 111(1): 58-64.
17. Partin AW et al., Combination of prostate-specific antigen, clinical stage, and Gleason score to predict pathological stage of localized prostate cancer. A multi-institutional update. Jama, 1997; 277(18): 1445-1451. 18. Partin AW et al, The use of prostate specific antigen, clinical stage and
Gleason score to predict pathological stage in men with localized prostate cancer. J Urol, 1993; 150(1): 110-114.
19. Tricoli JV et al., Detection of prostate cancer and predicting progression: current and future diagnostic markers. Clin Cancer Res, 2004; 10(12 Pt 1): 3943-3953.
20. Cahill DP et al., Genetic instability and darwinian selection in tumours. Trends Cell Biol, 1999; 9(12): M57-60.
21. Hahn WC et al., Creation of human tumour cells with defined genetic elements. Nature, 1999; 400(6743): 464-468. 22. Hahn WC and Weinberg RA, Rules for making human tumor cells. N Engl J
Med, 2002; 347(20): 1593-1603.
23. Hahn WC and Weinberg RA, Modelling the molecular circuitry of cancer. Nat Rev Cancer, 2002; 2(5): 331-341.
24. Lengauer C et al., Genetic instabilities in human cancers. Nature, 1998; 396(6712): 643-649.
25. Vogelstein B and Kinzler KW, The multistep nature of cancer. Trends Genet, 1993; 9(4): 138-141.
26. Vogelstein B and Kinzler KW, Cancer genes and the pathways they control. Nat Med, 2004; 10(8): 789-799. 27. Cairns P et al., Frequent inactivation of PTEN/MMAC1 in primary prostate cancer. Cancer Res, 1997; 57(22): 4997-5000.
28. Carpten J et al., Germline mutations in the ribonuclease L gene in families showing linkage with HPCl. Nat Genet, 2002; 30(2): 181-184. 29. Huusko P et al., Nonsense-mediated decay microarray analysis identifies mutations of EPHB2 in human prostate cancer. Nat Genet, 2004; 36(9): 979- 983.
30. Li J et al., PTEN, a putative protein tyrosine phosphatase gene mutated in human brain, breast, and prostate cancer. Science, 1997; 275(5308): 1943-
1947.
31. Steele PA et al., Identification of a candidate tumour suppressor gene, MMACl, at chromosome 10q23.3 that is mutated in multiple advanced cancers. Nat Genet, 1997; 15(4): 356-362. 32. Taplin ME et al., Mutation of the androgen-receptor gene in metastatic androgen-independent prostate cancer. N Engl J Med, 1995; 332(21): 1393-
1398. 33. Tavtigian SV et al., A candidate prostate cancer susceptibility gene at chromosome 17p. Nat Genet, 2001; 27(2): 172-180. 34. Visakorpi T et al., In vivo amplification of the androgen receptor gene and progression of human prostate cancer. Nat Genet, 1995; 9(4): 401-406.
35. De Marzo AM et al., Human prostate cancer precursors and pathobiology. Urology, 2003; 62(5 Suppl 1): 55-62.
36. Nelson WG et al., Prostate cancer. N Engl J Med, 2003; 349(4): 366-381. 37. Schena M, Shalon D, Davis RW, and Brown PO Quantitative monitoring of gene expression patterns with a complementary DNA microarray. Science, 1995; 270(5235): 467-470.
38. Bettuzzi S et al., Successful prediction of prostate cancer recurrence by gene profiling in combination with clinical data: a 5 -year follow-up study. Cancer Res, 2003; 63(13): 3469-3472.
39. Bueno R et al., A diagnostic test for prostate cancer from gene expression profiling data. J Urol, 2004; 171(2 Pt 1): 903-906.
40. Chetcuti A et al., Identification of differentially expressed genes in organ- confined prostate cancer by gene expression array. Prostate, 2001; 47(2): 132- 140.
41. Dhanasekaran SM et al., Delineation of prognostic biomarkers in prostate cancer. Nature, 2001; 412(6849): 822-826.
42. Elek J et al., Microarray-based expression profiling in prostate tumors. In Vivo, 2000; 14(1): 173-182. 43. Febbo PG and Sellers WR, Use of expression analysis to predict outcome after radical prostatectomy. J Urol, 2003; 170(6 Pt 2): Sl 1-19; discussion S19-20.
44. Glinsky GV et al, Gene expression profiling predicts clinical outcome of prostate cancer. J Clin Invest, 2004; 113(6): 913-923. 45. Henshall SM et al., Survival analysis of genome-wide gene expression profiles of prostate cancers identifies new prognostic targets of disease relapse. Cancer Res, 2003; 63(14): 4196-4203.
46. Latil A et al., Gene expression profiling in clinically localized prostate cancer: a four-gene expression model predicts clinical behavior. Clin Cancer Res, 2003; 9(15): 5477-5485.
47. LaTulippe E et al., Comprehensive gene expression analysis of prostate cancer reveals distinct transcriptional programs associated with metastatic disease. Cancer Res, 2002; 62(15): 4499-4506.
48. Luo J et al., Human prostate cancer and benign prostatic hyperplasia: molecular dissection by gene expression profiling. Cancer Res, 2001; 61(12):
4683-4688.
49. Luo J et al., Gene expression signature of benign prostatic hyperplasia revealed by cDNA microarray analysis. Prostate, 2002; 51(3): 189-200.
50. Magee JA et al., Expression profiling reveals hepsin overexpression in prostate cancer. Cancer Res, 2001; 61(15): 5692-5696.
51. Nelson PS, Predicting prostate cancer behavior using transcript profiles. J Urol, 2004; 172(5 Pt 2): S28-32; discussion S33.
52. Singh D et al., Gene expression correlates of clinical prostate cancer behavior. Cancer Cell, 2002; 1(2): 203-209. 53. Xu J et al., Identification of differentially expressed genes in human prostate cancer using subtraction and microarray. Cancer Res, 2000; 60(6): 1677-1682. 54. Yu YP et al., Gene expression alterations in prostate cancer predicting tumor aggression and preceding development of malignancy. J Clin Oncol, 2004; 22(14): 2790-2799. 55. Andersson L et al., Fine needle aspiration biopsy for diagnosis and follow-up of prostate cancer. Consensus Conference on Diagnosis and Prognostic Parameters in Localized Prostate Cancer. Stockholm, Sweden, May 12-13, 1993. Scand J Urol Nephrol Suppl, 1994; 162(43-49; discussion 115-127. 56. Brolin J et al., Immunocytochemical detection of the androgen receptor in fine needle aspirates from benign and malignant human prostate. Cytopathology, 1992; 3(6): 351-357.
57. Assersohn L et al., The feasibility of using fine needle aspiration from primary breast cancers for cDNA microarray analyses. Clin Cancer Res, 2002; 8(3):
794-801.
58. Goley EM et al., Microarray analysis in clinical oncology: pre-clinical optimization using needle core biopsies from xenograft tumors. BMC Cancer, 2004; 4(1): 20. 59. Li Y et al., Direct comparison of microarray gene expression profiles between non-amplification and a modified cDNA amplification procedure applicable for needle biopsy tissues. Cancer Detect Prev, 2003; 27(5): 405-411.
60. Sperger JM et al., Gene expression patterns in human embryonic stem cells and human pluripotent germ cell tumors. Proc Natl Acad Sci U S A, 2003; 100(23): 13350-13355.
61. Shyamsundar R et al., Correction: A DNA microarray survey of gene expression in normal human tissues. Genome Biol, 2005; 6(9): 404.
62. Lapointe J et al., Gene expression profiling identifies clinically relevant subtypes of prostate cancer. Proc Natl Acad Sci U S A, 2004; 101(3): 811-816. 63. Garber ME et al., Diversity of gene expression in adenocarcinoma of the lung.
Proc Natl Acad Sci U S A, 2001; 98(24): 13784-13789.
64. Chen X et al., Variation in gene expression patterns in human gastric cancers. MoI Biol Cell, 2003; 14(8): 3208-3215.
65. Chen X et al., Gene expression patterns in human liver cancers. MoI Biol Cell, 2002; 13(6): 1929-1939.
66. Bullinger L et al., Use of gene-expression profiling to identify prognostic subclasses in adult acute myeloid leukemia. N Engl J Med, 2004; 550(16): 1605-1616.
67. Liang Y et al., Gene expression profiling reveals molecularly and clinically Distinct subtypes of glioblastoma multiforme. Proc Natl Acad Sci U S A, 2005;
102(16): 5814-5819.
68. Higgins JP et al., Gene expression patterns in renal cell carcinoma assessed by complementary DNA microarray. Am J Pathol, 2003; 162(3): 925-932. 69. Nielsen TO et al., Molecular characterisation of soft tissue tumours: a gene expression study. Lancet, 2002; 59(9314): 1301-1307.
70. Schaner ME et al., Variation in gene expression patterns in effusions and primary tumors from serous ovarian cancer patients. MoI Cancer, 2005; 4(26). 71. Schaner ME et al., Gene expression patterns in ovarian carcinomas. MoI Biol
Cell, 2003; 14(11): 4376-4386.
72. Iacobuzio-Donahue CA et al., Exploration of global gene expression patterns in pancreatic adenocarcinoma using cDNA microarrays. Am J Pathol, 2003; 7^2(4): 1151-1162. 73. Tusher VG et al., Significance analysis of microarrays applied to the ionizing gradiation response. Proc Natl Acad Sci U S A, 2001 ; 98(9): 5116-5121.
74. Skottman H et al., Gene expression signatures of seven individual human embryonic stem cell lines. Stem Cells, 2005; 23(9): 1343-1356.
75. Shamir R et al., R EXPANDER—an integrative program suite for microarray data analysis. BMC Bioinformatics, 2005; 6(232).
76. Lee HK et al., Ermine J: tool for functional analysis of gene expression data sets. BMC Bioinformatics, 2005; 6(269).
77. Diehn M et al., Genome-Scale. Identification of Membrane- Associated Human mRNAs. PLoS Genet, 2006; 2(1): el 1. 78. Eisen MB et al., Cluster analysis and display of genome-wide expression patterns. Proc Natl Acad Sci USA, 1998; P5(25): 14863-14868.
Table 1. Genes with extreme (highest and lowest) expression levels in ES cells
Strongly positive expression level score (d) Strongly negative expression level score (d)
(continued on the left of the following pages) (continued on the right of the following pages)
IMAGE Gene Score (d) q- Value x IMAGE Gene Score (d) q-Valuex clone symbol IO2 clone symbol 102
840944 EGRl . LOO 0.67 490023 WNT5B -1.61 0.67
753104 DCT .95 0.67 433257 LOC285458 -1.49 0.67
1680098 Hs.545599 .79 0.67 1628121 ABCG2 -1.43 0.67
1944026 TAGLN .74 0.67 781289 AA429944 -1.41 0.67
898092 CTGF .74 0.67 796542 ETV5 -1.39 0.67
526657 TCEB3 .70 0.67 1948085 CBR3 -1.30 0.67
526184 Hs.551490 1.67 0.67 2017535 LRP4 -1.29 0.67
384111 AA702568 1 .57 0.67 1556056 PRPH -1.29 0.67
452134 AA707225 1 .51 0.67 462144 ARSE -1.29 0.67
360254 CYR61 1 .49 0.67 415619 SLC5A9 -1.28 , 0.67
80186 Hs.534427 1 .49 0.67 1389018 CA4 -1.27 0.67
301068 Hs.433075 1 .44 0.67 143966 SEPT6 -1.25 0.67
1607286 CYR61 .42 0.67 502151 SLC16A3 -1.24 0.67
378488 CYR61 .42 0.67 1519951 ETV5 -1.22 0.67
306841 Hs.419777 .37 0.67 450938 DKFZP586A0522 -1.22 0.67
53245 LOC150383 1 .35 0.67 1323448 CRIPl -1.19 0.67
1660645 CYP26A1 .32 0.67 324593 MGC16291 -1.17 0.67
33837 FRASl [.29 0.67 824933 NFl -1.16 0.67
2012523 STX3A 1.27 0.67 1742419 WNTI l -1.10 0.67
38642 CYP26A1 1.26 0.67 70152 DKFZP586A0522 -1.09 0.67
1473274 MYL9 1.23 0.67 1613496 Hs.505172 -1.08 0.67
1434897 COL5A2 1.22 0.67 461488 ARRBl -1.08 0.67
307244 LIPL3 1.22 0.67 783697 AA446838 -1.07 0.67
1567658 AA976207 1.21 0.67 22355 RGS4 -1.07 0.67
49707 Hs.517502 1.20 0.67 913672 Hs.430369 -1.07 0.67
950676 KIFlA .17 0.67 1521792 IBRDC3 -1.07 0.67
843098 BASPl .17 0.67 51672 Hs.548513 -1.06 0.67
129320 FRASl 1.17 0.67 76182 CCDC3 -1.06 0.67
43745 SYT6 .17 0.67 1554367 TXNIP -1.06 0.67
204335 CD24 .16 0.67 454459 FBXL14 -1.04 0.67
1946026 FLJ10884 .15 0.67 72003 IL6R -1.04 0.67
179534 KCNQ2 .15 0.67 429093 LOC285458 -1.03 0.67
898218 IGFBP3 .14 0.67 810303 Hs.451488 -1.02 0.67
782476 GULPl 1 .13 0.67 120162 Hs.535086 -1.01 0.67
309929 GPR .11 0.67 1324242 TNFSF7 -1.01 0.67
756372 RARRES2 .11 0.67 731255 Hs.487536 -1.00 0.67
1500247 AA886761 1.09 0.67 32576 CCDC3 -0.97 0.67
281039 FABP5 .08 0.67 416408 Hs.79856 -0.96 0.67
79598 CDHl .06 0.67 2009000 GNB3 -0.95 0.67
810728 ZD52F10 .04 0.67 379768 CRLFl -0.95 0.67
1883559 FST 1.04 0.67 1473171 TXNIP -0.95 0.67
51807 FHOD3 .03 0.67 502656 IMPA3 -0.95 0.67
1607473 Hs.157101 .01 0.67 594758 Hs.529095 -0.95 0.67
66977 AIGl .01 0.67 260170 N32072 -0.95 0.67
927112 KIAA0773 .00 0.67 2028002 ABCDl -0.94 0.67
361974 PTN .00 0.67 32110 ABCG2 -0.93 0.81
880630 MGC3036 ( ).99 0.67 781738 GATA4 -0.93 0.81
786609 COL12A1 ( ).99 0.67 296140 MGCl 5887 -0.93 0.81
1607129 POU5F1 ( ).99 0.67 1928791 F3 -0.93 0.81
210921 NFKBIZ ( ).98 0.67 489594 ZCWCC2 -0.92 0.81
878850 GCAT ( ).98 0.67 1257131 Hs.552645 -0.92 0.81 281100 SYT6 0.98 0.67 243410 GATA4 -0.91 C .81
788234 ID4 0.96 0.67 685489 Hs.505172 -0.91 0.81
774446 ADM 0.96 0.67 178825 NRGN -0.91 0.81
34140 GCA 0.96 0.67 646057 SPRED2 -0.90 0.81
743426 KIAA1576 0.96 0.67 431301 CHST2 -0.90 0.81
307094 GCAT 0.96 0.67 1927991 ENPP2 -0.90 0.81
666371 THBSl 0.95 0.67 1895676 BARXl -0.90 0.81
81331 FABP5 0.94 0.67 951303 AA620527 -0.90 0.81
282587 CAI l 0.94 0.67 1460653 SEPT6 -0.89 0.81
283995 PARl 0.94 0.67 810612 SlOOAI l -0.89 0.81
251019 CDHl 0.94 0.67 60249 SFTPC -0.89 0.81
359684 ZDHHC22 0.94 0.67 294537 RAB17 -0.89 0.81
502664 RISl 0.94 0.67 1324885 LOC284542 -0.89 0.81
681865 C13orf25 0.93 0.67 756931 SlOOAl -0.89 0.81
230882 PAX6 0.93 0.67 1585518 KIAA1442 -0.88 0.81
768448 JPH4 0.93 0.67 379598 TRPV4 -0.87 0.81
502446 DNAPTP6 0.93 0.67 813631 TM7SF3 -0.87 0.81
1911780 TCF7L2 0.92 0.67 1630411 TDEl -0.87 0.81
24271 TOX 0.92 0.67 1456122 THEA -0.86 0.81
342640 KIAAOlOl 0.92 0.67 1925681 SMYD2 -0.86 0.81
141758 Hs.191591 0.92 0.67 133273 PMP22 -0.86 0.81
434768 FST 0.91 0.67 81316 ARG99 -0.86 0.81
782835 FOXOlA 0.91 0.67 81409 GABARAPLl -0.86 0.81
147925 Hs.298258 0.90 0.67 359835 SAT -0.85 0.81
878627 AA775288 0.89 0.81 2010319 NALPl -0.85 0.81
877789 LYPDCl 0.88 0.81 1946438 TM7SF3 -0.85 0.81
137535 TIFl 0.88 0.81 753467 SLC2A3 -0.85 0.81
282977 ADCY2 0.88 0.81 435566 NOS3AS -0.85 0.81
1551722 AA922660 0.88 0.81 42893 R59724 -0.84 0.81
743829 RGMA 0.88 0.81 154172 FCGBP -0.84 0.81
122982 EGLN3 0.88 0.81 782145 TPTE -0.84 0.81
470092 LARGE 0.88 0.81 795841 FLJ14466 -0.84 0.81
192543 KIAA0773 0.87 0.81 796398 PEG3 -0.84 0.81
1912578 PTGIS 0.87 0.81 754017 C12orf4 -0.83 0.81
810041 SS18 0.86 0.81 340745 Hs.371609 -0.83 0.81
68265 AFP 0.86 0.81 898298 PRKAB2 -0.83 0.81
789369 ID4 0.86 0.81 1558625 Hs.371609 -0.83 0.81
1534890 ANKRD12 0.86 0.81 789253 PSEN2 -0.83 0.81
770462 CPZ 0.86 0.81 357298 Hs.550621 -0.83 1.12
758298 TOX 0.85 0.81 1554451 GJCl -0.83 1.12
417800 Hs.59203 0.85 0.81 795758 DKFZP434B044 -0.82 1.12
797059 AA463250 0.85 0.81 825343 MGC 15887 -0.82 1.12
341328 TPMl 0.84 0.81 897865 MIDI -0.82 .12
34934 R45160 0.84 0.81 683569 AA215397 -0.82 .12
812277 PLXDC2 0.84 0.81 252663 CALBl -0.82 .12
281908 COL8A1 0.84 0.81 306933 C9orf25 -0.82 .12
504337 HESXl 0.83 0.81 461690 ACTRlB -0.82 .12
796569 C17 0.83 0.81 2009885 BCATl -0.81 .12
825369 VGLL4 0.83 0.81 486493 GPRl 24 -0.81 1.12
809707 JUNB 0.83 0.81 510576 AGR2 -0.81 .12
2306765 C18orf43 0.83 0.81 841655 JARIDlA -0.81 .12
40963 Hs.171485 0.83 0.81 564803 FOXMl -0.81 1.12
151477 FLJ38507 0.82 0.81 324785 P4HA2 -0.81 1.12
2010012 LRRC 17 0.82 0.81 826103 AA521416 -0.81 1.12
132637 GCA 0.82 0.81 66978 T67547 -0.81 1.12
309864 JUNB 0.82 0.81 1632011 NPR2 -0.80 1.12
753162 TBC1D4 0.82 0.81 854189 AA669383 -0.80 1.12 51255 Hs.126110 0.82 0.81 279496 DNDl -0.80 1.12
32962 Hs.22545 0.81 0.81 45623 SMYD2 -0.80 1 .12
782688 DNALIl 0.81 0.81 1322814 AA745659 -0.80 1 .12
436070 CA14 0.81 0.81 744001 RBM5 -0.80 1 .12
202535 H19 0.80 1.12 305895 Hs.180171 -0.79 1 .12
811028 VMPl 0.80 1.12 491232 PSEN2 -0.79 1 .12
144834 MAP7 0.80 1.12 1492891 ARF4L -0.79 1 .12
814769 MLFlIP 0.80 1.12 51548 H20826 -0.79 1 .12
447786 AUTS2 0.80 1.12 1588349 IMPA3 -0.79 1 .12
727268 Hs.545676 0.80 1.12 121981 SLC2A14 -0.79 1 .12
971188 AA774927 0.80 1.12 878572 NET-5 -0.79 1 .12
810218 OCIAD2 0.80 1.12 2018581 IL6ST -0.79 1 .12
50114 PCDHA6 0.80 1.12 154138 MBTPS2 -0.79 .34
878630 NBEA 0.79 1.12 853962 AA644695 -0.79 1.34
360787 TIFl 0.79 1.12 1916973 NDUF A9 -0.79 1.34
52430 SALL2 0.79 1.12 49145 Hs.494030 -0.79 1.34
1696831 AI095794 0.79 1.12 1554439 Hs.550811 -0.79 .34
760231 USP9X 0.79 1.12 1475308 Hs.546579 -0.78 1.34
221295 ID2 0.79 1.12 131979 EPASl -0.78 1.34
345601 D2S448 0.79 1.12 1455745 ZDHHC9 -0.78 1.34
897656 FARPl 0.79 1.12 768944 PGKl -0.78 1.34
813265 NFIB 0.79 1.12 757152 ZNF318 -0.78 1.34
27069 SCLY 0.78 1.12 162199 PTPRM -0.78 1.34
809694 CRABPl 0.78 1.12 855786 WARS -0.78 1.34
726779 CNNl 0.78 1.34 502778 LRP6 -0.78 1.34
279577 Hs.46551 0.77 1.34 1434905 HOXB7 -0.78 1.34
280758 TMSB4Y 0.77 1.34 489677 UPPl -0.77 1.34
35626 SLC38A1 0.77 1.34 124071 ASB9 -0.77 1.34
252830 H88050 0.77 1.34 296020 Hs.522906 -0.77 1.34
854879 SPHK2 0.77 1.34 191516 CREBBP -0.77 1.34
882402 KIAA0692 0.77 1.34 380620 PSEN2 -0.77 1.34
486436 UGP2 0.77 1.34 1732666 AI191823 -0.77 1.34
31475 SALL3 0.77 1.34 825270 PREXl -0.77 L .34
666451 PSD3 0.77 1.34 247546 VTN -0.77 1.34
379709 LRRNl 0.76 1.34 77651 HDAC6 -0.77 1.34
628357 ACTN3 0.76 1.34 1637233 TFCP2L1 -0.77 1.34
2314305 CDKNlC 0.76 1.34 1323328 PTHRl -0.77 .34
1567985 AA975922 0.76 1.34 586803 PGF -0.76 [.34
344036 BNC2 0.76 1.34 377560 CD3D -0.76 1.34
843036 MAP7 0.76 1.34 1470131 TFCP2L1 -0.76 1.34
782737 USP44 0.76 1.34 83444 SLClOAl -0.76 1.34
341310 FRZB 0.76 2.27 154600 PLCDl -0.76 1.34
731025 PPMlE 0.75 2.27 1472405 SlOOAlO -0.76 .34
282717 BCL2 0.75 2.27 1456120 GRK5 -0.76 1.34
50354 OTX2 0.74 2.27 214996 FRS2 -0.76 : 1.27
755444 TMSB4X 0.74 2.27 85313 CCPGl -0.75 : 1.21
289936 Hs.390594 0.74 2.27 295831 DERA -0.75 : 1.21
27396 GAL3ST3 0.74 2.27 296623 Hs.431518 -0.75 . 1.21
788667 PLEKHA9 0.74 2.27 71 1918 QPCT -0.75 : 1.21
1049291 OR7E47P 0.74 2.27 173281 1 TULP3 -0.75 . 1.21
328542 GALNT3 0.74 2.27 784296 NR3C2 -0.75 . 1.21
725395 UBE2L6 0.73 2.27 809719 URB -0.75 . 1.21
1895357 AI299356 0.73 2.27 284076 CREBL2 -0.75 ; 1.21
1456776 CLDN4 0.73 2.27 1552602 PHKAl -0.74 : 1.21
758088 CALDl 0.73 2.27 756595 SlOOAlO -0.74 ; 1.21
340657 LEFTY2 0.73 2.27 682418 ELF4 -0.74 : 1.21
365147 ERBB2 0.73 2.27 811072 Hs.217583 -0.74 : 1.21 1855229 Hs.149796 0.73 2.27 488301 LOC149603 -0.74 2.27
753291 ClorGl 0.73 2.27 752557 GPSM3 -0.74 2.27
50499 MGC72075 0.73 2.27 567127 FLJ20716 -0.74 2.27
126458 MTlK 0.72 2.27 1555659 AI147534 -0.74 2.27
740851 Hs.479288 0.72 2.27 897301 CMAS -0.74 2.27
609155 LRRNl 0.72 2.27 754559 C2orf27 -0.73 2.27
324437 CXCLl 0.72 2.70 23819 ABCGl -0.73 2.27
203003 NME4 0.72 2.70 1917493 SCAND2 -0.73 2.27
566597 PRSS 16 0.72 2.70 753775 GMPR -0.73 2.27
194706 USP9X 0.72 2.70 1558655 ASRGLl -0.73 2.27
783729 ERBB2 0.72 2.70 1858444 MDM4 -0.73 2.27
755689 RARG 0.72 2.70 454341 MYL4 -0.73 2.27
214858 LDB2 0.72 2.70 813520 EPHB3 -0.73 2.27
149743 C15orf29 0.72 2.70 293336 N64734 -0.73 2.27
137387 TFAP2A 0.71 2.70 289794 C12orf2 -0.73 2.27
626793 NIPA2 0.71 2.70 1526826 HOXB2 -0.73 2.27
858401 SCG3 0.71 2.70 1126568 Hs.116314 -0.73 2.27
80643 EDIL3 0.71 2.70 397488 TBX3 -0.73 2.27
1551239 FLJl 0884 0.71 2.70 713566 MSP -0.72 2.27
39824 UNC13A 0.71 2.70 267460 CGI-141 -0.72 2.27
301878 SCGB3A2 0.71 2.70 1570663 FKBP4 -0.72 2.70
1605321 C20orf24 0.71 2.70 1585211 Hs.194678 -0.72 2.70
277165 TMEFFl 0.71 2.70 259884 GPRl 26 -0.71 2.70
347520 BOC 0.71 2.70 148469 TYROBP -0.71 2.70
812088 NLN 0.71 2.70 1855351 EPSTIl -0.71 2.70
1607198 FSIPl 0.71 2.70 1476466 KBTBD9 -0.71 2.70
1500643 SLC13A1 0.71 2.70 298189 Hs.171806 -0.71 2.70
298702 APOM 0.70 2.70 940994 Hs.105316 -0.71 2.70
347035 KIAA0476 0.70 2.70 1588935 PHLD A3 -0.71 2.70
293569 ClorΩl 0.70 2.70 346696 TEAD4 -0.70 2.70
309447 TM4SF10 0.70 2.70 304975 KIAA0318 -0.70 2.70
22778 R38615 0.70 2.70 45464 AK2 -0.70 2.70
324690 GREMl 0.70 2.70 143997 PSMDlO -0.70 2.70
134712 SLC7A1 0.70 2.70 789147 ENO2 -0.70 2.70
785941 ZNF278 0.70 2.70 949939 PGKl -0.70 2.70
34901 DOK5 0.70 2.70 210789 AGT -0.70 2.70
491311 EGLN3 0.70 2.70 1865128 PEX5 -0.70 2.70
41103 TTYHl 0.70 2.70 730150 LOC144363 -0.70 2.70
813608 Hs.346566 0.70 2.70 727251 CD9 -0.70 2.70
257109 USP9X 0.69 2.70 281053 C2orfl8 -0.70 2.70
488207 T1A-2 0.69 2.70 743810 CDCA3 -0.70 2.70
782826 BACH 0.69 2.70 280970 NOLI -0.69 2.99
417226 MYC 0.69 2.70 361456 DDIT3 -0.69 2.99
323238 CXCLl 0.69 2.70 271219 Hs.487393 -0.69 2.99
37980 ZIC2 0.69 2.70 1682167 MGC5370 -0.69 2.99
628955 FOXOlA 0.69 2.70 283089 LOC340542 -0.69 2.99
1472735 MTlE 0.69 2.70 1635359 RASDl -0.68 2.99
813628 SCN2B 0.69 2.70 309776 CFLAR -0.68 2.99
45542 IGFBP5 0.69 2.70 206795 ASGR2 -0.68 2.99
141768 ERBB2 0.69 2.99 40871 C3F -0.68 2.99
701115 C6orfl l5 0.69 2.99 742642 MIG-6 -0.68 2.99
1635970 MFHASl 0.69 2.99 202498 ILlORB -0.68 2.99
377461 CAVl 0.69 2.99 855523 GPX3 -0.68 2.99
173228 GMFB 0.68 2.99 1587065 RPESP -0.68 2.99
739193 CRABPl 0.68 2.99 767041 FLJ41841 -0.68 2.99
29828 TGFB1I4 0.68 2.99 359982 AA035669 -0.68 2.99
842918 FARPl 0.68 2.99 1692195 KIFAP3 -0.68 2.99 127486 LDHD 0.68 2.99 505243 ITPR2 -0.68 2.99
51920 OSBPLlA 0.68 2.99 949938 CST3 -0.68 2.99
51378 Hs.31924 0.68 2.99 2010188 CCL26 -0.68 2.99
506060 Hs.506182 0.67 2.99 1734754 LEPREL2 -0.68 2.99
1865374 EFCBP2 0.67 2.99 142326 FLJ90036 -0.67 2.99
2052032 MYOlO 0.67 2.99 256947 NRK -0.67 2.99
752652 TCF7L2 0.67 2.99 1562645 NFKB2 -0.67 2.99
1457205 LOC152195 0.67 2.99 1168484 KITLG -0.67 2.99
50562 C8orf4 0.67 2.99 1641822 WBPI l -0.67 2.99
133136 DEK 0.67 2.99 609929 DDX47 -0.67 2.99
844680 TRD@ 0.67 2.99 1476157 PEX5 -0.67 2.99
825382 DCP2 0.67 2.99 433253 FBPl -0.67 2.99
80823 RPLlOA 0.67 2.99 1943018 IRAKI -0.67 2.99
502287 EMB 0.67 2.99 134430 C9orfl3 -0.67 2.99
809603 PTMA 0.67 2.99 143661 NTN4 -0.67 3.00
504461 KMO 0.67 2.99 853066 AA668256 -0.67 3.00
366848 TCF7L2 0.67 2.99 753914 ITPR2 -0.66 3.00
207107 CALDl 0.66 2.99 752808 TMED4 -0.66 3.00
74537 AFP 0.66 2.99 1586703 GPR3 -0.66 3.00
2020772 TM7SF2 0.66 2.99 897987 NDUFA9 -0.66 3.00
970591 HMGBl 0.66 2.99 429349 RGS4 -0.66 3.00
1475968 TEAD2 0.66 2.99 813189 TDEl -0.66 3.00
81408 C13orf7 0.66 2.99 51373 OMG -0.66 3.00
244652 SET 0.66 2.99 194136 H50971 -0.66 3.00
1586535 Hs.120204 0.66 2.99 429368 TLXl -0.66 3.00
230100 Hs.546672 0.66 2.99 859912 TDEl -0.66 3.00
502155 PTGIS 0.66 2.99 1627688 LMO6 -0.66 3.00
293032 TFAP2A 0.66 2.99 80162 RAD51C -0.66 3.00
283398 TM4SF10 0.66 2.99 877832 AA625628 -0.66 3.00
327593 Hs.547695 0.66 2.99 1896981 XCLl -0.66 3.00
208718 ANXAl 0.66 3.00 1670954 KIAAl 363 -0.65 3.00
265694 OLFML2B 0.66 3.00 1635221 ETNKl -0.65 3.00
291448 SILV 0.65 3.00 1501914 P4HB -0.65 3.00
592594 LRIGl 0.65 3.00 1879169 RAB21 -0.65 3.00
137984 FLJ38507 0.65 3.00 813426 TRIB2 -0.65 3.00
1761751 MAPK8IP1 0.65 3.00 727988 CDW52 -0.65 3.00
1881469 Hs.547698 0.65 3.00 302632 B7 -0.65 3.00
134783 COLI lAl 0.65 3.00 869187 EPASl -0.65 3.00
726658 NME3 0.65 3.00 52031 LOC126731 -0.65 3.00
239256 FZD7 0.65 3.00 43865 DNCIl -0.65 3.00
284007 LOC 152485 0.65 3.00 1724716 TTLL3 -0.65 3.00
788641 AP1S2 0.64 3.00 124737 CHST12 -0.65 3.00
878583 CABPl 0.64 3.00 234348 MXD3 -0.64 3.00
854570 TEAD2 0.64 3.00 1500631 DDIT3 -0.64 3.00
714106 PLAU 0.64 3.00 1609537 WNKl -0.64 3.00
880747 MGC3036 0.64 3.00 328821 CFCl -0.64 3.00
782576 Hs.459026 0.64 3.00 842826 RBBP4 -0.64 3.00
47359 EDNl 0.64 3.00 2308429 PPFIA4 -0.64 3.00
1475734 TOX 0.64 3.00 1566554 PRKAB2 -0.64 3.00
1857589 AI269390 0.64 3.00 810552 REA -0.64 3.00
1604674 ZIC2 0.64 3.00 253733 FOXCl -0.64 3.00
1574074 KIAAl 586 0.64 3.00 357190 MGC8902 -0.64 3.00
453602 CALDl 0.64 3.00 162310 PMP22 -0.64 3.00
814353 AA458838 0.64 3.00 1695674 HSPB6 -0.64 3.00
1700916 C9orf39 0.64 3.00 289570 NSMAF -0.64 3.00
1948377 OPRSl 0.64 3.00 66327 CRlL -0.64 3.00
740925 INDO 0.64 3.00 345103 EPHB2 -0.64 3.00 179266 CTXNl 0.64 3.00 687667 Hs.537002 -0.64 3.66
79935 T61475 0.64 3.00 856447 IFI30 -0.64 3.66
24415 TP53 0.64 3.00 297212 ITLNl -0.64 3.66
1897950 C15orf29 0.64 3.00 1558505 LEPREl -0.64 3.66
627226 SLC30A1 0.63 3.00 1473168 ZC3HDC6 -0.64 3.66
1492411 EIF5A 0.63 3.00 1661677 RIFl -0.63 3.66
854581 TCF4 0.63 3.00 1636900 AI000268 -0.63 3.66
241985 PARl 0.63 3.00 345916 SPTBNl -0.63 3.66
1606557 FHL2 0.63 3.00 395400 MBD6 -0.63 3.66
276574 FLJ36754 0.63 3.66 279970 ADORA2A -0.63 3.66
366093 ZNF397 0.63 3.66 1671108 AI075256 -0.63 3.66
1605008 IGSF4C 0.63 3.66 133988 ACSL4 -0.63 3.66
1160531 ERBB3 0.63 3.66 377987 ADAMTS 15 -0.63 3.66
565075 STCl 0.63 3.66 729964 SMPDl -0.63 3.66
1570558 AA932334 0.63 3.66 2009974 ACHE -0.63 3.66
739155 CDH6 0.63 3.66 812961 SIPA1L2 -0.63 3.66
739159 BPHL 0.63 3.66 810743 MLF2 -0.63 3.66
488246 KIAA1913 0.63 3.66 1554420 TCEA2 -0.63 3.66
137297 PGAPl 0.63 3.66 132702 P4HB -0.63 3.66
271670 TNFSF13 0.63 3.66 1589083 DEFBl -0.62 3.66
324307 TM4SF10 0.63 3.66 1644045 TULP3 -0.62 3.66
347331 SNTBl 0.63 3.66 770785 MANlCl -0.62 3.66
282895 LRRC 16 0.62 3.66 1475648 TTN -0.62 3.66
250678 FLJ20171 0.62 3.66 299603 AI822111 -0.62 3.66
1371759 CUGBP2 0.62 3.66 1917063 SDSL -0.62 3.66
725365 GASl 0.62 3.66 1759254 STS-I -0.62 3.66
2005924 MATK 0.62 3.66 127370 R08549 -0.62 3.66
795746 MLFlIP 0.62 3.66 26482 ZNF335 -0.62 3.66
1895737 Hs.445295 0.62 3.66 811162 FMOD -0.62 3.66
742776 YPELl 0.62 3.66 79562 MOSPDl -0.62 3.66
236338 TP53 0.62 3.66 50166 OATLl -0.62 3.66
686667 GCDH 0.62 3.66 1160995 ERF -0.62 3.66
180520 UBE3A 0.62 3.66 40040 KIAAl 126 -0.61 3.66
447509 HLA-DOA 0.62 3.66 2296063 KIAA0528 -0.61 3.66
1862529 Hs.433460 0.62 3.66
47460 B3GAT1 0.62 3.66
345645 PDGFB 0.62 3.66
489169 C10orf83 0.62 3.66
755299 IER2 0.61 3.66
504774 GGTLAl 0.61 3.66
1602927 MGC35048 0.61 3.66
213850 FJXl 0.61 3.66
38618 Hs.530150 0.61 3.66
125187 ERCC2 0.61 3.66
300099 TM4SF9 0.61 3.66
153646 R48843 0.61 3.66
768417 EPB41L3 0.61 3.66
133518 MAPRE2 0.61 3.66
1556401 AA936454 0.61 3.66
By a simple ranking test (one-class significant analysis of microarrays), 328 genes were identified with highest level and 313 genes with lowest level expression in the ES cells. Genes were selected according to the cut-off q value < 0.05. Table 2. Prostate cancer clinical data and ES type
Figure imgf000035_0001
Figure imgf000036_0001
LN meta: lymph node metastasis. N/A: non available.
(a) All patients hade one tumor sample analyzed. A fraction of patients hade also normal tissues from unaffected areas of the prostate analyzed; they are presented as the "normal" cluster in Figure 2.
(b) Increasing the q value in the one-class SAM (significant analysis of microarrays) ranking test gave a list of increased number of significant ES genes as shown in Figure 1. By choosing different q value cut-off at 0.01, 0.05 and 0.1, there were 201, 641 and 1386 significant ES genes selected respectively. Using the expression profile of these three gene lists to predict the tumor aggressiveness gave some slight different results as shown in this table. The result by the gene list at q<0.05 gave the best prediction. Table 3. Lung adenocarcinoma clinical data and ES type
Figure imgf000037_0001
(a) Table 3 presents clinical data from lung adenocarcinoma cases only. In Figure 3 cases with non-adenocarcinoma are included, comprising large cell lung cancer, small cell lung cancer, and squamous cell lung cancer. The non-adenocarcinoma cases were analyzed by gene expression profiling in the original publication but lacked clinical follow-up data. (b) By choosing different q value cut-off at 0.01, 0.05 and 0.1, 201, 641, and 1386, respectively, significant ES genes were selected. Using the expression profile of the corresponding gene lists for tumor aggressiveness prediction provided slightly different results as shown Table 3. The q<0.05 gene list gave the best prediction.
Table 4. Gastric cancer clinical data and ES type
Figure imgf000039_0001
Figure imgf000040_0001
(a) Only tumor sample ID was indicated in Table 4. Some cases had both a tumor sample and a normal sample from respective stomach areas analyzed by gene expression profiling. The normal samples formed a normal cluster as shown in Figure 5.
(b) The ES type was determined by using the gene list of 641 ES predictor genes selected at q<0.05 in the one-class SAM.
Table 5. Leukemia clinical data and ES type
Figure imgf000042_0001
Figure imgf000043_0001
Figure imgf000044_0001
(a) The ES type was determined by using the gene list of 641 ES predictor genes selected at q<0.05 in the one-class SAM.
Table 6. Abbreviations
Abbreviation Full term
ES embryonic stem
RNASEL ribonuclease L (2',5'-oligoisoadenylate synthetase-dependent)/hereditary prostate
(HPCl) cancer 1
ELAC2/HPC2 elaC homolog 2 (E. coli) /hereditary prostate cancer 2
GSTPl glutathione S-transferase pi
AMACR alpha-methylacyl-CoA racemase
HPN hepsin
PIMl pim-1 oncogene
EZH2 enhancer of zeste homolog 2
AZGPl alpha-2-glycoprotein 1, zinc
MUCl mucin 1, cell surface associated
SMD Stanford Microarray Database
RNA ribonuclear acid
DNA dioxyribonuclear acid cDNA complementary dioxyribonuclear acid
SUID Stanford Unique Identification Number
UID unique Identification Number
R/G red channel /green channel
GO gene ontology
IMAGE the Integrated Molecular Analysis of Genomes and their Expression
PSA prostate specific antigen
RR relative risk
SE standard error
EBV Epstein-Barr virus
ISH in situ hybridization
AML acute myeloid leukemia
H. pylori Helicobacter pylori
SAM significant analysis of microarrays
TF transcriptional factor t(15;17) translocation between chromosome 15 and chromosome 17 del(7q) deletion of the long arm of chromosome 7 inv(l 6) inversion of chromosome 16
AML acute myeloid leukemia.
NA not available. t(15;17) translocation between chromosome 15 and chromosome 17 del(7q) deletion of the long arm of chromosome 7 inv(16) inversion of chromosome 16
F female
M male
Note: The gene symbols for all genes in this invention are given according to their standard symbol in the National Center for Biotechnology Information's gene database (http://www.ncbi.nlm.nih.gov/entrez/querv.fcgi?db=gene&cmd=search&term). For expressed sequence tag (EST) without gene symbol, the IMAGE clone ID or the UniGene cluster ID are given

Claims

1. A method of predicting the development of a cancer in a patient, comprising:
(a) procuring a tumour tissue from the patient;
(b) determining an expression pattern of embryonic stem cell genes listed in Table l;
(c) comparing said expression pattern with a corresponding expression pattern of embryonic stem cell genes in tumour tissue of reference patients with known disease histories;
(d) identifying the patient or patients with known disease histories whose expression pattern optimally matches the patient's expression pattern;
(e) assigning, in a prospective manner, the disease history of said patient(s) to the patient in which the development of cancer shall be predicted.
2. The method of claim 1, wherein the determination of the expression pattern of said embryonic stem cell genes comprises that of a first group genes with high level of expression and that of a group of genes with a low level of expression, said first and second group of genes not comprising by a third group of genes with intermediate levels of expression.
3. The method of claim 2, wherein the genes in the first group and/or the second group are consecutive in respect of their expression levels.
4. The method of claim 2 or 3, wherein the combined number of genes in the first and second groups is substantially smaller than the number of genes in the third group.
5. The method of claim 4, wherein said combined number is less than a fifth of the number of the genes in the third group.
6. The method of any of claims 5, wherein the combined number of genes in the first group and in the second group is from 500 to 750.
7. The method of claim 6, wherein the combined number of genes in the first and second group is from 600 to 680.
8. The method of claim 7, wherein the combined of genes in the first and second group is about 641.
9. The method of any of claims 2 to 8, wherein the genes pertaining to the first and second groups are identified by employing a q value of from 0.01 to 0.1 in a one class significant analysis of microarrays (SAM) on a centered embryonic stem cell gene dataset by which all genes are ranked according to their expression levels.
10. The method of claim 9, wherein the q value is from 0.025 to 0.075.
11. The method of claim 10, wherein the q value is about 0.05.
12. The method of any of claims 1 to 11, wherein the cancer is selected from prostate cancer, gastric cancer, lung cancer, and leukaemia and also from breast cancer, ovary cancer, brain tumor, soft tissue tumor, and kidney tumor.
13. The use of an embryonic stem cell gene nuclear acid (DNA /RNA) microarray for predicting the development of a cancer tumor in a patient, wherein the microarray comprises DNA or RNA of a first group of embryonic stem cell genes with high level of expression in the tumor and of a second group of embryonic stem cell genes with a low level of expression in the tumor but not comprising DNA or RNA, respectively, of embryonic stem cell genes with an intermediate level of expression in the tumor.
14. The use of claim 13, wherein the genes in the first group and/or the second group are consecutive in respect of their expression levels.
15. The use of claim 13 or 14, wherein the genes in the first and second groups are those ranked according to their expression levels by a one class significant analysis of microarrays (SAM) on a centered embryonic tumor stem cell gene dataset by employing a q value of from 0.01 to 0.1.
16. The use of claim 15, wherein the q value is from 0.025 to 0.075.
17. The use of claim 16 , wherein the q value is about 0.05.
18. The use of any of claims 13 to 17, wherein the cancer is selected from prostate cancer, gastric cancer, lung cancer, and leukaemia.
19. The use of any of claims 13 to 17, wherein the cancer is selected from breast cancer, ovary cancer, brain tumor, soft tissue tumor, and kidney tumour.
20. A microarray comprising a fragment of embryonic stem cell gene DNA or RNA derived from a first group of embryonic stem cell genes with a high level of expression in a cancer tumor and of a second group of embryonic stem cell genes with a low level of expression in said cancer tumor but not comprising a fragment of embryonic stem cell gene DNA/RNA with an intermediate level of expression in said cancer tumor.
21. The microarray of claim 20, wherein the genes in the first group and/or the second group are consecutive in respect of their expression levels.
22. The microarray of claim 20 or 21, wherein the genes in the first and second groups are those ranked according to their expression levels by a one class significant analysis of microarrays (SAM) on a centered embryonic tumor stem cell gene dataset by employing a q value of from 0.01 to 0.1.
23. The microarray of claim 22, wherein the q value is from 0.025 to 0.075.
24. The microarray of claim 23, wherein the q value is about 0.05.
25. The microarray of any of claims 20 to 24, wherein the cancer is selected from prostate cancer, gastric cancer, lung cancer, and leukaemia.
26. The microarray of any of claims 20 to 24, wherein the cancer is selected from breast cancer, ovary cancer, brain tumor, soft tissue tumour, and kidney tumor.
27. A probe comprising any of DNA, DNA fragment, DNA oligomer, DNA primer, RNA, RNA fragment, RNA oligomer of a first group of embryonic stem cell genes with high level of expression in a cancer tumor and of a second group of embryonic stem cell genes with a low level of expression in said cancer tumor but not comprising DNA, DNA fragment, DNA oligomer, DNA primer, RNA, RNA fragment, RNA oligomer, respectively, of embryonic stem cell genes with an intermediate level of expression in said cancer tumor.
28. The probe of claim 27, wherein the genes in the first group and/or the second group are consecutive in respect of their expression levels.
29. The probe of claim 27 or 28, wherein the genes in the first and second groups are those ranked according to their expression levels by a one class significant analysis of microarrays (SAM) on a centered embryonic tumor stem cell gene dataset by employing a q value of from 00.1 to 0.1.
30. The probe of claim 29, wherein the q value is from 0.025 to 0.075.
31. The probe of claim 30, wherein the q value is about 0.05.
32. The probe of any of claims 27 to 31, wherein the cancer is selected from prostate cancer, gastric cancer, lung cancer, and leukaemia.
33. The probe of any of claims 27 to 31, wherein the cancer is selected from breast cancer, ovary cancer, brain tumor, soft tissue tumor, and kidney cancer.
34. Use of a multitude of embryonic stem cell genes in a method of assessing the prognosis of a cancer tumor, wherein said multitude comprises a first group of embryonic stem cell genes with high level of expression in the tumor and of a second group of embryonic stem cell genes with a low level of expression in the tumor but does not comprise embryonic stem cell genes with an intermediate level of expression.
35. The use of claim 34, wherein the genes in the first group and/or the second group are consecutive in respect of their expression levels.
36. The use of claim 34 or 35, wherein the genes in the first and second groups constitute a fraction of the embryonic stem cell genes expressed in the tumor.
37. The use of claim 36, wherein said fraction is 20 per cent or less of the embryonic stem cell genes expressed in the tumor.
38. The use of any of claims 34 to 37, wherein said multitude of genes is identified by a one class significant analysis of microarrays (SAM) on a centered embryonic tumor stem cell gene dataset by employing a q value of from 0.01 to 0.1.
39. The use of claim 38, wherein the q value is from 0.025 to 0.075.
40. The use of claim 39, wherein the q value is about 0.5.
41. The use of any of claims 34 to 40, wherein the cancer is selected from prostate cancer, gastric cancer, lung cancer, and leukaemia.
42. The use of any of claims 34 to 40, wherein the cancer is selected from breast cancer, ovary cancer, brain tumor, soft tissue tumor, and kidney cancer.
PCT/SE2007/000689 2006-07-28 2007-07-16 Embryonic stem cell markers for cancer diagnosis and prognosis Ceased WO2008013492A1 (en)

Priority Applications (5)

Application Number Priority Date Filing Date Title
US12/375,177 US20100009858A1 (en) 2006-07-28 2007-07-16 Embryonic stem cell markers for cancer diagnosis and prognosis
EP07769001A EP2052089A4 (en) 2006-07-28 2007-07-16 EMBRYONIC STEM CELL MARKERS FOR ESTABLISHING DIAGNOSIS OR PROGNOSIS OF CANCER
AU2007277508A AU2007277508A1 (en) 2006-07-28 2007-07-16 Embryonic stem cell markers for cancer diagnosis and prognosis
CA 2659231 CA2659231A1 (en) 2006-07-28 2007-07-16 Embryonic stem cell markers for cancer diagnosis and prognosis
IL196774A IL196774A0 (en) 2006-07-28 2009-01-28 Embryonic stem cell markers for a cancer diagnosis and prognosis

Applications Claiming Priority (2)

Application Number Priority Date Filing Date Title
SE0601615-8 2006-07-28
SE0601615 2006-07-28

Publications (1)

Publication Number Publication Date
WO2008013492A1 true WO2008013492A1 (en) 2008-01-31

Family

ID=38981730

Family Applications (1)

Application Number Title Priority Date Filing Date
PCT/SE2007/000689 Ceased WO2008013492A1 (en) 2006-07-28 2007-07-16 Embryonic stem cell markers for cancer diagnosis and prognosis

Country Status (6)

Country Link
US (1) US20100009858A1 (en)
EP (1) EP2052089A4 (en)
AU (1) AU2007277508A1 (en)
CA (1) CA2659231A1 (en)
IL (1) IL196774A0 (en)
WO (1) WO2008013492A1 (en)

Cited By (10)

* Cited by examiner, † Cited by third party
Publication number Priority date Publication date Assignee Title
WO2011025542A1 (en) * 2009-08-31 2011-03-03 Ludwig Institute For Cancer Research Ltd. Seromic analysis of ovarian cancer
WO2013060739A1 (en) 2011-10-24 2013-05-02 Chundsell Medicals Ab Marker genes for prostate cancer classification
EP2356446A4 (en) * 2008-11-14 2014-03-19 Brigham & Womens Hospital DIAGNOSTIC AND THERAPEUTIC METHODS RELATING TO CANCER STEM CELLS
US8906864B2 (en) 2005-09-30 2014-12-09 AbbVie Deutschland GmbH & Co. KG Binding domains of proteins of the repulsive guidance molecule (RGM) protein family and functional fragments thereof, and their use
US8962803B2 (en) 2008-02-29 2015-02-24 AbbVie Deutschland GmbH & Co. KG Antibodies against the RGM A protein and uses thereof
US9102722B2 (en) 2012-01-27 2015-08-11 AbbVie Deutschland GmbH & Co. KG Composition and method for the diagnosis and treatment of diseases associated with neurite degeneration
US9175075B2 (en) 2009-12-08 2015-11-03 AbbVie Deutschland GmbH & Co. KG Methods of treating retinal nerve fiber layer degeneration with monoclonal antibodies against a retinal guidance molecule (RGM) protein
US11542328B2 (en) 2008-11-14 2023-01-03 The Brigham And Women's Hospital, Inc. Therapeutic and diagnostic methods relating to cancer stem cells
US12448461B2 (en) 2018-04-25 2025-10-21 Children's Medical Center Corporation ABCB5 ligands and substrates
US12460260B2 (en) 2019-05-23 2025-11-04 The Board Of Trustees Of Leland Stanford Junior University Methods utilizing single cell genetic data for cell population analysis and applications thereof

Families Citing this family (3)

* Cited by examiner, † Cited by third party
Publication number Priority date Publication date Assignee Title
US10648035B2 (en) 2012-11-26 2020-05-12 The Johns Hopkins University Methods and compositions for diagnosing and treating gastric cancer
US9804162B2 (en) * 2015-08-31 2017-10-31 The University Of Hong Kong Pleural fluid markers for malignant pleural effusions
WO2018174861A1 (en) * 2017-03-21 2018-09-27 Mprobe Inc. Methods and compositions for detecting early stage breast cancer with rna-seq expression profiling

Citations (1)

* Cited by examiner, † Cited by third party
Publication number Priority date Publication date Assignee Title
US6090559A (en) * 1996-03-29 2000-07-18 Urocor, Inc. Biomarkers for the detection of prostate cancer

Family Cites Families (2)

* Cited by examiner, † Cited by third party
Publication number Priority date Publication date Assignee Title
US6984522B2 (en) * 2000-08-03 2006-01-10 Regents Of The University Of Michigan Isolation and use of solid tumor stem cells
WO2006135886A2 (en) * 2005-06-13 2006-12-21 The Regents Of The University Of Michigan Compositions and methods for treating and diagnosing cancer

Patent Citations (1)

* Cited by examiner, † Cited by third party
Publication number Priority date Publication date Assignee Title
US6090559A (en) * 1996-03-29 2000-07-18 Urocor, Inc. Biomarkers for the detection of prostate cancer

Non-Patent Citations (18)

* Cited by examiner, † Cited by third party
Title
EISEN MB ET AL.: "Cluster analysis and display of genome-wide expression patterns", PROC NATL ACAD SCI USA, vol. 95, no. 25, 1998, pages 14863 - 14868, XP002939285, DOI: doi:10.1073/pnas.95.25.14863
GLINSKY G.V. ET AL.: "Microarray analysis identifies a death-from-cancer signature predicting therapy failure in patients with multiple types of cancer", THE JOURNAL OF CLINICAL INVESTIGATION, vol. 115, no. 6, June 2005 (2005-06-01), pages 1503 - 1521, XP002460132 *
HOLMBERG L ET AL.: "A randomized trial comparing radical prostatectomy with watchful waiting in early prostate cancer", N ENGL J MED, vol. 347, no. 11, 2002, pages 781 - 789
ISAACS W ET AL.: "Focus on prostate cancer", CANCER CELL, vol. 2, no. 2, 2002, pages 113 - 116
JEMAL A ET AL.: "Cancer Statistics, 2005.", CA CANCER J CLIN, vol. 55, no. 1, 2005, pages 10 - 30
JOHANSSON JE ET AL.: "Natural history of early, localized prostate cancer", JAMA
LAHAD J.P. ET AL.: "Stem cell-ness: a "magic marker" for cancer", THE JOURNAL OF CLINICAL INVESTIGATION, vol. 115, no. 6, June 2005 (2005-06-01), pages 1463 - 1467, XP003018693 *
LAPOINTE J ET AL.: "Gene expression profiling identifies clinically relevant subtypes of prostate cancer", PROC NATL ACAD SCI USA, vol. 101, no. 3, 2004, pages 811 - 816, XP002395334, DOI: doi:10.1073/pnas.0304146101
PEROU CM ET AL.: "Molecular portraits of human breast tumours", NATURE, vol. 406, no. 6797, 2000, pages 747 - 752, XP008138703, DOI: doi:10.1038/35021093
See also references of EP2052089A4
SHERLOCK G; OF FISH, NAT METHODS, vol. 2, no. 5, 2005, pages 329 - 330
SINGH R ET AL.: "Microarray based comparison of three amplification methods for nanogram amounts of total RNA", AM J PHYSIOL CELL PHYSIOL, 2004
SORLIE T ET AL.: "Gene expression patterns of breast carcinomas distinguish tumor subclasses with clinical implications", PROC NATL ACAD SCI USA, vol. 98, no. 19, 2001, pages 10869 - 10874, XP002215483, DOI: doi:10.1073/pnas.191367098
SPERGER J.M. ET AL.: "Gene expression patterns in human embryonic stem cells and human pluripotent germ cell tumors", PNAS, vol. 100, no. 23, 11 November 2003 (2003-11-11), pages 13350 - 13355, XP002350244 *
TUSHER VG ET AL.: "Significance analysis ofmicroarrays applied to the ionizing radiation response", PROC NATL ACAD SCI USA, vol. 98, no. 9, 2001, pages 5116 - 5121
VAN DE VIJVER MJ ET AL.: "A gene-expression signature as a predictor of survival in breast cancer", N ENGL J MED, vol. 347, no. 25, 2002, pages 1999 - 2009, XP008032093, DOI: doi:10.1056/NEJMoa021967
VAN'T VEER LJ ET AL.: "Gene expression profiling predicts clinical outcome of breast cancer", NATURE, vol. 415, no. 6871, 2002, pages 530 - 536, XP008138701, DOI: doi:10.1038/415530a
VARAMBALLY S ET AL.: "The polycomb group protein EZH2 is involved in progression of prostate cancer", NATURE, vol. 419, no. 6907, 2002, pages 624 - 629, XP002969193, DOI: doi:10.1038/nature01075

Cited By (23)

* Cited by examiner, † Cited by third party
Publication number Priority date Publication date Assignee Title
US8906864B2 (en) 2005-09-30 2014-12-09 AbbVie Deutschland GmbH & Co. KG Binding domains of proteins of the repulsive guidance molecule (RGM) protein family and functional fragments thereof, and their use
US9605069B2 (en) 2008-02-29 2017-03-28 AbbVie Deutschland GmbH & Co. KG Antibodies against the RGM a protein and uses thereof
US8962803B2 (en) 2008-02-29 2015-02-24 AbbVie Deutschland GmbH & Co. KG Antibodies against the RGM A protein and uses thereof
US10316085B2 (en) 2008-11-14 2019-06-11 Children's Medical Center Corporation Therapeutic and diagnostic methods relating to cancer stem cells
EP2356446A4 (en) * 2008-11-14 2014-03-19 Brigham & Womens Hospital DIAGNOSTIC AND THERAPEUTIC METHODS RELATING TO CANCER STEM CELLS
US11542328B2 (en) 2008-11-14 2023-01-03 The Brigham And Women's Hospital, Inc. Therapeutic and diagnostic methods relating to cancer stem cells
EP3978928A1 (en) * 2008-11-14 2022-04-06 The Brigham and Women's Hospital, Inc. Therapeutic and diagnostic methods relating to cancer stem cells
EP3130923A1 (en) * 2008-11-14 2017-02-15 The Brigham and Women's Hospital, Inc. Therapeutic and diagnostic methods relating to cancer stem cells
WO2011025542A1 (en) * 2009-08-31 2011-03-03 Ludwig Institute For Cancer Research Ltd. Seromic analysis of ovarian cancer
US9175075B2 (en) 2009-12-08 2015-11-03 AbbVie Deutschland GmbH & Co. KG Methods of treating retinal nerve fiber layer degeneration with monoclonal antibodies against a retinal guidance molecule (RGM) protein
CN104024436A (en) * 2011-10-24 2014-09-03 纯德赛尔医药公司 Marker genes for prostate cancer classification
CN104024436B (en) * 2011-10-24 2016-10-19 纯德赛尔医药公司 Marker genes for prostate cancer classification
US12060617B2 (en) 2011-10-24 2024-08-13 Prostatype Genomics Ab Marker genes for prostate cancer classification
JP2015501151A (en) * 2011-10-24 2015-01-15 チュンドセル・メディカルズ・エービーChundsell Medicals AB Marker genes for classification of prostate cancer
US9790555B2 (en) 2011-10-24 2017-10-17 Chundsell Medicals Ab Marker genes for prostate cancer classification
US20140243433A1 (en) * 2011-10-24 2014-08-28 Chundsell Medicals Ab Marker genes for prostate cancer classification
WO2013060739A1 (en) 2011-10-24 2013-05-02 Chundsell Medicals Ab Marker genes for prostate cancer classification
US20210017606A1 (en) * 2011-10-24 2021-01-21 Chundsell Medicals Ab Marker Genes for Prostate Cancer Classification
US9365643B2 (en) 2012-01-27 2016-06-14 AbbVie Deutschland GmbH & Co. KG Antibodies that bind to repulsive guidance molecule A (RGMA)
US10106602B2 (en) 2012-01-27 2018-10-23 AbbVie Deutschland GmbH & Co. KG Isolated monoclonal anti-repulsive guidance molecule A antibodies and uses thereof
US9102722B2 (en) 2012-01-27 2015-08-11 AbbVie Deutschland GmbH & Co. KG Composition and method for the diagnosis and treatment of diseases associated with neurite degeneration
US12448461B2 (en) 2018-04-25 2025-10-21 Children's Medical Center Corporation ABCB5 ligands and substrates
US12460260B2 (en) 2019-05-23 2025-11-04 The Board Of Trustees Of Leland Stanford Junior University Methods utilizing single cell genetic data for cell population analysis and applications thereof

Also Published As

Publication number Publication date
EP2052089A4 (en) 2010-05-05
AU2007277508A1 (en) 2008-01-31
CA2659231A1 (en) 2008-01-31
US20100009858A1 (en) 2010-01-14
AU2007277508A2 (en) 2009-05-14
IL196774A0 (en) 2009-11-18
EP2052089A1 (en) 2009-04-29

Similar Documents

Publication Publication Date Title
WO2008013492A1 (en) Embryonic stem cell markers for cancer diagnosis and prognosis
JP7042784B2 (en) How to Quantify Prostate Cancer Prognosis Using Gene Expression
Bibikova et al. Expression signatures that correlated with Gleason score and relapse in prostate cancer
JP4938672B2 (en) Methods, systems, and arrays for classifying cancer, predicting prognosis, and diagnosing based on association between p53 status and gene expression profile
US20110224313A1 (en) Compositions and methods for classifying lung cancer and prognosing lung cancer survival
JP2009528825A (en) Molecular analysis to predict recurrence of Dukes B colorectal cancer
JP2008521412A (en) Lung cancer prognosis judging means
EP1754795A1 (en) Predicting bone relapse of breast cancer
JP2014516531A (en) Biomarkers for lung cancer
CN103403543A (en) Colon cancer gene expression signatures and methods of use
US20090192045A1 (en) Molecular staging of stage ii and iii colon cancer and prognosis
WO2015073949A1 (en) Method of subtyping high-grade bladder cancer and uses thereof
US20160222461A1 (en) Methods and kits for diagnosing the prognosis of cancer patients
Gao et al. Clinical significance of multiple gene detection with a 22-gene panel in formalin-fixed paraffin-embedded specimens of 207 colorectal cancer patients
JP6106257B2 (en) Diagnostic methods for determining the prognosis of non-small cell lung cancer
US8728738B2 (en) Method for predicting clinical outcome of patients with non-small cell lung carcinoma
US20200370122A1 (en) Immune index methods for predicting breast cancer outcome
US20210404018A1 (en) Unbiased dna methylation markers define an extensive field defect in histologically normal prostate tissues associated with prostate cancer: new biomarkers for men with prostate cancer
JP7471601B2 (en) Molecular signatures and their use for identifying low-grade prostate cancer - Patents.com
JP2014501496A (en) Signature of clinical outcome in gastrointestinal stromal tumor and method of treatment of gastrointestinal stromal tumor
Furge et al. Gene expression profiling in kidney cancer: combining differential expression and chromosomal and pathway analyses
Parker Clinical implementation of breast cancer genomics

Legal Events

Date Code Title Description
DPE2 Request for preliminary examination filed before expiration of 19th month from priority date (pct application filed from 20040101)
121 Ep: the epo has been informed by wipo that ep was designated in this application

Ref document number: 07769001

Country of ref document: EP

Kind code of ref document: A1

WWE Wipo information: entry into national phase

Ref document number: 2007277508

Country of ref document: AU

WWE Wipo information: entry into national phase

Ref document number: 173/MUMNP/2009

Country of ref document: IN

ENP Entry into the national phase

Ref document number: 2659231

Country of ref document: CA

WWE Wipo information: entry into national phase

Ref document number: 12375177

Country of ref document: US

NENP Non-entry into the national phase

Ref country code: DE

ENP Entry into the national phase

Ref document number: 2007277508

Country of ref document: AU

Date of ref document: 20070716

Kind code of ref document: A

WWE Wipo information: entry into national phase

Ref document number: 2007769001

Country of ref document: EP

NENP Non-entry into the national phase

Ref country code: RU