WO2009093453A1 - 分析装置および分析方法 - Google Patents
分析装置および分析方法 Download PDFInfo
- Publication number
- WO2009093453A1 WO2009093453A1 PCT/JP2009/000219 JP2009000219W WO2009093453A1 WO 2009093453 A1 WO2009093453 A1 WO 2009093453A1 JP 2009000219 W JP2009000219 W JP 2009000219W WO 2009093453 A1 WO2009093453 A1 WO 2009093453A1
- Authority
- WO
- WIPO (PCT)
- Prior art keywords
- light
- concentration
- luminance
- specimen
- correction
- Prior art date
- Legal status (The legal status is an assumption and is not a legal conclusion. Google has not performed a legal analysis and makes no representation as to the accuracy of the status listed.)
- Ceased
Links
Images


Classifications
-
- G—PHYSICS
- G01—MEASURING; TESTING
- G01N—INVESTIGATING OR ANALYSING MATERIALS BY DETERMINING THEIR CHEMICAL OR PHYSICAL PROPERTIES
- G01N21/00—Investigating or analysing materials by the use of optical means, i.e. using sub-millimetre waves, infrared, visible or ultraviolet light
- G01N21/17—Systems in which incident light is modified in accordance with the properties of the material investigated
- G01N21/25—Colour; Spectral properties, i.e. comparison of effect of material on the light at two or more different wavelengths or wavelength bands
- G01N21/251—Colorimeters; Construction thereof
- G01N21/253—Colorimeters; Construction thereof for batch operation, i.e. multisample apparatus
-
- G—PHYSICS
- G01—MEASURING; TESTING
- G01N—INVESTIGATING OR ANALYSING MATERIALS BY DETERMINING THEIR CHEMICAL OR PHYSICAL PROPERTIES
- G01N21/00—Investigating or analysing materials by the use of optical means, i.e. using sub-millimetre waves, infrared, visible or ultraviolet light
- G01N21/17—Systems in which incident light is modified in accordance with the properties of the material investigated
- G01N21/25—Colour; Spectral properties, i.e. comparison of effect of material on the light at two or more different wavelengths or wavelength bands
- G01N21/27—Colour; Spectral properties, i.e. comparison of effect of material on the light at two or more different wavelengths or wavelength bands using photo-electric detection ; circuits for computing concentration
- G01N21/274—Calibration, base line adjustment, drift correction
-
- G—PHYSICS
- G01—MEASURING; TESTING
- G01N—INVESTIGATING OR ANALYSING MATERIALS BY DETERMINING THEIR CHEMICAL OR PHYSICAL PROPERTIES
- G01N21/00—Investigating or analysing materials by the use of optical means, i.e. using sub-millimetre waves, infrared, visible or ultraviolet light
- G01N21/84—Systems specially adapted for particular applications
- G01N21/8483—Investigating reagent band
Definitions
- the present invention relates to an analysis apparatus and an analysis method using a light detection element and an image sensor, and more particularly to a technique for reducing measurement errors in the analysis apparatus and the analysis method.
- FIG. 21 shows a configuration of a conventional analyzer that obtains concentration information by acquiring light from a specimen carried on a test piece with a light detection element through an optical system.
- a conventional analyzer light from a light source 2 such as an LED is irradiated onto a test piece 1 carrying a specimen, and scattered light, transmitted light, or reflected light from the test piece 1 is applied to a lens 3 and an aperture 4.
- a light detection element such as an image sensor 5 through an optical system configured by the above, and the concentration of the specimen 7 carried on the test piece 1 is quantified by the received light quantity 6 of the light detection element (for example, (See JP-A-7-5110).
- the received light quantity distribution 10 (see FIG. 22C) of the light detection element is the light quantity distribution 8 (see FIG. 22A) of the light source 2 with respect to the wavelength to be detected. Determined by the product of the scattered light (or transmitted light or reflected light) characteristic 9 (see FIG. 22B).
- the concentration of the specimen 7 based on the received light amount of the light detection element and use it as a measurement value.
- a narrow band light source such as a monochromatic LED is often used.
- the light quantity distribution 8 of the light source 2 changes with respect to the wavelength due to factors such as temperature change and current change of the light source 2.
- the light source 2 is an LED
- the amount of light received by the light detection element also changes, resulting in an error in the measured value (for example, as described above, the light from the light source 2 is in the short wavelength direction).
- the shift is made, the amount of light received by the light detection element decreases, resulting in a lower measurement value).
- the light amount distribution 8 of the light source 2 is narrower, and as the amount of change in the light amount distribution 8 of the light source 2 is larger, the change in the amount of received light at the light detection element is larger, so the measurement error is larger. .
- the present invention solves the problems in the conventional analyzer, and can reduce measurement errors even when the light quantity distribution of the light source with respect to the wavelength changes due to factors such as temperature change and current change.
- the purpose is to provide.
- the present invention further provides an analysis method and an analysis apparatus that can reduce measurement errors due to the incident angle dependency of the optical filter, and an analysis method and analysis apparatus that can reduce measurement errors by performing correction corresponding to the concentration of the specimen.
- the purpose is to provide.
- the analyzer of the present invention acquires light from a sample carried on a test piece by a light detection element through an optical system including a lens, a diaphragm, and the like.
- the analysis apparatus for obtaining the concentration information of the light source includes a broadband light source for illuminating the test piece, and an optical filter for arbitrarily selecting the wavelength of light acquired by the light detection element.
- the light amount distribution with respect to the wavelength of the light source is generally Therefore, by using a broadband light source and selecting the wavelength of the light acquired by the light detection element using an optical filter, the light quantity distribution of the light source changes with respect to the wavelength due to factors such as temperature changes and current changes. Even if it occurs, the change in the amount of light received by the light detection element can be suppressed to a small extent, and the error in the measured value can be reduced.
- the present invention has a wavelength characteristic in which the light from the specimen has a change with respect to the wavelength, and as a broadband light source, the light quantity with respect to the wavelength is opposite to or opposite to the wavelength characteristic of the light from the specimen. This is characterized in that a material having a close wavelength characteristic is used.
- the present invention is characterized in that a broadband light source having a wavelength characteristic with a small change in light quantity with respect to the wavelength is used.
- the present invention is characterized in that an optical filter that can select only a flat or small wavelength band with a change amount with respect to the wavelength is used.
- the present invention is an analysis method for obtaining concentration information of the specimen by receiving light from the specimen carried on the test piece through an optical system having an optical filter by an image sensor having a plurality of pixels, A filter incident angle detecting step for detecting a filter incident angle of light that forms an image on the pixel, and a shift amount acquiring step for obtaining a shift amount of a filter band of the optical filter corresponding to the filter incident angle; A correction coefficient setting step for setting a correction coefficient according to the amount, a correction step for correcting a luminance value or a value corresponding to the luminance value using the correction coefficient, and a correction value of the sample based on the correction value corrected in the correction step. And a density acquisition step for obtaining density information.
- the present invention is an analyzer that obtains concentration information of the specimen by receiving light from the specimen carried on the test piece through an optical system having an optical filter by an image sensor having a plurality of pixels.
- Filter incident angle detecting means for detecting the filter incident angle of light that forms an image on the pixel and incident on the optical filter
- shift amount acquiring means for obtaining the shift amount of the filter band of the optical filter corresponding to the filter incident angle
- the shift A correction coefficient setting means for setting a correction coefficient according to the amount
- a correction means for correcting a luminance value or a value corresponding to the luminance value using the correction coefficient
- a correction value of the sample based on the correction value corrected by the correction means.
- a density acquisition means for obtaining density information.
- the analysis method and the analysis apparatus even when the specimen of the test piece is imaged by the image sensor and the light to the pixel of the image sensor passes through the optical filter at an incident angle (tilt), According to the incident angle of light to the pixel, the filter band shift amount and the correction coefficient of the optical filter corresponding to the incident angle of the filter are obtained, and the concentration information of the specimen is corrected well. Measurement errors due to angle dependency can be reduced.
- the analysis method of the present invention is an analysis method in which light from a specimen carried on a test piece is received by an image sensor having a plurality of pixels through an optical system having an optical filter to obtain concentration information of the specimen.
- the brightness value obtained at an arbitrary position in the image sensor is determined in advance for the specimens supported at various known concentrations on the test piece, depending on the wavelength characteristics of the light from the specimen and the filter incident angle dependency.
- a fourth step of calculating a corresponding correction function of the filter incident angle dependency, and a luminance obtained for a sample of unknown concentration to be measured separately carried on the test piece was obtained in the fourth step.
- the fifth step of correcting using the correction function corresponding to the reference density and calculating the density information using the corrected luminance, and the density information obtained in the fifth step to the third step The sixth step for obtaining the concentration correction coefficient of the sample to be measured by referring to the straight line obtained in this way, and the concentration correction coefficient obtained in the sixth step are obtained in the fourth step.
- the correction function corresponding to the reference concentration is integrated, the luminance of the sample to be measured is corrected using the corrected correction function, and the concentration information of the sample to be measured is obtained again using the corrected luminance.
- the analyzer of the present invention is an analyzer that obtains concentration information of the specimen by receiving light from the specimen carried on the test piece by an image sensor having a plurality of pixels through an optical system having an optical filter.
- the brightness value obtained at an arbitrary position in the image sensor is calculated in advance based on the wavelength characteristics of the light from the specimen and the filter incident angle dependency for the specimens carried at various known concentrations on the test piece.
- Brightness calculating means a first correction coefficient calculating means for calculating a correction coefficient for matching the brightness distribution obtained for each density by the brightness calculating means with the brightness distribution of an arbitrary reference density, and the first Based on the straight line approximation means for plotting the correction coefficient obtained for each density by the single correction coefficient calculation means against the density information and linearly approximating it, and based on the luminance distribution of the reference density.
- Correction function calculation means for calculating a correction function of the filter incident angle dependence corresponding to the reference concentration, and the luminance obtained for the sample of unknown concentration to be measured separately carried on the test piece by the correction function calculation means
- a density calculation unit that corrects using the correction function corresponding to the obtained reference density and calculates density information using the corrected luminance, and the density information obtained by the density calculation unit to the linear approximation unit.
- Second correction coefficient acquisition means for obtaining the concentration correction coefficient of the sample to be measured by referring to the straight line obtained in this manner, and the concentration correction coefficient obtained by the second correction coefficient acquisition means, the correction function Integration is performed on the correction function corresponding to the reference concentration obtained by the calculation means, the luminance of the sample to be measured is corrected using the corrected correction function, and the sample of the measurement target is corrected using the corrected luminance.
- Concentration It characterized by having a a concentration acquisition means for obtaining again.
- a light source for illuminating the test piece is a broadband light source having a broad wavelength, and the light intensity distribution of the light source is selected by selecting the wavelength of light acquired by the light detection element using an optical filter. Even when a change occurs with respect to the wavelength due to factors such as a temperature change and a current change, a change in the amount of light received by the light detection element can be suppressed to a small extent, and an error in the measured value can be reduced.
- the light quantity distribution of the light source and the wavelength of the specimen with respect to the wavelength to be detected By multiplying by the characteristic, it is possible to generate a wavelength band in which the change amount of the wavelength characteristic is flat or the change amount is small. Therefore, even when the light quantity distribution of the light source changes with respect to the wavelength due to factors such as temperature change and current change, the change in the received light quantity at the light detection element can be minimized, and the measured value The error can be reduced, and as a result, the reliability of the analyzer can be improved.
- the analysis method and the analysis apparatus of the present invention it is possible to reduce the measurement error due to the incident angle dependency of the optical filter, and the measurement accuracy and reliability when analyzing the specimen are improved.
- the figure which shows the wavelength characteristic of the broadband light source of the analyzer which concerns on the same Embodiment 1 The figure which shows the scattering characteristic of the sample of the analyzer which concerns on the same Embodiment 1
- the figure which shows the transmission wavelength characteristic of the optical filter of the analyzer which concerns on the same Embodiment 1 The figure which shows the wavelength characteristic of the received light quantity of the image sensor of the analyzer which concerns on the same Embodiment 1
- the figure which shows the scattering characteristic of the sample of the analyzer which concerns on the same Embodiment 2 The figure which shows the transmission wavelength characteristic of the optical filter of the analyzer which concerns on the same Embodiment 2
- the figure which shows the wavelength characteristic of the received light quantity of the image sensor of the analyzer which concerns on the same Embodiment 2 The front view which shows
- the figure which shows the relationship (characteristic) between the incident angle to the optical filter of the analyzer which concerns on the same Embodiment 3, and an analysis method, and a transmission band shift amount The figure which shows the wavelength characteristic of the brightness
- the figure explaining one step of the analysis method which concerns on Embodiment 4 of this invention The figure explaining 1 step of the analysis method which concerns on the same Embodiment 4
- the figure explaining another one step of the analysis method concerning Embodiment 4 The figure explaining another one step
- FIG. Diagram showing the wavelength characteristics of the light source of the analyzer The figure which shows the scattering characteristic of the sample of the same analyzer Diagram showing sensitivity distribution of image sensor of the analyzer Diagram showing the wavelength characteristics of luminance of the analyzer Diagram showing the wavelength characteristics of luminance in the same analyzer
- the figure which shows the transmission characteristic of the optical filter in the analyzer The figure which shows the wavelength characteristic of the luminance after optical filter transmission in the same analyzer Diagram showing the wavelength characteristics of luminance in the same analyzer
- the figure which shows the transmission characteristic of the optical filter in the analyzer The figure which shows the wavelength characteristic of the brightness
- luminance after the optical filter transmission in the analyzer The perspective view which shows roughly the state which measures a test piece with the analyzer as a comparative example (comparative example 2) with respect to Embodiment 4
- the figure which shows the correction method of the angle dependence of the optical filter by the same analysis method The figure which shows the correction result of the angle dependence of the optical filter by the same analysis method
- FIG. 1 is a diagram showing a schematic configuration of an analyzer according to Embodiments 1 and 2 of the present invention.
- the general configuration is the same as the configuration of the conventional analyzer shown in FIG. 21 (the same components are given the same reference numerals and the description thereof is omitted).
- the difference from the conventional analyzer is two points: a broadband light source 12 having a wide light quantity distribution with respect to the wavelength, and an optical filter 13 provided as a light source.
- the optical filter 13 is provided between the specimen 7 and the image sensor 5 as a light detection element (more specifically, in this embodiment, between the diaphragm 4 and the lens 3). It is inserted and arranged. Further, as the broadband light source 12, a broadband light source that can satisfactorily irradiate light with a wavelength in a band to be detected even when the temperature or current value of the broadband light source 12 fluctuates is used.
- FIG. 2A to 2C show the wavelength characteristics of the broadband light source 12, the specimen 7, and the optical filter 13, and FIG. 2A shows the light amount distribution of the broadband light source 12.
- the broadband light source 12 for example, there is a broadband LED exhibiting characteristics of a half-value width of 130 nm and a peak wavelength of 570 nm. Note that this type of light source (such as an LED) is not limited to a wide band or a narrow band.
- FIG. 2A shows a case where the light amount distribution of the broadband light source 12 is shifted from a state indicated by a dotted line to a state indicated by a solid line due to a change in temperature or current amount.
- FIG. 2B shows the scattering characteristics of the specimen 7 as a subject (scattering characteristics of the specimen 7 received by the image sensor 5). For example, if the color of the specimen 7 is red, the scattering intensity increases on the long wavelength side.
- FIG. 2C shows the transmittance distribution of the optical filter 13. As the optical filter 13, for example, a bandpass filter capable of limiting the transmission wavelength band is used. As described above, by using the broadband light source 12, the specimen 7, and the optical filter 13 having the wavelength characteristics shown in FIGS. 2A to 2C, these wavelength characteristics (characteristics shown in FIGS.
- the wavelength characteristics obtained by multiplying these wavelength characteristics are made as flat as possible. It is more desirable to combine such a broadband light source 12 and the specimen 7. For example, in the case of the specimen 7 whose scattering characteristic rises to the right with respect to the wavelength, when the broadband light source 12 that falls to the right with respect to the wavelength is selected, a product obtained by multiplying these wavelength characteristics (conceptually (A) ⁇ (B) (wavelength characteristics) approaches flat.
- the broadband light source 12 is obtained by multiplying these wavelength characteristics by using a wavelength light source having a wavelength characteristic opposite to that of the light from the specimen 7 or a wavelength characteristic close to that ((A ) ⁇ (B)) approaches a flat.
- the optical filter 13 is used to select a wavelength band having a flat wavelength characteristic ((A) ⁇ (B)) when the broadband light source 12 and the specimen 7 are combined.
- ) ⁇ (B) wavelength characteristics are desirably flat or a more gradual wavelength band.
- the band of the optical filter 13 is narrow. This is desirable, and as a result, fluctuations in wavelength characteristics can be suppressed for wavelengths transmitted through the optical filter 13.
- the broadband light source 12 and the specimen 7 The change with respect to the wavelength when combining (so-called conceptually (A) ⁇ (B) wavelength characteristics) is smaller than when a narrow-band light source is used (see FIGS. 23A to 23C), and optical
- the change in the amount of received light at the image sensor 5 is further reduced, that is, measured. The error can be reduced.
- a broadband light source 12 that is flat or close to the transmission band of the optical filter 13 may be used (Embodiment 2).
- the broadband light source 12 having the above characteristics, even if a wavelength shift occurs, the light amount in the transmission band of the optical filter 13 shown in FIG. As shown in FIG. 3D, the change in the amount of received light is inevitably small.
- the measurement error of the specimen 7 is 0.1% even when the wavelength shift of the broadband light source 12 occurs at ⁇ 6 nm. It is possible to keep within. Further, if the transmission band of the optical filter 13 is made narrower, the measurement error can be made smaller. As a result, the measurement error can be made extremely small, and the reliability is improved.
- the present invention is not limited to this, and a light receiving element such as a photodiode may be used as the light detection element.
- Embodiment 3 (Embodiment 3)
- an analysis method and an analysis apparatus according to Embodiment 3 of the present invention will be described in detail with reference to the drawings.
- the light from the light source (broadband light source) 12 is irradiated onto the test piece 1 on which the specimen 7 is carried, and the scattered light (or transmitted light or reflected light from the test piece 1 is irradiated.
- the image sensor 5 (which may be light) is irradiated to an image sensor 5 composed of a CCD or the like through an optical system including the lens 3, the diaphragm 4, the optical filter 13, and the like.
- the pixel O indicates the pixel at the position of the optical axis Z that is the central axis of the optical system
- the pixel a indicates the pixel that is off the optical axis).
- the analysis apparatus in order to obtain the concentration of the sample 7 carried on the test piece 1, light (scattered light amount, transmitted light amount, or reflected light amount) from the sample 7 is acquired by the pixels of the image sensor 5. is required.
- the pixel output value is a wavelength characteristic obtained from the product of the light amount of the light source 12, the scattering intensity of the specimen 7, and the sensitivity of the image sensor 5 in the light source 12, the specimen 7, and the image sensor 5 each having wavelength characteristics. Is obtained as an integral value in a range satisfying the transmission wavelength band of the optical filter 13.
- the light source 12 having a light amount distribution as shown in FIG. 25A with respect to the wavelength, the specimen 7 having the scattering characteristic as shown in FIG. 25B
- a wavelength characteristic representing luminance is obtained as a characteristic as shown in FIG. 25D.
- the wavelength characteristic as shown in FIG. 26A (same as the characteristic shown in FIG. 25D)
- the wavelength representing the luminance after transmission through the optical filter 13 The characteristics are as shown in FIG. 26C, and the integrated value (area of the hatched portion in FIG. 26C) is the pixel output value of the image sensor 5.
- the light (scattered light) from the specimen 7 existing on the optical axis Z enters the optical filter 13 substantially perpendicularly (that is, along the optical axis Z) and enters the pixel O.
- the scattered light of the specimen 7 away from the optical axis Z that forms an image on the pixel a has an incident angle ⁇ with respect to a perpendicular (optical axis Z) perpendicular to the optical filter 13.
- the optical filter 13 has a so-called incident angle dependency in which the transmission wavelength band is shifted in the negative direction according to the magnitude of the incident angle ⁇ of light. Therefore, as shown by a dotted line in FIG.
- the wavelength band of the imaged light is shifted in the negative direction compared to the pixel O.
- the wavelength characteristic of the luminance at the pixel a also shifts in the negative direction of the wavelength band, and has a change amount as shown in FIG. 27A with respect to the wavelength.
- the pixel output value at the pixel a also changes by the amount of change (decreases in the case shown in FIGS. 27A to 27C). That is, even with the same amount of light obtained from the same specimen 7, the pixel output value varies depending on the pixel position in the image sensor 5, resulting in a measurement error.
- the analyzer and the analysis method according to Embodiment 3 of the present invention deal with such a problem.
- FIG. 4 is a front view showing a schematic configuration of the analyzer according to the third embodiment of the present invention.
- the general configuration is the same as the configuration of the conventional analyzer shown in FIG. 24, and the same components are denoted by the same reference numerals and description thereof is omitted.
- this analyzer also has a light source (similar to the broadband light source 12 shown in FIG. 1) for irradiating the test piece 1 with light, but is omitted in FIG. It is.
- the analyzer according to the third embodiment of the present invention is different from the analyzer shown in FIGS. 24 to 27C in that the original correction for correcting the pixel output value from each pixel of the image sensor 5 is performed.
- a control unit (not shown) for executing the algorithm is provided.
- the control unit that executes the correction algorithm includes a filter incident angle detection unit that detects a filter incident angle of light that forms an image on the pixel and is incident on the optical filter 13, and a filter band of the optical filter 13 that corresponds to the filter incident angle.
- Shift amount obtaining means for obtaining a shift amount (movement amount), correction coefficient setting means for setting a correction coefficient corresponding to the shift amount, correction means for correcting a luminance value using the correction coefficient, and a corrected luminance value
- Concentration acquisition means for obtaining concentration information of the specimen based on the above.
- FIG. 4 is a diagram showing an optical path in an optical system including the lens 3, the diaphragm 4, the optical filter 13, and the like.
- the principal ray of light whose incident angle to the optical filter 13 is perpendicular, that is, 0 ° with respect to a perpendicular perpendicular to the optical filter 13, is defined as the optical axis Z of the optical system. It is assumed that the light from the specimen 7 located at is formed on the pixel O.
- the light that forms an image on the pixel O is a collection of light beams distributed innumerably in a cone with the opening 4a of the diaphragm 4 as a bottom surface, and therefore each light beam other than the optical axis is slightly applied to the optical filter 13. Although it has an incident angle (inclination angle with respect to the optical axis Z), it is assumed here that the aperture diameter is sufficiently small, that is, all light rays are approximated to one optical axis Z. . In this case, since the transmission band of the optical filter 13 corresponding to the pixel O has no incident angle dependency and is a transmission band as designed, the pixel output value obtained in the pixel O is a true value.
- H1 tan ⁇ 1 (H1 / L) (Formula 1)
- L is the distance between the test piece 1 and the stop 4 (distance between the test piece and the stop)
- H1 is the object height relative to the pixel a (the light of the portion of the specimen 7 corresponding to the pixel a in the test piece 1). Distance from the axis position).
- the object height H1 with respect to the pixel a can be obtained from the image height of the pixel a (distance from the center portion corresponding to the optical axis Z to the pixel a in the image sensor 5) H2 and the image magnification b of the optical system.
- the following (Formula 2) is obtained.
- a transmission band shift amount (transmission band movement amount) caused by the angle dependency of the optical filter 13 is obtained.
- the incident angle ⁇ to the optical filter 13 and the transmission band shift amount with respect thereto are determined as the specifications of the optical filter 13. For example, it is easy to measure as design data at the time of manufacturing the optical filter 13 or after obtaining the optical filter. Is available.
- the relationship between the incident angle ⁇ to the optical filter 13 and the transmission band shift amount draws a downward-sloping curve as shown in FIG. 5, for example.
- the transmission band shifts in the minus direction as the incident angle to the optical filter 13 increases. By referring to this graph, it is possible to know the wavelength band of the light focused on the pixel a.
- the graph shown in FIG. 6 is the wavelength characteristic of the luminance shown in FIG. 25D described above, and this characteristic represents the amount of change in measurement error due to the incident angle dependency of the optical filter 13, so that the correction coefficient is obtained. Uses this graph.
- the center wavelength of the wavelength band of light focused on the pixel O is ⁇ o
- this is the design value of the transmission band of the optical filter 13 as described above.
- the value of ⁇ a can be obtained from the incident angle and the transmission band shift amount.
- the luminance at the center wavelength ⁇ o and the center wavelength ⁇ a can be obtained from this graph, and is assumed to be Io and Ia, respectively.
- the luminance that should originally be obtained as the luminance Io in the pixel a is obtained as the luminance Ia by the transmission band shift due to the angle dependency of the optical filter 13, and the luminance is Io for correction. It is necessary to multiply the luminance Ia by such a correction coefficient. That is, the correction coefficient ⁇ a is as follows.
- ⁇ a Io / Ia (Formula 3)
- the pixel output value of the pixel a that is affected by the incident angle dependency of the optical filter 13 is multiplied by the correction coefficient ⁇ a.
- the luminance at each wavelength increases by the amount multiplied by the correction coefficient ⁇ a, and becomes the same level as the luminance at the pixel O. That is, the pixel output value at the pixel a, which is the integrated value of the luminance with respect to the wavelength, is also a pixel output value at the pixel O, that is, a value close to the true value, and the influence of the incident angle dependency of the optical filter 13 is corrected.
- the optical filter 13 can be brought close to an incident angle dependency. Further, a correction coefficient is calculated in the same process for other pixels on the image sensor 5, and the obtained pixel output value is multiplied by a correction coefficient corresponding to each pixel position, thereby obtaining the optical filter 13. Can be minimized.
- the correction coefficient to be held in each pixel may be one pattern.
- correction coefficients corresponding to the wavelength characteristics of the specimens 7 are prepared in advance, and the pattern of the correction coefficient may be changed for each specimen 7 each time.
- the incident angle to the optical filter 13 is obtained, the transmission band shift amount of the optical filter 13 with respect to the angle is obtained, and the corresponding pixel output value is multiplied by the correction coefficient obtained from the change in luminance with respect to the shift amount.
- the measurement error due to the incident angle dependency of the optical filter 13 can be reduced, and the measurement accuracy and reliability when analyzing the specimen 7 are improved. be able to.
- the measurement error in the absorbance widely used as an index for measuring the concentration of the subject (specimen 7) using light when the incident angle ⁇ to the optical filter 13 is about 30 degrees, In the case where the correction is not performed, the measurement error of the sample 7 is 5% or more.
- the measurement error of the concentration of the sample 7 is 0.2% to 0.3%. It became possible to suppress to.
- the luminance value is corrected using the correction coefficient, and the density information of the specimen 7 is obtained based on the luminance correction value.
- the present invention is not limited to this, and digital data corresponding to the luminance value is used. Etc. may be corrected, and the concentration information of the specimen 7 may be obtained based on the correction data.
- this analyzer irradiates the test piece 1 carrying the sample 7 with light from the light source 12, and may be scattered light (or transmitted light or reflected light from the test piece 1).
- an image sensor 5 such as a CCD through an optical system including the lens 3, the diaphragm 4, the optical filter 13, and the like to form an image, and the amount of light obtained at each pixel of the image sensor 5 is determined by the pixel. It is configured to quantify the concentration of the specimen 7 carried on the test piece 1 by converting to the brightness of and analyzing.
- the luminance having the wavelength characteristic of the specimen 7 and the wavelength characteristic of the light source 12 decreases as the distance from the optical axis decreases due to the angle dependency of the optical filter 13.
- the angle-dependent correction coefficient (refer to FIG. 29B) corresponding to the pre-calculated coloration position at the position (coloration A, B, C) of each color part. This is corrected by integrating the luminance (see FIG. 29A) (see FIG. 29C).
- a correction coefficient is derived using the wavelength characteristics of the specimen at a single concentration, and correction is performed.
- the change in luminance with respect to the distance from the optical axis has a characteristic that it increases as the concentration of the specimen 7 increases.
- this characteristic can be easily understood by normalizing the luminance distribution at each density with each peak luminance and comparing the normalized luminance distribution with respect to the peak luminance.
- the analyzer and the analysis method according to Embodiment 4 of the present invention deal with such a problem.
- the configuration of the analyzer according to the fourth embodiment is almost the same as that of the analyzer described with reference to FIG. 28, so FIG. 28 is used and the description thereof is omitted.
- the test piece 1 to be analyzed will be described on the assumption that a colored portion is provided similarly to the test piece 1 described with reference to FIG. 28 or FIG.
- the analyzer according to the fourth embodiment is different from the analyzer shown in FIG. 28 in that a controller (not shown) that executes a unique correction algorithm for correcting the pixel output value from each pixel of the image sensor 5. ) Is provided.
- This control unit obtains the specimen 7 carried at various known concentrations on the test piece 1 at an arbitrary position in the image sensor 5 depending on the wavelength characteristic of the light from the specimen 7 and the filter incident angle dependency.
- a luminance calculation means for calculating a luminance value to be obtained in advance, and a first correction for calculating a correction coefficient for matching the luminance distribution obtained for each density by the luminance calculation means with the luminance distribution of an arbitrary reference density therein
- Coefficient calculating means linear approximation means for plotting the correction coefficient obtained for each concentration by the first correction coefficient calculating means for its concentration information (for example, absorbance), and linearly approximating the luminance distribution of the reference concentration
- Correction function calculating means for calculating a correction function of the filter incident angle dependency corresponding to the reference concentration, and a sample 7 of an unknown concentration to be measured separately carried on the test piece.
- the obtained brightness is corrected using a correction function corresponding to the reference density obtained by the correction function calculating means, and density information is calculated using the corrected brightness, and obtained by the density calculating means.
- the second correction coefficient acquisition means that obtains the concentration correction coefficient of the sample 7 to be measured by referring to the straight line obtained by the linear approximation means and the second correction coefficient acquisition means The obtained concentration correction coefficient is integrated into a correction function corresponding to the reference concentration obtained by the correction function calculating means, and the luminance of the sample 7 to be measured is corrected using the corrected correction function.
- Concentration acquisition means for obtaining again the concentration information of the sample to be measured using the corrected luminance.
- the specimen 7 supported in various known concentrations on the reference test piece 1 in advance is obtained at an arbitrary position in the image sensor 5 depending on the wavelength characteristics of the light from the specimen 7 and the filter incident angle dependency.
- the luminance value to be obtained is calculated (first step).
- FIG. 8A is a graph showing the change rate of the luminance due to the angle dependency (corresponding to the distance from the optical axis) for each concentration of the specimen 7.
- the luminance distribution for each concentration of the sample 7 is expressed by a function F (r) of the distance r from the optical axis, the high concentration sample is the function F hi (r), the medium concentration sample is the function F m (r), and the low
- the concentration specimen is represented by the function F lo (r).
- a correction coefficient for matching the luminance distribution obtained for each density as described above with the luminance distribution of an arbitrary reference density is calculated (second step).
- a plurality of functions can be unified by defining a reference function and multiplying the other functions by a ratio with respect to the reference function.
- density correction coefficient ⁇ is obtained in advance.
- a function F m (r) related to a medium concentration sample is used as a reference function, a concentration correction coefficient ⁇ hi related to a high concentration sample, a concentration correction coefficient ⁇ m related to a medium concentration sample, and a concentration related to a low concentration sample. If the correction coefficient ⁇ lo is
- the density correction coefficient ⁇ is a constant value regardless of the distance r from the optical axis.
- the concentration correction coefficients ⁇ hi , 1, ⁇ lo obtained for each concentration as described above are plotted against the absorbance and linearly approximated (third step).
- concentration information absorbance proportional to the concentration (Lambert-Beer's law) is used.
- density correction coefficient ⁇ corresponding to all the densities.
- the absorbance is obtained by the following equation using the measurement unit luminance (obtained luminance) and the background luminance which is the reference luminance before change.
- FIG. 10 shows a test piece to be measured.
- Three colored parts (colored A1, colored B1, and colored C1) are arranged on the test piece 1 at appropriate intervals, and the concentration of the sample 7 to be measured carried on each of the colored parts is unknown. It is.
- the brightness obtained for the specimen 7 of each colored portion on the test piece 1 is calculated using the correction function g m (r) of the filter incident angle dependency corresponding to the reference density obtained in the fourth step.
- the density information is calculated using the corrected luminance (fifth step).
- the luminances of the coloring A1, the coloring B1, and the coloring C1 acquired by the image sensor are influenced by the filter incident angle dependency corresponding to the respective densities ( 11A), the angle dependency correction function g m (r) calculated in advance in the fourth step is added to the luminance of each colored portion to correct the filter incident angle dependency.
- FIG. 11B a luminance close to a true value to some extent can be obtained (see FIG. 11C).
- a concentration correction coefficient of the sample 7 having an unknown concentration to be measured is obtained (sixth step ). That is, as shown in FIG. 12, the density correction coefficients ⁇ A1 , ⁇ B1 , and ⁇ C1 corresponding to the absorbances Z A1 , Z B1 , and Z C1 are obtained with reference to the approximate straight line (FIG. 9) obtained previously.
- the density correction coefficient obtained in the sixth step is integrated with the correction function dependent on the filter incident angle corresponding to the reference density obtained in the fourth step, and the corrected correction function is obtained.
- the luminance of the sample 7 to be measured is corrected, and the concentration information of the sample 7 to be measured is obtained again using the corrected luminance (seventh step). That is, as shown in FIGS. 13A to 13C, the color dependence A1, B1,... Is added to the angle-dependent correction coefficient g m (r) (see FIG. 11B) obtained by the conventional reference function F m (r).
- the density correction coefficients ⁇ A1 , ⁇ B1 , and ⁇ C1 corresponding to the density of C1 are integrated, and are integrated into the luminance values of the colors A1, B1, and C1. Thereby, the brightness
- the target luminance in the figure indicates a correction value that has been corrected in accordance with the density.
- the absorbance is obtained again based on the correction value (target luminance), and the concentration information of the specimens 7 of the colors A1, B1, and C1 is obtained therefrom.
- the correction of the filter angle dependency in all the concentrations can be realized, and the error due to the filter angle dependency can be reduced.
- Embodiment 5 An analysis apparatus and analysis method according to Embodiment 5 of the present invention will be described with reference to FIGS.
- the configuration of the analyzer shown in FIG. 14 is substantially the same as that of the analyzer according to the fourth embodiment.
- each colored portion on the test piece 1 (denoted as colored A2, colored B2, and colored C2) carries a sample 7 having a different concentration (colored A2 has a high concentration).
- the color deviation B is a medium density
- the color C2 is a low density
- the positional deviation amount R is uniformly generated due to the positional deviation when the test piece 1 is installed.
- the calibration curve information is obtained by using values measured by varying the concentration of several steps at each position of the colors A2, B2 and C2 on the reference test piece, and the calibration curve information is used at the time of measurement.
- the density By converting the density, the influence of the angle dependency of the optical filter is reduced.
- provisional absorbances (Z A2 , Z B2 , and Z C2 ) are obtained from the luminances obtained with the colors A 2, B 2, and C 2 (luminances affected by the angle dependency are used as they are), and are shown in FIG.
- density correction coefficients ⁇ A2 , ⁇ B2 , ⁇ corresponding to the absorbances Z A2 , Z B2 , Z C2 of the colors A 2, B 2, and C 2 with reference to the approximate straight line obtained in advance see FIG. 18).
- C2 is calculated, and G A2 (r), G B2 (r), and G C2 (r) are calculated as follows.
- G m (r) is a correction function when the characteristic of the reference function F m (r) is used, and the calibration curve generation also uses the characteristic of the reference function F m (r).
- the correction functions G A2 (r) according to the densities of the colors A2, B2, and C2 are added to the luminance values obtained in the colors A2, B2, and C2.
- G B2 (r) and G C2 (r) are integrated.
- luminance of coloration A2, B2, C2 can be correct
- the target luminance in the figure indicates a correction value that has been corrected in accordance with the density.
- the absorbance is obtained again based on the above correction value (target luminance), and the concentration information of the specimens of the color A2, B2, and C2 is obtained therefrom.
- the luminance value is corrected using the correction coefficient, the absorbance corresponding to the corrected luminance value is obtained, and the concentration information of the specimen 7 is obtained based on this absorbance.
- the present invention is not limited to this. Instead, digital data or the like corresponding to the luminance value may be corrected, and concentration information of the specimen 7 may be obtained based on the correction data.
- the present invention relates to an analyzer and can be suitably used particularly for biochemical analysis.
- the present invention is not limited to this, and light from a sample immobilized on a test piece is detected through an optical system.
- the present invention can be applied to various types of analyzers that obtain density information by using an element.
- the analysis method and analysis apparatus according to the present invention are particularly useful for biochemical analysis methods and apparatuses that have a function of reducing measurement errors due to the incident angle dependence of an optical filter and require highly accurate concentration detection. is there.
- the analysis method and the analysis apparatus according to the present invention can reduce measurement errors due to differences in sample concentration, and further have a function of reducing measurement errors due to incident angle dependence of optical filters and color misregistration. Therefore, it is particularly useful for biochemical analysis methods and apparatuses that require highly accurate concentration detection.
Landscapes
- Physics & Mathematics (AREA)
- Life Sciences & Earth Sciences (AREA)
- Health & Medical Sciences (AREA)
- General Physics & Mathematics (AREA)
- Chemical & Material Sciences (AREA)
- Analytical Chemistry (AREA)
- Biochemistry (AREA)
- General Health & Medical Sciences (AREA)
- Immunology (AREA)
- Pathology (AREA)
- Spectroscopy & Molecular Physics (AREA)
- Molecular Biology (AREA)
- Engineering & Computer Science (AREA)
- Mathematical Physics (AREA)
- Theoretical Computer Science (AREA)
- Investigating Or Analysing Materials By Optical Means (AREA)
Abstract
試験片1内に固定化された検体7からの光をレンズ3、絞り4等により構成される光学系を通してイメージセンサ5にて取得し、濃度情報を得ることができる装置において、試験片1を照明するための広帯域光源12と、イメージセンサ5で取得する光の波長を任意に選択するための光学フィルタ13とを組み合わせることにより、光源12の光量分布の変化による測定誤差を低減することができる。
Description
本発明は、光検出素子やイメージセンサを用いた分析装置および分析方法に関し、より詳細には、分析装置および分析方法の測定誤差を低減する技術に関する。
試験片に坦持された検体からの光を、光学系を通して光検出素子にて取得し、濃度情報を得る従来の分析装置の構成を図21に示す。従来の分析装置では、LED等の光源2からの光を、検体が担持された試験片1に照射し、その試験片1からの散乱光、もしくは透過光、反射光を、レンズ3、絞り4等により構成される光学系を通してイメージセンサ5等の光検出素子にて取得し、その光検出素子の受光光量6により、試験片1に担持された検体7の濃度を定量化している(例えば、特開平7-5110号公報参照)。
この種の分析装置において、図22A~図22Cに示すように、光検出素子の受光光量分布10(図22C参照)は、検出する波長に対する光源2の光量分布8(図22A参照)と検体7の散乱光(または透過光もしくは反射光)特性9(図22B参照)との積によって決まる。この場合に、光源2の光量分布8に変化がなければ、光検出素子の受光光量により検体7の濃度を算出し、それを測定値とすることが可能である。なお、一般に、光源2としては、単色LEDなどの狭帯域光源が用いられる場合が多い。
しかしながら、図21に示すような分析装置においては、図23A~図23Cに示すように、光源2の光量分布8は、光源2の温度変化や電流変化等の要因によって波長に対して変化する性質がある(例えば光源2がLEDの場合、温度が高くなると、または電流量が大きくなると、短波長方向にシフトする性質がある)。したがって、光源2の温度や電流が変化すると、光検出素子での受光光量も変化してしまい、この結果、測定値に誤差が生じる(例えば、上述したように、光源2の光が短波長方向にシフトすると、光検出素子での受光光量が減少して、測定値が低めになる)という課題を有していた。また、光源2の光量分布8が狭帯域であるほど、また、光源2の光量分布8の変化量が大きいほど光検出素子での受光光量の変化も大きくなるため、測定誤差も大きくなっていた。
本発明は、前記従来の分析装置における課題を解決するもので、温度変化や電流変化等の要因によって波長に対する光源の光量分布に変化が生じた場合でも、測定誤差を低減することができる分析装置を提供することを目的とする。
また、本発明は、さらに、光学フィルタの入射角度依存性による測定誤差を低減できる分析方法および分析装置や、検体の濃度に対応した補正を行うことで測定誤差を低減できる分析方法及び分析装置を提供することを目的とする。
前記従来の課題を解決するために、本発明の分析装置は、試験片に坦持された検体からの光を、レンズ、絞り等により構成される光学系を通して光検出素子により取得して前記検体の濃度情報を得る分析装置であって、試験片を照明する広帯域光源と、光検出素子で取得する光の波長を任意に選択する光学フィルタとを備えたことを特徴としたものである。
上記構成のように、試験片を照明する光源として、波長が広帯域である広帯域光源を用いることで、単色の光源などの狭帯域光源を用いた場合と比較して、一般に光源の波長に対する光量分布の変化が小さいので、広帯域光源を用いるとともに光学フィルタにより光検出素子で取得する光の波長を選択することで、光源の光量分布が、温度変化や電流変化等の要因によって波長に対して変化を生じた場合でも、光検出素子での受光光量の変化を少なめに抑えることができて、測定値の誤差を低減できる。
また、本発明は、検体からの光が波長に対して変化を持った波長特性を有し、広帯域光源として、波長に対する光量が、前記検体からの光の波長特性とは逆の、または逆に近い波長特性を有するものを用いたことを特徴としたものである。
この構成により、検出する波長に対する光源の光量分布と検体の波長特性とを掛け合わせることにより波長特性の変化量のフラットな、または変化量の少ない波長帯域を生成することができる。したがって、光源の光量分布が、温度変化や電流変化等の要因によって波長に対して変化を生じた場合でも、光検出素子での受光光量の変化を最小限に抑えることができて、測定値の誤差を低減できる。
また、本発明は、広帯域光源として、波長に対して光量の変化が小さい波長特性のものを用いたことを特徴としたものである。
また、本発明は、光学フィルタとして、波長に対して変化量のフラットな、または少ない波長帯域のみを選択できるものを用いたことを特徴としたものである。
また、本発明は、試験片に担持された検体からの光を、光学フィルタを有する光学系を通して、複数の画素を備えたイメージセンサにより受けて前記検体の濃度情報を得る分析方法であって、画素に結像する光の、光学フィルタに入射するフィルタ入射角度を検出するフィルタ入射角度検出ステップと、フィルタ入射角度に対応する光学フィルタのフィルタ帯域のシフト量を得るシフト量取得ステップと、前記シフト量に応じた補正係数を設定する補正係数設定ステップと、前記補正係数を用いて輝度値または輝度値に相当する値を補正する補正ステップと、前記補正ステップで補正した補正値に基づいて検体の濃度情報を得る濃度取得ステップとを有することを特徴とする。
また、本発明は、試験片に担持された検体からの光を、光学フィルタを有する光学系を通して、複数の画素を備えたイメージセンサにより受けて前記検体の濃度情報を得る分析装置であって、画素に結像する光の、光学フィルタに入射するフィルタ入射角度を検出するフィルタ入射角度検出手段と、フィルタ入射角度に対応する光学フィルタのフィルタ帯域のシフト量を得るシフト量取得手段と、前記シフト量に応じた補正係数を設定する補正係数設定手段と、前記補正係数を用いて輝度値または輝度値に相当する値を補正する補正手段と、前記補正手段で補正した補正値に基づいて検体の濃度情報を得る濃度取得手段とを備えたことを特徴とする。
前記分析方法および分析装置によれば、試験片の検体をイメージセンサにより撮像して、イメージセンサの画素への光が光学フィルタに対して入射角度を有して(傾斜して)通る場合でも、この画素への光の入射角度に応じて、フィルタ入射角度に対応する光学フィルタのフィルタ帯域のシフト量および補正係数を得て、検体の濃度情報が良好に補正され、この結果、光学フィルタの入射角度依存性による測定誤差を低減することができる。
また、本発明の分析方法は、試験片に担持された検体からの光を、光学フィルタを有する光学系を通して、複数の画素を備えたイメージセンサにより受けて前記検体の濃度情報を得る分析方法であって、前記試験片上に種々の既知濃度で担持された検体につき、その検体からの光の波長特性及びフィルタ入射角度依存性により前記イメージセンサ内の任意の位置にて得られる輝度値を事前に算出する第1のステップと、前記第1のステップで濃度ごとに得られる輝度分布をその内の任意の基準濃度の輝度分布に一致させるための補正係数を算出する第2のステップと、前記第2のステップで濃度ごとに得られた補正係数をその濃度情報に対してプロットして直線近似する第3のステップと、前記基準濃度の輝度分布を基に、当該基準濃度に対応するフィルタ入射角度依存性の補正関数を算出する第4のステップと、前記試験片上に別途に担持された測定対象の未知濃度の検体につき得られる輝度を、前記第4のステップで得られた前記基準濃度に対応した補正関数を用いて補正し、補正後の輝度を用いて濃度情報を算出する第5のステップと、前記第5のステップで得られた濃度情報を前記第3のステップにて求めた直線へ参照させることで前記測定対象の検体の濃度補正係数を得る第6のステップと、前記第6のステップにて得られた濃度補正係数を、前記第4のステップにて得られた前記基準濃度に対応した補正関数に積算し、積算後の補正関数を用いて前記測定対象の検体の輝度を補正し、補正後の輝度を用いて前記測定対象の検体の濃度情報を再度得る第7のステップと、を有することを特徴とする。
また本発明の分析装置は、試験片に担持された検体からの光を、光学フィルタを有する光学系を通して、複数の画素を備えたイメージセンサにより受けて前記検体の濃度情報を得る分析装置であって、前記試験片上に種々の既知濃度で担持された検体につき、その検体からの光の波長特性及びフィルタ入射角度依存性により前記イメージセンサ内の任意の位置にて得られる輝度値を事前に算出する輝度算出手段と、前記輝度算出手段により濃度ごとに得られる輝度分布をその内の任意の基準濃度の輝度分布に一致させるための補正係数を算出する第1の補正係数算出手段と、前記第1の補正係数算出手段で濃度ごとに得られた補正係数をその濃度情報に対してプロットして直線近似する直線近似手段と、前記基準濃度の輝度分布を基に、当該基準濃度に対応するフィルタ入射角度依存性の補正関数を算出する補正関数算出手段と、前記試験片上に別途に担持された測定対象の未知濃度の検体につき得られる輝度を、前記補正関数算出手段で得られた前記基準濃度に対応した補正関数を用いて補正し、補正後の輝度を用いて濃度情報を算出する濃度算出手段と、前記濃度算出手段で得られた濃度情報を前記直線近似手段にて求めた直線へ参照させることで前記測定対象の検体の濃度補正係数を得る第2の補正係数取得手段と、前記第2の補正係数取得手段にて得られた濃度補正係数を、前記補正関数算出手段にて得られた前記基準濃度に対応した補正関数に積算し、積算後の補正関数を用いて前記測定対象の検体の輝度を補正し、補正後の輝度を用いて前記測定対象の検体の濃度情報を再度得る濃度取得手段と、を有することを特徴とする。
本発明の分析装置によれば、試験片を照明する光源として波長が広帯域である広帯域光源を用いるとともに、光学フィルタにより光検出素子で取得する光の波長を選択することで、光源の光量分布が、温度変化や電流変化等の要因によって波長に対して変化を生じた場合でも、光検出素子での受光光量の変化を少なめに抑えることができて、測定値の誤差を低減できる。
また、広帯域光源として、波長に対する光量が、前記検体からの光の波長特性とは逆の、または逆に近い波長特性を有するものを用いることにより、検出する波長に対する光源の光量分布と検体の波長特性とを掛け合わせることで、波長特性の変化量のフラットな、または変化量の少ない波長帯域を生成することができる。したがって、光源の光量分布が、温度変化や電流変化等の要因によって波長に対して変化を生じた場合でも、光検出素子での受光光量の変化を最小限に抑えることができて、測定値の誤差を低減でき、この結果、分析装置の信頼性を向上させることができる。
また、本発明の分析方法および分析装置によれば、光学フィルタの入射角度依存性による測定誤差を低減することができて、検体を分析する際の測定精度および信頼性が向上する。
また、本発明の分析方法及び分析装置によれば、検体の濃度の違いによる測定誤差を低減することができ、測定精度及び信頼性が向上する。
(実施の形態1、2)
以下に、本発明の実施の形態1、2に係る分析装置を図面とともに詳細に説明する。
以下に、本発明の実施の形態1、2に係る分析装置を図面とともに詳細に説明する。
図1は、本発明の実施の形態1、2に係る分析装置の概略構成を示す図である。大まかな構成は、図21に示す従来の分析装置の構成と同じである(同じ構成要素には同符号を付してその説明は省略する)。しかし、従来の分析装置と異なる所は、光源として、波長に対する光量分布の広い広帯域光源12を使用した点と、光学フィルタ13を設けた点との2点である。
なお、この実施の形態では、光学フィルタ13を、検体7と、光検出素子としてのイメージセンサ5との間(より具体的には、この実施の形態では、絞り4とレンズ3との間)に挿入して配置している。また、広帯域光源12としては、この広帯域光源12の温度や電流値が変動した場合でも、少なくとも検出すべき帯域の波長の光を良好に照射できる広帯域のものが用いられる。
次に、広帯域光源12、検体7、光学フィルタ13の各波長特性について説明する。図2A~図2Cは広帯域光源12、検体7、光学フィルタ13の波長特性を示すものであり、図2Aは広帯域光源12の光量分布である。広帯域光源12としては、例えば半値幅130nm、ピーク波長570nmの特性を示す広帯域LEDなどがある。なお、この種の光源(LEDなど)は、広帯域または狭帯域に限らず、例えば、温度が高くなる、または電流量が大きくなると、点線部から実線部側に(すなわち短波長側に)波長特性がシフト(移動)する傾向があり、図2Aは、温度または電流量の変化により、広帯域光源12の光量分布が点線で示す状態から実線で示す状態にシフトした場合を示している。
また、図2Bは被写体となる検体7の散乱特性(イメージセンサ5により受ける検体7の散乱特性)を示しており、例えば検体7の色が赤であれば長波長側で散乱強度が大きくなる。また、図2Cは光学フィルタ13の透過率分布を示しており、光学フィルタ13として、例えば透過波長帯域を制限することが可能なバンドパスフィルタを用いる。以上、図2A~図2Cに示す波長特性を持つ広帯域光源12、検体7および光学フィルタ13を用いることで、これらの波長特性(図2A、図2B、図2Cに示す特性)が掛け合わされて(以下、このような状態を概念的に(A)×(B)×(C)などと称す)、イメージセンサ5での受光光量の分布は図2Dに示すようなものになる。
ここで、図2Aおよび図2Bに示す波長特性を有する広帯域光源12と検体7とを用いて、これらの波長特性を掛け合わせたもの((A)×(B))の波長特性ができるだけフラットになるような広帯域光源12と検体7とを組み合わせることがより望ましい。例えば、波長に対して散乱特性が右上がりの検体7であれば、波長に対して右下がりの広帯域光源12を選択すると、これらの波長特性を掛け合わせたもの(概念的には(A)×(B)の波長特性)はフラットに近づく。このように、広帯域光源12として、波長に対して検体7からの光とは逆の波長特性または逆に近い波長特性を有するものを用いることで、これらの波長特性を掛け合わせたもの((A)×(B))はフラットに近づくことになる。また、光学フィルタ13は、広帯域光源12と検体7とを組み合わせた際の波長特性((A)×(B))がフラットな波長帯域を選択するために用いるのであって、その帯域は(A)×(B)の波長特性がフラットもしくはより緩やかな波長帯域であることが望ましい。また、広帯域光源12と検体7とを組み合わせた際の波長特性(いわゆる概念的に(A)×(B)の波長特性)がフラットでない波長帯域を選択する場合は、光学フィルタ13の帯域は狭いほうが望ましく、これにより、光学フィルタ13を透過した波長については波長特性の変動を抑えることができる。
以上の構成であれば、温度変化や電流変化等の要因によって、広帯域光源12の光量分布が、図2Aにおける点線で示す状態から実線で示す状態にシフトした場合でも、広帯域光源12と検体7とを組み合わせた際の波長(いわゆる概念的に(A)×(B)の波長特性)に対する変化が、狭帯域の光源を用いた場合(図23A~図23C参照)に比べて小さくなり、しかも光学フィルタ13にて透過帯域を制限することで、図2Dに示すように、より一層イメージセンサ5での受光光量の変化(点線で示す状態から実線で示す状態へのシフト量)を小さく、つまり測定誤差を小さくすることができる。
また、図3Aに示すように、光学フィルタ13の透過帯域付近でフラットな、もしくはそれに近い特性を持つ広帯域光源12を用いてもよい(実施の形態2)。上記特性の広帯域光源12であれば、波長シフトが生じても、図3Cに示す光学フィルタ13の透過帯域(図3Cにおいて斜線で示す領域)内での光量は変化しない、もしくは変化が少ないため、図3Dに示すように受光光量の変化は必然的に小さくなる。
以下に、本発明の構成を用いた場合の効果を記載する。例えば、光を用いて被写体(検体7)の濃度を測定する指標として広く用いられている吸光度での測定誤差を考えると、従来の構成では、例えばピーク波長610nmで半値幅が15nmのLED光源に表されるように狭帯域な光源2(図23A~図23C参照)の波長シフトが-6nm起こった場合、検体7の測定誤差は5%以上にもなっている。しかし本発明の構成であれば、例えば600nmから625nmの透過帯域を持つ光学フィルタ13を用いた場合、広帯域光源12の波長シフトが-6nm起こった時でも、検体7の測定誤差は0.1%以内に抑えることが可能である。また光学フィルタ13の透過帯域をより狭くすれば、測定誤差はより小さくすることが可能である。これにより、測定誤差を極めて小さくすることができて、信頼性が向上する。
なお、上記実施の形態では、光検出素子としてイメージセンサ5を用いた場合を述べたが、これに限るものではなく、光検出素子としてフォトダイオードなどの受光素子を用いてもよい。
(実施の形態3)
以下に、本発明の実施の形態3に係る分析方法および分析装置を、図面とともに詳細に説明する。
以下に、本発明の実施の形態3に係る分析方法および分析装置を、図面とともに詳細に説明する。
ここで、本発明の実施の形態3に係る分析方法および分析装置について説明する前に、比較例(比較例1)としての分析装置や分析方法について、図24~図27Cを用いて説明する。
図24に示すように、この分析装置では、光源(広帯域光源)12からの光を、検体7が担持された試験片1に照射し、その試験片1からの散乱光(または透過光や反射光の場合もある)を、レンズ3、絞り4、光学フィルタ13等により構成される光学系を通して、CCDなどからなるイメージセンサ5に照射させて結像させ、イメージセンサ5の各画素(ここで、図24において、画素Oは光学系の中心軸線である光軸Zの位置にある画素を示し、画素aは光軸から外れた画素を示す)にて得られる光の光量を画素出力値に変換して分析することで、試験片1に担持された検体7の濃度を定量化するよう構成されている。
この構成の分析装置においては、試験片1に担持された検体7の濃度を求めるには検体7からの光(散乱光量、透過光量、または反射光量)をイメージセンサ5の画素にて取得することが必要である。その画素出力値は、それぞれ波長特性を持った光源12、検体7、およびイメージセンサ5において、光源12の光量と、検体7の散乱強度と、イメージセンサ5の感度との積から得られる波長特性のうち、光学フィルタ13の透過波長帯域を満たす範囲の積分値として得られる。
例えば、図25A~図25D、図26A~図26Cに示すように、波長に対して図25Aに示すような光量分布を持つ光源12と、図25Bに示すような散乱特性を持つ検体7と、図25Cに示すような感度分布を持つイメージセンサ5とを用いた場合、輝度を表す波長特性は図25Dに示すような特性として得られる。さらに、図26Aに示すような波長特性(図25Dに示す特性と同じ)において、図26Bに示すような透過特性を持つ光学フィルタ13により波長を制限すると、光学フィルタ13透過後の輝度を表す波長特性は、図26Cに示すようになり、その積分値(図26Cにおける斜線部の面積)がイメージセンサ5の画素出力値となる。
しかし、図24に示すように、光軸Z上に存在する検体7からの光(散乱光)は、光学フィルタ13に対してほぼ垂直に(すなわち光軸Zに沿って)入射して画素Oへ結像されるが、画素aへ結像される、光軸Zから離れた検体7の散乱光は、光学フィルタ13に直交する垂線(光軸Z)に対して入射角度θが生じる。この時、光学フィルタ13は光の入射角度θの大きさに応じて透過波長帯域がマイナスの方向へシフトする、いわゆる入射角度依存性を持っているため、図27Bにおいて点線で示すように、画素aにおいては画素Oに比べて結像される光の波長帯域がマイナスの方向へシフトしてしまう。その結果、図27Cに示すように、画素aでの輝度の波長特性もまた波長帯域がマイナスの方向へシフトし、しかも、波長に対して図27Aに示すような変化量を持っている場合は、その変化量分だけ画素aでの画素出力値も変化して(図27A~図27Cに示す場合は減少して)しまう。つまり、同一の検体7から得られる同一な光量の光であってもイメージセンサ5内の画素位置によって画素出力値が変わるため、測定誤差となってしまうという。
本発明の実施の形態3に係る分析装置および分析方法は、このような不具合に対処するものである。
図4は、本発明の実施の形態3に係る分析装置の概略構成を示す正面図である。大まかな構成は、図24に示す従来の分析装置の構成と同じであり、同じ構成要素には同符号を付してその説明は省略する。なお、従来の分析装置と同様に、この分析装置においても、試験片1に光を照射する光源(図1に示す広帯域光源12と同様なもの)を有しているが、図4においては省いている。
ここで、本発明の実施の形態3に係る分析装置が、図24~図27Cに示す分析装置と異なる点は、イメージセンサ5の各画素からの画素出力値に補正をかけるための独自の補正アルゴリズムを実行する制御部(図示せず)が設けられていることである。この補正アルゴリズムを実行する制御部には、画素に結像する光の、光学フィルタ13に入射するフィルタ入射角度を検出するフィルタ入射角度検出手段と、フィルタ入射角度に対応する光学フィルタ13のフィルタ帯域のシフト量(移動量)を得るシフト量取得手段と、前記シフト量に応じた補正係数を設定する補正係数設定手段と、前記補正係数を用いて輝度値を補正する補正手段と、補正輝度値に基づいて検体の濃度情報を得る濃度取得手段とを備えている。
前記補正アルゴリズムについて、以下に詳しく説明する。
まず、第一に、検体7からの光が光学フィルタ13を通過する時の入射角度を検出する。図4は、レンズ3、絞り4、光学フィルタ13等により構成される光学系における光路を示した図である。図4において、光学フィルタ13への入射角度が垂直、つまり光学フィルタ13に直交する垂線に対して0°となる光の主光線を光学系の光軸Zであると定義し、光軸Z上に位置する検体7からの光は画素Oへ結像するとする。ここで、画素Oに結像する光は、絞り4の開口部4aを底面とした円錐内に無数に分布する光線の集合であるため、光軸以外の各光線は光学フィルタ13への若干の入射角度(光軸Zに対する傾斜角度)を持っているが、ここでは絞り径が十分に小さい場合を仮定して、つまり全ての光線を1本の光軸Zに近似した場合で考えることにする。この場合、画素Oに対応する光学フィルタ13の透過帯域は入射角度依存性を持たず、設計値通りの透過帯域であるため、画素Oにて得られる画素出力値は真値である。
これに対して、光学フィルタ13への入射角度依存性を持つ画素aへ結像する光の場合、画素Oの場合と同様に、全ての光線を主光線に近似した場合で考えると、入射角度θは以下の(式1)のようになる。
θ=tan-1(H1/L) ・・・(式1)
ここで、Lは、試験片1と絞り4との間の距離(試験片・絞り間距離)、H1は画素aに対する物体高(試験片1における画素aに対応する検体7の部分の、光軸位置からの距離)である。
ここで、Lは、試験片1と絞り4との間の距離(試験片・絞り間距離)、H1は画素aに対する物体高(試験片1における画素aに対応する検体7の部分の、光軸位置からの距離)である。
また、画素aに対する物体高H1は、画素aの像高(イメージセンサ5における光軸にZ対応する中心部から画素aまでの距離)H2と、光学系の像倍率bとから求めることができ、以下の(式2)のようになる。
H1=H2/b ・・・(式2)
よって、(式1)および(式2)より、画素aに結像される光の入射角度θを求めることができる。
よって、(式1)および(式2)より、画素aに結像される光の入射角度θを求めることができる。
次に、光学フィルタ13の角度依存性によって起こる透過帯域シフト量(透過帯域移動量)を求める。光学フィルタ13への入射角度θとそれに対する透過帯域シフト量とは、光学フィルタ13の仕様として決まっており、例えば光学フィルタ13の製造時の設計データとして、また光学フィルタ入手後に測定することで容易に入手が可能である。光学フィルタ13への入射角度θと透過帯域シフト量との関係は、例えば図5に示すような右下がりの曲線を描く。特性として、光学フィルタ13への入射角度が大きくなるほど透過帯域はマイナス方向にシフトする。このグラフを参照することにより、画素aへ結像する光の波長帯域を知ることができる。
次に、透過帯域シフト量に応じた補正係数の求め方について図6を用いて説明する。図6に示すグラフは、上述した図25Dに示した輝度の波長特性であり、この特性が光学フィルタ13の入射角度依存性による測定誤差の変化量を表すものであるため、補正係数を求めるにはこのグラフを用いる。
まず、画素Oへ結像する光の波長帯域の中心波長をλoとすると、先ほど述べたようにこれは光学フィルタ13の透過帯域の設計値である。また、画素aへ結像する光の波長帯域の中心波長をλaとすると、λaの値は入射角度と透過帯域シフト量とにより求めることができる。中心波長λoおよび中心波長λaでの輝度は、このグラフより求めることができ、それぞれIo、Iaとする。これは画素aにおいて本来、輝度Ioとして得られるはずの輝度が光学フィルタ13の角度依存性による透過帯域シフトにより輝度Iaとして得られることを意味しており、補正を行うには輝度がIoとなるような補正係数を輝度Iaに乗算する必要がある。つまり、補正係数αaは以下のようになる。
αa=Io/Ia ・・・(式3)
最後に、上記補正係数を用いた補正方法について、図7を用いて説明する。図7に示すように、光学フィルタ13の入射角度依存性の影響を受けている画素aでの画素出力値に対して先ほどの補正係数αaを乗算する。すると各波長における輝度は補正係数αaを乗算した分だけ上がり、画素Oでの輝度と同じレベルになる。つまり、波長に対する輝度の積算値である画素aでの画素出力値もまた画素Oでの画素出力値、つまり真値と近い値になり、光学フィルタ13の入射角度依存性の影響は補正されて、光学フィルタ13の入射角度依存性が無い状態に近づけられる。また、イメージセンサ5上の他の画素においても同様の過程にて補正係数を算出し、得られた画素出力値に対してそれぞれの画素位置に対応した補正係数を乗算することで、光学フィルタ13の入射角度依存性の影響を最小限に抑えることができる。
最後に、上記補正係数を用いた補正方法について、図7を用いて説明する。図7に示すように、光学フィルタ13の入射角度依存性の影響を受けている画素aでの画素出力値に対して先ほどの補正係数αaを乗算する。すると各波長における輝度は補正係数αaを乗算した分だけ上がり、画素Oでの輝度と同じレベルになる。つまり、波長に対する輝度の積算値である画素aでの画素出力値もまた画素Oでの画素出力値、つまり真値と近い値になり、光学フィルタ13の入射角度依存性の影響は補正されて、光学フィルタ13の入射角度依存性が無い状態に近づけられる。また、イメージセンサ5上の他の画素においても同様の過程にて補正係数を算出し、得られた画素出力値に対してそれぞれの画素位置に対応した補正係数を乗算することで、光学フィルタ13の入射角度依存性の影響を最小限に抑えることができる。
例えば、検体7の波長特性が時間もしくは環境等によって変化しないものである場合、輝度の波長特性も変化しないものであるため、各画素で持っておく補正係数は1パターンでよい。また、検体7が数種類ある場合は、それぞれの検体7の波長特性に対応した補正係数を事前に作成しておき、各検体7に対してその都度、補正係数のパターンを変更すればよい。
以上のように、光学フィルタ13への入射角度を求め、その角度に対する光学フィルタ13の透過帯域シフト量を求め、そのシフト量に対する輝度の変化より求められた補正係数を対応する画素出力値へ乗算するというアルゴリズムを用いることで、イメージセンサ5上のどの画素においても真値に近い画素出力値を得ることができる。
このように、本発明の分析方法および分析装置によれば、光学フィルタ13の入射角度依存性による測定誤差を低減することができて、検体7を分析する際の測定精度および信頼性を向上させることができる。例えば、光を用いて被写体(検体7)の濃度を測定する指標として広く用いられている吸光度での測定誤差について観察した場合、光学フィルタ13への入射角度θが約30度の場合に、上記の補正を行わない場合には、検体7の測定誤差は5%以上あったが、上記アルゴリズムを用いて補正した場合には、検体7の濃度の測定誤差を0.2%~0.3%に抑えることが可能となった。
なお、上記実施の形態では、補正係数を用いて輝度値を補正し、この輝度補正値に基づいて検体7の濃度情報を得たが、これに限るものではなく、輝度値に相当するデジタルデータ等を補正し、この補正データに基づいて検体7の濃度情報を得てもよい。
(実施の形態4)
次に、本発明の実施の形態4に係る分析装置および分析装置について説明する。
次に、本発明の実施の形態4に係る分析装置および分析装置について説明する。
ここで、本発明の実施の形態4に係る分析装置および分析方法について説明する前に、比較例(比較例2)としての分析装置や分析方法について、図28~図32Cを用いて説明する。
図28に示すように、この分析装置は、光源12からの光を検体7が担持された試験片1に照射し、その試験片1からの散乱光(または透過光や反射光の場合もある)を、レンズ3、絞り4、光学フィルタ13等により構成される光学系を通してCCDなどからなるイメージセンサ5に照射させて結像させ、イメージセンサ5の各画素にて得られる光の光量を画素の輝度に変換して分析することで、試験片1に担持された検体7の濃度を定量化するよう構成されている。
この分析方法によれば、検体7の波長特性及び光源12の波長特性を持った輝度を取得する際に、光学フィルタ13の角度依存性により、光軸から離れる程輝度が小さくなるので、図29A~図29Cに示すように、予め算出しておいた呈色位置に対応する角度依存性補正係数(図29B参照)を各呈色部の位置(呈色A、B、Cと記す)での輝度(図29A参照)に積算することで、これを補正している(図29C参照)。
この図29A~図29Cに示す分析方法は、単一濃度での検体の波長特性を用いて補正係数を導き出し、補正を行うものである。しかし図30Aに示すように、光軸からの距離に対する輝度の変化は、検体7の濃度が大きいほど大きくなるという特性を持っている。この特性は、例えば図30Bに示すように、各濃度における輝度分布をそれぞれのピーク輝度にて正規化し、ピーク輝度に対する輝度変化率として比較すれば理解し易い。
しかし、図31に示すような、各呈色部で検体の濃度が異なる試験片にて測定を行う場合に(ここでは呈色Aは高濃度、呈色Bは中濃度、呈色Cは低濃度であるとする)、図32A~図32Cに示すように、単一濃度の検体7(例えば呈色Bの検体の濃度)で求めた補正係数にて角度依存性補正を行うと、呈色Aでは補正が不足し、呈色Cでは補正し過ぎることになり、測定値に誤差が生じる。
本発明の実施の形態4に係る分析装置および分析方法は、このような不具合に対処するものである。
この実施の形態4の分析装置の構成は、図28を用いて説明した分析装置とほぼ同様であるため、図28を援用し、その説明は省略する。分析対象の試験片1も、先に図28あるいは図31を用いて説明した試験片1と同様に呈色部が設けられるとして説明する。
この実施の形態4の分析装置が図28に示す分析装置と異なる点は、イメージセンサ5の各画素からの画素出力値に補正をかけるための独自の補正アルゴリズムを実行する制御部(図示せず)が設けられていることである。
この制御部は、試験片1上に種々の既知濃度で担持された検体7につき、その検体7からの光の波長特性及びフィルタ入射角度依存性により前記イメージセンサ5内の任意の位置にて得られる輝度値を事前に算出する輝度算出手段と、前記輝度算出手段により濃度ごとに得られる輝度分布をその内の任意の基準濃度の輝度分布に一致させるための補正係数を算出する第1の補正係数算出手段と、前記第1の補正係数算出手段で濃度ごとに得られた補正係数をその濃度情報(たとえば吸光度)に対してプロットして直線近似する直線近似手段と、前記基準濃度の輝度分布を基に、当該基準濃度に対応するフィルタ入射角度依存性の補正関数を算出する補正関数算出手段と、前記試験片上に別途に担持された測定対象の未知濃度の検体7につき得られる輝度を、前記補正関数算出手段で得られた前記基準濃度に対応した補正関数を用いて補正し、補正後の輝度を用いて濃度情報を算出する濃度算出手段と、前記濃度算出手段で得られた濃度情報を前記直線近似手段にて求めた直線へ参照させることで前記測定対象の検体7の濃度補正係数を得る第2の補正係数取得手段と、前記第2の補正係数取得手段にて得られた濃度補正係数を、前記補正関数算出手段にて得られた前記基準濃度に対応した補正関数に積算し、積算後の補正関数を用いて前記測定対象の検体7の輝度を補正し、補正後の輝度を用いて前記測定対象の検体の濃度情報を再度得る濃度取得手段と、を備えている。
以下、前記補正アルゴリズムについて詳述する。
事前に、基準とする試験片1上に種々の既知濃度で担持させた検体7につき、その検体7からの光の波長特性及びフィルタ入射角度依存性によりイメージセンサ5内の任意の位置にて得られる輝度値を算出する(第1のステップ)。
図8Aは、検体7の濃度ごとに、角度依存性(光軸からの距離に対応する)に起因した輝度の変化率をグラフ化したものである。既述したように、検体7の濃度が高いほど、角度依存性に起因する輝度の変化率は大きくなる。検体7の濃度ごとの輝度の分布を光軸からの距離rの関数F(r)で表すこととし、高濃度検体を関数Fhi(r)、中濃度検体を関数Fm(r)、低濃度検体を関数Flo(r)で表している。
次に、上記のように濃度ごとに得られた輝度分布をその内の任意の基準濃度の輝度分布に一致させるための補正係数を算出する(第2のステップ)。図8A、図8Bに示すように、基準の関数を定め、それ以外の関数には基準関数に対する比率を乗じることで、複数の関数を一元化することが可能なので、関数ごとに、基準関数に対する比率(以下、濃度補正係数αという)を事前に求めておくのである。例えば図示したように、中濃度検体に係る関数Fm(r)を基準関数とし、高濃度検体に係る濃度補正係数αhi、中濃度検体に係る濃度補正係数αm、低濃度検体に係る濃度補正係数αloとすると、
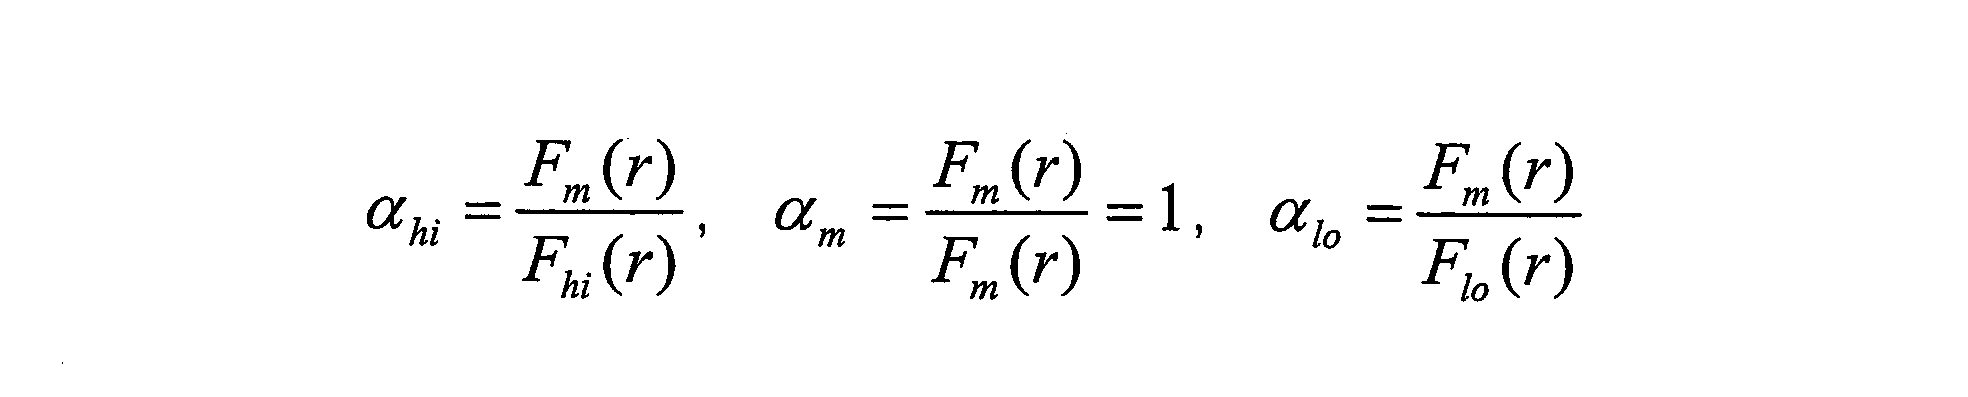
となる。光軸からの距離rがどの場合でも濃度補正係数αは一定値となる。これを満たす濃度補正係数αhi、αloをそれぞれ求めておくことで、Fhi(r)、Flo(r)をFm(r)に一元化することが可能となる。
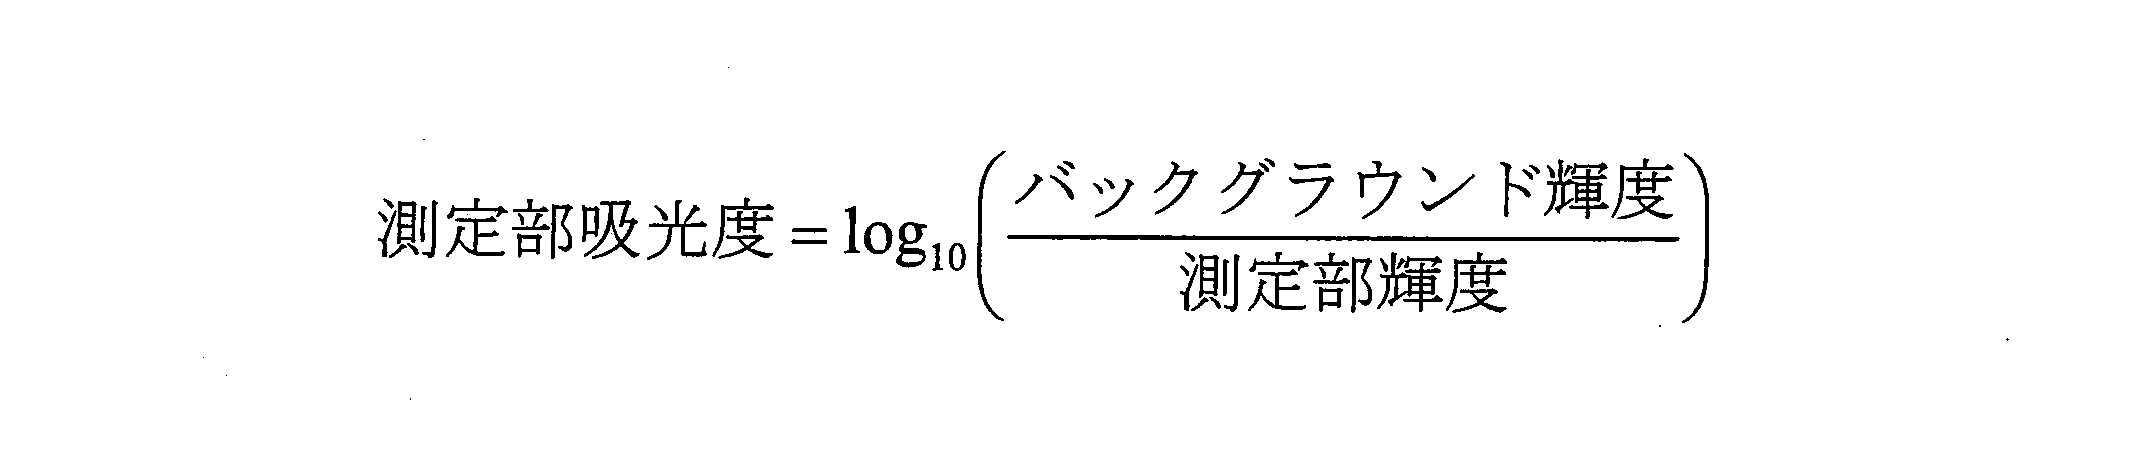
次に、図9に示すように、上記のように濃度ごとに得られた濃度補正係数αhi、1、αloを吸光度に対してプロットし、直線近似する(第3のステップ)。ここでは濃度を示す指標(濃度情報)として、濃度に比例する吸光度(Lambert-Beerの法則)を用いている。得られる直線近似結果に基いて、全ての濃度に対応した濃度補正係数αを算出することが可能となる。なお吸光度は測定部輝度(得られた輝度)及び変化前の基準輝度であるバックグラウンド輝度を用いて以下の式で求められる。
次に、基準濃度の輝度分布Fm(r)を基に、当該基準濃度に対応するフィルタ入射角度依存性の補正関数gm(r)を算出する(第4のステップ)。この方法は実施の形態3に詳記されているため説明は省略する。
以下、測定時の手順を説明する。
図10は測定対象の試験片を示す。試験片1上に適当間隔をおいて3つの呈色部(呈色A1、呈色B1、呈色C1と記す)が配置されており、それぞれに担持された測定対象の検体7の濃度は未知である。
この試験片1上の各呈色部の検体7につき得られる輝度を、前記第4のステップで得られた、前記基準濃度に対応したフィルタ入射角度依存性の補正関数gm(r)を用いて補正し、補正後の輝度を用いて濃度情報を算出する(第5のステップ)。図11A~図11Cを用いて説明すると、イメージセンサにて取得した呈色A1、呈色B1、呈色C1の輝度はそれぞれの濃度に対応したフィルタ入射角度依存性の影響を受けているが(図11A参照)、第4のステップにて事前に算出しておいた角度依存性補正関数gm(r)を各呈色部の輝度に積算して、フィルタ入射角度依存性の補正を行うことで(図11B参照)、ある程度真値に近い輝度が得られる(図11C参照)。得られた各呈色部の輝度を上記の式(数2)に適用することで、各呈色部の吸光度ZA1、ZB1、ZC1を算出する。
次に上記第5のステップで得られた吸光度を、上述の第3のステップにて求めた直線へ参照させることで前記測定対象の未知濃度の検体7の濃度補正係数を得る(第6のステップ)。つまり、図12に示すように、先に求めた近似直線(図9)を参照して、吸光度ZA1、ZB1、ZC1に対応する濃度補正係数αA1、αB1、αC1を求める。
そして、上記第6のステップで得られた濃度補正係数を、第4のステップにて得られた、前記基準濃度に対応したフィルタ入射角度依存性の補正関数に積算し、積算後の補正関数を用いて前記測定対象の検体7の輝度を補正し、補正後の輝度を用いて前記測定対象の検体7の濃度情報を再度得る(第7のステップ)。つまり、図13A~図13Cに示すように、従来の基準関数Fm(r)にて求めておいた角度依存性補正係数gm(r)(図11B参照)に、呈色A1、B1、C1の濃度に対応した濃度補正係数αA1、αB1、αC1を積算し、それを呈色A1、B1、C1の輝度値に積算する。これにより、呈色A1、B1、C1の輝度は濃度に応じた補正ができる。図中の目標輝度が、濃度に応じた補正がなされた補正値を示す。
その後に、上記の補正値(目標輝度)に基づいて再び吸光度を求め、それより、呈色A1、B1、C1の検体7の濃度情報を得る。ここで得られた吸光度用いて第6のステップと第7のステップを複数回繰り返すことで、より精度よく吸光度を求めることが可能である。
以上により、全ての濃度におけるフィルタ角度依存性の補正が実現でき、フィルタ角度依存性に起因する誤差の低減が可能となる。
(実施の形態5)
本発明の実施の形態5に係る分析装置および分析方法について図14~図20を用いて説明する。図14に示す分析装置の構成は実施の形態4に係る分析装置とほぼ同様である。
本発明の実施の形態5に係る分析装置および分析方法について図14~図20を用いて説明する。図14に示す分析装置の構成は実施の形態4に係る分析装置とほぼ同様である。
図14および図15において、試験片1上の各呈色部(呈色A2、呈色B2、呈色C2と記す)は、異なる濃度の検体7を担持しており(呈色A2は高濃度、呈色B2は中濃度、呈色C2は低濃度)、試験片1の設置時の位置ずれにより一律に位置ずれ量Rが生じている。
分析の際には、事前に、基準とする試験片上の呈色A2、B2、C2の各位置で数段階濃度を振って測定した値を検量線情報とし、測定時にその検量線情報を用いて濃度変換することで、光学フィルタの角度依存性の影響を低減させる。
ただし、上述の位置ずれが生じているので、図16A、図16Bに示すように、位置ずれがないときの輝度関数F(r)と、位置ずれ量Rが生じたときの輝度関数F(r-R)とを用いて、補正関数G(r)(=F(r-R)/F(r))を求め、これを用いて補正を行う。
なお、この方法は、単一濃度の検体に適するものであるため、図17に示すように、呈色A2、B2、C2の濃度に応じた補正関数GA2(r)、GB2(r)、GC2(r)を求める。
このために、図18に示すような呈色位置別の近似直線を事前に求めておく。この実施の形態2では、角度依存性の影響を受けた輝度をそのまま用いるので、図示したように呈色位置別に近似直線を求める。そのために濃度補正係数αを求める方法は実施の形態4と同様である。
そして、呈色A2、B2、C2にて得られる輝度(角度依存性の影響を受けた輝度をそのまま用いる)より仮の吸光度(ZA2、ZB2、ZC2とする)を求め、図19に示すように、事前に求めた近似直線(図18参照)を参照して、呈色A2、B2、C2の吸光度ZA2、ZB2、ZC2に対応した濃度補正係数αA2、αB2、αC2を求め、それを用いて以下のようにGA2(r)、GB2(r)、GC2(r)を算出する。
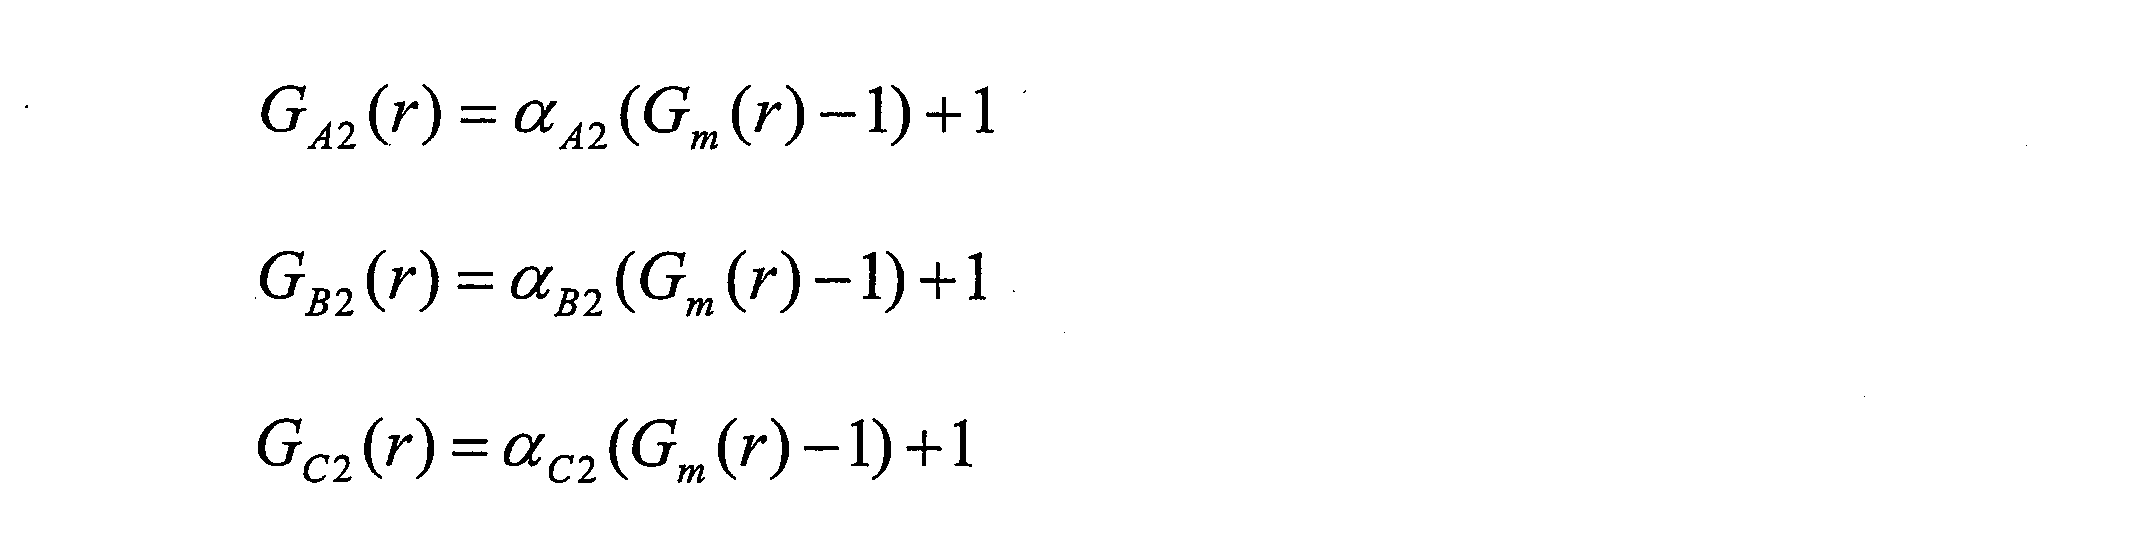
ここで、Gm(r)は基準関数Fm(r)の特性を用いた場合の補正関数であり、上述の検量線生成もこの基準関数Fm(r)の特性を用いている。
次に、図20A~図20Cに示すように、呈色A2、B2、C2にて得られた輝度値に、当該呈色A2、B2、C2の濃度に応じた補正関数GA2(r)、GB2(r)、GC2(r)を積算する。これにより、呈色A2、B2、C2の輝度は濃度に応じた補正ができる。図中の目標輝度が、濃度に応じた補正がなされた補正値を示す。
その後に、上記の補正値(目標輝度)に基づいて再び吸光度を求め、それより、呈色A2、B2、C2の検体の濃度情報を得る。
以上により、全ての濃度における試験片の位置ずれの補正が実現でき、位置ずれに起因する誤差の低減が可能となる。
なお、上記実施の形態では、補正係数を用いて輝度値を補正し、補正後の輝度値に対応する吸光度を求め、この吸光度に基づいて検体7の濃度情報を得たが、これに限るものではなく、輝度値に相当するデジタルデータ等を補正し、この補正データに基づいて検体7の濃度情報を得てもよい。
なお、本発明は、分析装置に係り、特に生化学分析に好適に利用できるものであるが、これに限るものではなく、試験片に固定化された検体からの光を、光学系を通して光検出素子にて取得し、濃度情報を得る各種の分析装置に適用できる。
また、本発明に係る分析方法および分析装置は、光学フィルタの入射角度依存性による測定誤差の低減機能を有し、高精度での濃度検出が必要な生化学分析方法および装置等に特に有用である。
また、本発明に係る分析方法および分析装置は、検体の濃度の違いによる測定誤差を低減することができ、さらには、光学フィルタの入射角度依存性、呈色位置ずれによる測定誤差の低減機能を有するので、高精度での濃度検出が必要な生化学分析方法および装置等に特に有用である。
Claims (8)
- 試験片に担持された検体からの光を、光学系を通して光検出素子により取得して前記検体の濃度情報を得る分析装置であって、試験片を照明する広帯域光源と、光検出素子で取得する光の波長を任意に選択する光学フィルタとを備えた分析装置。
- 検体からの光が波長に対して変化を持った波長特性を有し、広帯域光源として、波長に対する光量が、前記検体からの光の波長特性とは逆の、または逆に近い波長特性を有するものを用いた請求項1に記載の分析装置。
- 広帯域光源として、波長に対して光量の変化が小さい波長特性のものを用いた請求項1に記載の分析装置。
- 光学フィルタとして、波長に対して変化量のフラットな、または少ない波長帯域のみを選択できるものを用いた請求項1に記載の分析装置。
- 試験片に担持された検体からの光を、光学フィルタを有する光学系を通して、複数の画素を備えたイメージセンサにより受けて前記検体の濃度情報を得る分析方法であって、
画素に結像する光の、光学フィルタに入射するフィルタ入射角度を検出するフィルタ入射角度検出ステップと、
フィルタ入射角度に対応する光学フィルタのフィルタ帯域のシフト量を得るシフト量取得ステップと、
前記シフト量に応じた補正係数を設定する補正係数設定ステップと、
前記補正係数を用いて輝度値または輝度値に相当する値を補正する補正ステップと、
前記補正ステップで補正した補正値に基づいて検体の濃度情報を得る濃度取得ステップとを有する分析方法。 - 試験片に担持された検体からの光を、光学フィルタを有する光学系を通して、複数の画素を備えたイメージセンサにより受けて前記検体の濃度情報を得る分析装置であって、
画素に結像する光の、光学フィルタに入射するフィルタ入射角度を検出するフィルタ入射角度検出手段と、
フィルタ入射角度に対応する光学フィルタのフィルタ帯域のシフト量を得るシフト量取得手段と、
前記シフト量に応じた補正係数を設定する補正係数設定手段と、
前記補正係数を用いて輝度値または輝度値に相当する値を補正する補正手段と、
前記補正手段で補正した補正値に基づいて検体の濃度情報を得る濃度取得手段と
を備えた分析装置。 - 試験片に担持された検体からの光を、光学フィルタを有する光学系を通して、複数の画素を備えたイメージセンサにより受けて前記検体の濃度情報を得る分析方法であって、
前記試験片上に種々の既知濃度で担持された検体につき、その検体からの光の波長特性及びフィルタ入射角度依存性により前記イメージセンサ内の任意の位置にて得られる輝度値を事前に算出する第1のステップと、
前記第1のステップで濃度ごとに得られる輝度分布をその内の任意の基準濃度の輝度分布に一致させるための補正係数を算出する第2のステップと、
前記第2のステップで濃度ごとに得られた補正係数をその濃度情報に対してプロットして直線近似する第3のステップと、
前記基準濃度の輝度分布を基に、当該基準濃度に対応するフィルタ入射角度依存性の補正関数を算出する第4のステップと、
前記試験片上に別途に担持された測定対象の未知濃度の検体につき得られる輝度を、前記第4のステップで得られた前記基準濃度に対応した補正関数を用いて補正し、補正後の輝度を用いて濃度情報を算出する第5のステップと、
前記第5のステップで得られた濃度情報を前記第3のステップにて求めた直線へ参照させることで前記測定対象の検体の濃度補正係数を得る第6のステップと、
前記第6のステップにて得られた濃度補正係数を、前記第4のステップにて得られた前記基準濃度に対応した補正関数に積算し、積算後の補正関数を用いて前記測定対象の検体の輝度を補正し、補正後の輝度を用いて前記測定対象の検体の濃度情報を再度得る第7のステップと、を有する分析方法。 - 試験片に担持された検体からの光を、光学フィルタを有する光学系を通して、複数の画素を備えたイメージセンサにより受けて前記検体の濃度情報を得る分析装置であって、
前記試験片上に種々の既知濃度で担持された検体につき、その検体からの光の波長特性及びフィルタ入射角度依存性により前記イメージセンサ内の任意の位置にて得られる輝度値を事前に算出する輝度算出手段と、
前記輝度算出手段により濃度ごとに得られる輝度分布をその内の任意の基準濃度の輝度分布に一致させるための補正係数を算出する第1の補正係数算出手段と、
前記第1の補正係数算出手段で濃度ごとに得られた補正係数をその濃度情報に対してプロットして直線近似する直線近似手段と、
前記基準濃度の輝度分布を基に、当該基準濃度に対応するフィルタ入射角度依存性の補正関数を算出する補正関数算出手段と、
前記試験片上に別途に担持された測定対象の未知濃度の検体につき得られる輝度を、前記補正関数算出手段で得られた前記基準濃度に対応した補正関数を用いて補正し、補正後の輝度を用いて濃度情報を算出する濃度算出手段と、
前記濃度算出手段で得られた濃度情報を前記直線近似手段にて求めた直線へ参照させることで前記測定対象の検体の濃度補正係数を得る第2の補正係数取得手段と、
前記第2の補正係数取得手段にて得られた濃度補正係数を、前記補正関数算出手段にて得られた前記基準濃度に対応した補正関数に積算し、積算後の補正関数を用いて前記測定対象の検体の輝度を補正し、補正後の輝度を用いて前記測定対象の検体の濃度情報を再度得る濃度取得手段と、を有する分析装置。
Priority Applications (3)
| Application Number | Priority Date | Filing Date | Title |
|---|---|---|---|
| US12/864,439 US8310678B2 (en) | 2008-01-25 | 2009-01-22 | Analyzing device and analyzing method |
| CN2009801012018A CN101878420B (zh) | 2008-01-25 | 2009-01-22 | 分析装置及分析方法 |
| EP09703821A EP2241877A1 (en) | 2008-01-25 | 2009-01-22 | Analysis device and analysis method |
Applications Claiming Priority (6)
| Application Number | Priority Date | Filing Date | Title |
|---|---|---|---|
| JP2008014328A JP5274031B2 (ja) | 2008-01-25 | 2008-01-25 | 分析方法および分析装置 |
| JP2008-014328 | 2008-01-25 | ||
| JP2008-032500 | 2008-02-14 | ||
| JP2008032500A JP2009192336A (ja) | 2008-02-14 | 2008-02-14 | 分析装置 |
| JP2008304128A JP5020219B2 (ja) | 2008-11-28 | 2008-11-28 | 分析方法および分析装置 |
| JP2008-304128 | 2008-11-28 |
Publications (1)
| Publication Number | Publication Date |
|---|---|
| WO2009093453A1 true WO2009093453A1 (ja) | 2009-07-30 |
Family
ID=40900963
Family Applications (1)
| Application Number | Title | Priority Date | Filing Date |
|---|---|---|---|
| PCT/JP2009/000219 Ceased WO2009093453A1 (ja) | 2008-01-25 | 2009-01-22 | 分析装置および分析方法 |
Country Status (4)
| Country | Link |
|---|---|
| US (1) | US8310678B2 (ja) |
| EP (1) | EP2241877A1 (ja) |
| CN (1) | CN101878420B (ja) |
| WO (1) | WO2009093453A1 (ja) |
Cited By (6)
| Publication number | Priority date | Publication date | Assignee | Title |
|---|---|---|---|---|
| JP2015017834A (ja) * | 2013-07-09 | 2015-01-29 | 株式会社リコー | 測定装置及び測定方法 |
| US9279720B2 (en) * | 2010-03-24 | 2016-03-08 | Nec Solution Innovators, Ltd. | Analysis device |
| WO2017037873A1 (ja) * | 2015-09-01 | 2017-03-09 | パイオニア株式会社 | 測定装置 |
| WO2017037871A1 (ja) * | 2015-09-01 | 2017-03-09 | パイオニア株式会社 | 測定装置 |
| JP2019095328A (ja) * | 2017-11-24 | 2019-06-20 | 凸版印刷株式会社 | 呈色反応検出システム、呈色反応検出方法及びプログラム |
| CN110823864A (zh) * | 2018-08-07 | 2020-02-21 | 三星电子株式会社 | 光学发射光谱系统及其校准方法和制造半导体器件的方法 |
Families Citing this family (13)
| Publication number | Priority date | Publication date | Assignee | Title |
|---|---|---|---|---|
| GB2510777A (en) | 2011-11-03 | 2014-08-13 | Verifood Ltd | Low - cost spectrometry system for end - user analysis |
| GB2543655B (en) | 2013-08-02 | 2017-11-01 | Verifood Ltd | Compact spectrometer comprising a diffuser, filter matrix, lens array and multiple sensor detector |
| CN106461461A (zh) | 2014-01-03 | 2017-02-22 | 威利食品有限公司 | 光谱测定系统、方法和应用 |
| EP3209983A4 (en) | 2014-10-23 | 2018-06-27 | Verifood Ltd. | Accessories for handheld spectrometer |
| WO2016125165A2 (en) | 2015-02-05 | 2016-08-11 | Verifood, Ltd. | Spectrometry system with visible aiming beam |
| WO2016125164A2 (en) | 2015-02-05 | 2016-08-11 | Verifood, Ltd. | Spectrometry system applications |
| EP3864384A4 (en) | 2018-10-08 | 2022-06-29 | Verifood Ltd. | Accessories for optical spectrometers |
| US10667693B1 (en) * | 2018-11-16 | 2020-06-02 | Perkinelmer Health Sciences, Inc. | Systems, methods, and apparatus for interference filter correction based on angle of incidence |
| CN110115557B (zh) * | 2019-05-17 | 2021-12-14 | 中国科学院大学 | 一种高光谱内窥成像装置及成像方法 |
| DE102019127775A1 (de) * | 2019-10-15 | 2021-04-15 | Carl Zeiss Microscopy Gmbh | Lichtmikroskop und Verfahren zur Bildaufnahme mit einem Lichtmikroskop |
| KR20220000160A (ko) * | 2020-06-25 | 2022-01-03 | 삼성전자주식회사 | 대상체의 성분 분석 장치 및 방법 |
| EP4137801B1 (en) * | 2021-08-17 | 2025-09-24 | Hitachi High-Tech Analytical Science Finland Oy | Monitoring reliability of analysis of elemental composition of a sample |
| CN116087124B (zh) * | 2023-04-11 | 2023-07-21 | 武汉新烽光电股份有限公司 | 一种调节盘式芯片光反射角度增大吸光度的水质检测方法 |
Citations (4)
| Publication number | Priority date | Publication date | Assignee | Title |
|---|---|---|---|---|
| JPS635240A (ja) * | 1986-06-23 | 1988-01-11 | マイルス・ラボラトリ−ズ・インコ−ポレ−テッド | 反射率測定装置内の試料の反射率を測定する方法及び分光光度計の較正方法 |
| JPH075110A (ja) | 1992-09-10 | 1995-01-10 | Terametsukusu Kk | 試験片を用いる分析方法及び試験片の認識方法 |
| JP2005227107A (ja) * | 2004-02-12 | 2005-08-25 | Ricoh Co Ltd | 汚染物質量の検査方法およびその検査装置 |
| JP2007093586A (ja) * | 2005-08-31 | 2007-04-12 | Canon Inc | センサおよびそれを用いた記録装置 |
Family Cites Families (6)
| Publication number | Priority date | Publication date | Assignee | Title |
|---|---|---|---|---|
| GB2215039B (en) * | 1988-02-10 | 1992-02-05 | Plessey Co Plc | Improvements relating to optical sensing arrangements |
| US5743262A (en) * | 1995-06-07 | 1998-04-28 | Masimo Corporation | Blood glucose monitoring system |
| JPH09133628A (ja) | 1995-11-12 | 1997-05-20 | Terametsukusu Kk | 複合素子を内蔵した光源を持つ分析装置 |
| JPH10142053A (ja) | 1996-11-07 | 1998-05-29 | Fuji Photo Film Co Ltd | 分光反射率測定装置における補正方法 |
| JP2002335538A (ja) | 2001-05-09 | 2002-11-22 | Fuji Photo Film Co Ltd | スペクトル画像の色補正方法およびこの方法を用いるスペクトル画像撮影装置、並びに上記方法を実行するためのプログラム |
| JP2006292582A (ja) | 2005-04-12 | 2006-10-26 | Canon Inc | マルチバンド画像処理装置及びその方法並びにマルチバンド画像撮像装置 |
-
2009
- 2009-01-22 EP EP09703821A patent/EP2241877A1/en not_active Withdrawn
- 2009-01-22 US US12/864,439 patent/US8310678B2/en active Active
- 2009-01-22 CN CN2009801012018A patent/CN101878420B/zh not_active Expired - Fee Related
- 2009-01-22 WO PCT/JP2009/000219 patent/WO2009093453A1/ja not_active Ceased
Patent Citations (4)
| Publication number | Priority date | Publication date | Assignee | Title |
|---|---|---|---|---|
| JPS635240A (ja) * | 1986-06-23 | 1988-01-11 | マイルス・ラボラトリ−ズ・インコ−ポレ−テッド | 反射率測定装置内の試料の反射率を測定する方法及び分光光度計の較正方法 |
| JPH075110A (ja) | 1992-09-10 | 1995-01-10 | Terametsukusu Kk | 試験片を用いる分析方法及び試験片の認識方法 |
| JP2005227107A (ja) * | 2004-02-12 | 2005-08-25 | Ricoh Co Ltd | 汚染物質量の検査方法およびその検査装置 |
| JP2007093586A (ja) * | 2005-08-31 | 2007-04-12 | Canon Inc | センサおよびそれを用いた記録装置 |
Cited By (7)
| Publication number | Priority date | Publication date | Assignee | Title |
|---|---|---|---|---|
| US9279720B2 (en) * | 2010-03-24 | 2016-03-08 | Nec Solution Innovators, Ltd. | Analysis device |
| JP2015017834A (ja) * | 2013-07-09 | 2015-01-29 | 株式会社リコー | 測定装置及び測定方法 |
| WO2017037873A1 (ja) * | 2015-09-01 | 2017-03-09 | パイオニア株式会社 | 測定装置 |
| WO2017037871A1 (ja) * | 2015-09-01 | 2017-03-09 | パイオニア株式会社 | 測定装置 |
| JP2019095328A (ja) * | 2017-11-24 | 2019-06-20 | 凸版印刷株式会社 | 呈色反応検出システム、呈色反応検出方法及びプログラム |
| JP7062926B2 (ja) | 2017-11-24 | 2022-05-09 | 凸版印刷株式会社 | 呈色反応検出システム、呈色反応検出方法及びプログラム |
| CN110823864A (zh) * | 2018-08-07 | 2020-02-21 | 三星电子株式会社 | 光学发射光谱系统及其校准方法和制造半导体器件的方法 |
Also Published As
| Publication number | Publication date |
|---|---|
| CN101878420B (zh) | 2012-12-05 |
| US8310678B2 (en) | 2012-11-13 |
| EP2241877A1 (en) | 2010-10-20 |
| CN101878420A (zh) | 2010-11-03 |
| US20100290051A1 (en) | 2010-11-18 |
Similar Documents
| Publication | Publication Date | Title |
|---|---|---|
| CN101878420B (zh) | 分析装置及分析方法 | |
| JP7200204B2 (ja) | 多重組織検定用の撮像デバイスまたはシステムを較正、構成、および有効性判断するためのシステムおよび方法 | |
| US7206074B2 (en) | Apparatus and method for measuring spectral reflectance and apparatus for measuring film thickness | |
| US8530243B2 (en) | Non-scanning SPR system | |
| JP2006010508A (ja) | マルチアングル測色計 | |
| CN107076613A (zh) | 光谱测定方法及光谱测定装置 | |
| US20180238735A1 (en) | Spatially variable light source and spatially variable detector systems and methods | |
| KR102012219B1 (ko) | 피부 컬러 측정 장치 및 방법 | |
| KR20120103480A (ko) | 분광 특성 측정 방법 및 분광 특성 측정 장치 | |
| CN103383347B (zh) | 非线性误差的绝对测量方法及装置 | |
| CN117355724A (zh) | 膜厚测定装置及膜厚测定方法 | |
| JP2010101715A (ja) | 分析方法および分析装置 | |
| EP4603792A1 (en) | Film thickness measuring device and film thickness measuring method | |
| WO2020003673A1 (ja) | イメージセンサの分光感度測定方法、分光感度測定装置の検査方法及び分光感度測定装置 | |
| JP2007225389A (ja) | 表面プラズモン共鳴測定装置及び測定方法 | |
| JP5020219B2 (ja) | 分析方法および分析装置 | |
| JP5274031B2 (ja) | 分析方法および分析装置 | |
| JP2017203741A (ja) | 感度補正方法及び定量測定方法 | |
| KR102022836B1 (ko) | 광 측정 장치, 시스템 및 방법 | |
| WO2025207008A1 (en) | An assembly for measurements of one or more optical parameters of a sample medium and a method for measuring one or more optical parameters of a sample medium using an assembly | |
| Koekemoer et al. | The STIS NUV-MAMA Objective Prism and Looking Beyond for HST UV Slitless Spectroscopy |
Legal Events
| Date | Code | Title | Description |
|---|---|---|---|
| WWE | Wipo information: entry into national phase |
Ref document number: 200980101201.8 Country of ref document: CN |
|
| 121 | Ep: the epo has been informed by wipo that ep was designated in this application |
Ref document number: 09703821 Country of ref document: EP Kind code of ref document: A1 |
|
| WWE | Wipo information: entry into national phase |
Ref document number: 12864439 Country of ref document: US |
|
| NENP | Non-entry into the national phase |
Ref country code: DE |
|
| WWE | Wipo information: entry into national phase |
Ref document number: 2009703821 Country of ref document: EP |