WO2009107399A1 - 信号評価方法および信号評価装置 - Google Patents
信号評価方法および信号評価装置 Download PDFInfo
- Publication number
- WO2009107399A1 WO2009107399A1 PCT/JP2009/000907 JP2009000907W WO2009107399A1 WO 2009107399 A1 WO2009107399 A1 WO 2009107399A1 JP 2009000907 W JP2009000907 W JP 2009000907W WO 2009107399 A1 WO2009107399 A1 WO 2009107399A1
- Authority
- WO
- WIPO (PCT)
- Prior art keywords
- signal
- pattern
- recording
- error rate
- unit
- Prior art date
- Legal status (The legal status is an assumption and is not a legal conclusion. Google has not performed a legal analysis and makes no representation as to the accuracy of the status listed.)
- Ceased
Links
Images


Classifications
-
- G—PHYSICS
- G11—INFORMATION STORAGE
- G11B—INFORMATION STORAGE BASED ON RELATIVE MOVEMENT BETWEEN RECORD CARRIER AND TRANSDUCER
- G11B20/00—Signal processing not specific to the method of recording or reproducing; Circuits therefor
- G11B20/10—Digital recording or reproducing
- G11B20/10009—Improvement or modification of read or write signals
-
- G—PHYSICS
- G11—INFORMATION STORAGE
- G11B—INFORMATION STORAGE BASED ON RELATIVE MOVEMENT BETWEEN RECORD CARRIER AND TRANSDUCER
- G11B20/00—Signal processing not specific to the method of recording or reproducing; Circuits therefor
- G11B20/10—Digital recording or reproducing
- G11B20/18—Error detection or correction; Testing, e.g. of drop-outs
-
- G—PHYSICS
- G11—INFORMATION STORAGE
- G11B—INFORMATION STORAGE BASED ON RELATIVE MOVEMENT BETWEEN RECORD CARRIER AND TRANSDUCER
- G11B20/00—Signal processing not specific to the method of recording or reproducing; Circuits therefor
- G11B20/10—Digital recording or reproducing
-
- G—PHYSICS
- G11—INFORMATION STORAGE
- G11B—INFORMATION STORAGE BASED ON RELATIVE MOVEMENT BETWEEN RECORD CARRIER AND TRANSDUCER
- G11B20/00—Signal processing not specific to the method of recording or reproducing; Circuits therefor
- G11B20/10—Digital recording or reproducing
- G11B20/10009—Improvement or modification of read or write signals
- G11B20/10046—Improvement or modification of read or write signals filtering or equalising, e.g. setting the tap weights of an FIR filter
- G11B20/10055—Improvement or modification of read or write signals filtering or equalising, e.g. setting the tap weights of an FIR filter using partial response filtering when writing the signal to the medium or reading it therefrom
- G11B20/10111—Improvement or modification of read or write signals filtering or equalising, e.g. setting the tap weights of an FIR filter using partial response filtering when writing the signal to the medium or reading it therefrom partial response PR(1,2,2,1)
-
- G—PHYSICS
- G11—INFORMATION STORAGE
- G11B—INFORMATION STORAGE BASED ON RELATIVE MOVEMENT BETWEEN RECORD CARRIER AND TRANSDUCER
- G11B20/00—Signal processing not specific to the method of recording or reproducing; Circuits therefor
- G11B20/10—Digital recording or reproducing
- G11B20/10009—Improvement or modification of read or write signals
- G11B20/10046—Improvement or modification of read or write signals filtering or equalising, e.g. setting the tap weights of an FIR filter
- G11B20/10055—Improvement or modification of read or write signals filtering or equalising, e.g. setting the tap weights of an FIR filter using partial response filtering when writing the signal to the medium or reading it therefrom
- G11B20/1012—Improvement or modification of read or write signals filtering or equalising, e.g. setting the tap weights of an FIR filter using partial response filtering when writing the signal to the medium or reading it therefrom partial response PR(1,2,2,2,1)
-
- G—PHYSICS
- G11—INFORMATION STORAGE
- G11B—INFORMATION STORAGE BASED ON RELATIVE MOVEMENT BETWEEN RECORD CARRIER AND TRANSDUCER
- G11B20/00—Signal processing not specific to the method of recording or reproducing; Circuits therefor
- G11B20/10—Digital recording or reproducing
- G11B20/10009—Improvement or modification of read or write signals
- G11B20/10046—Improvement or modification of read or write signals filtering or equalising, e.g. setting the tap weights of an FIR filter
- G11B20/10212—Improvement or modification of read or write signals filtering or equalising, e.g. setting the tap weights of an FIR filter compensation for data shift, e.g. pulse-crowding effects
-
- G—PHYSICS
- G11—INFORMATION STORAGE
- G11B—INFORMATION STORAGE BASED ON RELATIVE MOVEMENT BETWEEN RECORD CARRIER AND TRANSDUCER
- G11B20/00—Signal processing not specific to the method of recording or reproducing; Circuits therefor
- G11B20/10—Digital recording or reproducing
- G11B20/10009—Improvement or modification of read or write signals
- G11B20/10268—Improvement or modification of read or write signals bit detection or demodulation methods
- G11B20/10277—Improvement or modification of read or write signals bit detection or demodulation methods the demodulation process being specifically adapted to partial response channels, e.g. PRML decoding
-
- G—PHYSICS
- G11—INFORMATION STORAGE
- G11B—INFORMATION STORAGE BASED ON RELATIVE MOVEMENT BETWEEN RECORD CARRIER AND TRANSDUCER
- G11B20/00—Signal processing not specific to the method of recording or reproducing; Circuits therefor
- G11B20/10—Digital recording or reproducing
- G11B20/10009—Improvement or modification of read or write signals
- G11B20/10268—Improvement or modification of read or write signals bit detection or demodulation methods
- G11B20/10287—Improvement or modification of read or write signals bit detection or demodulation methods using probabilistic methods, e.g. maximum likelihood detectors
- G11B20/10296—Improvement or modification of read or write signals bit detection or demodulation methods using probabilistic methods, e.g. maximum likelihood detectors using the Viterbi algorithm
-
- G—PHYSICS
- G11—INFORMATION STORAGE
- G11B—INFORMATION STORAGE BASED ON RELATIVE MOVEMENT BETWEEN RECORD CARRIER AND TRANSDUCER
- G11B20/00—Signal processing not specific to the method of recording or reproducing; Circuits therefor
- G11B20/10—Digital recording or reproducing
- G11B20/10009—Improvement or modification of read or write signals
- G11B20/10305—Improvement or modification of read or write signals signal quality assessment
- G11B20/10361—Improvement or modification of read or write signals signal quality assessment digital demodulation process
- G11B20/1037—Improvement or modification of read or write signals signal quality assessment digital demodulation process based on hard decisions, e.g. by evaluating bit error rates before or after ECC decoding
-
- G—PHYSICS
- G11—INFORMATION STORAGE
- G11B—INFORMATION STORAGE BASED ON RELATIVE MOVEMENT BETWEEN RECORD CARRIER AND TRANSDUCER
- G11B20/00—Signal processing not specific to the method of recording or reproducing; Circuits therefor
- G11B20/10—Digital recording or reproducing
- G11B20/10009—Improvement or modification of read or write signals
- G11B20/10305—Improvement or modification of read or write signals signal quality assessment
- G11B20/10398—Improvement or modification of read or write signals signal quality assessment jitter, timing deviations or phase and frequency errors
-
- G—PHYSICS
- G11—INFORMATION STORAGE
- G11B—INFORMATION STORAGE BASED ON RELATIVE MOVEMENT BETWEEN RECORD CARRIER AND TRANSDUCER
- G11B20/00—Signal processing not specific to the method of recording or reproducing; Circuits therefor
- G11B20/10—Digital recording or reproducing
- G11B20/10009—Improvement or modification of read or write signals
- G11B20/10305—Improvement or modification of read or write signals signal quality assessment
- G11B20/10472—Improvement or modification of read or write signals signal quality assessment derived from statistics of other quality measures, e.g. their mean, variance or skew
-
- G—PHYSICS
- G11—INFORMATION STORAGE
- G11B—INFORMATION STORAGE BASED ON RELATIVE MOVEMENT BETWEEN RECORD CARRIER AND TRANSDUCER
- G11B20/00—Signal processing not specific to the method of recording or reproducing; Circuits therefor
- G11B20/10—Digital recording or reproducing
- G11B20/10009—Improvement or modification of read or write signals
- G11B20/10481—Improvement or modification of read or write signals optimisation methods
-
- G—PHYSICS
- G11—INFORMATION STORAGE
- G11B—INFORMATION STORAGE BASED ON RELATIVE MOVEMENT BETWEEN RECORD CARRIER AND TRANSDUCER
- G11B20/00—Signal processing not specific to the method of recording or reproducing; Circuits therefor
- G11B20/10—Digital recording or reproducing
- G11B20/18—Error detection or correction; Testing, e.g. of drop-outs
- G11B20/1816—Testing
- G11B20/182—Testing using test patterns
-
- G—PHYSICS
- G11—INFORMATION STORAGE
- G11B—INFORMATION STORAGE BASED ON RELATIVE MOVEMENT BETWEEN RECORD CARRIER AND TRANSDUCER
- G11B20/00—Signal processing not specific to the method of recording or reproducing; Circuits therefor
- G11B20/22—Signal processing not specific to the method of recording or reproducing; Circuits therefor for reducing distortions
- G11B20/225—Signal processing not specific to the method of recording or reproducing; Circuits therefor for reducing distortions for reducing wow or flutter
-
- G—PHYSICS
- G11—INFORMATION STORAGE
- G11B—INFORMATION STORAGE BASED ON RELATIVE MOVEMENT BETWEEN RECORD CARRIER AND TRANSDUCER
- G11B7/00—Recording or reproducing by optical means, e.g. recording using a thermal beam of optical radiation by modifying optical properties or the physical structure, reproducing using an optical beam at lower power by sensing optical properties; Record carriers therefor
- G11B7/004—Recording, reproducing or erasing methods; Read, write or erase circuits therefor
- G11B7/0045—Recording
-
- G—PHYSICS
- G11—INFORMATION STORAGE
- G11B—INFORMATION STORAGE BASED ON RELATIVE MOVEMENT BETWEEN RECORD CARRIER AND TRANSDUCER
- G11B2220/00—Record carriers by type
- G11B2220/20—Disc-shaped record carriers
- G11B2220/25—Disc-shaped record carriers characterised in that the disc is based on a specific recording technology
- G11B2220/2537—Optical discs
- G11B2220/2541—Blu-ray discs; Blue laser DVR discs
Definitions
- the present invention relates to a signal processing method using a maximum likelihood decoding method and a method for evaluating a reproduced signal using the maximum likelihood decoding method.
- the PRML system is a technique that combines partial response (PR) and maximum likelihood decoding (ML), and is a system that selects the most probable signal sequence from a reproduced waveform on the assumption that known intersymbol interference occurs. For this reason, it is known that decoding performance is improved as compared with the conventional level determination method (for example, Non-Patent Document 1).
- Non-patent document 1 describes that the system margin can be maintained by changing the PRML method to a higher-order method. For example, when the recording capacity per recording layer of a 12 cm optical disk medium is 25 GB, the system margin can be maintained by adopting the PR1221ML method, but the recording capacity per layer is 33.3 GB. In this case, it is explained that it is necessary to adopt the PR12221ML system. As described above, it is expected that the tendency to adopt the higher-order PRML system will continue in proportion to the increase in the density of the optical disk medium.
- JP 2003-141823 A JP 2004-213862 A JP 2004-335079 A JP 2003-511163 A JP 2003-272304 A Illustrated Blu-ray Disc Reader Ohm Adaptive signal processing algorithm
- Patent Documents 1 and 2 “the difference metric between the most probable first state transition sequence and the reproduced signal and the second most probable second state transition sequence and the reproduced signal” is used as an index value. It is disclosed to use. In this case, if there are multiple patterns of “the most probable first state transition sequence and the second most probable second state transition sequence” that may cause an error, it is necessary to comprehensively process these patterns. There is. However, this processing method is not disclosed in Patent Documents 1 and 2.
- Patent Document 5 discloses a method of processing a pattern group by detecting a plurality of patterns of difference metrics detected by the same method as Patent Documents 1 and 2, paying attention to this point.
- PR12221ML signal processing used in Patent Document 5 there are three types of patterns that are likely to cause errors (patterns of merged paths with a relatively small Euclidean distance).
- the occurrence probability is different from the number of errors when an error occurs in the pattern.
- the standard deviation ⁇ is obtained from the distribution of the index values obtained for each of these patterns, the pattern occurrence probability (occurrence frequency with respect to all parameters), and the number of errors generated when the pattern is wrong.
- a method for predicting an error that occurs is disclosed.
- Patent Document 5 as a method of predicting an error, the distribution of the obtained index value is assumed to be a normal distribution, and the probability that the index value is 0 or less from the standard deviation ⁇ and the variance average value ⁇ , that is, a bit error is caused. Although a method for predicting a probability is used, this is a general method for predicting an error occurrence probability. In Patent Document 5, an occurrence probability is obtained for each pattern, a prediction error rate is calculated, and this prediction error rate is used as a measure of signal quality.
- Patent Documents 4 and 5 disclose a method using bER predicted from a difference metric as an index, but even if these are used as index values, the time axis used as the signal quality evaluation index of the optical disk is disclosed. There is a problem that it is not compatible with jitter and is difficult to handle. In particular, in order to have compatibility with the conventional jitter index value, a signal evaluation index that can express the signal quality using ⁇ is required. In a system based on the premise that the PR12221ML signal processing disclosed in Patent Document 5 is used, it is expressed using ⁇ , which can represent signal quality highly correlated with the performance (error rate) of PR12221ML signal processing. Signal evaluation index is necessary.
- the PR12221ML signal processing includes three types of patterns that are likely to cause errors (pattern groups of merged paths having a relatively small Euclidean distance).
- FIG. 18 shows the square distribution of the difference metric in the three types of pattern groups. These three types of pattern groups are difficult to represent as one distribution because their occurrence probabilities are different from the number of errors when an error occurs in the pattern.
- the present invention provides a method and apparatus for appropriately evaluating the quality of a reproduction signal using a signal processing method suitable for a system adopting the PRML method.
- the signal evaluation method of the present invention is a signal evaluation method for evaluating the reproduction signal based on a binarized signal generated from a reproduction signal reproduced from an information recording medium using a PRML method, Detecting a pattern of paths joining the same state corresponding to the digitized signal, an ideal value of the positive pattern corresponding to the binarized signal, and an ideal value of the erroneous pattern corresponding to the positive pattern A step of calculating a difference between an ideal value of the positive pattern and the reproduction signal, a difference between an ideal value of the erroneous pattern and the reproduction signal, and based on the difference, A step of calculating a predicted error rate for each predetermined pattern group in the PRML method, and an error rate for each predetermined pattern group for use in evaluating the reproduction signal; Including calculating a standard deviation corresponding to the overall error rate obtained by adding.
- the step of calculating the error rate includes calculating a standard deviation of the difference for each of the predetermined pattern groups, detecting an occurrence probability for each of the predetermined pattern groups, And calculating the error rate based on the standard deviation of the difference, the occurrence probability, and the number of errors that occur for each of the predetermined pattern groups.
- each of the predetermined pattern groups is a pattern group having an Euclidean distance of 14 or less.
- the plurality of predetermined pattern groups include a pattern group having an Euclidean distance of 14, a pattern group having an Euclidean distance of 12 and an isolated 2T signal, and an Euclidean distance of 12 and a 2T signal being continuous. Pattern groups to be included.
- the PRML method is a PR12221 method.
- the apparatus of the present invention is an apparatus for evaluating the reproduction signal based on a binarized signal generated from a reproduction signal reproduced from an information recording medium by using the PRML method, and corresponds to the binarized signal.
- a pattern detection unit that detects a pattern of paths that merge in the same state, a distance between an ideal value of a positive pattern corresponding to the binarized signal and the reproduction signal, and an erroneous pattern corresponding to the positive pattern
- a difference calculation unit for calculating a difference between an ideal value of the reproduction signal and a distance between the reproduction signal, and an error rate for calculating a predicted error rate for each predetermined pattern group in the PRML method based on the difference
- a standard deviation computing unit that calculates a standard deviation corresponding to an overall error rate obtained by adding an error rate for each of the predetermined pattern groups to be used for evaluating the reproduction signal. Equipped with a.
- the error rate calculation further comprises: an arithmetic unit that calculates a standard deviation of the difference for each predetermined pattern group; and a detection unit that detects an occurrence probability for each predetermined pattern group.
- the unit calculates the error rate based on the standard deviation of the difference, the occurrence probability, and the number of errors that occur for each of the predetermined pattern groups.
- each of the predetermined pattern groups is a pattern group having an Euclidean distance of 14 or less.
- the plurality of predetermined pattern groups include a pattern group having an Euclidean distance of 14, a pattern group having an Euclidean distance of 12 and an isolated 2T signal, and an Euclidean distance of 12 and a 2T signal being continuous. Pattern groups to be included.
- the PRML method is a PR12221 method.
- the information recording medium of the present invention is an information recording medium having a predetermined quality, and the information recording medium has at least one recording layer, and the recording layer records information by a combination of a mark and a space.
- An evaluation value corresponding to a reproduction signal reproduced from the mark and the space has a predetermined value, and the process of calculating the evaluation value is a reproduction reproduced from the mark and the space.
- a step of generating a binarized signal from the signal using a PRML method a step of detecting a pattern of a path joining the same state corresponding to the binarized signal, and a positive pattern corresponding to the binarized signal Calculating a difference between a distance between the ideal value of the reproduction signal and the reproduction signal and a distance between the ideal value of the erroneous pattern corresponding to the positive pattern and the reproduction signal; and And calculating the predicted error rate for each predetermined pattern group in the PRML method, and adding the error rate for each predetermined pattern group for use in the evaluation of the reproduction signal. Calculating a standard deviation corresponding to the error rate.
- the reproducing apparatus is a reproducing apparatus for reproducing the information recording medium, wherein the information recording medium is irradiated with a light beam and receives a reflected light from the mark and the space, and the reflected light. And a reproducing unit that reproduces information recorded using the mark and the space.
- the recording apparatus of the present invention is a recording apparatus that performs recording on the information recording medium, wherein the information recording medium is irradiated with a pulsed light beam to form the mark in the recording area; and An adjustment unit that adjusts a light emission waveform pattern of the light beam so that an evaluation value satisfies the predetermined value.
- the present invention attention is paid to a pattern of a merged path having a relatively small Euclidean distance in PRML signal processing, and one signal evaluation is performed from difference metric information of a plurality of pattern groups having different occurrence probabilities and different numbers of errors. Generate indicators. The error occurrence probability is obtained from each pattern group, and the total is calculated. A standard deviation ⁇ of a normal distribution predicted from the calculated total error rate is calculated. By using the standard deviation ⁇ as a signal evaluation index, it is possible to provide a signal evaluation method and a signal evaluation index that are highly correlated with the error rate.
- the reproduction signal quality when the reproduction signal quality is calculated using the PRML method in which a plurality of zero cross portions are included in the merge path of the minimum difference metric, the zero cross portion is 1 in the merge path of the non-minimum difference metric.
- the reproduction signal quality is calculated using only the state transition patterns included in the two. By using a state transition pattern having only one zero-cross portion in the merge path, errors in each zero-cross portion (zero-cross information) can be individually separated and detected. By individually evaluating the zero-cross portion of the reproduction signal, it is possible to appropriately evaluate the reproduction signal quality.
- FIG. 3 is a trellis diagram corresponding to the state transition rule shown in FIG. 2. It is a figure which shows PR equalization ideal waveform shown in Table 1 by embodiment of this invention. It is a figure which shows PR equalization ideal waveform shown in Table 2 by embodiment of this invention. It is a figure which shows PR equalization ideal waveform shown in Table 3 by embodiment of this invention. It is a figure which shows the state transition rule determined from RLL (1,7) recording code and equalization system PR (1,2,2,1) by embodiment of this invention.
- FIG. 3 is a trellis diagram corresponding to the state transition rule shown in FIG. 2. It is a figure which shows PR equalization ideal waveform shown in Table 1 by embodiment of this invention. It is a figure which shows PR equalization ideal waveform shown in Table 2 by embodiment of this invention. It is a figure which shows PR equalization ideal waveform shown in Table 3 by embodiment of this invention. It is a figure which shows the state transition rule determined from RLL (1,7) recording code and equalization system PR (1,2,2,1) by embodiment
- FIG. 8 is a trellis diagram corresponding to the state transition rule shown in FIG. 7. It is a figure which shows PR equalization ideal waveform shown in Table 4 by embodiment of this invention. It is a figure which shows the relationship between the focus parameter at the time of focus adjustment by embodiment of this invention, and the parameter
- FIG. 3 is a diagram showing an optical disc medium having a plurality of recording layers according to an embodiment of the present invention. It is a figure which shows distribution of the difference metric of PR (1, 2, 2, 2, 1) ML by embodiment of this invention. It is a figure which shows distribution of the difference metric in each Euclidean distance pattern of PR (1, 2, 2, 2, 1) ML by embodiment of this invention. It is a figure which shows the relationship between the signal evaluation parameter
- (A) is a figure which shows the example of BD of 25 GB
- (B) is a figure which shows the example of the optical disk of higher recording density than BD of 25 GB. It is a figure which shows the example in which the spatial frequency of the shortest mark (2T) is higher than the OTF cutoff frequency, and the amplitude of the 2T reproduction signal is zero. It is a figure which shows the area structure of an optical disk. (1) shows the configuration of the information recording layer of the disc A having a predetermined recording density and the disc B having a higher recording density, and (2) and (3) are the lead-in areas of the disc A and disc B, respectively. It is a figure which shows a specific structure.
- the PR12221ML system is adopted for signal processing in the reproduction system, and an RLL (Run Length Limited) code such as an RLL (1, 7) code is used as a recording code.
- RLL Un Length Limited
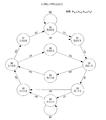
- FIG. 2 is a state transition diagram showing a state transition rule determined from the RLL (1, 7) recording code and the equalization method PR (1, 2, 2, 2, 1).
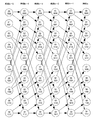
- FIG. 3 is a trellis diagram corresponding to the state transition rule shown in FIG.
- PR12221ML and RLL (1, 7) limits the number of states of the decoding unit to 10, the number of paths for the state transition is 16, and the playback level is 9 levels.
- state S (0,0,0,0) at a certain time is S0
- state S (0,0,0,1) is S1
- state S (0, 1, 1, 1) to S3 state S (1, 1, 1, 1) to S4
- state S (1, 1, 1, 0) S5 state S (1, 1, 0, 0) is S6
- state S (1, 0, 0, 0) is S7
- state S (1, 0, 0, 1) is S8
- state S (0, 1 , 1, 0) is expressed as S9 and 10 states are expressed.
- “0” or “1” described in parentheses indicates a signal sequence on the time axis and indicates which state may be brought about by a state transition from a certain state to the next time. ing. Further, when the state transition diagram is developed along the time axis, the trellis diagram shown in FIG. 3 is obtained.
- Each of Tables 1 to 3 is a state transition (record code (b ki ,..., B k )) indicating a trajectory from the start state to the merged state of the two state transition patterns, via the state transition.
- Two possible recording sequences (k-9,..., K), two ideal reproduction waveforms (PR equivalent ideal values) that may occur through the state transition,
- the Euclidean distance (Euclidean distance between paths) of an ideal reproduction waveform is shown.
- Table 1 shows 18 state transition patterns in which the Euclidean distance of the state transition pattern that can take two state transitions is 14. These patterns correspond to a mark / space switching portion (waveform edge portion) of the optical disk medium. In other words, this is a 1-bit shift error pattern of the edge.
- a state transition path from S0 (k-5) to S6 (k) in the state transition rule shown in FIG. 3 will be described. In this case, one path in which the recording sequence transitions to “0, 0, 0, 0, 1, 1, 1, 0, 0” is detected, and “0” of the reproduction data is marked as a space portion and “1” is marked.
- this corresponds to a space having a length of 4T space or more, a 3T mark, a space having a length of 2T space or more.
- the PR equivalent ideal waveform of the path is shown as the A path waveform in FIG.
- FIG. 4 is a diagram showing an example of the PR equalized ideal waveform shown in Table 1.
- FIG. 5 is a diagram showing an example of the PR equalized ideal waveform shown in Table 2.
- FIG. 6 is a diagram showing an example of the PR equalized ideal waveform shown in Table 3. 4, 5, and 6, the horizontal axis indicates the sample time (sampling at every time of the recording sequence), and the vertical axis indicates the reproduction signal level.
- the ideal reproduction signal level is 9 levels (0 level to 8 level).
- 1,0,0 ” is a space with a length of 5T space or more, a space with a length of 2T mark or more, a space with a length of 2T space or more, when“ 0 ”of reproduction data is replaced with a space portion and“ 1 ”with a mark portion It corresponds to.
- the PR equivalent ideal waveform of the path is shown as a B path waveform in FIG.
- the feature of the pattern with Euclidean distance of 14 shown in Table 1 is that one edge information is always included. Using this feature, it is possible to perform edge adjustment optimal for the PRML system.
- Table 2 shows the state transition patterns in which the Euclidean distance is 12, and there are 18 types. These patterns correspond to 2T mark or 2T space shift errors, and are 2-bit error patterns.
- a state transition path from S0 (k-7) to S0 (k) in the state transition rule shown in FIG. 3 will be described. In this case, one path in which the recording sequence transitions to “0, 0, 0, 0, 1, 1, 0, 0, 0, 0, 0” is detected.
- 1 ′′ is replaced with a mark portion, it corresponds to a space having a length of 4T space or more, a 2T mark, or a space having a length of 5T space or more.
- the PR equivalent ideal waveform of the path is shown as an A path waveform in FIG.
- Another pass recording sequence transition “0, 0, 0, 0, 0, 1, 1, 0, 0, 0, 0” indicates that “0” of the reproduction data is a space portion and “1” is a mark portion. This corresponds to a space having a length of 5T space or more, a 2T mark, a space having a length of 4T space or more.
- the PR equivalent ideal waveform of the path is shown as a B path waveform in FIG.
- the feature of the 12 patterns of Euclidean distance shown in Table 2 is that 2T rising and falling edge information is always included.
- Table 3 shows state transition patterns with Euclidean distance of 12, and there are 18 types. These patterns correspond to locations where 2T marks and 2T spaces are continuous, and are 3-bit error patterns.
- a state transition path from S0 (k-9) to S6 (k) in the state transition rule shown in FIG. 3 will be described. In this case, one path in which the recording sequence transitions to “0, 0, 0, 0, 1, 1, 0, 0, 1, 1, 1, 0, 0” is detected, and “0” of the reproduction data is detected. If the space portion, “1” is replaced with a mark portion, it corresponds to a space having a length of 4T space or more, a 2T mark, a 2T space, a 3T mark, a space having a length of 2T space or more.
- the PR equivalent ideal waveform of the path is shown as an A path waveform in FIG.
- the transition “0, 0, 0, 0, 0, 0, 1, 1, 0, 0, 1, 1, 0, 0” of the recording sequence of the other pass is “0” of the reproduction data, “1”
- “” When “” is replaced with a mark portion, it corresponds to a space having a length of 5T space or more, a 2T mark, 2T space, 2T mark, 2T space or more.
- the PR equivalent ideal waveform of the path is shown as a B path waveform in FIG.
- a feature of the pattern having a Euclidean distance of 12 shown in Table 3 is that at least three pieces of edge information are included.
- the optimum position of the start edge or the end edge of the recording mark varies depending on the PRML characteristics.
- the ideal waveform of the start edge portion of the 2T mark after the space of 5T space or longer is the B path waveform shown in FIG.
- the reproduction signal level 4 is a central level of all 9 levels, which means that the signal amplitude of the 2T mark is ideally 0. That is, if the 2T mark start edge is adjusted so as to have such a 2T mark signal amplitude, the recording mark becomes smaller.
- PR1221ML In order to compare the characteristics of the PRML system, PR1221ML will be described as an example of another PRML system. Compared with PR12221ML, the PR1221ML system is a non-high frequency emphasis characteristic type. By the combination of PR1221ML and RLL (1, 7), the number of states of the decoding unit is limited to 6, the number of paths of the state transition is 10, and the reproduction level is 7 levels.
- FIG. 7 is a state transition diagram showing a state transition rule determined from a combination of RLL (1, 7) and PR1221ML.
- FIG. 8 is a trellis diagram corresponding to the state transition rule shown in FIG.
- state S (0,0,0) at a certain time is S0
- state S (0,0,1) is S1
- state S (0,1,1) is S2
- state S ( 1, 1, 1) is expressed as S3, S (1, 1, 0) as S4, S (1,0, 0) as S5, and 6 states are expressed.
- “0” or “1” described in parentheses indicates a signal sequence on the time axis and indicates which state may be brought about by a state transition from a certain state to the next time. ing. Further, when this state transition diagram is developed along the time axis, the trellis diagram shown in FIG. 8 is obtained.
- Table 4 shows the state transition (record code (b ki ,..., B k )) indicating the trajectory from the start state to the merged state of the two state transition patterns, and the possibility of going through the state transition
- Two recording sequences K-10, ..., K
- two ideal reproduction waveforms PR equivalent ideal value
- two ideal reproduction waveforms Euclidean distance between paths.
- a pattern that always includes one piece of edge information is a pattern having a Euclidean distance of 10 shown in Table 4.
- the ideal waveform of the start edge portion of the 2T mark after a space of 5T space or longer is two possible when the state transitions from the state S0 (K-4) to the state transition S4 (K).
- the B path waveform shown in FIG. 9 is obtained.
- FIG. 9 is a diagram showing an example of the PR equalized ideal waveform shown in Table 4. Since the ideal reproduction signal level of PR1221ML is 7, the center of the reproduction signal level shown in FIG. Since the signal amplitude of the 2T mark of PR1221ML shown in FIG. 9 indicates level 4, the start edge of the 2T mark can be adjusted so that the signal amplitude of the 2T mark is larger than that of PR12221ML. In addition to the start edge of the 2T mark, the end edge of the 2T mark and the start / end edge of a mark having a length of 3T or more can be similarly adjusted. As described above, it is necessary to pay attention to the fact that the shape of the adjusted recording mark varies depending on the characteristics of the PRML method.
- the signal evaluation index M for evaluating the reproduction signal can be obtained from (Equation 1), (Equation 2), and (Equation 3), and is an index that is jitter-like and correlated with the reproduction performance of PRML. Further, if (Equation 3) is calculated assuming that the average value is 0 in (Equation 2), (Equation 3) is an index obtained by normalizing the variance of (Equation 1) by the square of the Euclidean distance. it can. Since this index is described in Patent Document 1, detailed description thereof is omitted here. For reference, the disclosure of Patent Document 1 (Japanese Patent Laid-Open No. 2003-141823) is incorporated herein by reference.
- Table 5 shows specific examples of the calculation of (Formula 1) in the PR1221ML system.
- y k-3 to y k are PR equalized waveform (maximum likelihood decoding unit input waveform) sequences described later
- T ⁇ 3 to T 3 are PR equalized ideal value sequences (0 to 6) shown in Table 4.
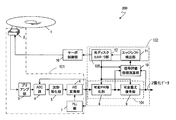
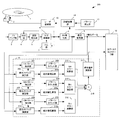
- FIG. 1 is a diagram showing an optical disc apparatus 100 according to a first embodiment of the present invention.
- the information recording medium 1 is an information recording medium for optically recording and reproducing information, for example, an optical disk medium.
- the optical disc apparatus 100 is a recording / reproducing apparatus that records / reproduces information with respect to the mounted information recording medium 1.
- the optical disc apparatus 100 includes a reproduction unit 101, a recording condition adjustment unit 102, and a recording unit 103.
- the reproduction unit 101 includes an optical head unit 2, a preamplifier unit 3, an AGC (Automatic Gain Controller) unit 4, a waveform equalization unit 5, an A / D conversion unit 6, and a PLL unit 7.
- the reproducing unit 101 generates a digital signal from an analog signal indicating information reproduced from the information recording medium.
- the recording condition adjustment unit 102 includes a PRML unit 104, a signal evaluation index calculation unit 10, and an adjustment unit 105.
- the PRML unit 104 includes a variable PR equalization unit 8 and a variable maximum likelihood decoding unit 9.
- the adjustment unit 105 includes an edge shift detection unit 11 and an optical disk controller unit 12.
- the recording condition adjusting unit 102 is manufactured as a semiconductor chip, for example.
- the recording unit 103 includes a pattern generation unit 13, a recording compensation unit 14, and a laser driving unit 15.
- the optical head unit 2 converges the laser beam 2a that has passed through the objective lens 2b on the recording layer of the information recording medium 1, receives the reflected light, and outputs an analog reproduction signal indicating information recorded on the information recording medium 1. Generate.
- the numerical aperture of the objective lens 2b is 0.7 to 0.9, more preferably 0.85.
- the wavelength of the laser beam 2a is 410 nm or less, more preferably 405 nm.
- the preamplifier unit 3 amplifies the analog reproduction signal with a predetermined gain and outputs the amplified signal to the AGC 4.
- the AGC unit 4 amplifies the reproduction signal using a preset target gain so that the level of the reproduction signal output from the A / D conversion unit 6 becomes a constant level, and outputs the amplified signal to the waveform equalization unit 5 To do.
- the waveform equalization unit 5 has a filter characteristic that amplifies the high frequency range of the reproduction signal, and amplifies the high frequency portion of the reproduction waveform and outputs it to the A / D conversion unit 6.
- the PLL circuit 7 generates a reproduction clock that is synchronized with the reproduction signal after waveform equalization, and outputs it to the A / D converter 6.
- the A / D converter 6 samples the reproduction signal in synchronization with the reproduction clock output from the PLL circuit 7 and converts the analog reproduction signal into a digital reproduction signal.
- the A / D conversion unit 6 converts the analog reproduction signal into the digital reproduction signal 8, the PLL unit 7 and the AGC. Output to unit 4.
- the variable PR equalization unit 8 has a function of changing the filter characteristics to the characteristics of a plurality of PR methods.
- the variable PR equalization unit 8 has a frequency characteristic of the recording / reproduction system assumed by the variable maximum likelihood decoding unit 9 (for example, PR (1, 2, 2, 1) equalization characteristic, PR (1, 2, 2, 2, 1) Equalization characteristics, etc.), and PR equalization processing is performed to suppress high-frequency noise and intentionally add intersymbol interference to the reproduced signal. And output to the variable maximum likelihood decoder unit 9.
- a first method for switching the characteristics of the variable PR equalizer 8 will be described.
- A1 and A2 are used as A.
- the high frequency emphasis class using A1 can be changed to a class that does not emphasize the high frequency using A2.
- the PR equalization characteristic that emphasizes 2T is changed to the PR equalization characteristic that does not emphasize 2T.
- the variable PR equalization unit 8 changes the PR (a, b, b, a) equalization characteristics to PR (x, y, z, y, x) equalization characteristics.
- b / a A
- ((y + z) / 2) / ((x + y) / 2) B
- the high frequencies were emphasized by using the coefficients of x, y, z where A> B.
- a PR equalization characteristic that does not emphasize 2T by changing from PR (1, 2, 2, 1) equalization to PR (1, 2, 2, 2, 1) equalization and increasing the filter order. Can be changed to
- the variable maximum likelihood decoding unit 9 can switch the maximum likelihood decoding process in synchronization with the PR characteristic of the variable PR equalization unit 8. For example, when A1 is changed to A2 in the first method, the threshold used for the decoding process is changed to be optimal for A2. In the second method, the threshold value and the decoding rule used for the decoding process are changed to be optimal.
- the variable maximum likelihood decoding unit 9 is, for example, a Viterbi decoder, and uses a maximum likelihood decoding method that estimates a most likely sequence based on a code rule intentionally added according to the type of partial response.
- the reproduction signal PR-equalized by the equalizer 8 is decoded and binarized data is output.
- the binarized data is output as a demodulated binarized signal to a subsequent circuit (not shown), and a predetermined process is executed to reproduce information recorded on the information recording medium 1.
- the signal evaluation index calculation unit 10 receives the waveform-shaped digital reproduction signal output from the variable PR equalization unit 8 and the binarized signal output from the variable maximum likelihood decoding unit 9. The signal evaluation index calculation unit 10 determines the state transition from the binarized signal, and executes the calculation of (Equation 1) indicating the reliability of the decoding result from the determination result and the branch metric. Further, the signal evaluation index calculation unit 10 classifies the calculation results for each combination of mark length and space length based on the binarized signal. For example, a pulse signal is generated for each of the 18 patterns shown in Table 1 and the 8 patterns shown in Table 4 (for each pattern of the start / end edges of the recording mark) and is output to the edge shift detector 11.
- the edge shift detection unit 11 cumulatively adds the calculation results for each pattern, and obtains a deviation (also referred to as an edge shift) from the optimum value of the parameter for adjusting the edge position of the recording mark.
- the optical disk controller 12 changes the recording parameter (recording signal waveform) determined to be changed from the edge shift amount for each pattern. Furthermore, the optical disk controller unit 12 outputs a control signal for changing the PRML characteristic to the variable PR equalization unit 8, the variable maximum likelihood decoding unit 9, and the signal evaluation index calculation unit 10.
- the variable PR equalization unit 8, the variable maximum likelihood decoding unit 9, and the signal evaluation index calculation unit 10 may be different in processing and calculation depending on the characteristic change of the PRML. change.
- the pattern generator 13 outputs a recording pattern for adjusting the edge of the recording mark.
- the recording compensation unit 14 generates a laser emission waveform pattern according to the recording parameter and the recording pattern received from the optical disc controller unit 12.
- the laser drive unit 15 controls the laser emission operation of the optical head unit 2 in accordance with the generated laser emission waveform pattern.
- the optical disc controller unit 12 When executing the recording parameter adjustment, the optical disc controller unit 12 performs the recording compensation unit 14 so as to execute the initial value of the recording parameter described in the control data or the like of the optical disc medium and the trial recording shifted by several steps from the initial value. To instruct.
- the optical disk controller 12 outputs several patterns of recording parameters to the recording compensator 14.
- the pattern generator 13 outputs a recording pattern for adjusting the edge of the recording mark.
- the recording compensation unit 14 generates a laser emission waveform pattern according to the recording parameters and the recording pattern received from the optical disk controller unit 12.
- the laser drive unit 15 controls the laser emission operation of the optical head unit 2 in accordance with the generated laser emission waveform pattern. With this series of processing, trial recording for recording edge adjustment is completed. Next, the area where test recording was performed is reproduced.
- the optical disk controller unit 12 instructs the variable PR equalization unit 8, the variable maximum likelihood decoding unit 9, and the signal evaluation index calculation unit 10 so as to obtain the characteristics of PR1221ML.
- the variable PR equalization unit 8 shapes the waveform so that the output waveform has the PR1221 characteristic.
- the variable maximum likelihood decoding unit 9 changes the threshold used at the time of branch metric calculation to PR1221ML, and limits the number of states to 6 and the branch metric transition path to 10.
- the signal evaluation index calculation unit 10 calculates the above (Equation 1) to (Equation 3) based on the state transition path shown in Table 4 so that the reproduction signal evaluation index M for PR1221ML can be calculated.
- the edge shift detection unit 11 calculates and calculates the edge shift amount for each combination of mark length and space length, and outputs the result to the optical disc controller unit 12.
- the optical disk controller 12 obtains the optimum value of the parameter for adjusting the edge of the recording mark from the total edge shift amount, and outputs the optimum parameter to the recording compensation unit 14. Through this series of processing, the optimum value of the parameter for adjusting the edge of the recording mark can be obtained.
- the optical disk controller unit 12 instructs the variable PR equalization unit 8 and the variable maximum likelihood decoding unit 9 to have PR12221ML characteristics.
- the variable PR equalization unit 8 shapes the waveform so that the output waveform has PR12221 characteristics.
- the variable maximum likelihood decoding unit 9 changes the threshold used at the time of branch metric calculation to PR12221ML, and limits the number of states to 10 and the branch metric transition path to 16.
- the variable maximum likelihood decoding unit 9 decodes the reproduction signal and outputs binarized data. This binarized data is output as a demodulated binarized signal to a circuit (not shown) in the subsequent stage, and information (video, audio, character information, etc.) recorded on the information recording medium 1 by executing predetermined processing. ) Is played.
- the optical disk controller unit 12 when executing reproduction for measuring the recording quality of the recording area, has the variable PR equalization unit 8, the variable maximum likelihood decoding unit 9, and the signal evaluation index calculation so as to have the characteristics of PR1221ML.
- the unit 10 is instructed.
- the variable PR equalization unit 8 shapes the waveform so that the output waveform has PR12221 characteristics.
- the variable maximum likelihood decoding unit 9 changes the threshold used at the time of branch metric calculation to PR12221ML, and limits the number of states to 10 and the branch metric transition path to 16.
- the signal evaluation index calculation unit 10 calculates (Equation 1) to (Equation 3) based on the transition paths shown in Tables 1 to 3 so that the reproduction signal evaluation index M for PR12221ML can be calculated.
- the result is output to the edge shift detection unit 11.
- the edge shift detection unit 11 calculates and calculates the signal evaluation index M for each transition path shown in Tables 1 to 3 and outputs it to the optical disk controller unit 12.
- the optical disk controller unit 12 can determine the recording quality of the recording area from the aggregated signal evaluation index M.
- the edge shift detection unit 11 can be used not only as a block for counting only edge shifts but also as a block for counting signal evaluation indexes M.
- the recording parameter when adjusting the recording parameter (especially when adjusting the parameter related to the edge position of the boundary between the mark and the space), the recording parameter is adjusted by selecting the PRML characteristic that optimizes the recording characteristic. Optimize media recording quality. As a result, it is possible to easily achieve the recording margin of the system.
- the mark length such as 2T mark or 3T mark is adjusted to be small, and as a result, the recording margin is reduced (the allowable range of recording power deviation and strategy deviation is narrowed).
- the PLL that generates the synchronization signal from the reproduction signal becomes unstable.
- the signal evaluation index jitter is extremely deteriorated, and an apparatus using another discrimination method (for example, a level discrimination method) other than the PRML method for the reproduction system.
- reproduction becomes difficult, which may cause a problem in terms of compatibility with optical disk media.
- the mark length (or mark position) such as 2T mark and 3T mark can be adjusted so that the mark length has an appropriate length, and the recording margin can be maximized. It is possible to realize recording to be limited, to realize stability of a PLL that generates a synchronization signal from a reproduction signal, and to maintain stable compatibility of an optical disk medium.
- the playback margin of the system is maximized by selecting and playing the PRML characteristic that provides the best playback performance. can do.
- the reproduction performance of the system can be recognized by calculating the signal evaluation index M of the PRML characteristic used at the time of reproduction.
- the apparatus can support the recording state and recording performance of the media inserted in the optical disk apparatus. For example, it can be determined from the change in the value of the signal evaluation index M in the area recorded by trial recording with the recording power changed or the value of the signal evaluation index M in the area recorded with the optimum recording parameter.
- servo parameters may be optimized using the signal evaluation index M.
- the value of the index M changes sensitively to a parameter change it is possible to perform adjustment by switching to a PRML characteristic having a worse reproduction performance than the PRML characteristic used for reproduction.
- the method of finding the valley of the change of the evaluation index M by changing the parameter and extracting the optimum value of the parameter it is possible to find the valley with a small change of the parameter, which occurs when the parameter is changed greatly. It is possible to prevent a possible state such as servo detachment and to stabilize the system.
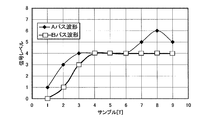
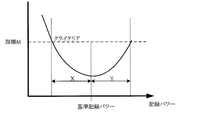
- FIG. 10 shows the relationship between the index M of each PRML characteristic and the focus parameter.
- PR12221ML shows higher reproduction performance than PR1221M
- adjusting the focus parameter with the index M of PR1221ML can detect the valley of the index M more accurately in the range where the parameter change is smaller.
- FIG. 11 shows an optical disc apparatus 200 that optimizes such servo parameters.
- the components of the optical disk device 200 are substantially the same as those of the optical disk device 100 (FIG. 1), but some components are not shown for the sake of simplicity.
- the optical disc apparatus 200 further includes a servo control unit 16.
- the servo control unit 16 performs control necessary for accessing a specific position of the optical disk medium, such as position control of the optical head unit 2, focus position control, spherical aberration position control, and tracking position control.
- the optical disk controller 12 outputs the optimum value of the focus parameter (FIG. 10) to the servo controller 16.
- the servo control unit 16 controls the focus position using the parameter.
- the spherical aberration position parameter, the tracking position parameter, and the like are similarly obtained and each servo parameter is optimized, so that the recording / reproducing operation of the optical disc apparatus can be stabilized.
- the optimization of servo parameters can be performed not only with respect to servo parameters at the time of reproduction but also with respect to servo parameters at the time of recording.
- the calculation of the signal evaluation index varies depending on the PRML characteristic, simultaneously with the switching of the PRML characteristic, the calculation of the signal evaluation index is switched to the calculation that matches the selected PRML characteristic.
- the PR1221ML system and the PR12221ML system have been described as the PRML system, but the present invention is not limited to this.
- the effect of the present invention can be obtained in the same way even if the PRML system is combined with another that can implement the gist of the present invention.
- the trial recording is not necessarily required, and the recording parameter may be corrected by detecting the edge shift from the information recorded with the initial recording parameter.
- variable PR equalization unit 8 may have a FIR (Finite Impulse Response) filter configuration and may adaptively control the tap coefficient using an LMS (The Last-Mean Square) algorithm (Non-patent Document 2). reference).
- FIR Finite Impulse Response
- LMS The Last-Mean Square
- the PRML characteristics may be switched according to the recording density when information is recorded on the optical disk medium. In this case, as a result, the same PRML characteristic may be selected in all cases.
- the optical disk controller unit 12 may switch the equalization characteristic of the waveform equalization unit 5 in accordance with the switching of the PRML characteristic.
- Waveform equalization of the waveform equalization unit 5 has a role of ensuring the stability of the PLL by shaping the waveform at the previous stage of the PLL unit 7 and a role of improving the output characteristics of the variable PR equalization unit 8. is there.
- By synchronizing the waveform equalization characteristic of the waveform equalization unit 5 in synchronization with switching the PRML characteristic to the high frequency emphasis type or the non-high frequency emphasis type the stability of the PLL is ensured and variable PR equalization is performed.
- the output characteristics of the part 8 can be improved. If these two characteristics are not compatible, two waveform equalization units may be provided for PLL and PRML.
- the gain of the characteristic of the waveform equalizing unit for PLL is increased (for example, the characteristic of increasing the amplitude of the high frequency is set), and the characteristic of the waveform equalizing unit for PR equalization is increased. What is necessary is just to lower the gain (for example, to reduce the amplitude of the high frequency). Further, only the waveform equalization for PLL may be performed.
- the waveform equalization unit 5 may be arranged after the A / D conversion unit 6 and function as a digital waveform equalization unit.
- the recording parameter correlated with the edge shift is adjusted, but the recording parameter to be adjusted is not particularly limited.
- the recording parameter to be adjusted may be the start position or end position of the recording signal waveform, or the height (recording power) of the recording waveform. That is, any recording parameter may be used as long as the edge position of the mark can be adjusted.
- the recording parameter to be adjusted may be recording power.
- the mark length can be calculated from the edge shift direction and shift amount, and the recording power may be adjusted so that the mark length becomes a predetermined length.
- the preamplifier unit 3, the AGC unit 4, and the waveform equalization unit 5 shown in FIG. 1 may be configured as one analog integrated circuit (LSI).
- the unit 14 may be configured as one integrated circuit (LSI) mixed with analog and digital.
- this integrated analog-digital integrated circuit may include a preamplifier unit 3, an AGC unit 4, and a waveform equalization unit 5.
- the laser driving unit 15 may be configured as one driver LSI and may be incorporated in the optical head unit 2.
- optical disk devices 100 and 200 described above are recording / reproducing devices, they may be reproduction-only devices. In this case, the pattern generating unit 13 and the recording compensating unit 14 may be omitted. In this case, the servo controller 16 may be included as one block of the analog-digital mixed integrated circuit. A servo control unit 16 may be added to the optical disc apparatus 100. These configuration examples of the optical disc apparatus do not limit the present invention, and may have other configurations.
- each access command such as a recording access command, a reproduction access command, and a measurement access command.
- FIG. 12 is a diagram showing an optical disc apparatus 300 according to the second embodiment of the present invention.
- the optical disc apparatus 300 includes the same constituent elements as those of the optical disc apparatus 100 (FIG. 1) except that the constituent elements included in the recording condition adjustment unit 102 are different.
- the signal evaluation index calculation unit 10 of the optical disc apparatus 300 calculates (detects) the evaluation index for the pattern shown in Table 1, calculates (detects) the evaluation index for the pattern shown in Table 2, and evaluates the pattern shown in Table 3. Calculate (detect) the index. The value of the evaluation index is detected by calculating the evaluation index.
- the optical disc apparatus 300 further includes a selection unit 17. The selection unit 17 selects which of the calculation results (detection results) to be output to the optical disk controller unit 12.
- the selection unit 17 receives the control signal from the optical disc controller unit 12 and selects which pattern signal evaluation index detection result is output from among the patterns shown in Tables 1 to 3. It is possible to select all or some of the patterns shown in Tables 1 to 3.
- the optical disk controller unit 12 instructs the variable PR equalization unit 8 and the variable maximum likelihood decoding unit 9 of the PRML detection unit 104 to select the PR12221ML method.
- the optical disk controller 12 instructs the selection unit 17 to output only the Table 1 pattern evaluation index detection result in the signal evaluation index calculation unit 10.
- the optical disk controller 12 recognizes the detection result as a signal evaluation value, and recognizes the signal quality of the reproduced digital signal obtained by reproducing the recording area.
- a higher-order PRML method such as the PR12221ML method is a method for recognizing a reproduction signal waveform using a waveform pattern of a longer section in order to identify the reproduction signal under the influence of intersymbol interference.
- the longer interval is the longer path distance that merges with the minimum waveform distance. This is a section (the transition of time K is long).
- the waveform distance is an expression indicating the degree of separation between two waveforms that may be a reference waveform when performing Viterbi decoding.
- the pattern that is most likely to be mistaken is a pattern of paths that merge at the minimum waveform distance.
- the evaluation pattern shown in Table 2 is a pattern in which the 2T signal corresponding to the 2T mark (or 2T space) is isolated, it has two edges (zero-cross information) at the start and end of the 2T signal.
- the zero cross information indicates the zero cross portion of the signal. Since the error of one zero cross information cannot be separated and detected from one pattern, it is difficult to individually adjust the zero cross portion when adjusting the recording parameter for each mark length while paying attention to the zero cross information.
- the evaluation pattern shown in Table 3 includes a pattern in which the 2T signal is continuous and a pattern in which the 2T signal is not before or after the 2T signal and has a plurality of zero-cross information. Since the error of one zero cross information cannot be separated and detected from one pattern, it is difficult to individually adjust the zero cross portion when adjusting the recording parameter for each mark length while paying attention to the zero cross information.
- the evaluation pattern shown in Table 1 is a pattern having only one zero-cross information, although it is not the most error-prone pattern in PR12221ML. Since one zero-cross information error can be separated and detected from one pattern, the zero-cross portion can be individually adjusted when adjusting the recording parameter for each mark length while paying attention to the zero-cross information.
- the PR12221ML system is a PRML system in which a plurality of zero-cross information (zero-cross portions) are included in the confluence path of the minimum difference metric, and in this embodiment, the signal quality of the reproduced digital signal is calculated using the PR12221ML system.
- the signal quality is detected by calculating the evaluation index using only the state transition pattern in which only one zero-cross information is included in the confluence path of the non-minimum difference metric.
- the state transition pattern in which only one zero-cross information is included in the merge path of the non-minimum difference metric is the state transition pattern shown in Table 1.
- detection and evaluation of this zero-cross portion is a very important factor for evaluating and adjusting the quality of a recorded area.
- variable PR equalization unit 8 and the variable maximum likelihood decoding unit 9 illustrated in FIG. 12 do not have to be configured to be able to switch the PRML method.
- the structure fixed to PR12221ML system may be sufficient.
- an index most correlated with the error rate (an index corresponding to the most prone pattern) was used as a signal evaluation index.
- Tables 2 and 3 it is possible to cope with signal processing to some extent because it is known in advance that the pattern is related to the shortest mark. What is important is dealing with SN, erasure characteristics, archival characteristics (maintenance of recording quality, difficulty of disappearing with age), etc. that cannot be dealt with by signal processing. Whether these characteristics are good or not is determined using information on zero crossing. For this reason, it is desirable to select and evaluate a pattern suitable for the recording method of the optical disk medium in evaluating the recording state in any higher order PRML method.
- the PR1221ML system is adopted up to a predetermined recording linear density, and the PR12221ML system is used when reproducing recording information with a recording linear density higher than that.
- the recording linear density of the BD will be described with reference to FIGS.
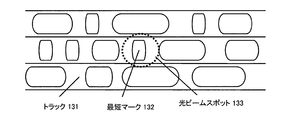
- data is recorded on the track 131 as a mark row generated by a physical change in the recording layer, like a DVD (Digital Versatile Disc).
- the shortest mark 132 in the mark row is the shortest mark 132.
- the physical length is 0.149 ⁇ m. This corresponds to about 1 / 2.7 of the shortest mark length of a DVD.
- the resolution of the laser is increased by changing the wavelength parameter (405 nm) and NA parameter (0.85) of the optical system, the recorded mark can be recorded. It is approaching the limit of optical resolution, which is the limit that can be identified.
- the shortest mark length of the mark is 2T, and the shortest space length of the space is also 2T.
- FIG. 13 shows a state in which the light beam spot 133 is formed on the mark row recorded on the track 131.
- the diameter of the light spot 133 is about 0.39 ⁇ m due to the optical system parameters.
- the reproduction signal amplitude decreases as the recording mark becomes shorter and becomes zero at the limit of optical resolution.
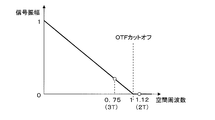
- the reciprocal of the recording mark period is called a spatial frequency, and the relationship between the spatial frequency and the signal amplitude is called an OTF (Optical Transfer Function).
- OTF Optical Transfer Function
- the signal amplitude decreases almost linearly as the spatial frequency increases, and the limit of reproduction at which the amplitude becomes zero is referred to as OTF cutoff.
- FIG. 14 shows the relationship between the OTF of a BD having a 25 GB recording capacity and the shortest recording mark.
- the spatial frequency of the shortest mark of the BD is 80% of the OTF cutoff frequency (spatial frequency that becomes the OTF cutoff), which is close to the OTF cutoff frequency. Also, the reproduction signal amplitude of the shortest mark is very small, about 10%. The reproduction of the shortest mark on the BD results in an OTF cutoff, that is, the recording linear density at which almost no reproduction amplitude appears is equivalent to about 31 GB in the BD.
- the optical resolution may be limited or exceeded, and the reproduction amplitude of the reproduction signal becomes small and the SNR abruptly increases. to degrade.
- the recording linear density for switching between the PR1221ML system and the PR12221ML system is BD
- the recording linear density is equivalent to 31 GB.
- the recording linear density at which the spatial frequency of the shortest mark becomes the OTF cutoff frequency is 31.8 GB in calculation, and it is desirable to switch between the PR1221ML system and the PR12221ML system at a stage where the linear density is smaller than 31.8 GB.
- the recording linear density to be switched may be lower than 31 GB or higher in consideration of not only the laser resolution but also the SNR related to the recording characteristics of the media.
- the recording linear density per recording layer of the information recording medium 1 is, for example, 31 GB or more, and may be 31.8 GB or more.
- the recording linear density per recording layer is about 33.3 GB.
- the information recording medium 1 may include three or more recording layers, and the total recording linear density of the three recording layers is about 100 GB.
- PRML method is an example, and the present invention is not limited to this.
- a PRML method corresponding to the recording linear density may be selected.
- the detection and evaluation of the zero-cross portion is a very important factor for evaluating and adjusting the quality of the recorded area. It becomes.
- An example of a signal evaluation method using the zero cross portion will be described.
- the signal evaluation index calculation unit 10 of the optical disc apparatus 300 calculates and detects the table 1 pattern evaluation index (the signal evaluation index for the pattern shown in Table 1), and the detection result includes the mark length and the space length. Separated for each combination. By the separation, the edge shift and SNR for each pattern can be known.
- the calculation of (Equation 1) shown in the description of Embodiment 1 of the present invention may be performed, and the calculation result may be used as an index of a jitter-like distribution.
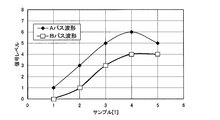
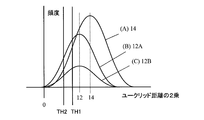
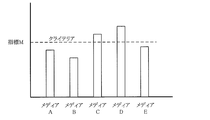
- FIG. 15 shows the distribution (result distribution of the value of the index D) of the signal evaluation index calculation (formula 1) for the patterns shown in Table 1.
- the horizontal axis is the value of D obtained in (Equation 1), and the vertical axis is the frequency.
- the square of d in (Expression 1) is 14.
- FIG. 15A shows a distribution in which the average value of the distribution is almost 0 and the standard deviation ⁇ is also a relatively small value, and is an example showing that the reproduction signal quality is good.
- FIG. 15B shows a distribution in which the standard deviation ⁇ is a relatively small value, but the average value of the distribution is shifted, and an example in which the corresponding pattern causes an edge shift.
- FIG. 15C shows a distribution in which the average value of the distribution is almost 0 but the standard deviation ⁇ is relatively large, and is an example showing that the SNR of the edge of the corresponding pattern is bad. If the signal quality is analyzed separately for each combination of mark length and space length using these evaluation methods, the quality of the recording mark formed on the optical disk medium can be accurately evaluated.
- At least one of the degree of the SN ratio of the reproduced digital signal and the degree of edge shift is determined based on the calculated signal quality.
- the degree of edge shift of the reproduced digital signal can be determined from the average value of the calculated distribution of quality evaluation index values. Further, the degree of the S / N ratio of the reproduced digital signal can be determined from the standard deviation of the calculated distribution of quality evaluation index values.
- the recording parameters may be changed and recorded so that the edge shift and the SNR are improved for each combination of the mark length and the space length.
- the improvement of the edge shift is to make the average value of the distribution as close to 0 as possible
- the improvement of the SNR is to make the standard deviation ⁇ small.
- the optical disk controller unit 12 may receive an evaluation result from the signal evaluation index calculation unit 10, determine which recording parameter should be changed, and output the changed parameter to the recording compensation unit 14.
- the recording parameters include a recording power parameter, a recording pulse position parameter, and the like.
- the above-described servo parameters focus position parameter, spherical aberration position parameter, tracking position parameter, etc.
- the edge shift and the SNR may be separated and evaluated separately, or both may be evaluated, or the calculation result may be separately evaluated for each pattern.
- the target of these evaluation values should be set in a range where a sufficient system margin can be secured. If the variance value of D obtained by (Equation 1) is normalized by TW, it should be used as an evaluation value correlated with the error rate. Can do.
- TW is 2 ⁇ d squared.
- the target value of the total index may be set to 10%, and evaluation may be performed with a target for each element. For example, the evaluation may be performed with the target value of edge deviation set to 4.3%. Further, the evaluation may be performed by setting the target value of SNR to 9%.
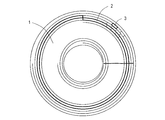
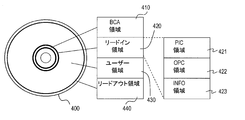
- FIG. 16 is a diagram showing the information recording medium 1 of the present embodiment.
- the information recording medium 1 is mounted on the optical disc apparatuses 100 to 300 described above.
- FIG. 16 shows a multilayer phase change thin film disk medium as an example of the information recording medium 1, but it may be a single layer structure disk medium having only one recording layer.
- the information recording medium 1 shown in FIG. 16 includes n recording layers (n is an integer of 2 or more).
- the information recording medium 1 includes a cover layer (protective layer) 162, recording layers Ln to L0, and a polycarbonate substrate 161 from the irradiation side of the laser beam 2a (FIG. 1).
- An intermediate layer 163 that functions as an optical buffer material is inserted between the recording layers Ln to L0.
- the thickness of the substrate 161 is 1.1 mm, for example.
- the thickness of the cover layer (protective layer) 162 is, for example, 10 ⁇ m to 200 ⁇ m, and more preferably 100 ⁇ m or less.
- An irradiation direction 164 of the laser beam 2a (FIG. 1) is a direction from the optical head unit 2 toward the cover layer 162 of the information recording medium 1, and the laser beam 2a is incident on the information recording medium 1 from the cover layer 162 side of the information recording medium 1.
- the multi-layered recording layer may have various effects on the reproduction operation. For example, the reduction in reflectivity due to the inability to optimize the permeability balance due to multilayering, the reduction in SNR due to interlayer crosstalk by reducing the intermediate layer width, and stray light due to the configuration of the optical head unit A decrease in SNR or the like occurs. A method for appropriately and quantitatively measuring these SNRs is desired.
- the patterns shown in Tables 2 and 3 include 2T signal isolated patterns or 2T signal repeat patterns.
- the PR12221ML method is a method of reproduction in the expectation that the 2T amplitude is reproduced as 0 (the center level of the waveform). Therefore, when evaluating a reproduction signal waveform in which the DC level of the 2T signal greatly deviates, that is, an asymmetry waveform, even in a recording state where there is no edge shift and good SNR, the evaluation index is greatly affected by the DC level shift. .
- the characteristics of the media and the characteristics of the optical head unit can be appropriately evaluated by evaluating using the patterns shown in Table 1.
- the present invention is also useful for evaluating a single layer structure medium having only one recording layer. Further, the present invention is useful not only for recording type information recording media but also for evaluating ROM (Read Only Memory) type information recording media.
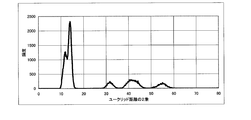
- FIG. 17 is a distribution diagram of difference metrics in the PR12221ML signal processing.
- the horizontal axis represents the square of the Euclidean distance, and the vertical axis represents the frequency. It shows that the smaller the square of the Euclidean distance, there is a possibility of an error in PR12221ML signal processing. From FIG. 17, it can be seen that the square of the Euclidean distance has a group of distributions at portions 12 and 14, and there are only 30 or more groups with higher values. That is, in order to obtain a signal index highly correlated with the error rate, it is sufficient to focus on the group of Euclidean distance squares 12 and 14. This group is the pattern of Table 1, Table 2, and Table 3.
- FIG. 18 shows the distribution of the difference metric part
- the distribution (A) in FIG. 18 is an example of the distribution of only the pattern in Table 1 in which the square of the Euclidean distance is 14, and this distribution is almost distributed around the square of the Euclidean distance.
- the distribution (B) in FIG. 18 is an example of the distribution of only the pattern in Table 2 in which the square of the Euclidean distance is 12, and this distribution is almost distributed around the square of the Euclidean distance of 12.
- the distribution (C) in FIG. 18 is an example of the distribution of only the pattern in Table 3 in which the square of the Euclidean distance is 12, and this distribution is almost distributed around the square of the Euclidean distance of 12.
- the pattern in Table 1, the pattern in Table 2, and the pattern in Table 3 have different Euclidean distances, but the number of error occurrences is also different, as can be seen from the 0 and 1 sequences in the table.
- the Table 1 pattern in which the square of the Euclidean distance is 14 is a pattern in which a 1-bit error occurs
- the Table 2 pattern in which the square of the Euclidean distance is 12 is a pattern in which a 2-bit error is generated.
- Table 3 pattern with a power of 12 is a pattern in which an error of 3 bits or more occurs.
- the pattern in Table 3 depends on the number of 2T continuations. For example, if the recording modulation code allows up to 6 continuations, a maximum 6-bit error occurs. In Table 3, although 6-bit errors are not expressed, 2T continuous patterns may be expanded. In order to simplify the explanation, it is omitted in Table 3.
- the patterns in each table have different occurrence probabilities in the recording modulation code sequence.
- the pattern in Table 1 is about 40% for all samples
- the pattern in Table 2 is about 15% for all samples
- the pattern in Table 3 is about 5% for all samples. It becomes.
- the distributions (A), (B), and (C) in FIG. 18 are different in error because the standard deviation ⁇ indicating variation, the detection window (Euclidean distance), the occurrence frequency, and the weight for the number of error bits are different. The impact will be different.
- Equation 4 shows an equation for obtaining a difference metric using the pattern of Table 1.
- the difference metric will be briefly described.
- a binarized signal is generated from a reproduction signal reproduced from the disc by PRML processing.
- One of the recording code patterns shown in Table 1 is detected from the binarized signal, is used as a positive pattern, and a PR equalized ideal value (ideal signal) corresponding to the positive pattern is calculated.
- an erroneous pattern that is compared with the positive pattern and a PR equalization ideal value corresponding to the erroneous pattern are calculated.
- the PR equalization ideal value corresponding to the positive pattern is (1, 3, 5 , 6, 5).
- the PR equalization ideal value corresponding to the erroneous pattern is (0, 1, 3, 4, 4).
- the square value of the Euclidean distance is 14 because it is the square of the difference between the PR equalization ideal values of the positive pattern and the erroneous pattern.
- the square value of the difference between the reproduced signal series and the PR equalized ideal value corresponding to the positive pattern is obtained, and this is defined as PB.
- the square value of the difference between the reproduced signal series and the PR equalized ideal value corresponding to the erroneous pattern is obtained and is defined as PA.
- the difference PA-PB is obtained.
- This difference information is offset by the square value (14) of the difference between the PR equalization ideal values of the correct pattern and the incorrect pattern. This is an operation corresponding to (Equation 4).
- offset is performed by the square value (14) of the difference between the PR equalization ideal values of the positive pattern and the erroneous pattern, but this is not particularly necessary. It is described for convenience of calculation so that the center of the distribution becomes zero.
- PB may be the calculation result of the distance between the expected value of the positive pattern and the signal
- PA may be the calculation result of the distance between the expected value of the erroneous pattern corresponding to the positive pattern and the signal.
- the PA-PB calculation result has a distribution centered on the square value 14 of the ideal Euclidean distance, and the absolute value calculation as shown in (Expression 4) is not necessary.
- (Expression 5) represents an expression for obtaining a difference metric using the pattern of Table 2.
- (Expression 6) shows an expression for obtaining a difference metric using the pattern of Table 3.
- the probability of occurrence of an error can be obtained from (Expression 7) using ⁇ (variance) of the distribution.
- p is the occurrence probability of the distribution component for all channel points.
- the difference metric according to the pattern of Table 1 can be calculated by (Expression 4), and an example of the distribution is the distribution (A) in FIG.
- the probability of occurrence of an error occurring in the pattern of Table 1 obtained from this distribution can be obtained from (Equation 8).
- p 14 is the probability of the components of the distribution for all channels points. Further, since an error occurring in the pattern of Table 1 is a 1-bit error, 1 is multiplied.
- the difference metric according to the pattern in Table 2 can be calculated by (Equation 5), and an example of the distribution is the distribution (B) in FIG.
- the probability of occurrence of an error occurring in the pattern of Table 2 obtained from this distribution can be obtained from (Equation 9).
- p 12A is the occurrence probability of the distribution component for all channel points. Further, since an error occurring in the pattern of Table 2 is a 2-bit error, it is multiplied by 2.
- the difference metric according to the pattern in Table 3 can be calculated by (Equation 6), and an example of the distribution is the distribution (C) in FIG.
- the probability of occurrence of an error occurring in the pattern of Table 3 obtained from this distribution can be obtained from (Equation 10).
- p 12B is the occurrence probability of the distribution component for all channel points. Further, since an error occurring in the pattern of Table 3 is a 3-bit error, it is multiplied by 3.
- Equation 11 can be sufficiently defined as a signal index, and can be a signal index having a correlation with an actual error.
- the error rate obtained by (Equation 11) is input to the left side of (Equation 7), ⁇ is calculated backward, and ⁇ obtained is normalized by a predetermined window.
- p in (Equation 7) is the probability of occurrence of distribution components with respect to the total number of channels, which is obtained by adding p 14 , p 12A and p 12B .
- Equation 7 can be transformed into (Equation 12).
- erfc () is an integral value of the complementary error function.
- the definition formula of the signal index is (Formula 13).
- the present invention provides a signal evaluation method and an evaluation index that are highly correlated with an error rate, and focuses on a pattern of a confluence path having a relatively small Euclidean distance in PRML signal processing. Then, one signal evaluation index is generated from the distribution of a plurality of pattern groups having different occurrence probabilities and different numbers of generated error bits. For this purpose, error occurrence probabilities are obtained from the respective distributions, the sum of them is calculated, and the total ⁇ is calculated from the calculated error rate to obtain signal evaluation.
- FIG. 19 is an example of a simulation result showing a bit error rate when a reproduction stress such as tilt, defocus, and spherical aberration is applied, and a signal index value [%] in (Equation 13).
- the solid line in the figure is a theoretical curve that can be obtained from (Equation 14).
- the calculation example of the signal evaluation index has been described by dividing into three pattern groups as the pattern of the confluence path having a relatively small Euclidean distance in the PRML signal processing.
- the present invention is not limited to this.
- Table 1 patterns with a square of Euclidean distance of 14 are treated as one group, but Table 1 is further classified for each feature of the pattern, and a difference metric is calculated (corresponding to (Equation 4)). Rate calculation (corresponding to (Equation 8)) may be performed.
- the pattern classification for each feature is, for example, classification of the start end and end of the recording mark. In some cases, the recorded record mark is not appropriate, and a reproduced waveform with nonlinear distortion is detected. In this case, when the distribution of FIG.
- the signal index value of the present invention may be calculated by further classifying into characteristic pattern groups.
- the signal index values of the present invention may be calculated by classifying the patterns in Tables 2 and 3 into characteristic pattern groups.
- a group including an isolated 2T mark and a group including an isolated 2T space may be classified.
- a group including the 2T mark 2T space and a group including the 2T space 2T mark may be classified.
- pattern classification is not limited to the above example.
- Tables 1 to 3 pattern classification having a good correlation with the performance (bit error rate) of PRML signal processing may be used.
- the 12 has a pattern detection unit that detects one of the recording code patterns shown in Table 1 based on the binarized data output from the PRML detection unit.
- the pattern detected by the pattern detection unit is assumed to be a positive pattern, an ideal PR equalization value corresponding to the positive pattern is calculated, and an erroneous pattern compared to the positive pattern and an ideal PR equalization value corresponding to the erroneous pattern are calculated.
- the PR equalization ideal value corresponding to the positive pattern is (1, 3, 5 , 6, 5).
- the erroneous pattern is (0, 0, 0, 0, 0, 1, 1, 0, 0)
- the PR equalization ideal value corresponding to the erroneous pattern is (0, 1, 3, 4, 4).
- the square value of the Euclidean distance is 14 because it is the square of the difference between the PR equalization ideal values of the positive pattern and the erroneous pattern.
- the present invention is not limited to fixing the ideal value as shown in the table. When the signal processing for changing the PR equalized ideal value according to the reproduction signal is supported, the fixed value as shown in the table is used. Instead, the configuration may be updated according to the reproduction signal.
- the square value of the difference between the reproduced signal series and the PR equalized ideal value corresponding to the positive pattern is obtained, and is defined as PA.
- the square value of the difference between the reproduced signal series and the PR equalized ideal value corresponding to the erroneous pattern is obtained, and this is defined as PB.
- the signal evaluation index unit 10 has
- the patterns in Table 2 and Table 3 are processed in the same manner as the pattern in Table 1. These processes are arithmetic processes corresponding to the above (Expression 4), (Expression 5), and (Expression 6). Further, the signal evaluation index unit 10 of FIG. 12 has a pattern detection number counter for detecting the occurrence frequency of the patterns in Table 1, the patterns in Table 2, and the patterns in Table 3. For example, if any of the patterns in Table 1 is detected by the detection unit, the counter is incremented by one.
- the optical disk controller 12 in FIG. 12 includes values corresponding to (Equation 4), (Equation 5), and (Equation 6) detected and calculated by the signal evaluation indicator 10 from the signal evaluation indicator 10 and the number of each table. And the occurrence probability is calculated. Using the above (Expression 8), (Expression 9), (Expression 10), and (Expression 11), a calculation error rate is calculated from the variance of each pattern group. A signal index M is calculated from the obtained bit error rate using (Equation 14).
- the estimated error rate of each pattern group obtained by the above is not particularly limited to the above.
- the bit error rate was estimated from ⁇ of each pattern group, occurrence probability, and weight of the number of errors.
- the number of differential metric values of a specific pattern group, as introduced in Patent Document 4 exceeds a predetermined threshold (SL in Patent Document 4), and the bit error rate is estimated from the obtained number It may be a method to do.
- a method for estimating the bit error rate of each group from the difference metric value of the pattern group will be described according to the embodiment of the present invention.
- FIG. 20 shows a distribution map of each pattern group of the differential metric described in FIG.
- the distribution (A) is a pattern in which the square of the Euclidean distance shown in Table 1 is 14, and the distribution (B) is a pattern in which the square of the Euclidean distance shown in Table 2 is 12, and the distribution (C) Is a pattern in which the square of the Euclidean distance shown in Table 3 is 12.
- Pb is the square distance between the detected pattern and the reproduced signal
- Pa is the square distance between the wrong pattern and the reproduced signal compared with the detected pattern. Therefore, the smaller the detected difference metric, the greater the probability that an error will occur. The base closer to 0 in each distribution in FIG. 20 means that the error occurrence probability becomes large.
- errors where the difference metric Pa-Pb is equal to or less than a predetermined value are counted.
- the number of times a pattern having a square Euclidean distance of 14 shown in the distribution (A) of FIG. 20 is detected is counted to obtain a count value C14.
- the number of times that the difference metric Pa ⁇ Pb is equal to or less than TH1 is counted to obtain a count value TH14.
- the obtained number of times of detection for each pattern group and the number of times exceeding a predetermined threshold are obtained, and the bit error rate estimated for each pattern group is calculated from the number of times.
- the error rate that occurs in the pattern group with the square of the Euclidean distance shown by the distribution (A) in FIG. 20 is obtained from the calculation result of TH14 / C14 as a probability of exceeding a predetermined threshold. Therefore, assuming a normal distribution with an average value of 0 and a standard deviation of 1, the ⁇ of the normal distribution can be calculated by calculating an inverse function of the standard normal cumulative distribution function. Furthermore, based on the obtained ⁇ , the probability that the distribution (A) in FIG. 20 is 0 or less can be obtained using a standard normal cumulative distribution function. Furthermore, the occurrence probability (expressed as p 14 in the above) of the pattern group whose square of the Euclidean distance shown by the distribution (A) in FIG. 20 in the measured data amount is 14 and the number of error bits (1 in the case of 14 patterns). And the error rate that occurs in the pattern group having the square of the Euclidean distance of 14 can be estimated.
- the occurrence probability (expressed as p 12A in the above) of the pattern group whose square of the Euclidean distance shown in the distribution (B) of FIG. 20 is 12 is multiplied by the number of error bits (2 in the case of the 12A pattern).
- the occurrence probability (expressed as p 12B in the above) of the pattern group having the square of the Euclidean distance shown by the distribution (C) in FIG. 20 is multiplied by the number of error bits (3 in the case of the 12B pattern).
- the method of adding the bit error rates obtained in each pattern group, inversely calculating ⁇ from the error rate, and using the ⁇ as a signal index is the same as the method described in the embodiment of the present invention. is there.
- this method is not a method of estimating the error rate from ⁇ obtained by calculation of the differential metric (Pa-Pb), but the number of times that the calculation result of the differential metric simply exceeds a predetermined threshold is counted. Since the error rate is estimated from the result, it is more susceptible to defects such as scratches and fingerprints than the method of estimating from the ⁇ . For this reason, it is necessary to take measures such as lengthening the measurement section.
- the method of estimating the error rate generated for each pattern group is not limited to the method described above, and may be the method described here. Of course, the method is not limited to the two bit error rate estimation methods described in the present embodiment, and other methods may be used.
- a predetermined threshold value is provided in the circuit for detecting the differential metric of the signal evaluation index calculation unit 10 in FIG. In each pattern, when the difference metric is equal to or less than a predetermined threshold, the count is incremented.
- the expansion of the detection range (2T continuous number detection range) described above in Table 3 is considered. Even if it is not, it is considered as a problem as an evaluation index and may be omitted.
- waveforms at the same time may be counted as a plurality of evaluation values, and the problem and solving means will be described.
- the patterns in Tables 1, 2 and 3 are described as specific examples as the evaluation patterns. There are overlapping patterns in the patterns in Table 1, Table 2, and Table 3, and waveforms at the same time may be counted as a plurality of evaluation values.
- the evaluation pattern groups of Table 1, Table 2, and Table 3 the number of errors that occur is different and the waveform at the same time is subjected to a plurality of different weighted evaluations. Therefore, the evaluation value is correctly calculated depending on the signal quality. This may not be possible.
- 21 (a) and 21 (b) show that the binarized pattern reproduced by the Viterbi decoder is the pattern described in the first pattern in Table 2 (recording code: 0, 0, 0, 0, 1, 1, 1). , 0, 0, 0, 0, 0), the ideal waveform and binarization pattern of the erroneous pattern corresponding to the positive pattern are shown.
- the waveform C in FIG. 21 is an ideal waveform with a positive pattern.
- the waveform B and the waveform C of the pattern (recording code: 0, 0, 0, 0, 1, 1, 1, 0, 0) described in Table 1 that is a candidate for an erroneous pattern In the meantime, the evaluation value described above can be obtained.
- the evaluation value described above is obtained between D and waveform C.
- the evaluation value described above is obtained between D and waveform C (in this example, a waveform two hours before the positive pattern).
- waveforms at the same time may be counted as multiple evaluation values.
- the meaning of the comparison between the waveform C (which is a positive pattern) and each waveform is that, in the case of comparison with the waveform A, the isolation of 2T increases by 1T on the terminal side, and may be determined as 3T. It is a comparison.
- the comparison with the waveform B is a comparison with the possibility that the isolation of 2T becomes 1T larger on the start end side and is determined to be 3T.
- the comparison with the waveform D is a comparison with the possibility that 2T isolation is determined to shift by 2T in the delay time axis direction.
- the 2T isolation is a comparison with the possibility of being determined to shift 2T in the advance time axis direction.
- the detection time of the detection pattern described with reference to FIG. 21 is an example, and may be detected at different timings depending on the circuit configuration. For example, if a specific pattern in Table 1, Table 2, and Table 3 is detected at the center of the time axis of the pattern, the detection time is different from that in FIG.
- the example of the detection time in FIG. 21 is an example in which the detection time is set as the time at which a possible joining path is determined.
- the detection confirmation time is not limited to the present embodiment.
- the table pattern itself may not be detected. Only a portion other than the pattern difference information may be held to detect a specific pattern. Further, the specific pattern may be obtained by calculation.
- the method for detecting a specific pattern is not limited to the present embodiment.
- the magnitude relationship between the detected difference metric value and the ideal Euclidean distance may be detected.
- the detection result and the number of detections may not be output (may be output as 0).
- FIG. 22 is a diagram showing the signal evaluation index calculation unit 10 provided in the optical disc apparatus 300 of FIG.
- the configuration of the signal evaluation index calculation unit 10, the selection unit 17, and the optical disk controller 12 is different from the apparatus shown in FIG.
- the table 1 pattern evaluation index detection unit of the signal evaluation index calculation unit 10 in FIG. 12 includes a pattern detection unit 201, a difference metric calculation unit 202, a pattern count unit 203, a standard deviation calculation unit 204, and an error calculation in FIG. Part 213.
- the table 2 pattern evaluation index detection unit of the signal evaluation index calculation unit 10 in FIG. 12 includes a pattern detection unit 205, a difference metric calculation unit 207, a pattern count unit 206, a standard deviation calculation unit 208, and an error calculation in FIG. Part 214.
- the table 3 pattern evaluation index detection unit of the signal evaluation index calculation unit 10 in FIG. 12 includes a pattern detection unit 209, a difference metric calculation unit 211, a pattern count unit 210, a standard deviation calculation unit 212, and an error calculation in FIG. Part 215.
- the adder 216 and the standard deviation calculator 217 are included in the optical disc controller 12 in the configuration shown in FIG.
- the selection unit 17 can select all or some of the error calculation units 213, 214, and 215.
- the information recording medium 1 is an information recording medium for optically recording and reproducing information, for example, an optical disk medium.
- the optical disk device 300 is a device that records and reproduces information with respect to the mounted information recording medium 1, but may be a reproduction-only device.
- the optical disk device 102 includes an optical head unit 2, a preamplifier unit 3, an AGC unit 4, a waveform equalization unit 5, an A / D conversion unit 6, a PLL unit 7, a PR equalization unit 8, and a maximum likelihood.
- a decoding unit 9, a signal evaluation index detection unit 10, an optical disk controller unit 15, a pattern generation unit 13, a recording compensation unit 14, and a laser driving unit 15 are provided.
- signal evaluation index detection unit 10 includes pattern detection units 201, 205, and 209, difference metric calculation units 202, 207, and 211, pattern count units 203, 206, and 210, and a standard deviation calculation unit. 204, 208, 212, error calculators 213, 214, 215, an adder 216, and a standard deviation calculator 217.
- the pattern detection units 201, 205, and 209 compare the transition data strings in Tables 1, 2, and 3 with the binarized data.
- the difference metric calculation units 202, 207, and 211 detect metric differences corresponding to Table 1 (14 patterns), Table 2 (12A patterns), and Table 3 (12B patterns).
- the pattern count units 203, 206, and 210 detect the number of patterns.
- Calculation units 204, 208, and 212 calculate the standard deviation ⁇ of the output of the difference metric calculation unit.
- the error calculation units 213, 214, and 215 calculate a predicted error rate from the standard deviation and count value in each pattern.
- the adder 216 adds all error calculation results.
- the standard deviation calculation unit 217 calculates a standard deviation from the added total error rate.
- the optical head unit 2 converges the laser beam that has passed through the objective lens on the recording layer of the information recording medium 1, receives the reflected light, and generates an analog reproduction signal indicating the information recorded on the information recording medium 1.
- the numerical aperture of the objective lens is 0.7 to 0.9, more preferably 0.85.
- the wavelength of the laser light is 410 nm or less, more preferably 405 nm.
- the preamplifier unit 3 amplifies the analog reproduction signal with a predetermined gain and outputs the amplified signal to the AGC 4.
- the AGC unit 4 amplifies the reproduction signal using a preset target gain so that the level of the reproduction signal output from the A / D conversion unit 6 becomes a constant level, and outputs the amplified signal to the waveform equalization unit 5 To do.
- the waveform equalization unit 5 has an LPF characteristic that cuts off the high frequency range of the reproduction signal and a filter characteristic that amplifies a predetermined frequency band of the reproduction signal.
- the waveform equalization unit 5 shapes the reproduction waveform into a desired characteristic and performs A / D. Output to the converter 6.
- the PLL circuit 7 generates a reproduction clock synchronized with the reproduction signal after waveform equalization, and outputs it to the A / D conversion unit 6.
- the A / D conversion unit 6 samples the reproduction signal in synchronization with the reproduction clock output from the PLL circuit 7 and converts the analog reproduction signal into a digital reproduction signal.
- the PR equalization unit 8 is a frequency characteristic set so that the frequency characteristic of the reproduction system becomes a characteristic assumed by the maximum likelihood decoding unit 9 (for example, PR (1, 2, 2, 2, 1) equalization characteristic). And performs PR equalization processing for suppressing high-frequency noise and intentionally adding intersymbol interference to the reproduced signal, and outputs the result to the maximum likelihood decoding unit 9. Further, the PR equalization unit 8 may include a FIR (Finite Impulse Response) filter configuration, and may adaptively control the tap coefficient using an LMS (The Last-Mean Square) algorithm.
- FIR Finite Impulse Response
- the maximum likelihood decoding unit 9 is, for example, a Viterbi decoder, which uses a maximum likelihood decoding method for estimating a most likely sequence based on a code rule intentionally added according to a partial response type, and performs PR equalization.
- the reproduction signal that has been PR-equalized by the unit 8 is decoded and binarized data is output.
- the binarized data is output as a demodulated binarized signal to the subsequent optical disk controller 12, and a predetermined process is executed to reproduce information recorded on the information recording medium 1.
- the signal evaluation index detection unit 10 receives the waveform-shaped digital reproduction signal output from the PR equalization unit 8 and the binarized signal output from the maximum likelihood decoding unit 9.
- the pattern detection units 201, 205, and 209 compare the transition data strings in Tables 1, 2, and 3 with the binarized data. If this binarized data matches the transition data strings in Tables 1, 2, and 3, the most likely transition sequence 1 and the second most likely transition sequence 2 are selected based on Tables 1, 2, and 3. To do. Based on this selection result, the difference metric calculation unit calculates a metric that is the distance between the ideal value of the transition sequence (the PR equalization ideal value shown in Tables 1 to 3) and the digital reproduction signal, and obtains the metric between the obtained metrics. The difference is calculated. The standard deviation calculation unit calculates a standard deviation ⁇ indicating the degree of variation of the metric difference for each pattern group.
- the pattern count units 203, 206, and 210 count the number of occurrences for each pattern group in Tables 1, 2, and 3. That is, for each pattern group in Tables 1, 2, and 3, the number of times that the binarized signal corresponds to the pattern group is counted. This count value is the frequency of occurrence of each pattern group when calculating the error rate.
- the error calculation units 213, 214, and 215 calculate a prediction error rate from the standard deviation of the difference metric and the number of pattern occurrences.
- the calculated error rate is added by the adder 216, and the standard deviation corresponding to the error rate is calculated by the standard deviation calculator 217.
- the standard deviation calculated by the standard deviation calculation unit 217 serves as a signal evaluation index for evaluating the reproduction signal quality.
- the optical disk controller unit 12 evaluates the reproduction signal quality using this signal evaluation index.
- the difference metric calculation unit 202 executes the calculation process of (Formula 4), the difference metric calculation unit 207 executes the calculation process of (Formula 5), and the difference metric calculation unit 211 executes the calculation process of (Formula 6).
- the error rate calculation unit 213 executes the calculation process of (Formula 8), the error rate calculation unit 214 executes the calculation process of (Formula 9), and the error rate calculation unit 215 executes the calculation process of (Formula 10).
- the error rate addition calculation unit 216 executes the calculation process of (Equation 11).
- the standard deviation calculation unit 217 converts the total error rate obtained by the calculation of (Equation 11) into ⁇ corresponding to the error rate.
- error rate may be normalized with the total occurrence probability of each pattern group, and the inverse calculation of (Equation 7) may be performed to convert the detected sample portion into ⁇ .
- the signal evaluation index can be calculated by the circuit configuration of FIG.
- FIG. 24 shows an area recorded with optimum recording parameters (recording power, recording strategy, etc.) on a medium having a recording film with different characteristics, and calculates a signal evaluation index value of the present invention. It is the figure which compared the evaluation index value.
- the horizontal axis represents media types A to E, and the vertical axis represents the signal evaluation index value (index M) of the present invention.
- a method can be used in which a predetermined criterion is set and the quality of the medium is defined so that the medium can be recorded below the criterion.
- a predetermined criterion is set and the quality of the medium is defined so that the medium can be recorded below the criterion.
- the criterion of the index M is 11%
- a medium that can be recorded so as to be 11% or less can be determined as a medium that satisfies a predetermined quality.
- the criteria of this index M may be defined for each layer of the information recording medium shown in FIG.
- the criteria for the L0 recording layer may be 10.5% or less
- the criteria for the L1 recording layer may be 11.0% or less
- the criteria for the L2 recording layer may be 11.5% or less.
- the allowable margin of tilt stress generated due to the lens tilt of the head or the warp of the medium is increased in other recording layers. Compared to narrower. Therefore, in consideration of the margin in each layer, the base signal quality needs to be better as the distance from the head is increased.
- the above criteria are not limited to these examples.
- the same criteria may be applied to all recording layers on the assumption that no tilt stress is allowed. In this case, for example, the criterion may be 11.0%.
- criteria may be defined for each recording density recorded on the information recording medium.
- the case where the recording capacity for each recording layer is 33.3 GB and the case where the recording capacity is 31.0 GB are shown.
- the criteria for each recording layer are 11.0% for the L0 layer, 11.5% for the L1 layer, and 11.5% for the L2 layer. It is good.
- the criteria of each recording layer are 10.5% for the L0 layer, 10.5% for the L1 layer, 11.0% for the L2 layer, L3 The layer may be 11.0%.
- the present invention provides a signal evaluation method and a criterion defining method thereof that can achieve both cost reduction of an information recording medium and high system compatibility.
- FIG. 25 is a diagram in which recording is performed while changing the recording power on a predetermined information recording medium, the area is reproduced, and the signal evaluation index value of the present invention is calculated.
- the recording power margin of the information recording medium can be measured by detecting how much the recording power changes until it deteriorates to a predetermined criterion with the optimum recording power as the reference recording power. For example, when the criterion of the index M is 15%, the amount of change reaching the criterion is x% due to the lower recording power change with respect to the reference recording power, and the amount of change reaching the criterion is due to the higher recording power change. Is y%.
- An information recording medium in which x and y are not less than a predetermined value can be determined as an information recording medium that satisfies a prescribed recording power margin. For example, x may be 15.0% and y may be 10.0%. Note that x and y are not limited to these numerical values. What is necessary is just to set to the value which can make compatible the cost of the information recording medium which implement
- FIG. 10 is a diagram in which the signal evaluation index value of the present invention is calculated while changing the focus parameter.
- Servo parameters include tilt and spherical aberration parameters.
- the circuit can be further simplified when the variation in the differential metric value output from the differential metric calculation units 202, 207, and 211 is close to a normal distribution.
- An example is shown in FIG.
- the circuit scale becomes large. Further, when the standard deviation is obtained by a program, the entire processing speed is slow because of the large amount of processing.
- absolute value integration units 204a, 208a, and 210a are provided instead of the standard deviation calculation units 204, 208, and 210 of FIG.
- the absolute value integration units 204a, 208a, and 210a perform processing for adding absolute values to the outputs of the difference metrics 202, 207, and 211. Then, the integrated value is divided by the count values of the pattern count units 203, 206, and 210 to obtain the average value of the absolute values of the difference metrics.
- the relationship between the standard deviation ⁇ and the absolute value average m is a predetermined coefficient relationship ( ⁇ 1.253 m) assuming that ⁇ is a Gaussian distribution.
- ⁇ may be obtained from the absolute value average value, and the error rate may be calculated by the error calculation units 213, 214, and 215 using the ⁇ .
- the standard deviation processing can be reduced compared to the configuration of FIG. 22, and thus the circuit scale can be reduced.
- the recording medium can be easily defined. Further, by providing a jitter-like index, compatibility with a conventional evaluation method can be easily realized. Further, as described with reference to FIG. 15, in the PR12221ML method, by using the edge shift component and the signal index separated into the SN component for each Euclidean distance, the shift of the recording power parameter and the shift of the recording strategy parameter are performed. Can be detected quantitatively, and parameter optimization becomes easy. In the above description, the case where the square of the Euclidean distance is 14 has been described. Needless to say, the present invention can also be applied to patterns having the square of the Euclidean distance shown in Tables 2 and 3.
- the patterns in Tables 2 and 3 are patterns that always include at least one of a 2T mark and a 2T space. As shown in FIG. 15, by separating the edge shift component and the SN component, the influence before and after the 2T mark can be quantified, which is useful for evaluating and optimizing the parameters related to 2T.
- PR12221ML is used.
- the PR type is not limited to this, and the present invention can be applied to other PR types.
- optical disc relating to the present invention (particularly the point relating to the recording density) will be described.
- FIG. 26 shows the physical configuration of the optical disc 1.
- a disk-shaped optical disk 1 has a large number of tracks 2 formed, for example, concentrically or spirally, and each track 2 has a large number of finely divided sectors. As will be described later, data is recorded in each track 2 in units of blocks 3 having a predetermined size.
- the optical disc 1 has a larger recording capacity per information recording layer than a conventional optical disc (for example, 25 GB BD).
- the expansion of the recording capacity is realized by improving the recording linear density, for example, by reducing the mark length of the recording mark recorded on the optical disc.
- “to improve the recording linear density” means to shorten the channel bit length.
- the channel bit is a length corresponding to the period T of the reference clock (the reference period T of modulation when a mark is recorded by a predetermined modulation rule).
- optical disk 1 may be multilayered. However, in the following, only one information recording layer is mentioned for convenience of explanation.
- the mark length is changed uniformly for each layer, and the recording line is changed for each layer.
- the density may be varied.
- Track 2 is divided into blocks for each data recording unit of 64 kB (kilobytes), and block address values are assigned in order.
- the block is divided into sub-blocks of a predetermined length, and one block is constituted by three sub-blocks. Subblock numbers 0 to 2 are assigned to the subblocks in order from the front.
- FIG. 27 (A) shows an example of a 25 GB BD.
- the wavelength of the laser 123 is 405 nm
- the numerical aperture (NA) of the objective lens 220 is 0.85.
- recorded data is recorded as physical change mark rows 120 and 121 on track 2 of the optical disc.
- the shortest mark in the mark row is called the “shortest mark”.
- the mark 121 is the shortest mark.
- the physical length of the shortest mark 121 is 0.149 ⁇ m. This is equivalent to approximately 1 / 2.7 of a DVD, and the light beam identifies the recording mark even if the resolution of the laser is increased by changing the wavelength parameter (405 nm) and NA parameter (0.85) of the optical system.
- the limit of optical resolution which is the limit that can be achieved.
- the recording linear density assumed as the high recording density optical disk in FIG. 27B is such that the frequency of the shortest mark of the reproduction signal is OTF cutoff.
- a case where the frequency is near the frequency (including a case where the frequency is equal to or lower than the OTF cutoff frequency but not significantly lower than the OTF cutoff frequency) to a case where the frequency is higher than the OTF cutoff frequency may be applicable.
- the recording capacity is, for example, about 29 GB (for example, 29 GB ⁇ 0.5 GB or 29 GB ⁇ 1 GB), or more than 29 GB, or about 30 GB (for example, 30 GB ⁇ 0.5 GB, for example) near the OTF cutoff frequency.
- 30 GB ⁇ 1 GB or more than 30 GB, or about 31 GB (eg, 31 GB ⁇ 0.5 GB, or 31 GB ⁇ 1 GB), or more than 31 GB, or about 32 GB (eg, 32 GB ⁇ 0.5 GB, or 32 GB ⁇ 1 GB).
- 32 GB eg, 32 GB ⁇ 0.5 GB, or 32 GB ⁇ 1 GB
- the recording capacity is, for example, about 32 GB (for example, 32 GB ⁇ 0.5 GB or 32 GB ⁇ 1 GB), or more than 32 GB, or about 33 GB (for example, 33 GB ⁇ 0.5 GB, for example, when the OTF cutoff frequency is exceeded.
- 33 GB ⁇ 1 GB or more than 33 GB, or about 33.3 GB (eg, 33.3 GB ⁇ 0.5 GB, or 33.3 GB ⁇ 1 GB), or 33.3 GB or more, or about 34 GB (eg, 34 GB ⁇ 0.5 GB, or 34 GB ⁇ 1 GB), or 34 GB or more, or about 35 GB (for example, 35 GB ⁇ 0.5 GB, 35 GB ⁇ 1 GB, etc.), or 35 GB or more can be envisaged.
- 33.3 GB eg, 33.3 GB ⁇ 0.5 GB, or 33.3 GB ⁇ 1 GB
- 34 GB eg, 34 GB ⁇ 0.5 GB, or 34 GB ⁇ 1 GB
- 35 GB for example, 35 GB ⁇ 0.5 GB, 35 GB ⁇ 1 GB, etc.
- the recording density is 33.3 GB
- about 100 GB (99.9 GB) can be realized with three layers
- 100 GB or more (100.2 GB) can be realized with three layers.
- the reproduction signal amplitude in each recording layer deterioration of SN ratio
- multi-layer stray light from adjacent recording layers
- FIG. 28 shows an example in which the spatial frequency of the shortest mark (2T) is higher than the OTF cutoff frequency, and the amplitude of the 2T reproduction signal is zero.
- the 2T spatial frequency of the shortest mark length is 1.12 times the OTF cutoff frequency.
- the relationship among the wavelength, numerical aperture, and mark / space length in the high recording density disc B is as follows.
- the shortest mark length + shortest space length P is TM + TSnm.
- Laser wavelength ⁇ (405 nm ⁇ 5 nm, that is, 400 to 410 nm)
- numerical aperture NA 0.85 ⁇ 0.01, that is, 0.84 to 0.86
- the spatial frequency is lower than the OTF cutoff frequency.
- the recording density is described by comparing the frequency of the reproduction signal of the shortest mark with the OTF cutoff frequency.
- the next shortest mark (and the shortest one after another) is described.
- the recording density (recording line density, recording capacity) corresponding to each is set based on the relationship between the reproduction signal frequency of the mark and the recording mark of the next shortest mark or higher) and the OTF cutoff frequency. be able to.
- FIG. 29 shows an area configuration of the optical disc 400.
- the optical disc 400 includes an information recording layer. Data is recorded on the optical disc 400 by forming a recording mark on the information recording layer. On the optical disk 400, tracks are formed concentrically.
- the optical disc 400 includes a BCA (Burst Cutting Area) area 410, a lead-in area 420, a user area 430, and a lead-out area 440.
- BCA Breast Cutting Area
- a barcode-like signal is recorded in advance, and includes a unique number for identifying a medium that is different for each disc, copyright information, and disc characteristic information.
- This disc characteristic information includes the number of information recording layers and identification information of an address management method.
- the disk characteristic information includes, for example, information indicating the number of information recording layers, predetermined bit information corresponding to the number of permitted layers, and information on recording density. Examples of the information relating to the recording density include information indicating the recording capacity of the optical disc and information indicating the channel bit length (recording line density).
- the storage location of the information relating to the recording density may be the BCA area and / or the inside of the recording data (uneven pits) (recorded as a data address added to the data).
- a BCA area and / or PIC area and / or wobble (recorded as sub-information superimposed on the wobble) can be considered.
- the user area 430 is configured so that the user can record arbitrary data.
- user data is recorded in the user area 430.
- User data includes, for example, audio data and visual (video) data.
- the lead-in area 420 is not configured so that the user can record arbitrary data.
- the lead-in area 420 includes a PIC (Permanent Information and Control data) area 421, an OPC (Optimum Power Calibration) area 422, and an INFO area 423.
- PIC Permanent Information and Control data
- OPC Optimum Power Calibration
- the PIC area 421 includes disc characteristic information.
- this disk characteristic information for example, the number of information recording layers, identification information of an address management method, and access parameters described above are recorded.
- the access parameters are, for example, parameters relating to laser power for forming / erasing a plurality of recording marks on the optical disc 400 and parameters relating to recording pulse widths for recording a plurality of recording marks.
- the disk characteristic information is stored in both the BCA area 410 and the PIC area 421.
- this is an example and is not limited to this example.
- any of BCA area, PIC area, inside of recording data, wobble, or any two or more of these areas may be used. If the same disc characteristic information is recorded in a plurality of locations, it can be read out from either one. Therefore, it is possible to ensure the reliability of the disk characteristic information. Even if the type of the disc is unknown, the optical disc apparatus can know the number of information recording layers of the disc by storing the disc characteristic information in these pre-positioned areas. Can do.
- the information recording layer (reference layer) on which the disk characteristic information is arranged is, for example, the layer farthest from the optical head, in other words, the laser beam is incident. It may be a layer at the deepest position from the surface on the side to be processed.
- FIG. 30 (1) shows the configuration of the information recording layer of the conventional recording density disc A and the higher recording density disc B.
- FIGS. 30 (2) and (3) show the configuration of the disc A, respectively.
- a specific configuration of the lead-in area 420 of the disk B is shown.
- FIG. 30 (1) shows an information recording layer of an optical disc. From the inner peripheral side (left side of the drawing), a clamp area 425, a BCA area 410, a lead-in area 420, and a user data area 430 are arranged in this order.
- FIG. 30 (2) shows a specific arrangement example of the lead-in area 420 of the reference layer of the disk A.
- the PIC area 421 has a predetermined radial distance A from the radial position 22.2 mm.
- FIG. 30 (3) shows a specific arrangement example of the lead-in area 420 of the reference layer of the disk B.
- the PIC area 421 has a predetermined radial distance B from the radial position 22.2 mm. What is characteristic here is that the radial distance B of the PIC area 421 of the disk B is the same as the radial distance A of the PIC area 421 of the disk A.
- the channel bit length is shortened. Accordingly, the radial distance B of the PIC area 421 may be shortened accordingly.
- information important for disk access is stored in the PIC area 421 of the disk B, and the PIC area 421 needs to be able to be reproduced safely.
- an optical disk drive that mechanically moves the optical head to a predetermined position and reads information in the PIC area 421 may not be able to be reproduced if the radial distance of the PIC area 421 becomes short.
- the radial distance B is preferably the same as the radial distance A.
- the following two methods are conceivable.
- the first is a method of recording the PIC area of the disc B with the same recording linear density as the disc A, not the recording linear density of the disc B.
- the recording linear density may vary depending on the area even in the lead-in area.
- the second is a method of increasing the number of times that information recorded in the PIC area is repeatedly recorded with the recording linear density of the disc B. Since the information recorded in the PIC area is important information, it is repeatedly recorded to ensure reliability. In such a case, the recording linear density is reduced and the repetition is increased (for example, from 5 times to 7 times). It is possible to make it equal to the conventional radial distance A.
- the OPC area 422 is an area for recording or reproducing test data.
- an optical disk device that accesses the optical disk 400 adjusts access parameters (for example, adjustment of recording power, pulse width, etc.).
- management information of the user area 430 and data for defect management of the user area 430 necessary for a device that accesses the optical disc 400 are recorded.
- the multilayer recording medium was described using FIG. 16, it supplements here further. If the optical disc apparatus focuses and tracks a layer different from the reference layer before reading the disc characteristic information and reads the address information, the arrangement of the layer information and the block address information may differ, and the address position is misidentified. There is a possibility to separate. In order to avoid this, an intermediate layer between the reference layer and another layer may be secured larger than an intermediate layer between other layers to prevent erroneous layer determination. For example, when viewed from the laser beam, the L0 layer of the reference layer corresponding to the two layers of BD is configured at a depth of about 100 ⁇ m, and the L1 layer is configured at a position of about 75 ⁇ m.
- the recording layer configured on the side closer to the laser beam after the L1 layer may be configured on the laser beam side from 75 ⁇ m.
- the L1 layer is at a position of 70 ⁇ m.
- the width (thickness) of the intermediate layer between the reference layer and the L1 layer is excessively increased, it is difficult to sufficiently secure the width of the intermediate layer after the L2 layer. For this reason, there is no need for erroneous pull-in to the L1 layer, and a balance that can secure the width of the intermediate layer of the other layer is required.
- BD includes write-once BD-R (write-once Blu-ray disc), BD-RE (rewritable Blu-ray disc) that can rewrite information multiple times, and BD-ROM (playback-only Blu-ray disc) that can only be played back Etc.
- the main optical constants and physical formats of Blu-ray Discs can be found on the white papers posted on the "Blu-ray Disc Reader” (published by Ohmsha) and the Blu-ray Association website (http://www.blue-raydisc.com/). It is disclosed.
- a laser beam having a wavelength of 405 nm (400 to 410 nm if the tolerance of the error range is ⁇ 5 nm) and NA 0.85 (0.84 to if the tolerance of the error range is ⁇ 0.01). 0.86) objective lens is used.
- the track pitch of the BD is 0.32 ⁇ m, and one or two recording layers are provided.
- the recording layer has a single-sided or double-sided recording surface from the laser incident side, and the distance from the surface of the protective layer of the BD to the recording surface is 75 ⁇ m to 100 ⁇ m.
- the recording signal modulation method uses 17PP modulation, and the shortest mark length (2T mark) of the recorded mark is 0.149 ⁇ m (channel bit length: T is 74.50 nm).
- the recording capacity is a single-sided single layer 25 GB (or 27 GB) (more specifically 25.005 GB (or 27.020 GB)) or a single-sided double layer 50 GB (or 54 GB) (more specifically 50.050 GB (or 54 .040 GB)).
- the channel clock frequency is 66 MHz (channel bit rate 66.000 Mbit / s) at a transfer rate of standard speed (BD1x), 264 MHz (channel bit rate 264.000 Mbit / s) at a transfer rate of 4 ⁇ speed (BD4x), 6
- the transfer rate at double speed (BD6x) is 396 MHz (channel bit rate 396.000 Mbit / s), and the transfer rate at 8 times speed (BD8x) is 528 MHz (channel bit rate 528.000 Mbit / s).
- the standard linear velocity reference linear velocity, 1x
- the linear velocities of 2x (2x), 4x (4x), 6x (6x) and 8x (8x) are 9.834 m / sec, 19.668 m / sec, 29.502 m / sec and 39.50, respectively. 336 m / sec.
- the linear velocity higher than the standard linear velocity is generally a positive integer multiple of the standard linear velocity, but is not limited to an integer and may be a positive real multiple. Also, a linear velocity that is slower than the standard linear velocity, such as 0.5 times (0.5x), may be defined.
- the thinner the protective layer for example, the total thickness of the medium is about 1.2 mm so that the influence of the spot distortion due to the tilt can be suppressed as the numerical aperture is increased and the focal length is shortened.
- the thickness of the protective layer is 10 to 200 ⁇ m (more specifically, on a substrate of about 1.1 mm, a transparent protective layer of about 0.1 mm for a single-layer disc, and about 0.075 mm for a dual-layer disc.
- the protective layer may be an intermediate layer (Spacer Layer) of about 0.025 mm, and if the disc has three or more layers, the protective layer and / or the intermediate layer will be thinner.
- the multilayer structure When a single-sided disk on which information is reproduced and / or recorded by entering laser light from the side of the protective layer, a plurality of recording layers are provided between the substrate and the protective layer when the number of recording layers is two or more.
- the multilayer structure in that case may be as follows. That is, the reference layer (L0) is provided at the innermost position at a predetermined distance from the light incident surface, and the layers (L1, L2,..., Ln are provided so that the number of layers increases from the reference layer to the light incident surface side.
- the distance from the light incident surface to the reference layer is the same as the distance from the light incident surface to the recording layer in the single-layer disc (for example, about 0.1 mm).
- the optical information recording medium may have the following protrusions.
- the thickness of the protective layer is 100 ⁇ m for a single-layer disc and 75 ⁇ m for a dual-layer disc.
- the outer or inner side of the holding area (Clamp Area) is used.
- Protrusions may be provided on the.
- the optical head accesses the information recording area outside the holding area, so that a protrusion is provided inside the holding area to avoid collision between the protruding part and the optical head). Can do.
- a specific position on a disk having an outer diameter of 120 mm may be as follows. If the diameter of the center hole is 15 mm and the holding area is in the range of 23 mm to 33 mm in diameter, the protrusion is provided between the center hole and the holding area, that is, in the range of 15 mm to 23 mm in diameter. At that time, a certain distance from the center hole may be provided (for example, it may be separated from the edge of the center hole by 0.1 mm or more (or / and 0.125 mm or less)), and a certain distance from the holding region. It may be provided (for example, it may be separated from the inner end of the holding region by 0.1 mm or more (or / and 0.2 mm or less)).
- the protrusion may be provided at a certain distance from both the edge of the center hole and the inner end of the holding region (as a specific position, for example, the protrusion is within a range of 17.5 mm to 21.0 mm in diameter. May be provided).
- the height of the protrusion may be determined in consideration of the difficulty of scratching the protective layer and the balance of ease of lifting, but if it is too high, another problem may occur.
- the height may be 0.12 mm or less.
- the spot traveling direction / playback direction is, for example, the same in all layers, that is, a parallel path from the inner circumferential direction to the outer circumferential direction in all layers, or from the outer circumferential direction to the inner circumferential direction in all layers. May be. It may be an opposite pass. In the opposite path, for example, when the traveling direction of the spot is the direction from the inner peripheral side to the outer peripheral side in the reference layer (L0), the direction from the outer peripheral side to the inner peripheral side in L1 and the direction from the inner peripheral side to the outer peripheral side in L2.
- Lm (m is 0 and an even number) is the direction from the inner periphery to the outer periphery
- Lm + 1 is the direction from the outer periphery to the inner periphery
- Lm (m is 0 and an even number) is a direction from the outer peripheral side to the inner peripheral side
- Lm + 1 is a direction from the inner peripheral side to the outer peripheral side.
- Modulation method When data (original source data / binary data before modulation) is recorded on a recording medium, the data is divided into a predetermined size, and the data further divided into the predetermined size is divided into frames of a predetermined length. A predetermined sync code / synchronization code sequence is inserted into (frame sync area). The data divided into frames is recorded as a data code sequence modulated according to a predetermined modulation rule that matches the recording / playback signal characteristics of the recording medium (frame data area).
- the modulation rule may be an RLL (Run Length Limited) encoding method in which the mark length is limited.
- RLL Un Length Limited
- T a reference period of modulation
- a recording mark and a space having a shortest 2T and a longest 8T are obtained.
- 1-7PP modulation may be employed in which the following features [1] and [2] are further added to RLL (1, 7) modulation.
- PP of 1-7PP is an abbreviation of “Parity preserve / Prohibit Repeated Minimum Transfer Length”.
- the first P, “Parity preserve”, is the odd number of “1” s of source data bits before modulation (ie, Parity) and the number of odd-numbered “1” s in the modulated bit pattern corresponding to that match, and
- Prohibit Repeated Minimum Transition Length, which is the latter P, is the record after modulation. This means a mechanism for limiting the number of repetitions of the shortest mark and space on the waveform (specifically, limiting the number of repetitions of 2T to a maximum of 6).
- a pattern that does not appear in the data code sequence may be included.
- the modulation method is 1-7 modulation, the length of the mark or space is limited to 2T to 8T, so a mark or space of 9T or longer (9TM and / or 9TS) longer than 8T or a repetition of 9T mark / space (9T / 9T).
- a pattern that causes many mark / space transitions may be included. For example, among marks / spaces included in a data code sequence, a relatively short mark or space, or repetition of the mark and space.
- the modulation method is 1-7 modulation method, the shortest 2T mark or space (2TM and / or 2TS), 2T mark / space repetition (2T / 2T), and the next shortest 3T mark or space ( 3TM and / or 3TS) and 3T mark / space repetition (3T / 3T).
- the inter-code distance between a synchronization code sequence included in an arbitrary frame region of a sector and a synchronization code sequence included in a frame region other than the arbitrary frame region may be 2 or more.
- the inter-code distance means the number of different bits in a code sequence when two code sequences are compared.
- the inter-code distance between the synchronization code sequence included in the frame region located at the head of the sector and the synchronization code sequence included in the frame region located other than the head may be set to 2 or more. By doing so, it is possible to easily identify whether it is the head part / sector delimiter part.
- the inter-code distance includes the meaning of the inter-code distance when the code sequence is expressed in NRZ for NRZ recording, and when the code sequence is expressed in NRZI for NRZI recording. Therefore, in the case of recording employing RLL modulation, this RLL means that the number of high-level or low-level signals continuing on the NRZI recording waveform is limited. It means that the distance is 2 or more.
- the recording method by forming a groove in the medium, a groove portion and an inter-groove portion between the grooves are formed.
- various methods such as recording in the groove portion or between the groove portion and the groove portion.
- the method of recording on the side that becomes the convex portion when viewed from the light incident surface in the groove and the portion between the grooves is called the On-Groove method
- the method that records on the side that becomes the concave portion when viewed from the light incident surface is In. -It is called a Groove method.
- the recording method is an On-Groove method, an In-Groove method, or a method that permits either one of the two methods.
- the recording method identification information may be recorded on the medium.
- recording method identification information for each layer may be recorded.
- the recording method identification information for each layer is the reference layer (the layer farthest from the light incident surface (L0) or the nearest layer, the layer that is determined to be accessed first at the time of startup, etc.)
- the recording method identification information relating to only that layer may be recorded in each layer, or the recording method identification information relating to all layers may be recorded in each layer.
- the recording system identification information is recorded in an area such as a BCA (Burst Cutting Area) or a disc information area (inside or outside of the data recording area, mainly storing control information, a read-only area).
- the track pitch may be wider than the data recording area) and wobble (recording superimposed on the wobble), etc., and even if it is recorded in any area, any area or all areas Good.
- the On-Groove method and the In-Groove method may be reversed. That is, if the on-groove method starts the wobble start direction from the inner periphery side of the disc, the in-groove method may start the wobble start direction from the outer periphery side of the disc. Alternatively, if the on-groove method starts the wobble start direction from the outer peripheral side of the disc, the in-groove method may start the wobble start direction from the inner peripheral side of the disc.
- the tracking polarity can be made the same in either method.
- the above In / On-Groove method relates to a recording type medium in which a groove is formed in the medium, but the same concept can be applied to a read-only type medium.
- This pit formation method is also an On-Pit in which convex pits are formed when viewed from the light incident surface.
- a method in which concave pits are formed when viewed from the light incident surface is called an In-Pit method.
- an on-pit method or an In-Pit method is used as a pit formation method. It does not particularly matter whether one of the two types is allowed.
- the pit formation method identification information may be recorded on the medium.
- pit formation method identification information for each layer may be recorded.
- the pit formation method identification information for each layer is the reference layer (the layer farthest from the light incident surface (L0) or the nearest layer, the layer that is determined to be accessed first at the time of startup, etc.) ) May be recorded together, pit formation method identification information relating to only that layer may be recorded in each layer, or pit formation method identification information relating to all layers may be recorded in each layer.
- the area for recording the pit formation method identification information is a BCA (Burst Cutting Area) or a disc information area (inner side or / and outer side of the data recording area, mainly storing control information, data recording
- the track pitch may be wider than the area), and recording may be performed in either area or both areas.
- the characteristics of the recording film there are the following two characteristics depending on the reflectance relationship between the recorded portion and the unrecorded portion. That is, the HtoL characteristic in which the unrecorded part has a higher reflectance (High-to-Low) than the recorded part, and the LtoH characteristic in which the unrecorded part has a lower reflectance (Low-to-High) than the recorded part. It is. In the present invention, it does not matter whether the recording film characteristic of the medium is HtoL or LtoH, and either one is permitted.
- recording film characteristic identification information indicating whether the recording film characteristic is HtoL or LtoH can be recorded on the medium so that the recording film characteristic can be easily identified.
- recording film characteristic identification information for each layer may be recorded.
- the recording film characteristic identification information for each layer is the reference layer (the layer farthest from the light incident surface (L0) or the nearest layer, the layer that is determined to be accessed first at the time of startup, etc.) ), Recording film characteristic identification information relating to only that layer may be recorded in each layer, or recording film characteristic identification information relating to all layers may be recorded in each layer.
- the recording film characteristic identification information is recorded in an area such as a BCA (Burst Cutting Area) or a disk information area (inner side or / and outer side of the data recording area, mainly storing control information, but also reproducing) (There may be a track pitch wider than the data recording area in the dedicated area) and wobble (recorded superimposed on the wobble), etc., and recorded in any area, any area or all areas May be.
- BCA Breast Cutting Area
- a disk information area inner side or / and outer side of the data recording area, mainly storing control information, but also reproducing
- wobble recorded superimposed on the wobble
- the recording density is improved, there is a possibility that a plurality of types of recording density of the optical disk medium exist.
- the various formats and methods described above only a part of them may be adopted or a part of them may be changed to another format or method according to the recording density.
- an optical disk is taken as an example of the recording medium, and the terms “media” and “information recording medium” are used as expressions related to the recording medium, but they have the same meaning.
- the present invention is applicable not only to optical disks that are recorded or reproduced with light but also to “magnetic recording media” and “magneto-optical recording media” that perform recording or reproduction using magnetic energy as target recording media. Is possible.
- the present invention is also applicable to the field of performing signal processing using the PRML signal processing method.
- the present invention is applicable to the field of characteristic evaluation of communication transmission paths.
- the present invention can be applied to transmission path evaluation of high-speed communication such as “HD-PLC” and “HDMI”.
- the signal evaluation method of the present invention is a signal evaluation method for evaluating the reproduction signal based on a binarized signal generated from a reproduction signal reproduced from an information recording medium using a PRML method, Detecting a pattern of paths joining the same state corresponding to the digitized signal, an ideal value of the positive pattern corresponding to the binarized signal, and an ideal value of the erroneous pattern corresponding to the positive pattern A step of calculating a difference between an ideal value of the positive pattern and the reproduction signal, a difference between an ideal value of the erroneous pattern and the reproduction signal, and based on the difference, A step of calculating a predicted error rate for each predetermined pattern group in the PRML method, and an error rate for each predetermined pattern group for use in evaluating the reproduction signal; Including calculating a standard deviation corresponding to the overall error rate obtained by adding.
- the step of calculating the error rate includes calculating a standard deviation of the difference for each of the predetermined pattern groups, detecting an occurrence probability for each of the predetermined pattern groups, And calculating the error rate based on the standard deviation of the difference, the occurrence probability, and the number of errors that occur for each of the predetermined pattern groups.
- each of the predetermined pattern groups is a pattern group having an Euclidean distance of 14 or less.
- the plurality of predetermined pattern groups include a pattern group having an Euclidean distance of 14, a pattern group having an Euclidean distance of 12 and an isolated 2T signal, and an Euclidean distance of 12 and a 2T signal being continuous. Pattern groups to be included.
- the PRML method is a PR12221 method.
- the apparatus of the present invention is an apparatus for evaluating the reproduction signal based on a binarized signal generated from a reproduction signal reproduced from an information recording medium by using the PRML method, and corresponds to the binarized signal.
- a pattern detection unit that detects a pattern of paths that merge in the same state, a distance between an ideal value of a positive pattern corresponding to the binarized signal and the reproduction signal, and an erroneous pattern corresponding to the positive pattern
- a difference calculation unit for calculating a difference between an ideal value of the reproduction signal and a distance between the reproduction signal, and an error rate for calculating a predicted error rate for each predetermined pattern group in the PRML method based on the difference
- a standard deviation computing unit that calculates a standard deviation corresponding to an overall error rate obtained by adding an error rate for each of the predetermined pattern groups to be used for evaluating the reproduction signal. Equipped with a.
- the error rate calculation further comprises: an arithmetic unit that calculates a standard deviation of the difference for each predetermined pattern group; and a detection unit that detects an occurrence probability for each predetermined pattern group.
- the unit calculates the error rate based on the standard deviation of the difference, the occurrence probability, and the number of errors that occur for each of the predetermined pattern groups.
- each of the predetermined pattern groups is a pattern group having an Euclidean distance of 14 or less.
- the plurality of predetermined pattern groups include a pattern group having an Euclidean distance of 14, a pattern group having an Euclidean distance of 12 and an isolated 2T signal, and an Euclidean distance of 12 and a 2T signal being continuous. Pattern groups to be included.
- the PRML method is a PR12221 method.
- the information recording medium of the present invention is an information recording medium having a predetermined quality, and the information recording medium has at least one recording layer, and the recording layer records information by a combination of a mark and a space.
- An evaluation value corresponding to a reproduction signal reproduced from the mark and the space has a predetermined value, and the process of calculating the evaluation value is a reproduction reproduced from the mark and the space.
- a step of generating a binarized signal from the signal using a PRML method a step of detecting a pattern of a path joining the same state corresponding to the binarized signal, and a positive pattern corresponding to the binarized signal Calculating a difference between a distance between the ideal value of the reproduction signal and the reproduction signal and a distance between the ideal value of the erroneous pattern corresponding to the positive pattern and the reproduction signal; and And calculating the predicted error rate for each predetermined pattern group in the PRML method, and adding the error rate for each predetermined pattern group for use in the evaluation of the reproduction signal. Calculating a standard deviation corresponding to the error rate.
- the reproducing apparatus is a reproducing apparatus for reproducing the information recording medium, wherein the information recording medium is irradiated with a light beam and receives a reflected light from the mark and the space, and the reflected light. And a reproducing unit that reproduces information recorded using the mark and the space.
- the recording apparatus of the present invention is a recording apparatus that performs recording on the information recording medium, wherein the information recording medium is irradiated with a pulsed light beam to form the mark in the recording area; and An adjustment unit that adjusts a light emission waveform pattern of the light beam so that an evaluation value satisfies the predetermined value.
- the signal evaluation method of the present invention is a signal evaluation method for generating a binarized signal from a signal reproduced from an information recording medium using a PRML signal processing method.
- a pattern of paths joining the same state in the PRML system is detected from the binarized signal.
- the binarized signal is a positive pattern, an ideal signal obtained from the positive pattern, an erroneous pattern corresponding to the positive pattern, an ideal signal obtained from the erroneous pattern, and the Euclidean of the positive pattern and the erroneous pattern Calculate the distance.
- ⁇ is obtained for each pattern group.
- an estimated bit error rate is obtained by calculating an integral value of an error function.
- the reproduced signal is evaluated by using the estimated bit error rate of the whole obtained by adding the estimated bit error rate for each pattern group obtained above.
- ⁇ may be obtained from the overall estimated bit error rate obtained by adding the estimated bit error rates for each pattern group obtained above, and the reproduced signal may be evaluated using the ⁇ .
- the signal evaluation apparatus of the present invention is a signal evaluation apparatus that generates a binarized signal from a signal reproduced from an information recording medium using a PRML signal processing method.
- the signal evaluation apparatus includes: a unit that detects a pattern of paths that merge into the same state in the PRML method from the binarized signal; the binarized signal as a positive pattern, and an ideal signal obtained from the positive pattern; An error pattern corresponding to the correct pattern, an ideal signal obtained from the error pattern, and means for calculating a Euclidean distance between the correct pattern and the error pattern are provided.
- the signal evaluation apparatus calculates a difference between the ideal signal of the positive pattern and the Euclidean distance of the reproduction signal and the ideal signal of the erroneous pattern and the Euclidean distance of the reproduction signal.
- the signal evaluation apparatus may further include means for obtaining ⁇ from the overall estimated bit error rate obtained by adding the estimated bit error rates for each pattern group obtained above.
- the signal evaluation method of the present invention is a signal evaluation method for generating a binarized signal from a signal reproduced from an information recording medium using a PRML signal processing method.
- a pattern of paths joining the same state in the PRML system is detected from the binarized signal.
- the binarized signal is a positive pattern, and an ideal signal obtained from the positive pattern, an erroneous pattern corresponding to the positive pattern, and an ideal signal obtained from the erroneous pattern are generated.
- the pattern detection when the binarized signal is detected as a predetermined pattern, the difference between the ideal signal of the positive pattern and the reproduction signal, and the difference between the ideal signal of the erroneous pattern and the distance of the reproduction signal Is calculated.
- An error rate predicted for each predetermined pattern group is obtained from the calculated difference result.
- the ⁇ of the normal distribution predicted from the total error rate obtained by adding the error rates for each pattern group obtained in the error rate calculation step is obtained, and the reproduced signal is evaluated using the ⁇ .
- the calculated difference information ⁇ and the occurrence probability of the predetermined pattern group are obtained.
- a predicted error rate is obtained based on the number of errors that occur for each of the predetermined pattern groups.
- the number of times the calculated difference information exceeds a predetermined threshold and the occurrence probability of the predetermined pattern group are obtained for each predetermined pattern group.
- a predicted error rate is obtained based on the number of errors that occur for each of the predetermined pattern groups.
- the signal evaluation apparatus of the present invention is a signal evaluation apparatus that generates a binarized signal from a signal reproduced from an information recording medium using a PRML signal processing method.
- the signal evaluation apparatus includes: a unit that detects a pattern of paths that merge into the same state in the PRML method from the binarized signal; the binarized signal as a positive pattern, and an ideal signal obtained from the positive pattern; A generation unit that generates an erroneous pattern corresponding to the positive pattern and an ideal signal obtained from the erroneous pattern is provided.
- the signal evaluation device when the binarized signal is detected as a predetermined pattern by the detecting means, the distance between the ideal signal of the positive pattern and the reproduction signal, the ideal signal of the erroneous pattern, and the reproduction signal A difference calculation means for calculating a difference from the distance of the error, an error rate calculation means for obtaining an error rate predicted for each predetermined pattern group from the calculated difference result, and a pattern group obtained by the error rate calculation means Means for obtaining ⁇ of a normal distribution predicted from the total error rate obtained by adding the error rates for each of them.
- the present invention is particularly useful in the technical field of performing signal processing using the maximum likelihood decoding method.
Landscapes
- Engineering & Computer Science (AREA)
- Signal Processing (AREA)
- Physics & Mathematics (AREA)
- Probability & Statistics with Applications (AREA)
- Optical Recording Or Reproduction (AREA)
- Signal Processing For Digital Recording And Reproducing (AREA)
- Testing, Inspecting, Measuring Of Stereoscopic Televisions And Televisions (AREA)
Abstract
Description
1 情報記録媒体
2 光ヘッド部
3 プリアンプ部
4 AGC部
5 波形等化部
6 A/D変換部
7 PLL部
8 可変PR等化部
9 可変最尤復号部
10 信号評価指標演算部
11 エッジシフト検出部
12 光ディスクコントローラ部
13 パターン発生部
14 記録補償部
15 レーザ駆動部
16 サーボ制御部
17 選択部
201、205、209 パターン検出部
202、207、211 差分メトリック演算部
203、206、210 パターンカウント部
204、208、212 標準偏差演算部
204a、208a、212a 絶対値積算部
213、214、215 エラー演算部
216 加算部
217 標準偏差演算部

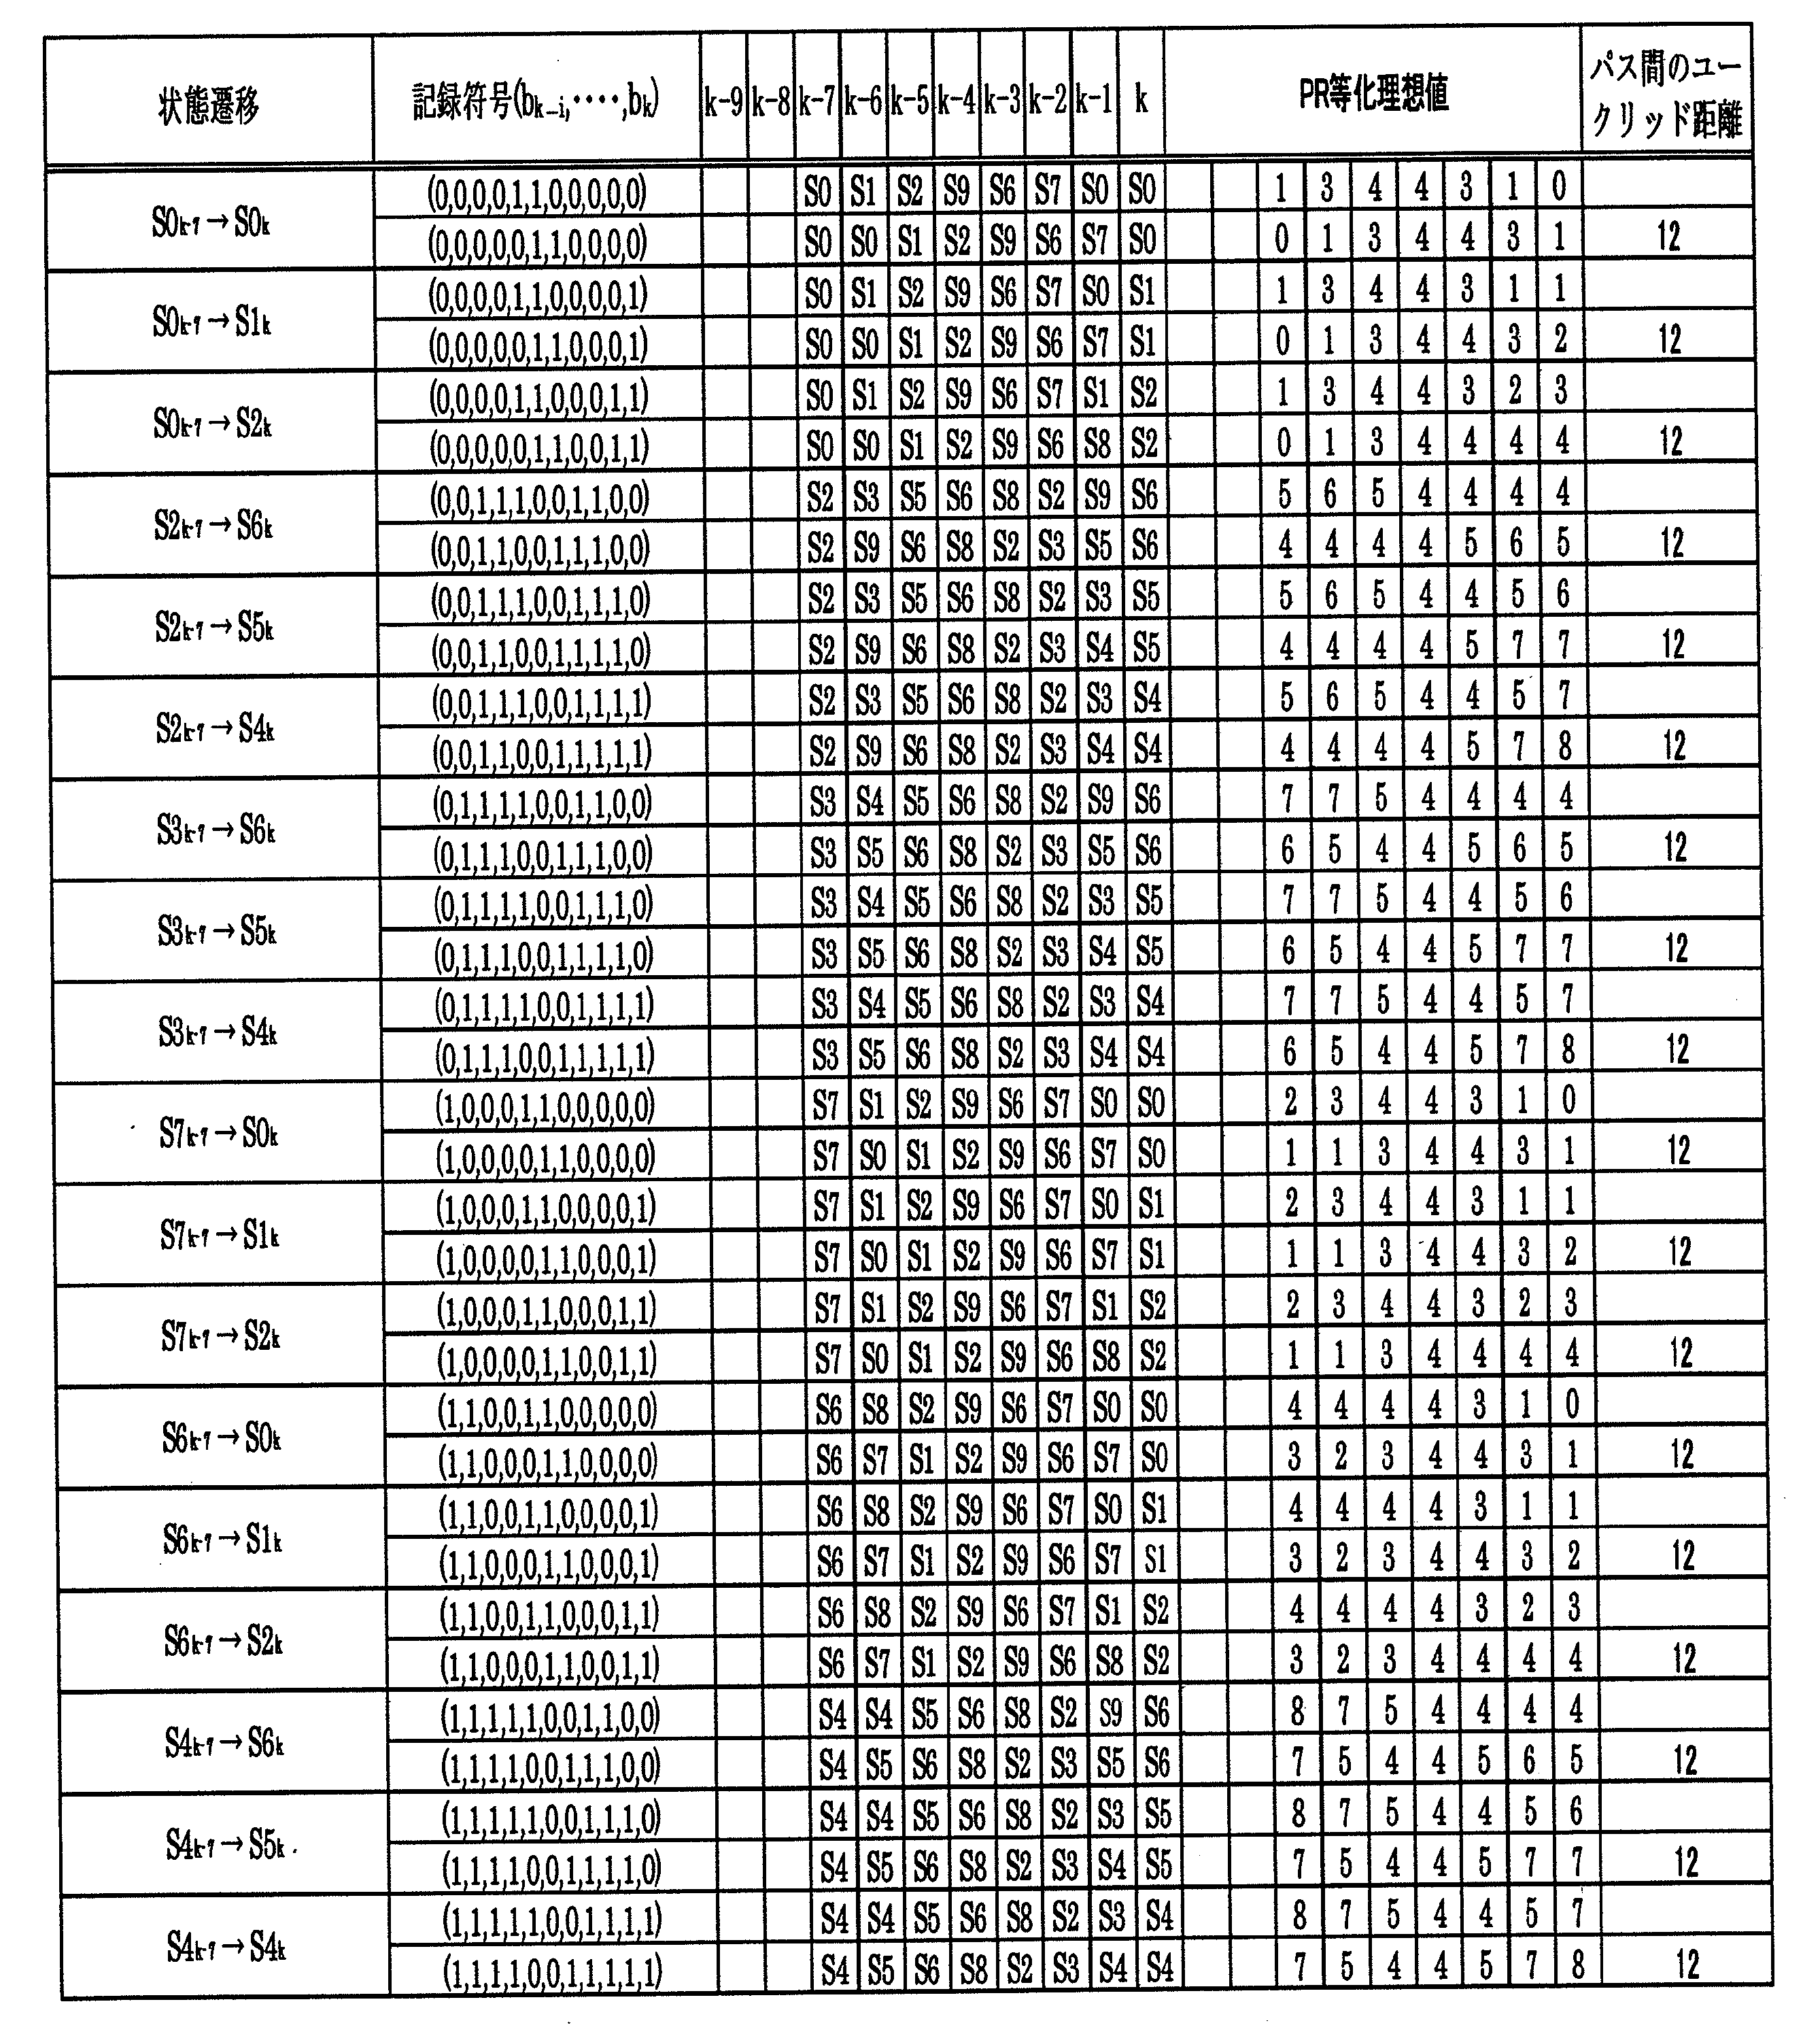


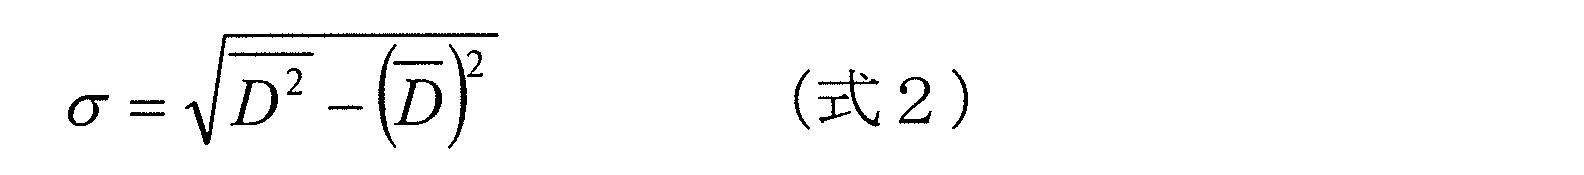


次に、本発明の実施形態による光ディスク装置を説明する。図1は、本発明の第1の実施形態による光ディスク装置100を示す図である。
図12は、本発明の第2の実施形態による光ディスク装置300を示す図である。光ディスク装置300は、記録条件調整部102が含む構成要素が異なること以外は、光ディスク装置100(図1)と同じ構成要素を備える。
次に、本発明の第3の実施形態による情報記録媒体を説明する。図16は、本実施形態の情報記録媒体1を示す図である。情報記録媒体1は、上述した光ディスク装置100~300に搭載される。
上記のディスクの評価方法では、最も重要であるマークの形成に係わるエッジ部に注目する指標として、PR12221ML方式における、非最小差分メトリックの合流パス中にゼロクロス情報が1つのみ含まれる状態遷移パターンのみを用いて評価指標を計算して、信号品質を検出した。具体的には、非最小差分メトリックの合流パス中にゼロクロス情報が1つのみ含まれる状態遷移パターンは、表1に示す状態遷移パターンであった。ディスクの評価方法としては、表1のパターンを主眼として評価すれば十分であったが、エラーレートとより高い相関のある信号評価指標とするためには、PR12221ML信号処理において、エラーが発生する可能性が高いパターンをすべて考慮した評価指標にすることが望ましい。


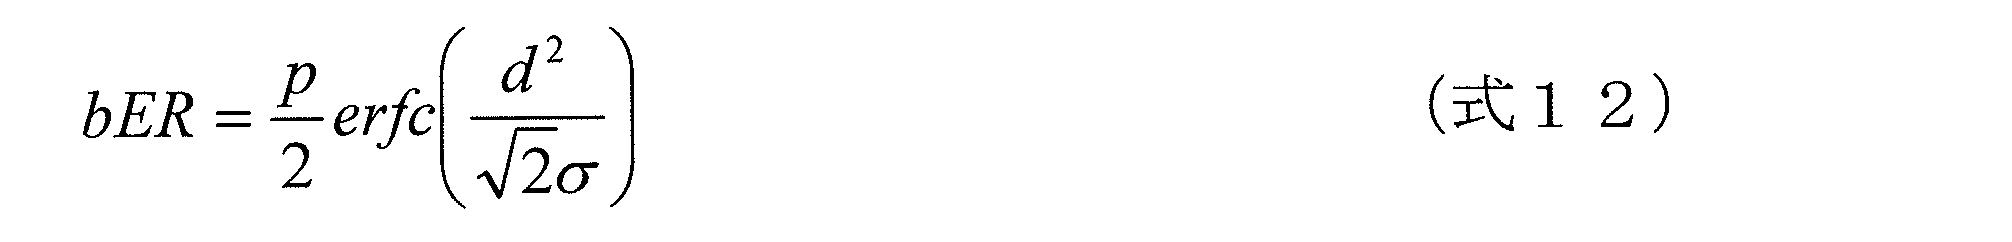

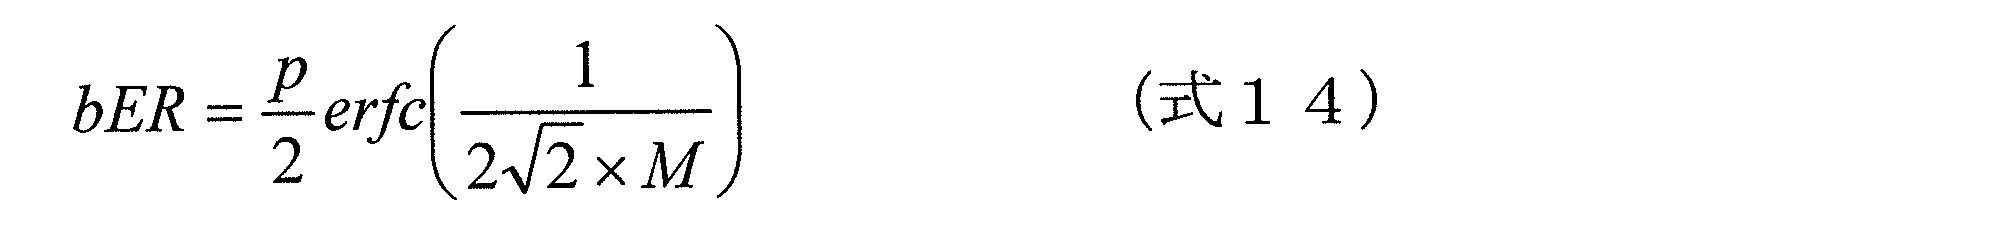

P ≦ λ/2NA
となるまで基準Tが小さくなるとOTFカットオフ周波数を超えることになる。
T = 405/(2x0.85)/4 = 59.558nm
となる。
BDでは、波長405nm(誤差範囲の許容値を±5nmとすれば、400~410nm)のレーザ光およびNA=0.85(誤差範囲の許容値を±0.01とすれば、0.84~0.86)の対物レンズを用いる。BDのトラックピッチは0.32μmであり、記録層が1層または2層設けられている。記録層の記録面がレーザ入射側から片面1層あるいは片面2層の構成であり、BDの保護層の表面から記録面までの距離は75μm~100μmである。
保護層(カバー層)の厚みに関しては、開口数を上げ焦点距離が短くなるのに伴い、またチルトによるスポット歪みの影響を抑えられるよう、より薄い保護層、例えば媒体の総厚み1.2mm程度のうち、保護層の厚みを10~200μm(より具体的には、1.1mm程度の基板に、単層ディスクならば0.1mm程度の透明保護層、二層ディスクならば0.075mm程度の保護層に0.025mm程度の中間層(SpacerLayer)としてもよい。三層以上のディスクならば、保護層及び/又は中間層の厚みはさらに薄くなる。
レーザ光を保護層の側から入射して情報が再生及び/又は記録される片面ディスクとすると、記録層を二層以上にする場合、基板と保護層の間には複数の記録層が設けられることになるが、その場合における多層構造を次のようにしてもよい。つまり、光入射面から所定の距離を隔てた最も奥側の位置に基準層(L0)を設け、基準層から光入射面側に層を増やすように積層(L1,L2,・・・,Ln)し、また光入射面から基準層までの距離を単層ディスクにおける光入射面から記録層までの距離と同じ(例えば0.1mm程度)にする等である。このように層の数に関わらず最奥層までの距離を一定にすることで、基準層へのアクセスに関する互換性を保つことができ、また層数の増加に伴うチルト影響の増加を抑える(最奥層が最もチルトの影響を受けるが層数の増加に伴い最奥層までの距離が増加することがなくなるため)ことが可能となる。
また、光学的情報記録媒体は、以下のような突起部を有するものでもよい。例えばブルーレイディスクの場合、保護層の厚みは、単層ディスクでは100μm,2層ディスクでは75μmであるが、このように薄い保護層への傷つき防止のため、保持領域(Clamp Area)の外側または内側に突起部を設けてもよい。特に保持領域の内側に設けた場合、保護層の傷つき防止に加え、ディスクの中心穴に近い部分に突起部があるため、突起部の重量バランスによる回転スピンドル(モータ)への負荷を軽減することや、光ヘッドとの衝突を避ける(光ヘッドは保持領域の外側にある情報記録領域にアクセスするため保持領域の内側に突起部を設けることで突起部と光ヘッドとの衝突を回避する)ことができる。
また、スポットの進行方向/再生方向に関しては、例えば、全ての層において同じ、つまり全層にて内周方向から外周方向、又は全層にて外周方向から内周方向、というパラレル・パスであってもよい。また、オポジット・パスであってもよい。オポジット・パスでは、例えば、スポットの進行方向を基準層(L0)では内周側から外周側の方向とした場合、L1では外周側から内周側の方向、L2では内周側から外周側の方向、・・・つまり、Lm(mは0及び偶数)では内周側から外周側の方向、Lm+1では外周側から内周側の方向となる。又は、Lm(mは0及び偶数)では外周側から内周側の方向、Lm+1では内周側から外周側の方向となる。このように、オポジット・パスでは層が切り替わる毎に再生方向が逆になる。
データ(オリジナルのソースデータ/変調前のバイナリデータ)を記録媒体に記録する場合、所定のサイズに分割され、さらに所定のサイズに分割されたデータは所定の長さのフレームに分割され、フレーム毎に所定のシンクコード/同期符号系列が挿入される(フレームシンク領域)。フレームに分割されたデータは、記録媒体の記録再生信号特性に合致した所定の変調則に従って変調されたデータ符号系列として記録される(フレームデータ領域)。
一方、フレーム間に挿入されるシンクコード/同期符号系列には前述の所定の変調則は適用されないので、その変調則によって拘束される符号長以外のパターンを含ませることが可能となる。このシンクコード/同期符号系列は、記録されたデータを再生するときの再生処理タイミングを決定するもののため、次のようなパターンが含まれてもよい。
前述の同期符号系列とデータ符号系列を含む領域を仮にフレーム領域と呼び、そのフレーム領域を複数(例えば31個)含む単位を仮にセクタ(又はAddress Unit)と呼ぶことにすると、あるセクタにおいて、そのセクタの任意のフレーム領域に含まれる同期符号系列と、その任意のフレーム領域以外のフレーム領域に含まれる同期符号系列との符号間距離を2以上にしてもよい。ここで符号間距離とは、2つの符号系列を比較した場合、符号系列中の異なるビットの個数を意味する。この様に符号間距離を2以上にすることで、再生時のノイズの影響などにより一方の読み出し系列が1ビットシフト誤りを起こしても、もう一方と誤識別することがない。また、特に、そのセクタの先頭に位置するフレーム領域に含まれる同期符号系列と、先頭以外に位置するフレーム領域に含まれる同期符号系列との符号間距離を2以上にしてもよく、この様にすることで、先頭箇所か否か/セクタの区切り箇所か否かの識別を容易にすることができる。
また記録方式に関してであるが、媒体に溝を形成することによって、溝部と、溝と溝との間の溝間部と、が形成されることになるが、溝部に記録するか、溝間部に記録するか、溝部と溝間部の両方に記録するか、様々な方式がある。ここで、溝部と溝間部のうち、光入射面から見て凸部となる側に記録する方式をOn-Groove方式といい、光入射面から見て凹部となる側に記録する方式をIn-Groove方式という。本発明において、記録方式として、On-Groove方式とするか、In-Groove方式とするか、両方式のどちらか一方を許可する方式とするかは特に問わない。
上記のIn/On-Groove方式は、媒体に溝を形成する記録型の媒体に関してであるが、再生専用型の媒体に関しても同様の考え方を適用できる。つまり再生専用型の媒体の場合、情報はエンボス/凹凸ピットという形で記録されるが、このピットの形成方式としても、光入射面から見て凸部のピットが形成されるものをOn-Pit方式といい、光入射面から見て凹部のピットが形成されるものをIn-Pit方式といい、本発明において、ピットの形成方式として、On-Pit方式とするか、In-Pit方式とするか、両方式のどちらか一方を許可する方式とするかは特に問わない。
また、記録膜の特性に関してであるが、記録部分と未記録部分との反射率の関係により、以下の2つの特性のものがある。つまり、未記録部分が記録済部分よりも高反射率(High-to-Low)であるHtoL特性と、未記録部分が記録済部分よりも低反射率(Low-to-High)であるLtoH特性である。本発明において、媒体の記録膜特性として、HtoLであるか、LtoHであるか、どちらか一方を許可するものであるかは特に問わない。
Claims (13)
- 情報記録媒体から再生された再生信号からPRML方式を用いて生成された2値化信号に基づいて、前記再生信号を評価する信号評価方法であって、
前記2値化信号に対応した、同じ状態に合流するパスのパターンを検出するステップと、
前記2値化信号に対応した正パターンの理想値と、前記正パターンに対応した誤パターンの理想値とを取得するステップと、
前記正パターンの理想値と前記再生信号との間の距離と、前記誤パターンの理想値と前記再生信号との間の距離との差分を計算するステップと、
前記差分に基づいて、前記PRML方式における所定のパターン群ごとに、予測されるエラーレートを計算するステップと、
前記再生信号の評価に用いるための、前記所定のパターン群ごとのエラーレートを加算した全体のエラーレートに対応した標準偏差を計算するステップと、
を包含する、信号評価方法。 - 前記エラーレートを計算するステップは、
前記所定のパターン群ごとに前記差分の標準偏差を計算するステップと、
前記所定のパターン群ごとの発生確率を検出するステップと、
前記差分の標準偏差と、前記発生確率と、前記所定のパターン群ごとに発生するエラー数とに基づいて、前記エラーレートを計算するステップと、
を包含する、請求項1に記載の信号評価方法。 - 前記所定のパターン群のそれぞれは、ユークリッド距離が14以下のパターン群である、請求項1に記載の信号評価方法。
- 複数の前記所定のパターン群は、
ユークリッド距離が14のパターン群と、
ユークリッド距離が12で且つ2T信号が孤立するパターン群と、
ユークリッド距離が12で且つ2T信号が連続するパターン群と、
を含む、請求項1に記載の信号評価方法。 - 前記PRML方式は、PR12221方式である、請求項1に記載の信号評価方法。
- 情報記録媒体から再生された再生信号からPRML方式を用いて生成された2値化信号に基づいて、前記再生信号を評価する装置であって、
前記2値化信号に対応した、同じ状態に合流するパスのパターンを検出するパターン検出部と、
前記2値化信号に対応した正パターンの理想値と前記再生信号との間の距離と、前記正パターンに対応した誤パターンの理想値と前記再生信号との間の距離との差分を計算する差分演算部と、
前記差分に基づいて、前記PRML方式における所定のパターン群ごとに、予測されるエラーレートを計算するエラーレート演算部と、
前記再生信号の評価に用いるための、前記所定のパターン群ごとのエラーレートを加算した全体のエラーレートに対応した標準偏差を計算する標準偏差演算部と、
を備える、装置。 - 前記所定のパターン群ごとに前記差分の標準偏差を計算する演算部と、
前記所定のパターン群ごとの発生確率を検出する検出部と、
をさらに備え、
前記エラーレート演算部は、前記差分の標準偏差と、前記発生確率と、前記所定のパターン群ごとに発生するエラー数とに基づいて、前記エラーレートを計算する、請求項6に記載の装置。 - 前記所定のパターン群のそれぞれは、ユークリッド距離が14以下のパターン群である、請求項6に記載の装置。
- 複数の前記所定のパターン群は、
ユークリッド距離が14のパターン群と、
ユークリッド距離が12で且つ2T信号が孤立するパターン群と、
ユークリッド距離が12で且つ2T信号が連続するパターン群と、
を含む、請求項6に記載の装置。 - 前記PRML方式は、PR12221方式である、請求項6に記載の装置。
- 所定の品質を有する情報記録媒体であって、
前記情報記録媒体は、少なくとも1つの記録層を有し、
前記記録層は、マークとスペースの組み合わせで情報を記録するための記録領域を含み、
前記マーク及び前記スペースから再生される再生信号に対応する評価値が所定の値を有し、
前記評価値を算出する処理は、
前記マーク及び前記スペースから再生された再生信号からPRML方式を用いて2値化信号を生成するステップと、
前記2値化信号に対応した、同じ状態に合流するパスのパターンを検出するステップと、
前記2値化信号に対応した正パターンの理想値と前記再生信号との間の距離と、前記正パターンに対応した誤パターンの理想値と前記再生信号との間の距離との差分を計算するステップと、
前記差分に基づいて、前記PRML方式における所定のパターン群ごとに、予測されるエラーレートを計算するステップと、
前記再生信号の評価に用いるための、前記所定のパターン群ごとのエラーレートを加算した全体のエラーレートに対応した標準偏差を計算するステップと、
を含む、情報記録媒体。 - 請求項11に記載の情報記録媒体を再生する再生装置であって、
前記情報記録媒体に光ビームを照射し、前記マーク及び前記スペースからの反射光を受光する受光部と、
前記反射光から得られる信号に基づき、前記マーク及び前記スペースを用いて記録された情報を再生する再生部と、
を備えた、再生装置。 - 請求項11に記載の情報記録媒体に記録を行う記録装置であって、
前記情報記録媒体にパルス状の光ビームを照射して、前記記録領域に前記マークを形成する照射部と、
前記評価値が前記所定の値を満たすように、前記光ビームの発光波形パターンを調整する調整部と、
を備えた、記録装置。
Priority Applications (7)
| Application Number | Priority Date | Filing Date | Title |
|---|---|---|---|
| CN200980000286A CN101681658A (zh) | 2008-02-28 | 2009-02-27 | 信号评价方法以及信号评价装置 |
| BRPI0902903A BRPI0902903A2 (pt) | 2008-02-28 | 2009-02-27 | método de avaliação de sinal e aparelho de avaliação de sinal |
| CA002684790A CA2684790A1 (en) | 2008-02-28 | 2009-02-27 | Signal evaluation method and signal evaluation device |
| AU2009219544A AU2009219544A1 (en) | 2008-02-28 | 2009-02-27 | Signal evaluation method and signal evaluation device |
| EP09714009A EP2246855A4 (en) | 2008-02-28 | 2009-02-27 | Signal evaluation method and signal evaluation device |
| MX2009011558A MX2009011558A (es) | 2008-02-28 | 2009-02-27 | Metodo de evalucion de señales y aparato de evaluacion de señales. |
| JP2010500578A JP5450376B2 (ja) | 2008-02-28 | 2009-02-27 | 信号評価方法および信号評価装置 |
Applications Claiming Priority (4)
| Application Number | Priority Date | Filing Date | Title |
|---|---|---|---|
| US3211208P | 2008-02-28 | 2008-02-28 | |
| US61/032,112 | 2008-02-28 | ||
| US4826208P | 2008-04-28 | 2008-04-28 | |
| US61/048,262 | 2008-04-28 |
Publications (1)
| Publication Number | Publication Date |
|---|---|
| WO2009107399A1 true WO2009107399A1 (ja) | 2009-09-03 |
Family
ID=41015806
Family Applications (1)
| Application Number | Title | Priority Date | Filing Date |
|---|---|---|---|
| PCT/JP2009/000907 Ceased WO2009107399A1 (ja) | 2008-02-28 | 2009-02-27 | 信号評価方法および信号評価装置 |
Country Status (11)
| Country | Link |
|---|---|
| US (2) | US8068399B2 (ja) |
| EP (1) | EP2246855A4 (ja) |
| JP (1) | JP5450376B2 (ja) |
| KR (1) | KR20100115699A (ja) |
| CN (1) | CN101681658A (ja) |
| AU (1) | AU2009219544A1 (ja) |
| BR (1) | BRPI0902903A2 (ja) |
| CA (1) | CA2684790A1 (ja) |
| MX (1) | MX2009011558A (ja) |
| RU (1) | RU2009139747A (ja) |
| WO (1) | WO2009107399A1 (ja) |
Cited By (4)
| Publication number | Priority date | Publication date | Assignee | Title |
|---|---|---|---|---|
| EP2242053A1 (en) * | 2009-04-14 | 2010-10-20 | Hitachi Consumer Electronics Co., Ltd. | Adjusting method for recording condition and optical disc device |
| WO2012008094A1 (ja) * | 2010-07-12 | 2012-01-19 | パナソニック株式会社 | 信号評価指標演算回路および光ディスク装置 |
| JPWO2020202765A1 (ja) * | 2019-03-29 | 2020-10-08 | ||
| CN113760682A (zh) * | 2021-08-20 | 2021-12-07 | 浪潮电子信息产业股份有限公司 | 一种内存信号质量评估方法、系统及装置 |
Families Citing this family (10)
| Publication number | Priority date | Publication date | Assignee | Title |
|---|---|---|---|---|
| JP5238436B2 (ja) * | 2008-09-30 | 2013-07-17 | 株式会社日立製作所 | 光ディスク記録装置、光ディスク再生装置、情報記録方法および情報再生方法 |
| CA2707185A1 (en) * | 2008-10-02 | 2010-04-08 | Panasonic Corporation | Reproduced signal evaluating method, information recording medium, reproducing device, and recording device |
| US8179760B2 (en) * | 2008-10-02 | 2012-05-15 | Panasonic Corporation | Reproduction signal evaluation method, information recording medium, reproduction apparatus and recording apparatus |
| JP5372864B2 (ja) * | 2009-08-18 | 2013-12-18 | パナソニック株式会社 | 多層光ディスクおよび光ディスク装置 |
| KR20130037547A (ko) * | 2011-10-06 | 2013-04-16 | 삼성전자주식회사 | 기록 매체 재생 방법 및 이를 적용한 기록 매체 재생 장치 |
| US9053217B2 (en) * | 2013-02-17 | 2015-06-09 | Lsi Corporation | Ratio-adjustable sync mark detection system |
| CN109643559B (zh) * | 2016-08-30 | 2020-11-27 | 索尼半导体解决方案公司 | 信号质量评估设备、信号质量评估值生成方法及再现设备 |
| US9892752B1 (en) * | 2017-06-15 | 2018-02-13 | Seagate Technology Llc | Selecting a maximum laser power for a calibration based on a previously measured function |
| KR20230075270A (ko) * | 2021-11-22 | 2023-05-31 | 현대모비스 주식회사 | 빔 패턴 제어 장치 및 방법 |
| CN119071165A (zh) * | 2024-11-06 | 2024-12-03 | 浙江省邮电工程建设有限公司 | 一种通信建设数字化管理方法与系统 |
Citations (5)
| Publication number | Priority date | Publication date | Assignee | Title |
|---|---|---|---|---|
| JP2003151220A (ja) * | 2001-11-09 | 2003-05-23 | Toshiba Corp | 情報記録再生装置とその信号評価方法及び情報記録再生媒体 |
| JP2003272304A (ja) * | 2002-03-13 | 2003-09-26 | Toshiba Corp | 情報記録再生装置とその信号評価方法及び情報記録再生媒体 |
| JP2004213862A (ja) * | 2002-12-17 | 2004-07-29 | Nec Corp | 光ディスク及び光ディスク記録再生装置および光ディスクの信号品質評価方法 |
| JP2004335079A (ja) * | 2003-04-14 | 2004-11-25 | Matsushita Electric Ind Co Ltd | 記録制御装置、記録再生装置および記録制御方法 |
| JP2006164318A (ja) * | 2004-12-02 | 2006-06-22 | Sony Corp | 最尤復号装置、信号評価方法 |
Family Cites Families (12)
| Publication number | Priority date | Publication date | Assignee | Title |
|---|---|---|---|---|
| JP2003051163A (ja) | 2001-05-28 | 2003-02-21 | Sharp Corp | 信号品質評価方法及び再生装置 |
| US7206351B2 (en) | 2001-05-28 | 2007-04-17 | Sharp Kabushiki Kaisha | Signal evaluation devices and signal evaluation methods, signal quality evaluation methods and reproducing devices and recording devices |
| US20030067998A1 (en) | 2001-07-19 | 2003-04-10 | Matsushita Electric Industrial Co., Ltd. | Method for evaluating the quality of read signal and apparatus for reading information |
| JP3926688B2 (ja) | 2001-07-19 | 2007-06-06 | 松下電器産業株式会社 | 再生信号品質評価方法および情報再生装置 |
| JP3817470B2 (ja) * | 2001-12-04 | 2006-09-06 | シャープ株式会社 | 信号評価装置および信号評価方法 |
| EP1443509A3 (en) | 2003-01-28 | 2006-01-11 | Kabushiki Kaisha Toshiba | Signal evaluation method, information recording/reproducing apparatus, information reproducing apparatus, and information recording medium |
| US7038869B2 (en) | 2003-04-14 | 2006-05-02 | Matsushita Electric Industrial Co., Ltd. | Recording control apparatus, recording and reproduction apparatus, and recording control method |
| JP4313755B2 (ja) * | 2004-05-07 | 2009-08-12 | 株式会社日立製作所 | 再生信号の評価方法および光ディスク装置 |
| JP4622632B2 (ja) * | 2005-03-31 | 2011-02-02 | ソニー株式会社 | 最尤復号装置、信号評価方法、再生装置 |
| JP4750488B2 (ja) * | 2005-07-08 | 2011-08-17 | ソニー株式会社 | 評価装置、再生装置、評価方法 |
| KR100658783B1 (ko) * | 2006-02-21 | 2006-12-19 | 삼성전자주식회사 | 광 디스크 재생 장치 |
| EP2043102A4 (en) | 2006-12-28 | 2011-07-06 | Panasonic Corp | Evaluation method for an information recording medium, information recording medium, method for producing an information recording medium, signal processing method, and access control device |
-
2009
- 2009-02-27 KR KR1020097022069A patent/KR20100115699A/ko not_active Ceased
- 2009-02-27 BR BRPI0902903A patent/BRPI0902903A2/pt not_active Application Discontinuation
- 2009-02-27 CN CN200980000286A patent/CN101681658A/zh active Pending
- 2009-02-27 AU AU2009219544A patent/AU2009219544A1/en not_active Abandoned
- 2009-02-27 CA CA002684790A patent/CA2684790A1/en not_active Abandoned
- 2009-02-27 JP JP2010500578A patent/JP5450376B2/ja active Active
- 2009-02-27 MX MX2009011558A patent/MX2009011558A/es active IP Right Grant
- 2009-02-27 EP EP09714009A patent/EP2246855A4/en not_active Withdrawn
- 2009-02-27 US US12/394,281 patent/US8068399B2/en active Active
- 2009-02-27 WO PCT/JP2009/000907 patent/WO2009107399A1/ja not_active Ceased
- 2009-02-27 RU RU2009139747/28A patent/RU2009139747A/ru not_active Application Discontinuation
-
2011
- 2011-02-25 US US13/034,762 patent/US8098557B2/en not_active Expired - Fee Related
Patent Citations (5)
| Publication number | Priority date | Publication date | Assignee | Title |
|---|---|---|---|---|
| JP2003151220A (ja) * | 2001-11-09 | 2003-05-23 | Toshiba Corp | 情報記録再生装置とその信号評価方法及び情報記録再生媒体 |
| JP2003272304A (ja) * | 2002-03-13 | 2003-09-26 | Toshiba Corp | 情報記録再生装置とその信号評価方法及び情報記録再生媒体 |
| JP2004213862A (ja) * | 2002-12-17 | 2004-07-29 | Nec Corp | 光ディスク及び光ディスク記録再生装置および光ディスクの信号品質評価方法 |
| JP2004335079A (ja) * | 2003-04-14 | 2004-11-25 | Matsushita Electric Ind Co Ltd | 記録制御装置、記録再生装置および記録制御方法 |
| JP2006164318A (ja) * | 2004-12-02 | 2006-06-22 | Sony Corp | 最尤復号装置、信号評価方法 |
Non-Patent Citations (1)
| Title |
|---|
| See also references of EP2246855A4 * |
Cited By (10)
| Publication number | Priority date | Publication date | Assignee | Title |
|---|---|---|---|---|
| EP2242053A1 (en) * | 2009-04-14 | 2010-10-20 | Hitachi Consumer Electronics Co., Ltd. | Adjusting method for recording condition and optical disc device |
| US8085640B2 (en) | 2009-04-14 | 2011-12-27 | Hitachi Consumer Electronics Co., Ltd. | Adjusting method for recording condition and optical disc device |
| US8264932B2 (en) | 2009-04-14 | 2012-09-11 | Hitachi Consumer Electronics Co., Ltd. | Adjusting method for recording condition and optical disc device |
| WO2012008094A1 (ja) * | 2010-07-12 | 2012-01-19 | パナソニック株式会社 | 信号評価指標演算回路および光ディスク装置 |
| JPWO2020202765A1 (ja) * | 2019-03-29 | 2020-10-08 | ||
| WO2020202765A1 (ja) * | 2019-03-29 | 2020-10-08 | パナソニックIpマネジメント株式会社 | 記録状態評価方法、記録補償方法及び情報記録再生装置 |
| US11475918B2 (en) | 2019-03-29 | 2022-10-18 | Panasonic Intellectual Property Management Co., Ltd. | Recording state evaluation method, recording compensation method, and information recording/playback device |
| JP7442100B2 (ja) | 2019-03-29 | 2024-03-04 | パナソニックIpマネジメント株式会社 | 記録状態評価方法、記録補償方法及び情報記録再生装置 |
| CN113760682A (zh) * | 2021-08-20 | 2021-12-07 | 浪潮电子信息产业股份有限公司 | 一种内存信号质量评估方法、系统及装置 |
| CN113760682B (zh) * | 2021-08-20 | 2024-02-23 | 浪潮电子信息产业股份有限公司 | 一种内存信号质量评估方法、系统及装置 |
Also Published As
| Publication number | Publication date |
|---|---|
| BRPI0902903A2 (pt) | 2015-09-22 |
| AU2009219544A1 (en) | 2009-09-03 |
| EP2246855A1 (en) | 2010-11-03 |
| RU2009139747A (ru) | 2011-05-10 |
| MX2009011558A (es) | 2009-11-27 |
| US20090225639A1 (en) | 2009-09-10 |
| EP2246855A4 (en) | 2011-07-27 |
| CA2684790A1 (en) | 2009-09-03 |
| US8098557B2 (en) | 2012-01-17 |
| US20110149704A1 (en) | 2011-06-23 |
| JPWO2009107399A1 (ja) | 2011-06-30 |
| JP5450376B2 (ja) | 2014-03-26 |
| US8068399B2 (en) | 2011-11-29 |
| CN101681658A (zh) | 2010-03-24 |
| KR20100115699A (ko) | 2010-10-28 |
Similar Documents
| Publication | Publication Date | Title |
|---|---|---|
| JP5450376B2 (ja) | 信号評価方法および信号評価装置 | |
| JP5042236B2 (ja) | 情報記録媒体評価方法、情報記録媒体、情報記録媒体の製造方法、信号処理方法、アクセス制御装置 | |
| US8446810B2 (en) | Information recording medium having recording condition for adjusting the position of cooling pulse | |
| JPWO2010001588A1 (ja) | 再生信号評価方法、再生信号評価装置及びこれを備えた光ディスク装置 | |
| US8305859B2 (en) | Information recording medium and information recording medium evaluation method | |
| US8289829B2 (en) | Information recording medium and recording/reproduction apparatus | |
| US8243571B2 (en) | Reproduced signal evaluating method, information recording medium, reproducing device, and recording device | |
| WO2010038398A1 (ja) | 情報記録媒体および記録再生装置 | |
| WO2010038432A1 (ja) | 再生信号評価方法、情報記録媒体、再生装置、記録装置 | |
| US8179760B2 (en) | Reproduction signal evaluation method, information recording medium, reproduction apparatus and recording apparatus | |
| CN101652811A (zh) | 信息记录介质以及信息记录介质的评价方法 | |
| JP2010140519A (ja) | 再生信号の最尤復号方法、光ディスク装置、集積回路および光ディスク |
Legal Events
| Date | Code | Title | Description |
|---|---|---|---|
| WWE | Wipo information: entry into national phase |
Ref document number: 200980000286.0 Country of ref document: CN |
|
| WWE | Wipo information: entry into national phase |
Ref document number: 2009219544 Country of ref document: AU |
|
| WWE | Wipo information: entry into national phase |
Ref document number: 2684790 Country of ref document: CA |
|
| ENP | Entry into the national phase |
Ref document number: 20097022069 Country of ref document: KR Kind code of ref document: A |
|
| WWE | Wipo information: entry into national phase |
Ref document number: 6274/CHENP/2009 Country of ref document: IN |
|
| ENP | Entry into the national phase |
Ref document number: 2010500578 Country of ref document: JP Kind code of ref document: A |
|
| WWE | Wipo information: entry into national phase |
Ref document number: MX/A/2009/011558 Country of ref document: MX |
|
| WWE | Wipo information: entry into national phase |
Ref document number: 2009139747 Country of ref document: RU Ref document number: 2009714009 Country of ref document: EP |
|
| 121 | Ep: the epo has been informed by wipo that ep was designated in this application |
Ref document number: 09714009 Country of ref document: EP Kind code of ref document: A1 |
|
| NENP | Non-entry into the national phase |
Ref country code: DE |
|
| ENP | Entry into the national phase |
Ref document number: PI0902903 Country of ref document: BR Kind code of ref document: A2 Effective date: 20091027 |