WO2012095935A1 - 細胞核観察基板及び細胞核観察装置 - Google Patents
細胞核観察基板及び細胞核観察装置 Download PDFInfo
- Publication number
- WO2012095935A1 WO2012095935A1 PCT/JP2011/007293 JP2011007293W WO2012095935A1 WO 2012095935 A1 WO2012095935 A1 WO 2012095935A1 JP 2011007293 W JP2011007293 W JP 2011007293W WO 2012095935 A1 WO2012095935 A1 WO 2012095935A1
- Authority
- WO
- WIPO (PCT)
- Prior art keywords
- fluorescence
- observation
- copper
- cells
- cell nucleus
- Prior art date
- Legal status (The legal status is an assumption and is not a legal conclusion. Google has not performed a legal analysis and makes no representation as to the accuracy of the status listed.)
- Ceased
Links
Images
















Classifications
-
- G—PHYSICS
- G01—MEASURING; TESTING
- G01N—INVESTIGATING OR ANALYSING MATERIALS BY DETERMINING THEIR CHEMICAL OR PHYSICAL PROPERTIES
- G01N21/00—Investigating or analysing materials by the use of optical means, i.e. using sub-millimetre waves, infrared, visible or ultraviolet light
- G01N21/62—Systems in which the material investigated is excited whereby it emits light or causes a change in wavelength of the incident light
- G01N21/63—Systems in which the material investigated is excited whereby it emits light or causes a change in wavelength of the incident light optically excited
- G01N21/64—Fluorescence; Phosphorescence
- G01N21/6428—Measuring fluorescence of fluorescent products of reactions or of fluorochrome labelled reactive substances, e.g. measuring quenching effects, using measuring "optrodes"
-
- G—PHYSICS
- G01—MEASURING; TESTING
- G01N—INVESTIGATING OR ANALYSING MATERIALS BY DETERMINING THEIR CHEMICAL OR PHYSICAL PROPERTIES
- G01N21/00—Investigating or analysing materials by the use of optical means, i.e. using sub-millimetre waves, infrared, visible or ultraviolet light
- G01N21/62—Systems in which the material investigated is excited whereby it emits light or causes a change in wavelength of the incident light
- G01N21/63—Systems in which the material investigated is excited whereby it emits light or causes a change in wavelength of the incident light optically excited
- G01N21/64—Fluorescence; Phosphorescence
- G01N21/6486—Measuring fluorescence of biological material, e.g. DNA, RNA, cells
-
- G—PHYSICS
- G01—MEASURING; TESTING
- G01N—INVESTIGATING OR ANALYSING MATERIALS BY DETERMINING THEIR CHEMICAL OR PHYSICAL PROPERTIES
- G01N1/00—Sampling; Preparing specimens for investigation
- G01N1/28—Preparing specimens for investigation including physical details of (bio-)chemical methods covered elsewhere, e.g. G01N33/50, C12Q
- G01N1/30—Staining; Impregnating ; Fixation; Dehydration; Multistep processes for preparing samples of tissue, cell or nucleic acid material and the like for analysis
-
- G—PHYSICS
- G01—MEASURING; TESTING
- G01N—INVESTIGATING OR ANALYSING MATERIALS BY DETERMINING THEIR CHEMICAL OR PHYSICAL PROPERTIES
- G01N21/00—Investigating or analysing materials by the use of optical means, i.e. using sub-millimetre waves, infrared, visible or ultraviolet light
- G01N21/62—Systems in which the material investigated is excited whereby it emits light or causes a change in wavelength of the incident light
- G01N21/63—Systems in which the material investigated is excited whereby it emits light or causes a change in wavelength of the incident light optically excited
- G01N21/64—Fluorescence; Phosphorescence
- G01N21/645—Specially adapted constructive features of fluorimeters
- G01N21/6456—Spatial resolved fluorescence measurements; Imaging
- G01N21/6458—Fluorescence microscopy
Definitions
- the present invention relates to a cell nucleus observation substrate and a cell nucleus observation apparatus. More specifically, the present invention relates to a cell nucleus observation substrate for morphological observation by fluorescent staining of cell nuclei.
- cell nuclei such as cells and microorganisms are observed using a microscope or the like, and the types and properties of cells and microorganisms are determined based on the morphology of the nuclei.
- cells, microorganisms, and the like are dyed using a dye that exhibits dyeability to the nucleus.
- Non-Patent Documents 1 and 2 describe a technique for observing malaria parasites that are infected in cells by Giemsa staining of red blood cells. According to the devices described in Non-Patent Documents 1 and 2, it is possible to easily and quickly diagnose malaria by accumulating red blood cells infected with malaria parasites in blood using a magnet.
- methylene blue which is a blue dye used for Giemsa staining
- hematoxylin which is a blue-violet dye
- nuclei have also been fluorescently stained using a fluorescent dye having binding properties to nucleic acids.
- fluorescent dyes include Hoechst and DAPI.
- conventionally known fluorescence will be described as autofluorescence exhibited by cells during fluorescence observation.
- One such fluorescence is the orange autofluorescence exhibited by cells irradiated with UV in the presence of copper.
- the cells in which this orange fluorescence is particularly observed in the Drosophila larvae midgut are called "copper cells”. It has been reported that when the concentration of copper to be administered is increased, fluorescence is also observed in cells around the copper cell (Non-Patent Document 6) and the entire body wall of the larva (Non-Patent Document 4).
- Non-Patent Documents 4 to 6 and 9 The wavelength range of fluorescence is 590-630 nm, the peak wavelength is 610 nm, and the maximum excitation wavelength is 340 nm (Non-Patent Document 5).
- Cu-MT copper and metallothionein
- the wavelength characteristics of Cu-MT are an excitation wavelength of 305 nm and a fluorescence wavelength of 565 nm in Non-Patent Document 15, and an excitation wavelength of 310 nm and a fluorescence wavelength of 570 nm in Non-Patent Document 19.
- Cu-MT copper is considered to exist in the state of monovalent ions (Cu (I)) (see Non-Patent Documents 15, 17, 19, 21, and 25).
- Non-Patent Documents 26 to 31 As such phosphors containing copper, compounds containing pyrimidine or mercaptide and the like, and compounds that emit fluorescence when pyrimidine or mercaptide acts on copper have been widely reported (Non-Patent Documents 26 to 31). reference).
- the conventional method for observing cell nuclei by nuclear staining using a dye requires fixing treatment of cells and microorganisms, repeated steps of immersion and washing in a dye solution, and a drying process. Also needed proficiency.
- the main object of the present invention is to provide a technique for staining nuclei such as cells and microorganisms by simple operations and performing morphology observation.
- the present inventors have found that a nucleic acid in contact with copper emits fluorescence when irradiated with light in the ultraviolet wavelength region, and devised a cell nucleus observation substrate according to the present invention by applying this knowledge. That is, in order to solve the above problems, the present invention includes an introduction part into which a sample liquid containing cells is introduced, and an observation region in which cells in the sample liquid introduced from the introduction part are accommodated, Provided is a cell nucleus observation substrate in which copper is disposed on a flow path of a sample solution including an introduction part and the observation region so as to be able to contact the sample solution.
- the cells in the sample solution introduced from the introduction part are housed in the observation region in a state where the nucleic acid emits fluorescence when contacted with copper. Therefore, in this cell nucleus observation substrate, it is possible to observe cells in a state where the nucleus is fluorescently stained in the observation region.
- the copper is deposited and disposed on the flow path.
- the cell nucleus observation substrate includes a detachable magnet that forms a magnetic field in the observation region, and can hold the cells in the sample solution flowing through the flow path in the observation region based on the magnetic force. .
- the observation region is configured in a gap between two substrate layers facing each other with a predetermined distance, and a sample liquid introduction portion into the gap and the introduction portion into the gap are introduced. And an absorbing member that absorbs the sample liquid, and the magnet is attached to a corresponding position between the introduction portion and the absorbing member.
- the present invention includes an introduction part into which a sample liquid containing cells is introduced, and an observation area in which cells in the sample liquid introduced from the introduction part are accommodated, and the introduction part and the observation area A substrate on which copper is disposed so as to be in contact with the sample liquid on the flow path of the sample liquid, and an optical detection means for irradiating the observation region with light and detecting the generated fluorescence.
- a cell nucleus observation apparatus is provided. In this cell nucleus observation apparatus, the cells in the sample solution introduced from the introduction part are housed in the observation region in a state where the nucleic acid emits fluorescence when contacted with copper.
- the wavelength of light emitted by the optical detection means is set to 300 to 420 nm.
- nuclei such as cells and microorganisms with a simple operation and performing morphology observation.
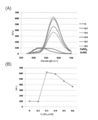
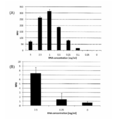
- FIG. 6 is a drawing-substituting graph showing fluorescence spectra and RFU values obtained by contacting ssDNA with CuSO 4 having a changed concentration under conditions of an SA concentration of 50 mM.
- A) shows the fluorescence spectrum, and
- A) shows the fluorescence spectrum, and
- FIG. 6 is a drawing-substituting graph showing fluorescence spectra and RFU values obtained by contacting ssDNA with CuSO 4 having a changed concentration under conditions of an SA concentration of 50 mM.
- A shows the fluorescence spectrum
- B shows the peak RFU value (Example 1).
- FIG. 3 is a drawing-substituting graph showing a fluorescence spectrum obtained by bringing oligo DNA into contact with 0.4 mM CuSO 4 under an SA concentration of 4 mM (Example 1).
- FIG. 3 is a drawing-substituting graph showing a fluorescence spectrum obtained by bringing oligo DNA into contact with 0.4 mM CuSO 4 under an SA concentration of 4 mM (Example 1).
- FIG. 3 is a drawing-substituting graph showing a fluorescence spectrum obtained by bringing oligo DNA into contact with 0.4 mM CuSO 4 under an SA concentration of 4 mM (Example 1).
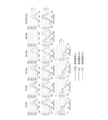
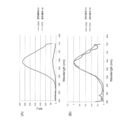
- FIG. 9 is a drawing-substituting graph showing temporal changes in fluorescence spectra and absorption spectra obtained with oligo DNAs of T (20), T (6), and T (3) under conditions of CuSO 4 concentration of 0.4 mM and SA concentration of 4 mM ( Example 1).
- the upper row shows the fluorescence spectrum with the vertical axis as the RFU value (absolute value)
- the middle row shows the fluorescence spectrum with the vertical axis as the RFU value (relative value)
- the lower row shows the absorption spectrum.
- FIG. 9 is a drawing-substituting graph showing temporal changes in fluorescence spectra and absorption spectra obtained with oligo DNAs of T (20), T (6), and T (3) under conditions of CuSO 4 concentration of 0.4 mM and SA concentration of 4 mM ( Example 1).
- (A) shows the change over time in the peak RFU value
- (B) shows the change over time in absorbance at a wavelength of 346 nm.
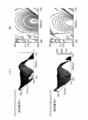
- FIG. 2 is a drawing-substituting graph showing two-dimensional fluorescence spectra obtained with oligo DNAs of T (20), T (6), and T (3) (Example 1).
- FIG. 1 is a drawing-substituting graph showing temporal changes in fluorescence spectra and absorption spectra obtained with oligo DNAs of T (20), T (6), and T (3) under conditions of CuSO 4 concentration of 0.4 mM and SA concentration of 4 mM ( Example 1).
- (A) shows the change over time in the peak R
- FIG. 3 is a drawing-substituting graph showing excitation spectra (broken lines) and fluorescence spectra (solid lines) of oligo DNAs of T (20), T (6), and T (3) (Example 1).
- FIG. 5 is a drawing-substituting graph showing a fluorescence spectrum obtained with an oligo DNA consisting of a three-base sequence composed of a combination of adenine and thymine (Example 1).
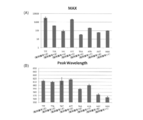
- FIG. 1 is a drawing-substituting graph showing the maximum RFU value (A) and peak wavelength (B) of a fluorescence spectrum obtained with an oligo DNA consisting of a three-base sequence composed of a combination of adenine and thymine (Example 1).
- FIG. 3 is a drawing-substituting graph showing fluorescence spectra obtained with oligo DNAs having the sequences described in SEQ ID NO: 19 and SEQ ID NO: 20 (Example 1). It is a drawing substitute graph which shows the fluorescence spectrum acquired by contacting the sample containing ssDNA with solid copper (Example 2).
- FIG. 10 is a drawing-substituting graph showing fluorescence spectra obtained by contacting samples containing ssDNA with solid copper in reaction solutions containing different types or concentrations of salts (Example 2). It is a drawing substitute graph which shows the fluorescence spectrum acquired by contacting the sample containing different concentration ssDNA (A) and RNA (B) with solid copper (Example 2). It is a drawing substitute graph which shows the fluorescence spectrum acquired by contacting the sample containing oligo DNA of a different arrangement
- FIG. 7 is a drawing-substituting graph showing excitation-fluorescence spectra obtained by contacting samples containing oligo-DNAs of different sequences with solid copper (Example 2).
- 10 is a drawing-substituting graph showing a fluorescence spectrum obtained with an oligo DNA consisting of a combination sequence of 8-base cytosine and 12-base thymine (Example 2).
- It is a drawing substitute graph which shows the fluorescence spectrum acquired with the double stranded DNA containing a mismatch (Example 2).
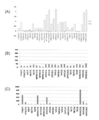
- FIG. 6 is a drawing-substituting graph showing RFU values obtained when the buffer type and pH of a reaction solution are changed (Example 2). It is a drawing substitute photograph which shows the fluorescence image acquired by making copper sputtered on the glass surface and ssDNA contact (Example 3). (Example 3) which is a drawing substitute photograph which shows the fluorescence image acquired by making copper sputter
- FIG. 5 is a drawing-substituting graph showing fluorescence intensity obtained when a sample containing DNA or RNA is brought into contact with copper or silver sputtered on a glass surface (Example 3).
- FIG. 5 is a drawing-substituting graph showing fluorescence intensity obtained when a sample containing DNA or RNA is brought into contact with copper or silver sputtered on a glass surface (Example 3).
- FIG. 9 is a drawing-substituting graph showing changes in intensity over time of fluorescence obtained by bringing copper sputtered onto a glass surface into contact with ssDNA (Example 3). It is a drawing substitute graph which shows the change of the fluorescence intensity at the time of changing temperature after contacting copper sputtered on the glass surface and ssDNA (Example 3). (Example 4) which is a drawing substitute photograph which shows the result of carrying out the fluorescence observation of the onion thin skin on copper sputtered glass.
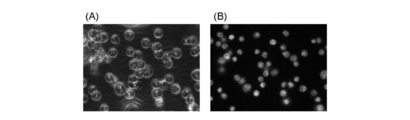
- FIG. 10 is a drawing-substituting photograph showing the results of fluorescent observation of a human leukocyte sample on copper sputtered glass (Example 4).
- Example 5 It is a drawing substitute photograph which shows the result of carrying out the fluorescence observation of the Jalkat cell on copper sputtered glass (Example 4). It is a drawing substitute photograph which shows the result of carrying out the fluorescence observation of the Jalkat cell on copper sputtered glass (Example 4).
- Example 5 it is the drawing substitute photograph which image
- Example 5 it is the drawing substitute photograph which image
- Example 5 it is the figure substitute photograph which shows the transmission image (A) which image
- FIG. 1 is a schematic diagram for explaining the configuration of a cell nucleus observation substrate according to a first embodiment of the present invention.
- A is a top view
- B is a sectional view corresponding to the PP section in (A)
- C is a sectional view corresponding to the QQ section in (A).
- the cell nucleus observation substrate denoted by reference symbol A is configured to include a substrate layer a 1 and a substrate layer a 2 , and the substrate layer a 1 and the substrate layer a 2 are separated by a predetermined distance across the spacer a 3 .
- a gap is formed to face each other.
- the thickness of the gap is not particularly limited, but is preferably about several micrometers to several hundred micrometers, more preferably about 10 to 50 micrometers.
- a gap formed by the substrate layer a 1 and the substrate layer a 2 is partially closed by the spacer a 3 , and the remaining portion is opened and communicated to the outside. Specifically, in the gap formed by the substrate layer a 1 and the substrate layer a 2 , the upper and lower sides are closed by the spacer a 3 in FIG. Has been. A part of the open portion of the gap between the substrate layer a 1 and the substrate layer a 2 (left side in FIG. 1A) serves as a sample liquid introduction portion 1 to the observation region 2 formed in the gap.
- an absorption member 4 for absorbing the sample liquid introduced into the gap from the introduction part 1 is formed on a part of the open part of the gap opposite to the introduction part 1 (same right side) as the substrate layer a 1 and the substrate layer. It is arranged to be inserted between the a 2.
- the sample liquid introduced from the introduction part 1 moves through the gap between the substrate layer a 1 and the substrate layer a 2 by capillary action and is absorbed by the absorbing member 4, so that cells contained in the sample liquid are brought into the observation region 2. Be contained.
- a buffer solution containing a salt such as sodium chloride (NaCl), potassium chloride (KCl), magnesium chloride (MgCl 2 ) is preferably used for the sample solution (see Example 2 described later).
- a salt such as sodium chloride (NaCl), potassium chloride (KCl), magnesium chloride (MgCl 2 )
- concentration thereof is not particularly limited, but is preferably set to 0.025M or more.
- the buffer used for the sample solution does not contain a chelating agent for Cu (II) ions (see Example 2).
- a buffer solution for example, physiological saline
- phosphate buffer saline (PBS) using a phosphate buffer can also be used as a buffer solution (see Example 2).
- the absorbing member 4 is not particularly limited as long as it is a material capable of absorbing sample liquid, and can be, for example, filter paper, water absorbing fiber, water absorbing resin, or the like.
- a copper film 3 is formed on the surface of the substrate layer a 2 facing the substrate layer a 1 .
- the cells in the sample liquid introduced from the introduction part 1 move in the gap between the substrate layer a 1 and the substrate layer a 2 while contacting the copper film 3 or copper eluted from the copper film 3 into the sample liquid.
- the nucleic acid in the cell nucleus becomes fluorescent when irradiated with light in the ultraviolet wavelength region due to contact with copper.
- the copper film 3 can be formed by sputtering or vapor deposition on the substrate surface using a conventionally known method.
- the film thickness of the copper film 3 is not particularly limited, but is several nm to several tens of nm, preferably about 20 to 40 nm. In this range of film thickness, the copper film 3 is light transmissive. Therefore, when the cells accommodated in the observation region 2 are irradiated with light to observe the nuclear fluorescence stained image of the cells, the copper film 3 is transmitted. Thus, it becomes possible to perform light irradiation or fluorescence detection. Note that light irradiation and fluorescence detection can both be performed from a surface opposite to the copper film 3 by using an epi-illumination optical system. In this case, the copper film 3 may not have light transmittance.
- reference numeral 5 denotes a magnet for forming a magnetic field in the observation region 2.
- Magnet 5 is disposed proximate the opposite surface of the observation region 2 of the substrate layer a 1.
- the magnet 5 may be detachably disposed, and may be disposed on either side of the substrate layer a 1 or the substrate layer a 2 .
- the magnet 5 is introduced from the introduction unit 1 and observes cells in the sample solution moving through the gap between the substrate layer a 1 and the substrate layer a 2 by capillary action based on the magnetic force of the magnetic field formed in the observation region 2. Sort and concentrate in area 2 and hold it. Thereby, only the cells adsorbed to the magnetic material can be accumulated in the observation region 2.
- the magnet 5 is not particularly limited as long as it is a material that can form a magnetic field in the observation region 2.
- the magnet 5 can be a neodymium magnet, a samarium gobart magnet, a ferrite magnet, or the like.
- the arrangement position of the magnet 5 is not particularly limited as long as a magnetic field can be formed in the observation region 2, and may be configured to be embedded in the substrate layer a 1 or the substrate layer a 2 .
- the magnet 5 is not an essential component.
- the cells accumulated in the observation region 2 are brought into a state where the nucleic acid in the cell nucleus emits fluorescence when irradiated with light in the ultraviolet wavelength region by contact with copper. Therefore, the nuclear fluorescent staining image of the cell can be observed by irradiating the observation region 2 with light in the ultraviolet wavelength region and detecting the generated fluorescence.
- the wavelength of the irradiated light is preferably 300 to 420 nm.
- the material of the substrate layer a 1 and the substrate layer a 2 is light-transmitting, has less autofluorescence, and has less wavelength dispersion. It is preferable to select a material with a small optical error.
- the material of the substrate layer a 1 and the substrate layer a 2 is glass or various plastics (polypropylene, polycarbonate, cycloolefin polymer, polydimethylsiloxane, etc.) can be employed.
- the magnet 5, in order to prevent the fluorescence generated from the light and the nucleus is irradiated to the observation region 2 is cut off, at the time of nuclear fluorescence staining image observation, remove the magnet 5 arranged on the substrate layer a 1 It can also be done. Alternatively, it is also possible to irradiate light and observe fluorescence from the opposite surface of the magnet using an epi-illumination optical system.
- the cells in the sample liquid introduced from the introduction part 1 are accumulated in the observation region 2 and further brought into contact with the copper film 3 so that the nucleic acid fluoresces. It is possible to observe the nuclear fluorescence staining image of the cells. Therefore, in the cell nucleus observation substrate A, cells, microorganisms, and the like that have been necessary for the cell nucleus observation method by nuclear staining using a conventional dye such as Giemsa staining, repeated steps of immersion and washing in a dye solution, drying It is possible to perform morphological observation by fluorescent staining of cell nuclei with a simple operation, eliminating the need for processes.
- a conventional dye such as Giemsa staining
- the cell nucleus observation substrate A is suitable for nuclei observation of cells having magnetism because the cells can be accumulated in the observation region 2 by the magnet 5 and observed.
- the cells having magnetism include cells labeled with a magnetic substance-labeled antibody, and malaria parasite cells infected with erythrocytes described in Non-Patent Documents 1 and 2 described above.
- the nucleus can be observed by concentrating only the white blood cells in the blood sample, and can be used for diagnosis of leukemia based on the shape of the nucleus, or for diagnosis of allergy based on the number of eosinophils.
- the labeling of a specific cell population can be performed using a magnetically labeled antibody that specifically binds to a specific cell surface antigen. It is also possible to provide an antibody labeling region between the introduction part 1 and the observation region 2 and mix the magnetically labeled antibody and the cells in the antibody labeling region.
- hemozoin a magnetic substance called hemozoin is formed in erythrocytes infected with malaria parasites.
- a blood specimen collected from a malaria patient is used as the sample liquid in the cell nucleus observation substrate A
- red blood cells infected with malaria parasite can be accumulated in the observation region 2 based on the magnetic action of the magnet 5 and hemozoin.
- malaria parasite-infected erythrocytes in the blood sample can be concentrated to observe the nucleus of the malaria parasite, and the presence / absence of malaria infection and the type of malaria parasite can be easily and accurately determined by the nuclear shape.
- the cell nucleus observation substrate A can be determined by observing the fluorescence staining image of the nucleus without performing a fixing process, a staining process, a drying process, or the like. It is.
- Plasmodium falciparum Plasmodium falciparum
- Plasmodium falciparum Plasmodium falciparum
- oval malaria parasites ring-shaped bodies, trophozoites, schizonts, gametocytes, and the like are known as growth stages of worms. Appropriate differentiation between protozoa types and growth stages is very important for the proper treatment of infected patients.
- the case where the copper film 3 is formed on the surface of the substrate layer a 2 facing the substrate layer a 1 has been described as an example.
- the copper film 3 only needs to be formed at any location on the flow path of the sample liquid including the introduction part 1 and the observation region 2 so as to be in contact with the sample liquid.
- the film may be formed on part or all of the surface of the substrate layer a 1 .
- copper may be arranged not only as a film but also as powder, fine particles, wires, plates, foils, and the like.
- copper is preferably solid copper from the viewpoint of stability during storage of the substrate, but copper in solution is not excluded.
- a reducing agent for maintaining dissolved Cu ions in a reduced state from divalent cations to monovalent cations.
- the reducing agent for example, sodium ascorbate (see Example 1) described later can be used.
- the term “copper” includes copper metal or a copper alloy containing copper in the composition.
- FIG. 2 is a schematic diagram for explaining the configuration of a cell nucleus observation substrate according to a second embodiment of the present invention.
- (A) is a top view
- (B) is a cross-sectional view corresponding to the PP cross section in (A).
- the cell nuclei observed substrate shown by reference numeral B is composed of a substrate layer a 1 and the substrate layer a 2 is bonded.
- the substrate layer a 1 an introduction part 1 into which the sample liquid is introduced and a discharge part 6 from which the sample liquid is discharged are formed.
- the substrate layer a 2 a flow path which the sample liquid introduced from the introduction unit 1 flows are formed.
- An observation region 2 serving as a field for observing cells is formed in a part of this flow path.
- a liquid feeding means (not shown) is connected to the introduction unit 1 and the discharge unit 6, and the sample liquid introduced from the introduction unit 1 flows through the flow path and is discharged from the discharge unit 6.
- the liquid feeding means includes a general-purpose pump, tube, sample liquid tank, waste liquid tank, and the like.
- a copper film 3 is formed as a film.
- the copper film 3 may be formed on the entire surface of the flow path, or may be formed on a part of the flow path surface upstream of the observation region 2 in the flow direction of the sample liquid as shown in the figure. . Further, the copper film 3 may be a substrate layer a 1.
- the cells in the sample liquid introduced into the flow path from the introduction part 1 come into contact with the copper film 3 or copper eluted from the copper film 3 into the sample liquid and are sent to the observation region 2. At this time, the nucleic acid in the cell nucleus is brought into a state of fluorescence upon irradiation with light in the ultraviolet wavelength region by contact with copper.
- the copper film 3 can be formed by sputtering or vapor deposition on the substrate surface using a conventionally known method.
- the film thickness of the copper film 3 is not particularly limited, but is several nm to several tens of nm, preferably about 20 to 40 nm. In this range of film thickness, the copper film 3 is light transmissive. Therefore, when the cells accommodated in the observation region 2 are irradiated with light to observe the nuclear fluorescence stained image of the cells, the copper film 3 is transmitted. Thus, it becomes possible to perform light irradiation or fluorescence detection.
- reference numeral 5 denotes a magnet for forming a magnetic field in the observation region 2.
- the magnet 5 is detachably disposed on the surface of the substrate layer a 1 opposite to the observation region 2.
- the magnet 5 is introduced from the introduction unit 1 and holds the cells in the sample solution fed through the flow path in the observation region 2 based on the magnetic force of the magnetic field formed in the observation region 2. Thereby, the magnet 5 accumulates the cells in which the nucleic acid is in a fluorescent state by contact with copper in the observation region 2.
- the material of the magnet 5 is the same as that of the cell nucleus observation board
- the magnet 5 is not an essential component.
- a substance for example, a specific cell
- An antibody against a cell membrane antigen for capture may be immobilized.
- an electrode for forming an electric field may be arranged in the observation region 2, and the cells may be held in the observation region 2 based on an electric force.
- the cells accumulated in the observation region 2 are brought into a state where the nucleic acid in the cell nucleus emits fluorescence when irradiated with light in the ultraviolet wavelength region by contact with copper. Therefore, the nuclear fluorescent staining image of the cell can be observed by irradiating the observation region 2 with light in the ultraviolet wavelength region and detecting the generated fluorescence.
- the wavelength of the irradiated light is preferably 300 to 420 nm.
- the material of the substrate layer a 1 and the substrate layer a 2 has light transmittance, low autofluorescence, and small wavelength dispersion. It is preferable to select a material having a small optical error.
- the material of the substrate layer a 1 and the substrate layer a 2 is glass or various plastics (polypropylene, polycarbonate, cycloolefin polymer, polydimethylsiloxane, etc.) can be employed.
- the magnet 5, in order to prevent the fluorescence generated from the light and the nucleus is irradiated to the observation region 2 is cut off, at the time of nuclear fluorescence staining image observation, remove the magnet 5 arranged on the substrate layer a 1 It can also be done. Alternatively, it is also possible to irradiate light and observe fluorescence from the opposite surface of the magnet using an epi-illumination optical system.
- the cells in the sample solution introduced from the introduction unit 1 are brought into contact with the copper film 3 and accumulated in the observation region 2 in a state where the nucleic acid emits fluorescence, so that the nuclear fluorescence of the cells is obtained.
- a stained image can be observed. Therefore, in the cell nucleus observation substrate B, a fixing process of cells and microorganisms, a repetition process of immersion and washing in a dye solution, a drying process, which are necessary in a cell nucleus observation method by nuclear staining using a conventional dye such as Giemsa staining, and a drying process It is possible to perform morphological observation by fluorescent staining of cell nuclei with a simple operation.
- the cell nucleus observation apparatus includes the above-described cell nucleus observation substrate, and optical detection means for irradiating light to the observation region of the substrate and detecting generated fluorescence, thereby nuclear nucleus staining of cells. It is a device that can observe images.
- This cell nucleus observation apparatus can be a modification of a conventionally known fluorescence microscope as appropriate, and has the following configuration as an optical detection means.
- the light irradiated to the observation region is preferably in the ultraviolet region having a wavelength of 300 to 420 nm.
- a laser, an LED, or the like can be used, and a UV-LED having a center wavelength of about 360 nm is preferably employed.
- the light from the light source is guided to the observation region by an optical path constituted by an optical filter, a mirror, a lens and the like as necessary.
- Fluorescence generated from the observation area is detected by a photodetector such as a photodetector, photodiode, photomultiplier, CCD camera, CMOS camera, and displayed on the image display device. Or the structure which observes the fluorescence which generate
- the optical filter one having selectivity with respect to light having a wavelength of about 600 nm, which is a wavelength range of fluorescence generated from nucleic acid in contact with copper (see Example 1 described later), is used.
- Example 1 when a nucleic acid is mixed in a solution in which Cu (II) ions are generated by reducing Cu (II) ions with ascorbic acid, an orange fluorescence is irradiated against ultraviolet irradiation under certain conditions. It was shown that
- Copper CuSO 4 aqueous solution and (+)-Sodium L-ascorbate (hereinafter referred to as “SA”) were purchased from Sigma-Aldrich.
- Nucleic acid Sonicated SalmonSperm DNA (hereinafter referred to as “ssDNA”) purchased from BioDynamics laboratory Inc. (Tokyo, Japan) was used.
- ssDNA Sonicated SalmonSperm DNA
- oligo DNA a custom oligo purchased from Invitrogen was used.
- NanoDrop 3300 (Thermo Fisher Scientific, Inc., Waltham, MA, USA) or F-4500 type spectrofluorometer (Hitachi High-Technologies Corporation) was used.
- a UV LED light source was used as excitation light for NanoDrop3300, and the fluorescence spectrum when excited with excitation light was measured.
- RFU Relative Fluorescence Units
- a quartz capillary and a dedicated adapter cell manufactured by HelixBiomedical Accessories, Inc. were used for the F-4500 spectrofluorometer. Unless otherwise noted below, NanoDrop3300 was used.
- Absorption spectrometer Absorption spectrum was measured using NanoDrop 1000 Spectrophotometer. Sample preparation and fluorescence measurement: Sodium chloride (250 mM), CuSO 4 (0-4 mM), SA (4, 50 mM), ssDNA (1 mg / ml) or oligo DNA (50, 250, 500 ⁇ M) in 50 mM HEPPSO buffer Mix to make 20 ⁇ l of sample. SA is known to have a function of reducing Cu (II) ions generated from CuSO 4 to Cu (I) ions in a mixed solution (see Non-Patent Document 33).
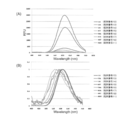
- FIG. 5 and FIG. 6 show fluorescence spectra obtained for the oligo DNA under conditions of a CuSO 4 concentration of 0.4 mM and an SA concentration of 4 mM.
- the oligo DNA concentrations were 50, 50, 250, and 500 ⁇ M for 20, 10, 6, and 3 base lengths, respectively.
- FIG. 5 shows the results of oligo DNAs having the base sequences described in SEQ ID NOs: 1 to 6.
- the horizontal axis indicates the wavelength
- the vertical axis in (A) indicates the RFU value at each wavelength
- the vertical axis in (B) indicates the value obtained by dividing the RFU value at each wavelength by the maximum value of RFU.
- T (20) shows the result of the oligo DNA consisting of the base sequence described in SEQ ID NO: 2 (hereinafter referred to as T (20)), the oligo DNA consisting of the base sequence described in SEQ ID NO: 10 (T (6) ) Result (B), result of oligo DNA (T (3)) comprising the base sequence described in SEQ ID NO: 12 (C), oligo DNA comprising the base sequence described in SEQ ID NO: 11 (A (3))
- a result (D) is shown.
- the horizontal axis indicates the wavelength, and the vertical axis indicates the RFU value at each wavelength.
- FIGS. 7 shows the fluorescence spectrum with the vertical axis as the RFU value (absolute value)
- the middle part shows the fluorescence spectrum with the vertical axis as the RFU value (relative value)
- the lower part shows the absorption spectrum.
- FIG. 8 shows changes with time in peak RFU values (A) and changes with time in absorbance at a wavelength of 346 nm (B).
- the fluorescence almost disappeared after 30 minutes in all the oligo DNAs of T (20), T (6), and T (3).
- the disappearance of fluorescence was fast.
- 1.8 ⁇ l of 44 mM S.A. solution was added again to the sample, and the measurement was performed.
- fluorescence could be detected again. From this, it was considered that the disappearance of fluorescence was caused by oxidation of Cu (I) ions to Cu (II) ions.
- a new peak appeared on the short wavelength side as the peak intensity decreased.
- FIGS. 9A to 9C show the two-dimensional fluorescence spectra obtained with the F-4500 spectrofluorometer for the oligo DNAs of T (20), T (6), and T (3), respectively.
- FIG. 10 shows an excitation spectrum (broken line) and a fluorescence spectrum (solid line) for each oligo DNA. The spectrum was measured at 1 nm intervals for the fluorescence wavelength and at 2 nm intervals for the excitation wavelength.
- the fluorescence spectrum pattern varies depending on the base length of the oligo DNA. Also, the excitation spectrum was confirmed to have different patterns depending on the base length.
- FIG. 11 shows the wavelength
- the vertical axis of (A) is the RFU value at each wavelength measured by Nanodrop
- the vertical axis of (B) is the value obtained by dividing the RFU value at each wavelength by the maximum value of RFU.
- FIG. 12 shows average values and standard errors obtained by measuring the maximum value and peak wavelength of RFU three times.
- FIG. 13 shows the result of the same measurement performed on the oligo DNA having the sequences described in SEQ ID NO: 19 and SEQ ID NO: 20.
- the oligo DNA consisting of the sequence described in SEQ ID NO: 20 containing uracil (U) although the fluorescence intensity is weak compared to the oligo DNA consisting of the sequence described in SEQ ID NO: 19 containing only thymine (T), It was confirmed to emit fluorescence having a similar spectral shape and peak position.
- Example 2 shows that when an aqueous solution containing nucleic acid is brought into contact with solid copper, orange fluorescence similar to that observed in Example 1 is emitted for ultraviolet irradiation under certain conditions. It was.
- RNA Rat Brain Total RNA (Cat. No. 636622, Takara Bio Inc., Otsu, Japan) was used, which was treated with DEPC treated water (Cat. No. 312-90201 / Wako Pure Chemical Industries, Ltd., What was dissolved in Japan) was used.
- PIPES, ACES, BES, TAPSO, HEPPSO, EPPS, TAPS, CAPS, TES, Tricine, and POPSO were purchased from DOJINDO Laboratories (Kumamoto, Japan), and the pH was adjusted according to the protocol provided by the manufacturer. .
- the other reagents were the same as in Example 1.
- Nucleic acid and copper were contacted by mixing various nucleic acids, salts, and copper powder in an aqueous solution of a total amount of 40 microliters and stirring for 15 minutes.
- the amount of added copper powder was 375 mg per 1 ml of the aqueous solution unless otherwise specified.
- the amount of salt was 500 mM sodium chloride (NaCl) unless otherwise specified.
- the sample was centrifuged to precipitate copper powder, and then the fluorescence spectrum and intensity of the supernatant were measured. The measurement of the fluorescence spectrum and the intensity was performed in the same procedure as in Example 1.
- FIG. 14 shows the results of fluorescence measurement performed three times on the reaction solution to which 1.5 mg / ml ssDNA was added (horizontal axis: wavelength, vertical axis: RFU). As shown in the figure, when a sample containing nucleic acid was brought into contact with solid copper and then UV-excited, fluorescence having a peak at around 600 nm was detected from the sample.
- FIG. 15 shows the result of the round.
- the fluorescence intensity was dependent on the amount of copper powder. In the Cu powder used in this example, clear fluorescence was observed if the amount was 37.5 mg / ml or more. On the other hand, no clear fluorescence was observed at 12.5 mg / ml or less.
- FIG. (A) shows the intensity of the fluorescence detected in the reaction solution to which sodium chloride (NaCl) having a concentration of 0.5, 0.25, 0.1, 0.05, 0.025, or 0M was added.
- (B) shows the intensity of fluorescence detected in the reaction solution to which 0.45M sodium chloride (NaCl), 0.45M potassium chloride (KCl), 0.45M magnesium chloride (MgCl2) and 45% ethanol (EtOH) were added.
- the fluorescence intensity indicates RFU at 604 nm, and the average and standard error of the results of three measurements each are shown. As shown in the figure, the fluorescence intensity was dependent on the sodium chloride concentration. In addition to sodium chloride, fluorescence was also detected when potassium chloride or magnesium chloride coexisted.
- FIG. 17 shows the result of comparing the fluorescence intensities detected when the nucleic acid concentration added to the reaction solution is changed.
- A shows the intensity of fluorescence detected by adding 5, 2.5, 1, 0.5, 0.25, 0.1, 0.05, 0 mg / ml ssDNA to the reaction solution.
- B shows the intensity of fluorescence detected by adding 2.5, 0.25, or 0 mg / ml of RNA to the reaction solution.
- the horizontal axis represents the nucleic acid concentration, and the vertical axis represents RFU at a fluorescence wavelength of 604 nm. The measurement was performed three times.
- the sodium chloride (NaCl) concentration was 0.25 M, and the amount of copper powder was 200 mg per 1 ml.
- FIG. 19 shows the result of measuring the fluorescence spectrum (slit width 2.5 nm) at 400 nm to 700 nm when irradiated with excitation light of 360 nm (slit width 10 nm).
- T thymine
- A adenine
- FIG. 20 shows the result of measuring the excitation-fluorescence spectrum by scanning the excitation light at 330 nm to 390 nm (slit width 3 nm) and 400 nm to 700 nm (slit width 2.5 nm).
- (A) shows a three-dimensional display
- (B) shows a contour line display.
- the axis EX represents the excitation wavelength (nm)
- the axis EM represents the fluorescence wavelength (nm)
- the height direction represents the fluorescence intensity. From these results, it was possible to read that the spectrum and intensity of excitation and fluorescence change depending on the DNA base sequence.
- Double-stranded DNA includes oligo DNA consisting of the sequence shown in SEQ ID NO: 1 and oligo DNA consisting of the sequence shown in SEQ ID NO: 2 ((e) + (f)), oligo DNA consisting of the sequence shown in SEQ ID NO: 5. And a mixture of oligo DNA consisting of the sequence shown in SEQ ID NO: 2 ((d) + (f)), and a mixture of oligo DNA consisting of the sequence shown in SEQ ID NO: 1 and oligo DNA consisting of the sequence shown in SEQ ID NO: 6 ((e ) + (C)).
- the vertical axis of (A) shows the RFU value measured by Nanodrop
- the vertical axis of (B) shows the RFU value as a relative value with the peak height being 1.
- the horizontal axis indicates the wavelength (nm).
- the fluorescence intensity of double-stranded DNA was lower than that of single-stranded DNA, but strong fluorescence was confirmed with double-stranded DNA containing a mismatch in thymine (T).
- FIG. 1 shows the relative value of the peak RFU value under each buffer condition in the sample containing ssDNA (+) and the sample not containing nucleic acid ( ⁇ ).
- B shows the relative value of the peak RFU value under the same conditions in the sample containing the oligo DNA consisting of the sequence shown in SEQ ID NO: 1.
- C shows the relative value of the peak RFU value under the same conditions in the sample containing the oligo DNA consisting of the sequence shown in SEQ ID NO: 2.
- the concentration of each buffer was 50 mM, the final concentration of ssDNA was 0.5 mg / ml, and the final concentration of oligo DNA was 25 mM.
- the relative value of the peak RFU value represents a relative value where the peak RFU value measured under a condition not including a buffer is 1. The fluorescence intensity was dependent on the type of buffer. In addition, when no nucleic acid was present in any buffer, almost no fluorescence was detected.
- the binding to the complementary sequence may be an inhibitory factor for the formation of the phosphor due to the binding of nucleic acid to copper.
- the increase in fluorescence intensity at the mismatch site was considered to be applicable to a method for detecting mutations contained in the nucleic acid base sequence.
- Example 3 it was confirmed that the fluorescence could be detected after contacting the nucleic acid with copper sputtered on the glass surface, and the characteristics of the fluorescence were analyzed.
- RNA described in Example 2 was used as the RNA.
- Copper sputtering on the glass surface was performed using a SH-350 from ULVAC, Inc. (Kanagawa, Tokyo) and Cu Target, 99.99% (Kojundo Chemical Laboratory Co., Ltd, Saitama, Japan). .
- the sputtering thickness was 40 nm, and an appropriate sputtering time was determined based on the deposition rate measured in advance.
- As the silver sputtered glass one produced by Kyodo International, Inc., Kanagawa, Japan was used.
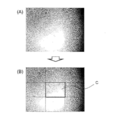
- FIG. 24 shows an image taken after a sample containing 5 mg / ml DNA and 0.5 M NaCl was allowed to stand on copper sputtered glass for 5 minutes.
- FIG. 25 shows an image taken after a sample containing 5 mg / ml RNA and 0.5 M NaCl was allowed to stand on a copper sputtered glass for 5 minutes.
- FIG. 24A when a sample containing DNA was used, smooth fluorescence was observed from the entire imaging region.
- FIGS. 25A and 25B when a sample containing RNA was used, a specific pattern of fluorescence spreading in a wavy manner in the imaging region was observed. The pattern peculiar to this RNA was presumed to be caused by the fact that single-stranded RNAs hybridized with each other to form a higher-order structure.
- the fluorescence intensity in the imaging region was quantified.
- the image is divided into nine parts, and the average of the fluorescence intensities within the measurement range is set with the region of 1/9 section (reference numeral C in the figure) in the center as the measurement range.
- the value was calculated.
- arbitrary 5 places on a slide were image
- FIG. 26 shows the fluorescence intensity obtained when a sample containing DNA or RNA is brought into contact with copper or silver sputtered on glass.
- “DNA / Cu”, “RNA / Cu”, and “(-) / Cu” are Cu sputtering for samples containing 5 mg / ml DNA, samples containing 5 mg / ml RNA, and samples not containing nucleic acid, respectively. It is the result of measuring the fluorescence intensity on glass.
- “DNA / Ag”, “RNA / Ag”, and “(-) / Ag” are the fluorescence intensities on the Ag sputtered glass for samples containing 5 mg / ml DNA, 5 mg / ml RNA and nucleic acid, respectively It is the result of having measured.
- Each sample contained 0.5 M NaCl.
- the exposure time was set to 1 second. The other exposure time was 5 seconds.
- the fluorescence intensity gradually increased within a few minutes after the introduction of the sample, and reached a maximum value in about 3 minutes.
- the fluorescence intensity gradually decreased for the first 50 seconds. This was thought to be due to fluorescent fading. In the next 50 seconds, the disappearance of fluorescence was observed at a rate clearly different from the fluorescence fading. After removing the heat block and returning to room temperature, the fluorescence gradually recovered. Furthermore, after 900 seconds, the fluorescence intensity returned to the level obtained by subtracting the fluorescence intensity for the fading from the original fluorescence intensity. From these results, it was shown that the fluorescence emitted from the nucleic acid in contact with copper is sensitive to heat, and the fluorescence disappears reversibly when the temperature rises.
- Example 4 it was shown that fluorescence observation of cell nuclei was possible by introducing a sample containing cells onto copper sputtered glass.
- a commercially available onion thin skin was carefully peeled off using tweezers, immersed in distilled water and rinsed.
- An onion thin skin was placed on a Cu sputtered glass and covered with a cover glass from the top in a state immersed in PBS for observation.
- IMMUNO-TROL Cells Cat. No. 6607077, Beckman Coulter, Inc., Fullerton, CA, USA treated with the following procedure was used.
- IMMUNO-TROL cells 500 microliters of IMMUNO-TROL cells were separated and washed with PBS, and the cells were precipitated with a centrifuge (1200 rpm, 5 min). Thereafter, the supernatant was discarded, the pellet was loosened, and a sample obtained by repeating the aqueous blood treatment twice was diluted in PBS to prepare a leukocyte sample.
- the pellet obtained as a result of the centrifugation is thoroughly loosened, 9 ml of deionized water is added and mixed by inverting for 30 seconds, and further 1 ml of 10x PBS Buffer (Nippon Gene Co., Ltd., Tokyo, Japan) was added and stirred well, and the cells were precipitated by centrifugation (1200 rpm, 5 min) and the supernatant was removed.
- the leukocyte sample was spread on a Cu sputtered glass and covered with a cover glass from above and observed.
- Example 3 The same copper sputter glass, cover glass, and microscope as those in Example 3 were used.
- the thickness of the sputtering was 20, 40 or 100 nm. In the following experiments, 40 nm was used unless otherwise specified.
- a sputtering process was performed with the polyimide tape attached to the surface of the slide glass except for a region of 5 mm square in the center. Then, by removing the polyimide tape, a Cu sputtered glass in which a Cu layer was formed only in a central 5 mm square region was created.
- an excitation filter 365/10 nm
- a dichroic mirror 400 nm
- a fluorescence filter 590LP
- a filter set UV-1A (Ex: 365/10, ⁇ ⁇ ⁇ DM: 400, BA: 400 / Nikon) was used for fluorescence observation of leukocyte samples and Jurkat cells.
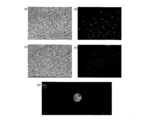
- FIG. 29 shows an image obtained by fluorescence observation of onion thin skin on copper sputtered glass.
- A And (b) shows the observation image on Cu sputtered glass,
- (c) And (d) shows the observation image on the slide glass which has not sputtered Cu.
- (a) and (c) are bright-field observation images, and
- (b) and (d) are fluorescence images. Note that (a) to (d) are images captured using a 10 ⁇ objective lens, and (e) are images captured using a 40 ⁇ objective lens.
- FIG. 30 shows an image obtained by fluorescence observation of a human leukocyte sample on copper sputtered glass.
- (a) is a bright field observation image
- (b) is a fluorescence image.
- a 40 ⁇ objective lens was used.
- FIG. 31 shows an image observed using Cu sputtered glass obtained by sputtering Cu on only a part of the slide glass surface.
- Jurkat cells a human leukocyte cell line
- the image was taken at the boundary between the Cu laminated region and the Cu non-laminated region of the Cu sputtered glass.
- (A) and (c) are bright-field observation images, and the black region occupying the majority in the image is a region through which light is not transmitted because the Cu layer is formed.
- (B) and (d) are fluorescent images.
- FIG. 32 shows the results of observation of Jurkat cells using Cu sputtered glass on which a Cu layer having a thickness of 20 nm (a) or 100 nm (b) was formed. Fluorescence from the cell nucleus was confirmed at any thickness.
- the nucleic acid detection method according to the present invention is, for example, a microchip It was considered preferable to perform in an environment where contact with air was limited.
- Example 5 using the cell nucleus observation substrate according to the present invention, cells labeled with a magnetic substance-labeled antibody were selected and concentrated with a magnet, and a nuclear fluorescence stained image was observed.
- Substrate Micro Slide Glass (Matsunami, Japan) and Gap cover glass (Matsunami, Japan) was used, and BEMCOT, M-3 (Asahi Kasei Corp., Japan) sandwiched between one end of the Gap cover glass as an absorbing member was used.
- BEMCOT M-3 (Asahi Kasei Corp., Japan) sandwiched between one end of the Gap cover glass as an absorbing member was used.
- a copper slide of 40 nm was used on the surface of the Micro SlideGlass.
- Magnetic substance-labeled antibody MACS CD45 MicroBeads (hereinafter referred to as “MACS-CD45”) was obtained from Miltenyi Biotech GmbH (Germany).
- EasySep Human CD45 Depletion Cocktail (hereinafter referred to as “EasySep-CD45”) was obtained from StemCell Technologies, Inc. (Canada). Note that EasySep-CD45 has stronger magnetism than MACS-CD45.
- Cells Jurkat cells were used. Cells were added to 5 ⁇ l of EasySep-CD45 or 10 ⁇ l of MACS-CD45 to 200 ⁇ l of the sample adjusted to 1.75 ⁇ 10 7 cells / mL, and incubated for 15 minutes. For the EasySep-CD45 sample, 10 ⁇ l of EasySep magnet reagent was further added and incubated for 10 minutes. In experiments using copper sputter, cells were washed twice with PBS after incubation.
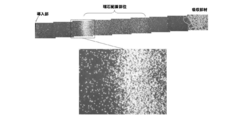
- FIG. 33 shows EasySep-CD45-labeled cells accumulated in the observation region of the substrate
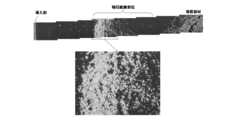
- FIG. 34 shows a photograph of MACS-CD45-labeled cells.
- the introduction part into which the sample liquid is introduced is located in the left direction
- the absorption member that absorbs the sample liquid is located in the right direction
- the observation area where the magnet is arranged is located in the center.
- the photograph was taken after removing the magnet. It is confirmed that the cells labeled with EasySep-CD45 and MACS-CD45 are accumulated in the observation region corresponding to the magnet placement site by the magnet.
- the lower part of the figure shows an enlarged photograph of a part of the observation region (introduction part side).
- FIG. 35 shows a transmission image (A) obtained by photographing MACS-CD45 labeled cells accumulated in the observation region of the copper-sputtered substrate and a fluorescence image (B) obtained by irradiating light in the ultraviolet wavelength region.
- A a transmission image obtained by photographing MACS-CD45 labeled cells accumulated in the observation region of the copper-sputtered substrate
- B a fluorescence image obtained by irradiating light in the ultraviolet wavelength region.
- the nuclei of the accumulated cells exhibit fluorescence, and the nuclear morphology is clearly observed.
- nuclei such as cells and microorganisms can be dyed by simple operations to perform morphology observation. Therefore, the cell nucleus observation substrate and the like according to the present invention are effectively used in various fields such as medicine, drug discovery, food, agriculture and the like to determine the types and properties of cells and microorganisms based on the form of cell nuclei. obtain.
- A Cell nucleus observation substrate, 1: introduction part, 2: observation region, 3: copper film, 4: absorption member, 5: magnet, 6: discharge part, a 1 , a 2 : substrate layer, a 3 : spacer
Landscapes
- Health & Medical Sciences (AREA)
- Life Sciences & Earth Sciences (AREA)
- Physics & Mathematics (AREA)
- Immunology (AREA)
- Chemical & Material Sciences (AREA)
- General Physics & Mathematics (AREA)
- Pathology (AREA)
- Analytical Chemistry (AREA)
- Biochemistry (AREA)
- General Health & Medical Sciences (AREA)
- Biomedical Technology (AREA)
- Engineering & Computer Science (AREA)
- Molecular Biology (AREA)
- Nuclear Medicine, Radiotherapy & Molecular Imaging (AREA)
- Chemical Kinetics & Catalysis (AREA)
- Optics & Photonics (AREA)
- Investigating, Analyzing Materials By Fluorescence Or Luminescence (AREA)
- Measuring Or Testing Involving Enzymes Or Micro-Organisms (AREA)
- Apparatus Associated With Microorganisms And Enzymes (AREA)
- Investigating Or Analysing Biological Materials (AREA)
Abstract
【課題】細胞や微生物等の核を簡単な操作で染色し、形態観察を行うための技術の提供。 【解決手段】細胞を含むサンプル液が導入される導入部1と、導入部1から導入されたサ ンプル液中の細胞が収容される観察領域2と、が形成され、導入部1と観察領域2とを含 むサンプル液の通流経路上に、サンプル液に対して接触可能に銅3が配置されている細胞 核観察基板Aを提供する。細胞核観察基板Aでは、導入部1から導入されたサンプル液中 の細胞は、銅3との接触によって核酸が蛍光を発する状態となって観察領域2へ収容され る。従って、細胞核観察基板Aでは、観察領域2において、核が蛍光染色された状態で細 胞を観察することができる。
Description
本発明は、細胞核観察基板及び細胞核観察装置に関する。より詳しくは、細胞の核を蛍光染色して形態観察を行うための細胞核観察基板等に関する。
従来、細胞や微生物等の細胞核を顕微鏡等を用いて観察し、核の形態に基づいて細胞や微生物の種類や性状を判定することが行われている。核の形態観察を容易にするため、観察に先立って、核への染色性を示す色素を用い、細胞や微生物等を染色することが行われている。
例えば、非特許文献1,2には、赤血球をギムザ染色し、細胞内に感染したマラリア原虫を観察するための技術が記載されている。非特許文献1,2に記載される装置によれば、血液中のマラリア原虫が感染した赤血球を磁石を用いて集積させることで、簡便かつ迅速にマラリア診断を行うことが可能とされている。
核染色のために用いられる色素としては、例えば、上記のギムザ染色にも用いられる青色の色素であるメチレンブルーや、青紫色の色素であるヘマトキシリンなどが古くから用いられている。また、近年では、核酸に結合性を有する蛍光色素を用いて、核を蛍光染色することも行われている。蛍光色素としては、例えば、Hoechst、DAPIなどが挙げられる。
本発明に関連して、蛍光観察の際に細胞が示す自家蛍光として、従来知られている蛍光について説明する。このような蛍光の一つに、銅の存在下においてUV照射された細胞が示すオレンジ色の自家蛍光がある。例えば、ショウジョウバエ幼虫中腸の特定部分の細胞が、銅を投与するとオレンジ色の蛍光を発することが報告されている(非特許文献3~11参照)。ショウジョウバエ幼虫中腸においてこのオレンジ色の蛍光が特に強く観察される細胞は、「copper cell」などと呼ばれている。投与する銅の濃度を高くすると、copper cellの周辺の細胞(非特許文献6)および幼虫の体壁全体(非特許文献4)でも、蛍光が観察されることが報告されている。
上記のオレンジ色の蛍光は、細胞内において、細胞質と細胞核の両方で観察され、特に細胞質の顆粒で顕著に検出されると記述されている(非特許文献4~6,9参照)。蛍光の波長範囲は590-630nmであり、ピーク波長は610nm、最大励起波長は340nmと記載されている(非特許文献5)。
また、ショウジョウバエ以外の生物種についても、同様な性質をもつ自家蛍光が観察されている。例えば、ラットの実験では、銅を与えた個体の肝臓において、UV励起(励起波長310nm)によってオレンジ色の蛍光(ピーク波長605nm)が見られることが報告されている(非特許文献11参照)。さらに、加齢に伴って腎臓および肝臓に銅を蓄積するモデルラットの腎臓においても、類似の蛍光が観察されたことが報告されている(非特許文献12参照)。同様な性質をもつ自家蛍光は、酵母(非特許文献13参照)や、ヒトのWilson病患者の肝細胞(非特許文献14参照)においても報告されている。なお、Wilson病は、銅の排泄機能が不全となり、肝細胞内に銅が蓄積する遺伝性疾患である。
上記のオレンジ色の蛍光を発光する蛍光体としては、銅とmetallothionein (MT)との複合体(以下、「Cu-MT」と略記する)が推定されている(非特許文献16~25参照)。Cu-MTの波長特性は、非特許文献15では励起波長305nm、蛍光波長565nmとされ、非特許文献19では励起波長310nm、蛍光波長570nmとされている。また、Cu-MTにおいて銅は、一価イオン(Cu(I))の状態で存在していると考えられている(非特許文献15,17,19,21,25参照)。
このような銅を含む蛍光体には、ピリミジンまたはメルカプチドなどを含む化合物であって、ピリミジンまたはメルカプチドが銅と作用することにより蛍光が発せられる化合物が広く報告されている(非特許文献26~31参照)。
一方、各種金属イオンと核酸との相互作用について、古くから研究がなされている。例えば、銅一価イオンと核酸との相互作用については、細胞核中に微量に含まれる銅が、核酸構造を安定化する一方、過酸化水素との共存下においてDNAにダメージを与えることが知られている(非特許文献32参照)。また、銅との相互作用により、DNAの吸収スペクトルが変化することが報告されている(非特許文献32,33参照)。さらに、この吸収スペクトルの変化が、DNAの塩基配列(具体的にはGCペアのポリマーとATペアのポリマー)に応じて異なることなども報告されている(非特許文献32参照)。
"Diagnosis of malaria by magnetic deposition microscopy." Am. J. Trop. Med. Hyg., 2006, Vol.74, No.4, p. 568-572
"Enhanced detection of gametocytes by magnetic deposition microscopy predicts higher potential for Plasmodium falciparum transmission." Malaria Journal, 2008, 7, 66
Physiological genetic studies on copper metabolism in the genus Drosophila. (1950) Genetics 35, 684-685
Organization and function of the inorganic constituents of nuclei. (1952) Exp. Cell Res., Suppl. 2:161-179
Ultrastructure of the copper- accumulating region of the Drosophila larval midgut. (1971) Tissue Cell. 3, 77-102
Specification of a single cell type by a Drosophila homeoticgene. (1994) Cell. 76, 689-702
Two different thresholds of wingless signalling with distinct developmental consequences in the Drosophila midgut. (1995) EMBO J. 14, 5016-5026.
Calcium-activated potassium channel gene expression in the midgut of Drosophila. (1997) Comp. Biochem. Physiol. B Biochem. Mol. Biol. 118, 411-420
Evidence that a copper- metallothionein complex is responsible for fluorescence in acid-secreting cells of the Drosophila stomach. (2001) Cell Tissue Res. 304, 383-389
Peptidergic paracrine and endocrine cells in the midgut ofthe fruit fly maggot. (2009) Cell Tissue Res. 336, 309-323
A luminescence probe for metallothionein in liver tissue:emission intensity measured directly from copper metallothionein induced in ratliver. (1989) FEBS Lett. 257, 283-286
Direct visualization of copper- metallothionein in LEC ratkidneys: application of autofluorescence signal of copper-thiolate cluster. (1996) J. Histochem. Cytochem. 44, 865-873
Incorporation of copper into the yeast Saccharomyces cerevisiae. Identification of Cu(I)--metallothionein in intact yeast cells. (1997) J.Inorg. Biochem. 66, 231-240
Portmann B. Image of the month. Copper- metallothionein autofluorescence. (2009) Hepatology. 50, 1312-1313
Luminescence properties of Neurospora copper metallothionein. (1981) FEBS Lett. 127, 201-203
Copper transfer between Neurospora copper metallothioneinand type 3 copper apoproteins. (1982) FEBS Lett.142, 219-222
Spectroscopic studies on Neurospora copper metallothionein. (1983) Biochemistry. 22, 2043-2048
Metal substitution of Neurospora copper metallothionein. (1984) Biochemistry. 23, 3422-3427
(Cu,Zn)-metallothioneins from fetal bovine liver. Chemicaland spectroscopic properties. (1985) J. Biol. Chem. 260, 10032-10038
Primary structure and spectroscopic studies of Neurosporacopper metallothionein. (1986) Environ. Health Perspect. 65, 21-27
Characterization of the copper-thiolate cluster in yeast metallothionein and two truncated mutants. (1988) J. Biol. Chem. 263, 6688-6694
Luminescence emission from Neurospora copper metallothionein. Time-resolved studies. (1989) Biochem J. 260, 189-193
Establishment of the metal-to-cysteine connectivities in silver-substituted yeast metallothionein (1991) J. Am. Chem. Soc. 113, 9354-9358
Copper- and silver-substituted yeast metallothioneins: Sequential proton NMR assignments reflecting conformational heterogeneity at the Cterminus. (1993) Biochemistry. 32, 6773-6787
Luminescence decay from copper(I) complexes of metallothionein. (1998) Inorg. Chim. Acta. 153, 115-118
Solution Luminescence of Metal Complexes. (1970) Appl. Spectrosc. 24, 319 - 326
Fluorescence of Cu, Au and Ag mercaptides. (1971) Photochem. Photobiol. 13, 279-281
Luminescence of the copper--carbon monoxide complex of Neurospora tyrosinase. (1980) FEBS Lett. 111, 232-234
Luminescence of carbon monoxide hemocyanins. (1980) Proc.Natl. Acad. Sci. U.S.A. 77, 2387-2389
Photophysical properties of hexanuclear copper(I) and silver(I) clusters. (1992) Inorg. Chem., 31, 1941-1945
Photochemical and photophysical properties of tetranuclearand hexanuclear clusters of metals with d10 and s2 electronic configurations. (1993) Acc. Chem. Res. 26, 220-226
Interaction of copper(I) with nucleic acids. (1990) Int. J. Radiat. Biol. 58, 215- 234
Copper(I)-Catalyzed Regioselective "Ligation" of Azidesand Terminal Alkynes. (2002) Ang. Chem. Int. Ed. 41, 2596-2599
従来の色素を用いた核染色による細胞核観察方法では、細胞や微生物等の固定処理や、色素溶液への浸漬と洗浄の繰り返し工程、乾燥工程などが必要となるため、手間や時間がかかり、作業にも習熟を要していた。
そこで、本発明は、細胞や微生物等の核を簡単な操作で染色し、形態観察を行うための技術を提供することを主な目的とする。
本発明者らは、銅と接触した核酸が紫外波長域の光の照射によって蛍光を発するようになることを見出し、この知見を応用して本発明に係る細胞核観察基板等を案出した。
すなわち、上記課題解決のため、本発明は、細胞を含むサンプル液が導入される導入部と、該導入部から導入されたサンプル液中の細胞が収容される観察領域と、が形成され、前記導入部と前記観察領域とを含むサンプル液の通流経路上に、サンプル液に対して接触可能に銅が配置されている細胞核観察基板を提供する。
この細胞核観察基板では、導入部から導入されたサンプル液中の細胞は、銅との接触によって核酸が蛍光を発する状態となって観察領域へ収容される。従って、この細胞核観察基板では、観察領域において、核が蛍光染色された状態で細胞を観察することができる。
この細胞核観察基板において、前記銅は、前記通流経路上に製膜されて配置されていることが好ましい。
この細胞核観察基板は、前記観察領域内に磁場を形成する着脱可能な磁石を備え、前記通流経路を通流するサンプル液中の細胞を磁力に基づいて前記観察領域内に保持する構成とできる。また、この細胞核観察基板は、前記観察領域が、所定距離をおいて対向する2枚の基板層間の間隙に構成され、該間隙へのサンプル液の導入部と、該導入部から前記間隙に導入されたサンプル液を吸水する吸収部材と、を備え、前記導入部と前記吸収部材との間に対応する位置に前記磁石が取り付けられる構成とできる。
すなわち、上記課題解決のため、本発明は、細胞を含むサンプル液が導入される導入部と、該導入部から導入されたサンプル液中の細胞が収容される観察領域と、が形成され、前記導入部と前記観察領域とを含むサンプル液の通流経路上に、サンプル液に対して接触可能に銅が配置されている細胞核観察基板を提供する。
この細胞核観察基板では、導入部から導入されたサンプル液中の細胞は、銅との接触によって核酸が蛍光を発する状態となって観察領域へ収容される。従って、この細胞核観察基板では、観察領域において、核が蛍光染色された状態で細胞を観察することができる。
この細胞核観察基板において、前記銅は、前記通流経路上に製膜されて配置されていることが好ましい。
この細胞核観察基板は、前記観察領域内に磁場を形成する着脱可能な磁石を備え、前記通流経路を通流するサンプル液中の細胞を磁力に基づいて前記観察領域内に保持する構成とできる。また、この細胞核観察基板は、前記観察領域が、所定距離をおいて対向する2枚の基板層間の間隙に構成され、該間隙へのサンプル液の導入部と、該導入部から前記間隙に導入されたサンプル液を吸水する吸収部材と、を備え、前記導入部と前記吸収部材との間に対応する位置に前記磁石が取り付けられる構成とできる。
また、本発明は、細胞を含むサンプル液が導入される導入部と、該導入部から導入されたサンプル液中の細胞が収容される観察領域と、が形成され、前記導入部と前記観察領域とを含むサンプル液の通流経路上に、サンプル液に対して接触可能に銅が配置されている基板と、前記観察領域に光を照射し、発生する蛍光を検出する光学検出手段と、を備える細胞核観察装置を提供する。
この細胞核観察装置では、導入部から導入されたサンプル液中の細胞は、銅との接触によって核酸が蛍光を発する状態となって観察領域へ収容される。従って、この細胞核観察装置では、観察領域に光を照射し、発生する蛍光を検出することで、細胞の核蛍光染色像を観察することができる。
この細胞核観察装置において、前記光学検出手段が照射する光の波長が300~420nmとされる。
この細胞核観察装置では、導入部から導入されたサンプル液中の細胞は、銅との接触によって核酸が蛍光を発する状態となって観察領域へ収容される。従って、この細胞核観察装置では、観察領域に光を照射し、発生する蛍光を検出することで、細胞の核蛍光染色像を観察することができる。
この細胞核観察装置において、前記光学検出手段が照射する光の波長が300~420nmとされる。
本発明により、細胞や微生物等の核を簡単な操作で染色し、形態観察を行うための技術が提供される。
以下、本発明を実施するための好適な形態について図面を参照しながら説明する。なお、以下に説明する実施形態は、本発明の代表的な実施形態の一例を示したものであり、これにより本発明の範囲が狭く解釈されることはない。説明は以下の順序で行う。
1.細胞核観察基板
(1)第一実施形態
(2)第二実施形態
2.細胞核観察装置
1.細胞核観察基板
(1)第一実施形態
(2)第二実施形態
2.細胞核観察装置
1.細胞核観察基板
(1)第一実施形態
図1は、本発明の第一実施形態に係る細胞核観察基板の構成を説明する模式図である。(A)は上面図、(B)は(A)中P-P断面に対応する断面図、(C)は(A)中Q-Q断面に対応する断面図を示す。
(1)第一実施形態
図1は、本発明の第一実施形態に係る細胞核観察基板の構成を説明する模式図である。(A)は上面図、(B)は(A)中P-P断面に対応する断面図、(C)は(A)中Q-Q断面に対応する断面図を示す。
図中、符号Aで示す細胞核観察基板は、基板層a1と基板層a2とを含んで構成されており、基板層a1と基板層a2とはスペーサa3を挟んで所定距離の間隙を形成して対向している。この間隙の厚みは特に限定されないが、数マイクロメートルから数百マイクロメートル程度、より好的には10~50マイクロメートル程度が望ましい。基板層a1と基板層a2との間隙の一部には、細胞の観察のための場となる観察領域2が構成されている。
基板層a1と基板層a2とが形成する間隙は、スペーサa3によって一部が閉鎖され、残りの部分は開放されて外部に連絡されている。具体的には、基板層a1と基板層a2とが形成する間隙は、図(A)中、上下の2辺がスペーサa3によって閉鎖され、左右の2辺は開放されて外部に連絡されている。基板層a1と基板層a2との間隙の開放部分の一部(図(A)中、左辺)は、間隙に構成された観察領域2へのサンプル液の導入部1とされている。また、導入部1と反対側の間隙の開放部分の一部(同、右辺)には、導入部1から間隙に導入されたサンプル液を吸水する吸収部材4が、基板層a1と基板層a2との間に挿入されて配置されている。導入部1から導入されたサンプル液が毛細管現象によって基板層a1と基板層a2との間隙を移動し、吸収部材4によって吸水されることにより、サンプル液に含まれる細胞が観察領域2に収容される。
サンプル液には、塩化ナトリウム(NaCl)や塩化カリウム(KCl)、塩化マグネシウム(MgCl2)などの塩を含有する緩衝液を用いることが好ましい(後述する実施例2参照)。塩は1種類又は2種類以上含有されていてよく、その濃度は特に限定されないが、0.025M以上に設定されることが好ましい。また、サンプル液に用いる緩衝液は、Cu(II)イオンに対するキレート剤を含まないことが望ましい(実施例2参照)。また、サンプル液には、細胞に対するダメージを低減する目的からは、塩濃度が生理組織や細胞とほぼ等張となるように調整された緩衝液(例えば、生理食塩水)を用いることが望ましい。さらに、緩衝液として、リン酸バッファーを用いた、リン酸バッファー生理食塩水(PBS)を用いることもできる(実施例2参照)。
吸収部材4は、サンプル液を吸水可能な材料であれば特に限定されず、例えば、ろ紙や吸水繊維、吸水樹脂などとできる。
基板層a2の基板層a1に対向する面には、銅膜3が製膜されている。導入部1から導入されたサンプル液中の細胞は、銅膜3あるいは銅膜3からサンプル液中に溶出した銅と接触しながら基板層a1と基板層a2との間隙を移動する。この際、銅との接触によって細胞核内の核酸は、紫外波長域の光の照射によって蛍光を発する状態となる。
銅膜3の製膜は、従来公知の手法を用いた基板表面へのスパッタリングや蒸着により行うことができる。銅膜3の製膜厚は、特に限定されないが、数nm~数十nm、好適には20~40nm程度とされる。この範囲の製膜厚では銅膜3は光透過性を有するので、観察領域2に収容された細胞に光を照射して細胞の核蛍光染色像を観察する際に、銅膜3を透過させて光の照射あるいは蛍光の検出を行うことが可能となる。なお、光の照射及び蛍光の検出は、落射式光学系を用いることにより、ともに銅膜3とは反対側の面から行うこともできる。この場合、銅膜3は光透過性を有さなくてもよい。
図中、符号5は、観察領域2内に磁場を形成するための磁石を示す。磁石5は、基板層a1の観察領域2との反対面上に近接して配置される。磁石5は着脱可能に配置されたものでもよく、基板層a1と基板層a2のどちらの側に配置しても構わない。磁石5は、導入部1から導入され、毛細管現象によって基板層a1と基板層a2との間隙を移動するサンプル液中の細胞を、観察領域2内に形成した磁場の磁力に基づいて観察領域2内に選別・濃縮し、それを保持する。これにより、磁性体に吸着する細胞のみを観察領域2内に集積させることができる。
磁石5は、観察領域2内に磁場を形成できる材料であれば特に限定されず、例えば、ネオジウム磁石やサマリウムゴバルト磁石、フェライト磁石などとできる。また、磁石5の配置位置も、観察領域2内に磁場を形成できる限りにおいて特に限定されず、基板層a1あるいは基板層a2内に埋設される構成であってもよい。なお、本発明に係る細胞核観察基板において、磁石5は必須の構成とはならないものとする。
観察領域2内に集積された細胞は、銅との接触によって細胞核内の核酸が紫外波長域の光照射によって蛍光を発する状態とされている。そのため、観察領域2に紫外波長域の光を照射し、発生する蛍光を検出することで、細胞の核蛍光染色像を観察することができる。
照射する光の波長は、好適には300~420nmとされる。観察領域2へ照射される光及び細胞核から発生する蛍光を透過させるため基板層a1及び基板層a2の材料には、光透過性を有し、自家蛍光が少なく、波長分散が小さいために光学誤差の少ない材料を選択することが好ましい。基板層a1及び基板層a2の材料は、ガラスや各種プラスチック(ポリプロピレン、ポリカーボネート、シクロオレフィンポリマー、ポリジメチルシロキサンなど)が採用できる。また、磁石5によって、観察領域2へ照射される光及び細胞核から発生する蛍光が遮断されることを防止するため、核蛍光染色像の観察時には、基板層a1上に配置した磁石5を取り外すようにすることもできる。あるいは落射式光学系を用いて、磁石の反対側の面から光の照射および蛍光の観察を行うことも可能である。
以上のように、細胞核観察基板Aでは、導入部1から導入したサンプル液中の細胞のうち磁性を有するものを観察領域2内に集積させ、さらに銅膜3に接触させることで核酸が蛍光を発する状態とし、細胞の核蛍光染色像を観察することができる。従って、細胞核観察基板Aでは、ギムザ染色などの従来の色素を用いた核染色による細胞核観察方法で必要であった細胞や微生物等の固定処理や、色素溶液への浸漬と洗浄の繰り返し工程、乾燥工程などを不要として、簡単な操作で細胞の核を蛍光染色して形態観察を行うことが可能である。
特に、細胞核観察基板Aでは、磁石5により細胞を観察領域2内に集積させて観察を行うことができるため、磁性を有する細胞の核観察に適する。磁性を有する細胞としては、例えば、磁性体標識抗体で標識した細胞や、上述の非特許文献1,2に記載される赤血球に感染したマラリア原虫細胞などが挙げられる。
細胞核観察基板Aにおいて、特定の細胞集団を磁性体標識抗体により標識した細胞を含むサンプル液を用いれば、磁石5と磁性体標識抗体との磁気的作用に基づき、特定の細胞集団のみを観察領域2内に集積させることができる。従って、血液標本中の白血球のみを濃縮して核を観察でき、核形状による白血病の診断に利用したり、好酸球数によるアレルギーの診断に利用することができる。なお、特定の細胞集団の標識は、特定の細胞表面抗原に対し特異的に結合する磁性体標識抗体を用いて行い得る。なお、導入部1と観察領域2との間に抗体標識領域を設け、該抗体標識領域において磁性体標識抗体と細胞とを混合することも可能である。
また、マラリア原虫が感染した赤血球では、ヘモゾインと呼ばれる磁性体が形成されることが知られている。細胞核観察基板Aにおいて、サンプル液としてマラリア患者から採取した血液標本を用いれば、磁石5とヘモゾインとの磁気的作用に基づき、マラリア原虫が感染した赤血球のみを観察領域2内に集積させることができる。従って、血液標本中のマラリア原虫感染赤血球を濃縮してマラリア原虫の核を観察でき、核形状によるマラリア感染の有無やマラリア原虫の種類の判定を容易に精度高く行うことが可能となる。また、この際、細胞核観察基板Aでは、従来のギムザ染色によるマラリア診断と異なり、固定処理や染色工程や乾燥工程などを行うことなく、核の蛍光染色像を観察して判定を行うことが可能である。
なお、マラリア原虫の種類には、熱帯熱マラリア原虫、三日熱マラリア原虫、四日熱マラリア原虫、卵形マラリア原虫などが知られている。さらに、虫体の増殖ステージとして輪状体(ring form)、栄養体(trophozoite)、分裂体(schizont)、生殖母体(gametocyte)などが知られている。原虫の種類と増殖ステージを適切に鑑別することは、感染患者の治療方針を適切に行うためには非常に重要である。
上述した細胞核観察基板Aでは、銅膜3を、基板層a2の基板層a1に対向する面に製膜する場合を例に説明した。細胞核観察基板Aにおいて、銅膜3は、導入部1と観察領域2とを含むサンプル液の通流経路上のいずれかの箇所に、サンプル液に対して接触可能に製膜されていればよく、例えば基板層a1面の一部あるいは全部に製膜されていてもよい。また、本発明に係る細胞核観察基板において、銅は、膜としてのみでなく、粉末や微粒子、ワイヤ、板、箔などとして配置されていてもよい。さらに、本発明に係る細胞核観察基板において、銅は、基板保存時の安定性の観点から固形状態の銅であることが好ましいが、溶液状態の銅も除外されない。溶液の状態の銅を用いる場合には、溶解したCuイオンを二価陽イオンから一価陽イオンへ還元された状態に維持するための還元剤を混合して用いることが好ましい。還元剤には、例えば後述するアスコルビン酸ナトリウム(実施例1参照)を用いることができる。なお、本発明において、「銅」という用語には、銅金属あるいは銅を組成に含む銅合金が包含されるものとする。
(2)第二実施形態
図2は、本発明の第二実施形態に係る細胞核観察基板の構成を説明する模式図である。(A)は上面図、(B)は(A)中P-P断面に対応する断面図を示す。
図2は、本発明の第二実施形態に係る細胞核観察基板の構成を説明する模式図である。(A)は上面図、(B)は(A)中P-P断面に対応する断面図を示す。
図中、符号Bで示す細胞核観察基板は、基板層a1と基板層a2とが貼り合わされて構成されている。基板層a1には、サンプル液が導入される導入部1と、サンプル液が排出される排出部6とが形成されている。基板層a2には、導入部1から導入されたサンプル液が通流する流路が形成されている。この流路の一部には、細胞の観察のための場となる観察領域2が構成されている。
導入部1と排出部6には図示しない送液手段が接続されており、導入部1から導入されたサンプル液は流路内を通流し、排出部6から排出される。送液手段は、汎用のポンプやチューブ、サンプル液タンク、廃液タンクなどによって構成される。なお、送液手段として、遠心力や重力を利用してサンプル液の導入及び送液、排出を行う構成を採用してもよい。
基板層a2に形成された流路の表面には、銅膜3が製膜されている。銅膜3は、流路表面全体に製膜されていてもよく、図に示すように観察領域2よりもサンプル液の送流方向上流の流路表面の一部に製膜されていてもよい。また、銅膜3は基板層a1上であってもよい。導入部1から流路内に導入されたサンプル液中の細胞は、銅膜3あるいは銅膜3からサンプル液中に溶出した銅と接触し、観察領域2まで送流される。この際、銅との接触によって細胞核内の核酸は、紫外波長域の光の照射によって蛍光を発する状態となる。
銅膜3の製膜は、従来公知の手法を用いた基板表面へのスパッタリングや蒸着により行うことができる。銅膜3の製膜厚は、特に限定されないが、数nm~数十nm、好適には20~40nm程度とされる。この範囲の製膜厚では銅膜3は光透過性を有するので、観察領域2に収容された細胞に光を照射して細胞の核蛍光染色像を観察する際に、銅膜3を透過させて光の照射あるいは蛍光の検出を行うことが可能となる。
図中、符号5は、観察領域2内に磁場を形成するための磁石を示す。磁石5は、基板層a1の観察領域2との反対面上に着脱可能に配置される。磁石5は、導入部1から導入され、流路内を送液されるサンプル液中の細胞を、観察領域2内に形成した磁場の磁力に基づいて観察領域2内に保持する。これにより、磁石5は、銅との接触によって核酸が蛍光を発する状態とされた細胞を観察領域2内に集積させる。なお、磁石5の材料は第一実施形態に係る細胞核観察基板Aと同様であるので、ここでは説明を割愛する。
本実施形態に係る細胞核観察基板においても、磁石5は必須の構成とはならないものとする。観察領域2内に細胞を集積さえるための構成として、磁石5に替えて、観察領域2の流路表面に、通流するサンプル液中の細胞を捕捉するための物質(例えば、特定の細胞を捕捉するための細胞膜抗原に対する抗体)を固相化しておくこともできる。あるいは、磁石5に替えて、観察領域2内に電場を形成するための電極を配置し、電気的な力に基づいて細胞を観察領域2内に保持してもよい。
観察領域2内に集積された細胞は、銅との接触によって細胞核内の核酸が紫外波長域の光照射によって蛍光を発する状態とされている。そのため、観察領域2に紫外波長域の光を照射し、発生する蛍光を検出することで、細胞の核蛍光染色像を観察することができる。
照射する光の波長は、好適には300~420nmとされる。観察領域2へ照射される光及び細胞核から発生する蛍光を透過させるため、基板層a1及び基板層a2の材料には、光透過性を有し、自家蛍光が少なく、波長分散が小さいために光学誤差の少ない材料を選択することが好ましい。基板層a1及び基板層a2の材料は、ガラスや各種プラスチック(ポリプロピレン、ポリカーボネート、シクロオレフィンポリマー、ポリジメチルシロキサンなど)が採用できる。また、磁石5によって、観察領域2へ照射される光及び細胞核から発生する蛍光が遮断されることを防止するため、核蛍光染色像の観察時には、基板層a1上に配置した磁石5を取り外すようにすることもできる。あるいは落射式光学系を用いて、磁石の反対側の面から光の照射および蛍光の観察を行うことも可能である。
以上のように、細胞核観察基板Bでは、導入部1から導入したサンプル液中の細胞を銅膜3に接触させ、核酸が蛍光を発する状態として観察領域2内に集積させて、細胞の核蛍光染色像を観察することができる。従って、細胞核観察基板Bでは、ギムザ染色など従来の色素を用いた核染色による細胞核観察方法で必要であった細胞や微生物等の固定処理や、色素溶液への浸漬と洗浄の繰り返し工程、乾燥工程などを不要として、簡単な操作で細胞の核を蛍光染色して形態観察を行うことが可能である。
2.細胞核観察装置
本発明に係る細胞核観察装置は、上述した細胞核観察基板と、基板の観察領域に光を照射し、発生する蛍光を検出する光学検出手段と、を備えることにより、細胞の核蛍光染色像を観察可能な装置である。この細胞核観察装置は、従来公知の蛍光顕微鏡を適宜改変したものとでき、光学検出手段として以下のような構成を有する。
本発明に係る細胞核観察装置は、上述した細胞核観察基板と、基板の観察領域に光を照射し、発生する蛍光を検出する光学検出手段と、を備えることにより、細胞の核蛍光染色像を観察可能な装置である。この細胞核観察装置は、従来公知の蛍光顕微鏡を適宜改変したものとでき、光学検出手段として以下のような構成を有する。
観察領域に照射される光は、波長300~420nmの紫外領域とされることが好適である。光源には、レーザー、LED等を用いることができ、中心波長が360nm程度のUV-LEDが好適に採用される。光源からの光は、必要に応じて光学フィルタやミラー、レンズ等によって構成される光学経路により観察領域に導光される。
観察領域から発生する蛍光は、フォトディテクター、フォトダイオード、フォトマルチプライヤー、CCDカメラ、CMOSカメラなどの光検出器によって検出され、画像表示装置に表示される。あるいは、観察領域から発生する蛍光を、接眼レンズ等を介して肉眼により観察する構成も採用され得る。観察領域から発生する蛍光は、必要に応じて光学フィルタやミラー、レンズ等によって構成される光学経路により光検出器あるいは接眼レンズに導光される。光学フィルタには、銅と接触した核酸から発生する蛍光の波長域である600nm程度の光(後述する実施例1参照)に対して選択性を有するものが用いられる。
実施例1では、Cu(II)イオンをアスコルビン酸で還元することでCu(I)イオンを発生させた溶液中に核酸を混合すると、一定の条件下にて紫外線照射に対してオレンジ色の蛍光が発せられることを示した。
<材料と方法>
銅:CuSO4水溶液と(+)-Sodium L-ascorbate(以下、「S.A.」と表記する)は、Sigma-Aldrichより購入した。
核酸:BioDynamics laboratory Inc. (Tokyo, Japan)より購入したSonicated SalmonSperm DNA(以下、「ssDNA」と表記する)を用いた。また、オリゴDNAには、Invitrogen社より購入したカスタムオリゴを用いた。
緩衝液(バッファー):DOJINDO Laboratories(Kumamoto, Japan)より購入したHEPPSOを、メーカー提供のプロトコルに準じてpH8.5に調製して用いた。
蛍光測定器:NanoDrop 3300(Thermo Fisher Scientific, Inc., Waltham, MA, USA)またはF-4500形分光蛍光光度計(株式会社日立ハイテクノロジーズ)を用いた。NanoDrop3300の励起光にはUV LED光源を用い、励起光で励起した際の蛍光スペクトルを計測した。付属のソフトウェアを用いて、スペクトル強度が最大となる波長でのRelative Fluorescence Units(RFU)をピークRFU値として取得した。F-4500形分光蛍光光度計には、HelixBiomedical Accessories, Inc.社製の石英キャピラリーと専用アダプターセルを使用した。なお以下で特に断りがない場合は、NanoDrop3300を使用した。
吸光測定器:NanoDrop 1000 Spectrophotometerを用いて吸収スペクトルを計測した。
サンプル調製と蛍光測定:50mMのHEPPSOバッファーに、塩化ナトリウム(250mM)、CuSO4(0~4mM)、S.A.(4, 50mM)、ssDNA(1mg/ml)あるいはオリゴDNA(50, 250, 500μM)を混合してサンプル20μlとした。なお、S.A.は混合液中においてCuSO4から生じるCu(II)イオンをCu(I)イオンに還元する作用を有することが知られている(非特許文献33参照)。
銅:CuSO4水溶液と(+)-Sodium L-ascorbate(以下、「S.A.」と表記する)は、Sigma-Aldrichより購入した。
核酸:BioDynamics laboratory Inc. (Tokyo, Japan)より購入したSonicated SalmonSperm DNA(以下、「ssDNA」と表記する)を用いた。また、オリゴDNAには、Invitrogen社より購入したカスタムオリゴを用いた。
緩衝液(バッファー):DOJINDO Laboratories(Kumamoto, Japan)より購入したHEPPSOを、メーカー提供のプロトコルに準じてpH8.5に調製して用いた。
蛍光測定器:NanoDrop 3300(Thermo Fisher Scientific, Inc., Waltham, MA, USA)またはF-4500形分光蛍光光度計(株式会社日立ハイテクノロジーズ)を用いた。NanoDrop3300の励起光にはUV LED光源を用い、励起光で励起した際の蛍光スペクトルを計測した。付属のソフトウェアを用いて、スペクトル強度が最大となる波長でのRelative Fluorescence Units(RFU)をピークRFU値として取得した。F-4500形分光蛍光光度計には、HelixBiomedical Accessories, Inc.社製の石英キャピラリーと専用アダプターセルを使用した。なお以下で特に断りがない場合は、NanoDrop3300を使用した。
吸光測定器:NanoDrop 1000 Spectrophotometerを用いて吸収スペクトルを計測した。
サンプル調製と蛍光測定:50mMのHEPPSOバッファーに、塩化ナトリウム(250mM)、CuSO4(0~4mM)、S.A.(4, 50mM)、ssDNA(1mg/ml)あるいはオリゴDNA(50, 250, 500μM)を混合してサンプル20μlとした。なお、S.A.は混合液中においてCuSO4から生じるCu(II)イオンをCu(I)イオンに還元する作用を有することが知られている(非特許文献33参照)。
<結果>
ssDNAについて、S.A.濃度50mMの条件下でCuSO4の濃度を変化させて取得された蛍光スペクトルおよびRFU値を、図3および図4にそれぞれ示す。(A)は蛍光スペクトルを示し、(B)はピークRFU値を示す。
ssDNAについて、S.A.濃度50mMの条件下でCuSO4の濃度を変化させて取得された蛍光スペクトルおよびRFU値を、図3および図4にそれぞれ示す。(A)は蛍光スペクトルを示し、(B)はピークRFU値を示す。
オリゴDNAについて、CuSO4濃度0.4mM、S.A.濃度4mMの条件下で取得された蛍光スペクトルを、図5および図6に示す。オリゴDNA濃度は、20, 10, 6, 3塩基長のものについてそれぞれ50, 50, 250, 500μM, とした。図5は、配列番号1~6に記載の塩基配列からなるオリゴDNAの結果を示す。横軸は波長を示し、(A)の縦軸は各波長でのRFU値、(B)の縦軸は各波長でのRFU値をRFUの最大値で除した値を示す。図6は、配列番号2に記載の塩基配列からなるオリゴDNA(以下、T(20)と表記する)の結果(A)、配列番号10に記載の塩基配列からなるオリゴDNA(T(6))の結果(B)、配列番号12に記載の塩基配列からなるオリゴDNA(T(3))の結果(C)、配列番号11に記載の塩基配列からなるオリゴDNA(A(3))の結果(D)を示す。横軸は波長を示し、縦軸は各波長でのRFU値を示す。
図に示されるように、核酸の塩基配列に依存して蛍光スペクトルのパターン(ピーク波長や強度)が変化していることが確認された。
次に、T(20)、T(6)、T(3)のオリゴDNAについて、CuSO4濃度0.4mM、S.A.濃度4mMの条件下で蛍光スペクトルおよび吸収スペクトルの経時変化を測定した。S.A.の添加は、初回の蛍光スペクトルおよび吸収スペクトルの測定直前に行い、その後、8, 14, 24, 35分後に蛍光スペクトルあるいは吸収スペクトルの測定を行った。結果を図7および図8に示す。図7上段は縦軸をRFU値(絶対値)とした蛍光スペクトル、中段は縦軸をRFU値(相対値)とした蛍光スペクトル、下段は吸収スペクトルを示す。図8は、ピークRFU値の経時変化(A)と、波長346nmにおける吸光度の経時変化(B)を示す。
図に示されるように、T(20)、T(6)、T(3)の全てのオリゴDNAで、30分を経過後、蛍光がほとんど消失した。特に、塩基長が短いオリゴDNAでは、蛍光の消失が早かった。35分後の蛍光スペクトルの測定直後に、サンプルに44mMのS.A.溶液を1.8μl再添加し測定を行ったところ、蛍光を再度検出できた。このことから、蛍光の消失は、Cu(I)イオンのCu(II)イオンへの酸化によるものと考えられた。なお、T(6)およびT(3)のオリゴDNAの蛍光スペクトルでは、ピーク強度の減少とともに、短波長側に新たなピークの出現がみられた。
一方、各オリゴDNAの吸光スペクトルについても経時的にピーク強度の減少が認められた。吸光スペクトルの減衰は、蛍光スペクトルの減衰に比して緩徐であった。
T(20)、T(6)、T(3)のオリゴDNAについて、F-4500形分光蛍光光度計で取得した2次元蛍光スペクトルを、それぞれ図9(A)~(C)に示す。また、図10に、各オリゴDNAでの励起スペクトル(破線)と蛍光スペクトル(実線)を示す。スペクトルの測定は、蛍光波長については1nm間隔、励起波長については2nm間隔で行った。
図に示されるように、オリゴDNAの塩基長に依存して蛍光スペクトルのパターンが異なることが確認される。また、励起スペクトルについても、塩基長に依存してパターンが異なっていることが確認された。
塩基配列とスペクトルとの関係をさらに調べるため、配列番号11~18に記載する、アデニン(A)およびチミン(T)の組み合わせによってなる3塩基長の配列からなるオリゴDNAについて、蛍光の計測実験を行った。結果を、図11および図12に示す。図11の横軸は波長を示し、(A)の縦軸はNanodropで計測した各波長でのRFU値、(B)の縦軸は各波長でのRFU値をRFUの最大値で除した値を示す。図12には、RFUの最大値およびピーク波長を3回計測して得た平均値および標準誤差を示す。
図に示されるように、オリゴDNAの塩基配列によって蛍光の強度やピーク波長が変化することが確認された。
配列番号19および配列番号20に記載する配列からなるオリゴDNAについて同様の計測を行った結果を、図13に示す。ウラシル(U)を含む配列番号20に記載する配列からなるオリゴDNAでは、チミン(T)のみを含む配列番号19に記載する配列からなるオリゴDNAと比較して、蛍光強度が微弱であるものの、類似のスペクトル形状およびピーク位置の蛍光を発することが確認された。
<考察>
本実施例では、CuSO4とS.A.を混合した、塩化ナトリウムを含むHEPPSOバッファー溶液中にDNAを混合すると、紫外線照射によって波長500nm~700nm程度のオレンジ色の蛍光が観察されることを示した。また、蛍光の強度はCuSO4濃度に依存し、蛍光強度およびスペクトルは核酸の塩基配列による影響も受けることが確認された。
本実施例では、CuSO4とS.A.を混合した、塩化ナトリウムを含むHEPPSOバッファー溶液中にDNAを混合すると、紫外線照射によって波長500nm~700nm程度のオレンジ色の蛍光が観察されることを示した。また、蛍光の強度はCuSO4濃度に依存し、蛍光強度およびスペクトルは核酸の塩基配列による影響も受けることが確認された。
蛍光は少なくともチミン(T)、アデニン(A)もしくはウラシル(U)を含むオリゴDNAより確認された。また、チミン(T)とアデニン(A)よりなる3塩基長のオリゴDNAを用いた実験からは、いずれの配列からも蛍光は観察され、しかもその蛍光強度およびスペクトルには、チミン(T)ないしアデニン(A)の量のみでなく、それらのオリゴDNA上における位置(配列順序)も影響することが示された。
また、S.A.添加後に時間が経過すると、蛍光強度は経時的に減衰したが、これはS.A.再添加により回復した。ところでCu(I)イオンは酸素存在下では非常に不安定で、S.A.による還元の効果が消えると速やかにCu(II)や固形の銅に変化する。このことから、蛍光は、Cu(I)イオンと核酸との複合体から発生するものであると考えられた。また、銅と核酸との作用による蛍光を検出するためには、反応溶液と空気中の酸素との接触を極力避けることが望ましいと考えられた。
実施例2では、核酸を含む水溶液と固体の銅とを接触させると、一定条件の下で紫外線照射に対し、実施例1で観察されたのと同様のオレンジ色の蛍光が発せられることを示した。
<方法と材料>
核酸に接触させる銅として、和光純薬工業株式会社製の銅粉末(Copper, Powder, -75um, 99.9% / Cat.No.030-18352 / Wako Pure Chemical Industries, Ltd., Osaka, Japan)を用いた。
RNAとしては、Rat Brain Total RNA (Cat.No.636622, Takara Bio Inc., Otsu, Japan)を使用し、これをDEPC treated water (Cat.No.312-90201/Wako Pure Chemical Industries, Ltd., Japan)に溶解したものを用いた。
PIPES, ACES, BES, TAPSO, HEPPSO, EPPS, TAPS, CAPS, TES, TricineおよびPOPSOはDOJINDO Laboratories(Kumamoto, Japan)より購入したものを用い、メーカー提供のプロトコルに準じてpHを調整して用いた。その他の試薬は実施例1と同じものを用いた。
核酸に接触させる銅として、和光純薬工業株式会社製の銅粉末(Copper, Powder, -75um, 99.9% / Cat.No.030-18352 / Wako Pure Chemical Industries, Ltd., Osaka, Japan)を用いた。
RNAとしては、Rat Brain Total RNA (Cat.No.636622, Takara Bio Inc., Otsu, Japan)を使用し、これをDEPC treated water (Cat.No.312-90201/Wako Pure Chemical Industries, Ltd., Japan)に溶解したものを用いた。
PIPES, ACES, BES, TAPSO, HEPPSO, EPPS, TAPS, CAPS, TES, TricineおよびPOPSOはDOJINDO Laboratories(Kumamoto, Japan)より購入したものを用い、メーカー提供のプロトコルに準じてpHを調整して用いた。その他の試薬は実施例1と同じものを用いた。
核酸と銅との接触は、総量40マイクロリットルの水溶液中に、各種の核酸、塩、および銅粉末を混合し、15分間攪拌することにより行った。加えた銅粉末の量は、特に断りがない限り水溶液1mlに対して375mgとした。また塩の量は、特に断りがなければ500mMの塩化ナトリウム(NaCl)とした。
サンプルを遠心機にかけて銅粉末を沈殿させた後、その上清について蛍光のスペクトルと強度の計測を行った。蛍光スペクトルと強度の測定は、実施例1と同様の手順で行った。
<結果>
1.5 mg/mlのssDNAを加えた反応溶液について、蛍光測定を3回行った結果を図14に示す(横軸:波長、縦軸:RFU)。図に示されるように、核酸を含むサンプルを固形の銅と接触させた後にUV励起すると、サンプルから600nm付近をピークとする蛍光が検出できた。
1.5 mg/mlのssDNAを加えた反応溶液について、蛍光測定を3回行った結果を図14に示す(横軸:波長、縦軸:RFU)。図に示されるように、核酸を含むサンプルを固形の銅と接触させた後にUV励起すると、サンプルから600nm付近をピークとする蛍光が検出できた。
次に、銅粉末の量を反応液1mLに対して375mg、250mg、125 mg、62.5 mg、37.5 mg、12.5 mgおよび0 mgとした反応溶液に1.5 mg/mlのssDNAを加え、蛍光測定を3回行った結果を図15に示す。図に示されるように、蛍光強度は、銅粉末の量に依存した。本実施例で用いたCu粉末では、37.5 mg/ml以上の量があれば明白な蛍光が観察された。一方、12.5 mg/ml以下では明白な蛍光は確認されなかった。
続いて、反応溶液中の塩の種類および濃度を変更し、1.5 mg/mlのssDNAを加えた場合に検出される蛍光強度を比較した。結果を図16に示す。(A)は濃度0.5、0.25、0.1、0.05、0.025、0Mの塩化ナトリウム(NaCl)を添加した反応溶液で検出された蛍光の強度を示す。(B)は0.45M塩化ナトリウム(NaCl)、0.45M塩化カリウム(KCl)、0.45M塩化マグネシウム(MgCl2)および45%エタノール(EtOH)を添加した反応溶液で検出された蛍光の強度を示す。蛍光強度は604nmにおけるRFUを示し、各々3回ずつ測定を行った結果の平均および標準誤差を図示した。図に示されるように、蛍光強度は、塩化ナトリウム濃度に依存した。また、塩化ナトリウムのほか、塩化カリウムや塩化マグネシウムを共存させた場合においても、蛍光が検出された。
図17には、反応溶液に添加する核酸濃度を変化させた場合に検出される蛍光強度を比較した結果を示す。(A)は、反応液中に5、2.5、1、0.5、0.25、0.1、0.05、0 mg/mlのssDNAを加えて検出された蛍光の強度を示す。(B)は、反応液中に2.5、0.25、0 mg/mlのRNA加えて検出された蛍光の強度を示す。横軸は核酸濃度を示し、縦軸は蛍光波長604nmにおけるRFUを示す。計測は3回行った。なお、塩化ナトリウム(NaCl)濃度は0.25M、銅粉末の量は1mlに対して200mgの割合とし、以下の実験でも特に断りがなければこの条件を用いた。図に示されるように、蛍光強度は、DNA濃度およびRNA濃度に依存した。
次に、配列番号1,2,5,6,9に記載する、異なる配列よりなるオリゴDNAを0.1mM添加した反応溶液について蛍光測定を行った。結果を図18に示す。(A)の縦軸はNanodropで計測したRFU値、(B)の縦軸はピーク高さを1とした相対値でのRFU値を示す。図に示されるように、蛍光強度およびピーク波長は、塩基配列の影響を受けた。特にチミン(T)の割合が高いと蛍光強度が強く、ピーク波長が長めになる傾向があることが確認できた。
配列番号1,2,5,6に記載する配列よりなるオリゴDNAを添加した反応溶液については、F-4500形分光蛍光光度計を用いた計測も行った。図19は、360nm(スリット幅10nm)の励起光を照射した際の、400nm~700nmにおける蛍光スペクトル(スリット幅2.5nm)を計測した結果である。ここでも、チミン(T)およびアデニン(A)の組み合わせによりなる配列では、チミン(T)の割合が高いと蛍光強度が強く、ピーク波長が長めになる傾向があることが確認できた。図20は、励起光を330nm~390nm(スリット幅3nm)および400nm~700nm(スリット幅2.5nm)でスキャンして励起-蛍光スペクトルを計測した結果である。(A)は3次元表示、(B)は等高線表示を示す。軸EXは励起波長(nm)、軸EMは蛍光波長(nm)を示し、高さ方向が蛍光強度を示す。これらの結果から、DNAの塩基配列の違いによって励起および蛍光のスペクトルおよび強度が変化することを読み取ることができた。
塩基配列とスペクトルとの関係をさらに調べるため、配列番号21~26に記載する、8塩基のシトシン(C)と12塩基のチミン(T)の組み合わせ配列からなるオリゴDNAについて、蛍光の計測実験を行った。結果を図21に示す。図に示されるように、オリゴDNAの塩基組成が同じであっても配列が異なる場合、蛍光強度が異なった。
次に、ミスマッチを含む二本鎖のDNAについて、蛍光スペクトルのパターンを計測する実験を行った。二本鎖DNAには、配列番号1に示す配列からなるオリゴDNAと配列番号2に示す配列からなるオリゴDNAの混合物((e)+(f))、配列番号5に示す配列からなるオリゴDNAと配列番号2に示す配列からなるオリゴDNAの混合物((d)+(f))、および配列番号1に示す配列からなるオリゴDNAと配列番号6に示す配列からなるオリゴDNAの混合物((e)+(c))、の3種類を用いた。いずれのオリゴDNAも、最終濃度0.5 mg/mlで混合した。結果を図22に示す。(A)の縦軸はNanodropで計測したRFU値を示し、(B)の縦軸はピーク高さを1とした相対値でのRFU値を示す。横軸は波長(nm)を示す。図に示されるように、二本鎖DNAでは一本鎖と比較すると蛍光強度は低くなっているが、チミン(T)にミスマッチが入った二本鎖DNAで強い蛍光が確認された。
反応溶液のバッファーの種類およびpHを変更した場合に検出される蛍光強度を比較した。結果を図23に示す。(A)は、ssDNAを含むサンプル(+)および核酸を含まないサンプル(-)における、各バッファー条件下でのピークRFU値の相対値を示す。(B)は、配列番号1に示す配列からなるオリゴDNAを含むサンプルにおける同条件下でのピークRFU値の相対値を示す。(C)は配列番号2に示す配列からなるオリゴDNAを含むサンプルにおける同条件下でのピークRFU値の相対値を示す。各バッファーの濃度は50mMとし、ssDNAの終濃度は0.5 mg/ml 、オリゴDNAの終濃度は25mMとした。なお、ピークRFU値の相対値とは、バッファーを含まない条件下で計測したピークRFU値を1とした相対値を表す。蛍光強度は、バッファーの種類に依存した。また、いずれのバッファーにおいても核酸が存在しない場合には蛍光はほとんど検出されなかった。
<考察>
本実施例の結果から、核酸を固形の銅粉末と接触させた場合にも、適切な塩濃度などの条件下において、核酸をCu(I)イオンと接触させた場合と同様に、蛍光を検出できることが示された。イオンによる場合と固形の銅による場合では、波長特性や配列依存性などの性質がほぼ同一であることから、これらで観察されている蛍光は同じメカニズムによるものと考えられた。また、核酸としてRNAを用いても蛍光が観察された。さらに、二本鎖DNAにおいては、特にチミン(T)にミスマッチが存在している場合に強い蛍光が観察された。このことから、相補配列との結合は、核酸の銅との結合による蛍光体の形成に対して阻害要因となる可能性が示唆された。また、ミスマッチ部位での蛍光強度の上昇は、核酸の塩基配列に含まれる変異を検出する方法への応用が可能と考えられた。
本実施例の結果から、核酸を固形の銅粉末と接触させた場合にも、適切な塩濃度などの条件下において、核酸をCu(I)イオンと接触させた場合と同様に、蛍光を検出できることが示された。イオンによる場合と固形の銅による場合では、波長特性や配列依存性などの性質がほぼ同一であることから、これらで観察されている蛍光は同じメカニズムによるものと考えられた。また、核酸としてRNAを用いても蛍光が観察された。さらに、二本鎖DNAにおいては、特にチミン(T)にミスマッチが存在している場合に強い蛍光が観察された。このことから、相補配列との結合は、核酸の銅との結合による蛍光体の形成に対して阻害要因となる可能性が示唆された。また、ミスマッチ部位での蛍光強度の上昇は、核酸の塩基配列に含まれる変異を検出する方法への応用が可能と考えられた。
また、各種バッファー条件での蛍光を比較した実験では、PIPES, BES, HEPPSO, EPPS,TAPS, CAPS, TES, POPSOのバッファー中で蛍光が観察され、特にPIPES, HEPPSO, EPPS, POPSOのバッファーで強い蛍光が検出された。蛍光は、pH範囲7.0~10.5の範囲で観察することができた。バッファーの種類とpHに依存した蛍光強度の変化は、核酸の塩基配列に応じて異なるパターンを示すことが見出された。一方、Cu(II)イオンをキレートして安定化する性質を有するバッファーを含む溶液中では蛍光が観察されない傾向が認められ、本実施例中にデータは掲載していないが例えばトリスバッファーや、EDTAなどを含む反応液を用いた場合では、蛍光はほとんど観察されなかった。
実施例3では、ガラス表面にスパッタリングした銅に核酸を接触させた後に蛍光が検出できることを確認し、蛍光の特性を解析した。
<材料と方法>
DNAは実施例1に記載のssDNAを、RNAは実施例2に記載のものを用いた。
ガラス表面への銅スパッタリングは、装置にULVAC, Inc. (Kanagawa, Tokyo)のSH-350を用い、Cu Target, 99.99% (Kojundo Chemical Laboratory Co., Ltd, Saitama, Japan)を装着して実施した。スパッタリングの厚みは40 nmとし、事前に計測した堆積速度をもとに適切なスパッタ時間を定めた。銀スパッタガラスとしては、株式会社協同インターナショナル (Kyodo International, Inc., Kanagawa, Japan)に作製のものを用いた。
DNAは実施例1に記載のssDNAを、RNAは実施例2に記載のものを用いた。
ガラス表面への銅スパッタリングは、装置にULVAC, Inc. (Kanagawa, Tokyo)のSH-350を用い、Cu Target, 99.99% (Kojundo Chemical Laboratory Co., Ltd, Saitama, Japan)を装着して実施した。スパッタリングの厚みは40 nmとし、事前に計測した堆積速度をもとに適切なスパッタ時間を定めた。銀スパッタガラスとしては、株式会社協同インターナショナル (Kyodo International, Inc., Kanagawa, Japan)に作製のものを用いた。
銅ないし銀をスパッタしたスライドガラス、もしくは未処理のスライドガラスに、サンプル溶液をのせて、その上から松浪硝子工業株式会社製のギャップカバーガラス(Gap cover glass, 24x25 No.4 / #CG00024 / Matsunami Glass Ind., Ltd., Osaka, Japan)を被せた。5分程度静置した後、蛍光の観察を行った。観察には、Nikon社製の倒立顕微鏡Ti-U (Nikon Co., Tokyo, Japan)を使用し、蛍光撮影には、フィルタセットUV-1A (Ex: 365/10, DM: 400, BA: 400 / Nikon)を使用した。画像の撮影および記録にはデジタルCCDカメラRetiga 2000R (QImaging, BC, Canada)および20倍の対物レンズを使用した。
<結果>
5 mg/mlのDNAおよび0.5MのNaClを含むサンプルを、銅スパッタガラス上に5分間静置した後に撮影した画像を図24に示す。また、5 mg/mlのRNAおよび0.5MのNaClを含むサンプルを、銅スパッタガラス上に5分間静置した後に撮影した画像を図25に示す。
5 mg/mlのDNAおよび0.5MのNaClを含むサンプルを、銅スパッタガラス上に5分間静置した後に撮影した画像を図24に示す。また、5 mg/mlのRNAおよび0.5MのNaClを含むサンプルを、銅スパッタガラス上に5分間静置した後に撮影した画像を図25に示す。
図24(A)に示すように、DNAを含むサンプルを用いた場合には、撮像領域全体から滑らかな蛍光が観察された。一方、図25(A)および(B)に示すように、RNAを含むサンプルを用いた場合には、撮像領域内に波状に広がる、特有のパターンの蛍光が観察された。このRNAに特有のパターンは、一本鎖のRNAが互いにハイブリダイズして高次構造を形成したことが要因と予想された。
次に、撮像領域内の蛍光強度を数値化した。撮影した各々の画像において、図24(B)に例示ように9分割し、中央部の9分の1区画(図中符号C部分)の領域を計測範囲として、計測範囲内の蛍光強度の平均値を算出した。各サンプルについて、スライド上の任意の5ヶ所を撮影し、各画像から上記平均値を算出した。得られた5つの平均値について、さらに平均と標準偏差を計算した。
DNAあるいはRNAを含むサンプルをガラス上にスパッタリングした銅あるいは銀に接触させた場合に取得された蛍光強度を図26に示す。図中、「DNA/Cu」、「RNA/Cu」、「(-)/Cu」は、それぞれ5 mg/ml DNA含むサンプル、5 mg/ml RNA含むサンプル、核酸を含まないサンプルについて、Cuスパッタガラス上で蛍光強度を計測した結果である。また、「DNA/Ag」、「RNA/Ag」、「(-)/Ag」は、それぞれ5 mg/ml DNA、5 mg/ml RNA、核酸を含まないサンプルについて、Agスパッタガラス上で蛍光強度を計測した結果である。なお、各サンプルには、0.5MのNaClを含有させた。また、「DNA/Cu」は、他と比較して蛍光強度が特に大きいため、露光時間を1秒とした。その他の露光時間は、5秒とした。
図に示されるように、Cuスパッタガラスでは、「(-)/Cu」と比較して「DNA/Cu」および「RNA/Cu」の蛍光強度が高く、特にDNAサンプルにおいて強い蛍光が検出された。一方、Agスパッタガラスでは、「(-)/Ag」と比較して「DNA/Ag」および「RNA/Ag」ともに蛍光強度の上昇を示さなかった。なお、「(-)/Cu」と比較して「(-)/Ag」の方が高い計測値を示しているが、これはAgスパッタ面の反射光または散乱光あるいは自家蛍光に由来するバックグラウンドが原因と考えられた。
次に、核酸と銅との接触時間の経過に伴う蛍光強度の時間的変化を検討した。Cuスパッタガラスとギャップカバーガラスの間に、5 mg/mlのssDNAと0.5MのNaClを含むサンプルを入れた時点を起点とし、所定時間の経過ごとに蛍光強度の計測を行った。撮影は15秒おきに行い、励起光のシャッタは撮影ごとに開閉した。対物レンズは10倍、露光時間は1秒とした。各時間において撮像した画像を1枚ずつ用いて、蛍光強度の計測を行った。結果を図27に示す。
図に示されるように、蛍光強度は、サンプル導入後の数分間で徐々に上昇し、3分程度で最大値に達した。
続いて、核酸と銅とを接触させて所定時間が経過した後、温度を変化させた場合の蛍光強度の変化を計測した。撮影開始直後は室温のままとし、50秒後に65℃に熱したヒートブロックをCuスパッタガラスの上に静かに載せ、100秒後にそのヒートブロックを除去した。撮影は5秒おき行った。計測は150秒後に一度打ち切って励起光のシャッタを閉じた。さらに、900秒後に改めて計測を行った。結果を図28に示す。
図に示されるように、最初の50秒間は、徐々に蛍光強度が減衰した。これは蛍光退色によるものと考えられた。次の50秒間では、蛍光退色とは明らかに異なる速度で蛍光の消失が観察された。ヒートブロックを除去して室温条件下に戻した後は徐々に蛍光が回復した。さらに、900秒後では、当初の蛍光強度から退色分の蛍光強度を差し引いた水準にまで蛍光強度が戻った。これらの結果から、銅と接触した核酸が発する蛍光は、熱に対して感受性であり、温度が上昇すると可逆的に蛍光が消失することが示された。
実施例4では、銅スパッタガラス上に、細胞を含むサンプルを導入することで、細胞核の蛍光観察が可能であることを示した。
<材料と方法>
PBSには、Dulbecco’s Phosphate Buffered Saline, Ca/Mg free (Invitrogen Corporation, CA, USA)を用いた。
タマネギ薄皮の実験では、市販のタマネギの薄皮を、ピンセットを用いて丁寧に剥がして、蒸留水中に浸してすすいで用いた。タマネギの薄皮をCuスパッタガラス上に載せ、PBSに浸した状態で上からカバーガラスを被せて観察した。
ヒト白血球サンプルの実験では、IMMUNO-TROL Cells (Cat.No.6607077, Beckman Coulter, Inc., Fullerton, CA, USA) を次の手順で処理したものを用いた。まず、IMMUNO-TROL Cellsを、500マイクロリットル取り分けてPBSで洗浄し、遠心分離機で細胞を沈殿させた(1200rpm,5min)。その後、上清を捨ててペレットをほぐし、水溶血処理を2回繰り返して得られたサンプルをPBSに希釈し、白血球サンプルを調製した。水溶血処理は、遠心分離の結果得られたペレットを良くほぐした後に、脱イオン水を9ミリリットル添加して30秒間転倒混和し、さらに1ミリリットルの10x PBS Buffer (Nippon Gene Co., Ltd.,Tokyo, Japan)を添加してよく攪拌し、遠心分離 (1200rpm, 5min)で細胞を沈殿させて上清を除去することにより行った。白血球サンプルをCuスパッタガラス上に撒き、上からカバーガラスを被せて観察した。
PBSには、Dulbecco’s Phosphate Buffered Saline, Ca/Mg free (Invitrogen Corporation, CA, USA)を用いた。
タマネギ薄皮の実験では、市販のタマネギの薄皮を、ピンセットを用いて丁寧に剥がして、蒸留水中に浸してすすいで用いた。タマネギの薄皮をCuスパッタガラス上に載せ、PBSに浸した状態で上からカバーガラスを被せて観察した。
ヒト白血球サンプルの実験では、IMMUNO-TROL Cells (Cat.No.6607077, Beckman Coulter, Inc., Fullerton, CA, USA) を次の手順で処理したものを用いた。まず、IMMUNO-TROL Cellsを、500マイクロリットル取り分けてPBSで洗浄し、遠心分離機で細胞を沈殿させた(1200rpm,5min)。その後、上清を捨ててペレットをほぐし、水溶血処理を2回繰り返して得られたサンプルをPBSに希釈し、白血球サンプルを調製した。水溶血処理は、遠心分離の結果得られたペレットを良くほぐした後に、脱イオン水を9ミリリットル添加して30秒間転倒混和し、さらに1ミリリットルの10x PBS Buffer (Nippon Gene Co., Ltd.,Tokyo, Japan)を添加してよく攪拌し、遠心分離 (1200rpm, 5min)で細胞を沈殿させて上清を除去することにより行った。白血球サンプルをCuスパッタガラス上に撒き、上からカバーガラスを被せて観察した。
銅スパッタガラス、カバーガラス及び顕微鏡などは、実施例3と同一のものを用いた。スパッタリングの厚みは、20、40あるいは100 nmとした。以下の実験では特に断りがない場合は40 nmのものを用いた。スライドガラス表面の一部にのみCuをスパッタリングする場合には、まず、スライドガラス表面に、中央部5ミリメートル四方の領域を除いて、ポリイミドテープを貼付した状態でスパッタリング処理を行った。そして、ポリイミドテープを除去することで、中央部5ミリメートル四方の領域のみにCu層が形成されたCuスパッタガラスを作成した。
タマネギ薄皮の蛍光観察には、励起フィルタ:365/10nm、ダイクロイックミラー:400nm、蛍光フィルタ:590LPを使用した。白血球サンプルおよびジャーカット細胞の蛍光観察には、フィルタセットUV-1A (Ex: 365/10, DM: 400, BA: 400 / Nikon)を使用した。
<結果>
図29に、銅スパッタガラス上でタマネギ薄皮を蛍光観察して撮像した画像を示す。(a)および(b)はCuスパッタガラス上での観察像を示し、(c)および(d)はCuをスパッタしていないスライドガラス上での観察像を示す。(a)および(c)は明視野の観察像、(b)および(d)は蛍光像である。なお、(a)~(d)は10倍の対物レンズを用いて撮像した画像であり、(e)は40倍の対物レンズを用いて撮像した画像である。
図29に、銅スパッタガラス上でタマネギ薄皮を蛍光観察して撮像した画像を示す。(a)および(b)はCuスパッタガラス上での観察像を示し、(c)および(d)はCuをスパッタしていないスライドガラス上での観察像を示す。(a)および(c)は明視野の観察像、(b)および(d)は蛍光像である。なお、(a)~(d)は10倍の対物レンズを用いて撮像した画像であり、(e)は40倍の対物レンズを用いて撮像した画像である。
図に示されるように、Cuスパッタガラス上の細胞では、細胞核に特異的な強い蛍光が観察された。なお、一部の細胞壁などからも若干の蛍光が確認されたが、これはCuをスパッタしていないスライドガラス上の細胞でも確認されたことから、細胞壁などの自家蛍光と考えられた。
次に、動物細胞の観察を行った。銅スパッタガラス上でヒト白血球サンプルを蛍光観察して撮像した画像を図30に示す。(a)は明視野の観察像、(b)は蛍光像である。対物レンズには40倍のものを用いた。
蛍光像において、好中球などの白血球に特有な分葉核の形状が明確に確認された。
図31には、スライドガラス表面の一部にのみCuをスパッタリングしたCuスパッタガラスを用いて観察された像を示す。Cuスパッタガラス上に、ヒト白血球細胞株であるジャーカット細胞を撒き、上からカバーガラスを被せて、20倍の対物レンズで観察を行った。画像は、CuスパッタガラスのCu積層領域とCu非積層領域との境界で撮像した。(a)および(c)は明視野の観察像であり、画像中の過半を占める黒い領域は、Cu層が形成されているため光が透過しない領域である。(b)および(d)は蛍光像である。
Cu積層領域に存在する細胞の細胞核のみから強い蛍光が観察された。図32は、厚み20nm(a)あるいは100 nm(b)のCu層を形成したCuスパッタガラスを用いて、ジャーカット細胞の観察を行った結果である。いずれの厚みにおいても細胞核からの蛍光が確認された。
<考察>
本実施例の結果から、細胞核についても銅との接触によって蛍光検出が可能となることが示された。この現象は、銅をスパッタリングしたガラス基板上でのみみられたこと、細胞核と銅との作用による結果であることは明らかである。
本実施例の結果から、細胞核についても銅との接触によって蛍光検出が可能となることが示された。この現象は、銅をスパッタリングしたガラス基板上でのみみられたこと、細胞核と銅との作用による結果であることは明らかである。
また、タマネギ薄皮細胞と白血球細胞の蛍光観察の結果、両者の細胞の細胞核形状の相違を明確に観察できた。このことから、本発明に係る核酸検出方法によれば、細胞の種類ごとに異なる細胞核形状を識別可能であることが示された。
実施例中に図では示さなかったが、スライドガラス表面の一部にのみ銅をスパッタしたスライドガラスを用いた実験において、Cu積層領域に存在する細胞のみから蛍光が観察される様子を確認したのち、スライドガラスを傾けてCu積層領域からCu非積層領域に細胞を移動させたところ、移動後にも引き続き蛍光が観察された。このことから、銅と細胞を接触させる部位と、細胞の蛍光観察を行う部位とを離して設けても、両部位の間にサンプルを移動させる手段を設けることによって蛍光検出が可能であることが判明した。
Cuスパッタガラスとカバーガラスの間に細胞が存在する状態で細胞核からの蛍光を確認した後に、カバーガラスを取り除いて細胞を含む溶液を空気中に暴露すると、蛍光が速やかに消失した。実施例1のCu(II)イオンとS.A.を用いた実験においても、反応溶液が空気に長時間暴露されると蛍光が消失することが見出されている。この蛍光の消失は、空気との接触によってCu(I)イオンが酸化されるためと考察された。従って、サンプル溶液の空気との接触(特に空気中に含まれる酸素への暴露)は、蛍光の発生を阻害する要因となると考えられ、本発明に係る核酸検出方法は、例えばマイクロチップなどの、空気との接触が限定された環境下で行うことが好ましいと考えられた。
実施例5では、本発明に係る細胞核観察基板を用い、磁性体標識抗体で標識した細胞を磁石によって選別・濃縮して、核蛍光染色像の観察を行った。
<材料と方法>
基板:Micro Slide Glass(Matsunami, Japan)とGap cover glass (Matsunami, Japan)
とを圧着し、Gap cover glassの一方の端に吸収部材としてBEMCOT, M-3 (Asahi Kasei Corp., Japan)をはさみ込んだものを用いた。銅スパッタを使用した実験では、Micro SlideGlass表面に銅を40 nmスパッタリングしたものを用いた。
磁性体標識抗体:MACS CD45 MicroBeads (以下、「MACS-CD45」と記載)は、Miltenyi Biotech GmbH (Germany)より入手した。EasySep Human CD45 Depletion Cocktail (以下、「EasySep-CD45」と記載)は、StemCell Technologies, Inc. (Canada)より入手した。なお、EasySep-CD45は、MACS-CD45に比べて、強い磁性を有する。
細胞:Jurkat細胞を用いた。細胞は1.75×10⁷ cells / mLに調整したサンプル200 μlに対し、EasySep-CD45を5 μlもしくはMACS-CD45を10 μl添加し、15分間インキュベートした。EasySep-CD45サンプルについては、さらにEasySep magnet reagentを10 μl添加して10分間インキュベートした。銅スパッタを使用した実験では、インキュベート後に細胞をPBSで二回洗浄した。
磁石による細胞吸着:磁石には、直径5mm、高さ3mmの円柱形のネオジウム磁石を用いた。これをGap cover glass上面に接するように配置し、Gap cover glass下面とスライドグラス表面の間に形成された深さ20マイクロメートルの間隙中に磁性体で標識した細胞を流すことで、磁性体標識された細胞が磁石配置部位付近に集積するようにした。
基板:Micro Slide Glass(Matsunami, Japan)とGap cover glass (Matsunami, Japan)
とを圧着し、Gap cover glassの一方の端に吸収部材としてBEMCOT, M-3 (Asahi Kasei Corp., Japan)をはさみ込んだものを用いた。銅スパッタを使用した実験では、Micro SlideGlass表面に銅を40 nmスパッタリングしたものを用いた。
磁性体標識抗体:MACS CD45 MicroBeads (以下、「MACS-CD45」と記載)は、Miltenyi Biotech GmbH (Germany)より入手した。EasySep Human CD45 Depletion Cocktail (以下、「EasySep-CD45」と記載)は、StemCell Technologies, Inc. (Canada)より入手した。なお、EasySep-CD45は、MACS-CD45に比べて、強い磁性を有する。
細胞:Jurkat細胞を用いた。細胞は1.75×10⁷ cells / mLに調整したサンプル200 μlに対し、EasySep-CD45を5 μlもしくはMACS-CD45を10 μl添加し、15分間インキュベートした。EasySep-CD45サンプルについては、さらにEasySep magnet reagentを10 μl添加して10分間インキュベートした。銅スパッタを使用した実験では、インキュベート後に細胞をPBSで二回洗浄した。
磁石による細胞吸着:磁石には、直径5mm、高さ3mmの円柱形のネオジウム磁石を用いた。これをGap cover glass上面に接するように配置し、Gap cover glass下面とスライドグラス表面の間に形成された深さ20マイクロメートルの間隙中に磁性体で標識した細胞を流すことで、磁性体標識された細胞が磁石配置部位付近に集積するようにした。
基板の観察領域に集積されたEasySep-CD45ラベル細胞を図33に、MACS-CD45ラベル細胞を撮影した写真を図34に示す。図中、左方向にサンプル液が導入される導入部が、右方向にサンプル液を吸水する吸収部材が位置し、中央に磁石が配置される観察領域が位置している。なお、写真は、磁石の除去後に撮影している。EasySep-CD45及びMACS-CD45によりラベルされた細胞が、磁石によって、磁石配置部位に対応する観察領域に集積されていることが確認される。図下段は、観察領域の一部(導入部側)拡大写真を示す。
図35に、銅をスパッタリングした基板の観察領域に集積されたMACS-CD45ラベル細胞を撮影した透過像(A)と、紫外波長域の光を照射して取得した蛍光像(B)を示す。蛍光像(B)において、集積された細胞の核が蛍光を呈し、核形態が明瞭に観察されている。
本発明に係る細胞核観察基板等によれば、細胞や微生物等の核を簡単な操作で染色し、形態観察を行うことができる。従って、本発明に係る細胞核観察基板等は、医療、創薬、食品、農業等の種々の分野において、細胞核の形態に基づいて細胞や微生物等の種類や性状を判定するために有効に用いられ得る。
A:細胞核観察基板、1:導入部、2:観察領域、3:銅膜、4:吸収部材、5:磁石、6:排出部、a1、a2:基板層、a3:スペーサ
Claims (6)
- 細胞を含むサンプル液が導入される導入部と、該導入部から導入されたサンプル液中の細胞が収容される観察領域と、が形成され、
前記導入部と前記観察領域とを含むサンプル液の通流経路上に、サンプル液に対して接触可能に銅が配置されている細胞核観察基板。 - 前記銅は、前記通流経路上に製膜されて配置されている請求項1記載の細胞核観察基板。
- 前記観察領域内に磁場を形成する着脱可能な磁石を備え、前記通流経路を通流するサンプル液中の細胞を磁力に基づいて前記観察領域内に保持する請求項2記載の細胞核観察基板。
- 前記観察領域が、所定距離をおいて対向する2枚の基板層間の間隙に構成され、
該間隙へのサンプル液の導入部と、該導入部から前記間隙に導入されたサンプル液を吸水する吸収部材と、を備え、
前記導入部と前記吸収部材との間に対応する位置に前記磁石が取り付けられる請求項3記載の細胞核観察基板。 - 細胞を含むサンプル液が導入される導入部と、該導入部から導入されたサンプル液中の細胞が収容される観察領域と、が形成され、前記導入部と前記観察領域とを含むサンプル液の通流経路上に、サンプル液に対して接触可能に銅が配置されている基板と、
前記観察領域に光を照射し、発生する蛍光を検出する光学検出手段と、を備える細胞核観察装置。 - 前記光学検出手段が照射する光の波長が300~420nmである請求項5記載の細胞核観察装置。
Priority Applications (3)
| Application Number | Priority Date | Filing Date | Title |
|---|---|---|---|
| EP11855616.6A EP2664667B1 (en) | 2011-01-13 | 2011-12-27 | Cell nucleus observation substrate and cell nucleus observation device |
| CN201180064270.3A CN103339249B (zh) | 2011-01-13 | 2011-12-27 | 细胞核观察基板和细胞核观察装置 |
| US13/977,417 US9182349B2 (en) | 2011-01-13 | 2011-12-27 | Cell nucleus observation substrate and cell nucleus observation apparatus |
Applications Claiming Priority (2)
| Application Number | Priority Date | Filing Date | Title |
|---|---|---|---|
| JP2011005240A JP5716406B2 (ja) | 2011-01-13 | 2011-01-13 | 細胞核観察基板及び細胞核観察装置 |
| JP2011-005240 | 2011-01-13 |
Publications (1)
| Publication Number | Publication Date |
|---|---|
| WO2012095935A1 true WO2012095935A1 (ja) | 2012-07-19 |
Family
ID=46506861
Family Applications (1)
| Application Number | Title | Priority Date | Filing Date |
|---|---|---|---|
| PCT/JP2011/007293 Ceased WO2012095935A1 (ja) | 2011-01-13 | 2011-12-27 | 細胞核観察基板及び細胞核観察装置 |
Country Status (5)
| Country | Link |
|---|---|
| US (1) | US9182349B2 (ja) |
| EP (1) | EP2664667B1 (ja) |
| JP (1) | JP5716406B2 (ja) |
| CN (1) | CN103339249B (ja) |
| WO (1) | WO2012095935A1 (ja) |
Cited By (1)
| Publication number | Priority date | Publication date | Assignee | Title |
|---|---|---|---|---|
| US10982255B2 (en) * | 2012-05-10 | 2021-04-20 | Sony Corporation | Microchip for nucleic acid analysis |
Families Citing this family (15)
| Publication number | Priority date | Publication date | Assignee | Title |
|---|---|---|---|---|
| FR3002634B1 (fr) * | 2013-02-28 | 2015-04-10 | Commissariat Energie Atomique | Procede d'observation d'au moins un objet, tel qu'une entite biologique, et systeme d'imagerie associe |
| EP3104167A4 (en) * | 2014-02-04 | 2017-01-25 | Panasonic Intellectual Property Management Co., Ltd. | Sample detection plate, and fluorescence detection system and fluorescence detection method using same |
| JP6548645B2 (ja) | 2014-06-30 | 2019-07-24 | Phcホールディングス株式会社 | 試料分析用基板および試料分析装置 |
| US10309976B2 (en) | 2014-06-30 | 2019-06-04 | Phc Holdings Corporation | Substrate for sample analysis, sample analysis device, sample analysis system, and program for sample analysis system |
| US10520521B2 (en) | 2014-06-30 | 2019-12-31 | Phc Holdings Corporation | Substrate for sample analysis, sample analysis device, sample analysis system, and program for sample analysis system |
| US10539582B2 (en) | 2014-06-30 | 2020-01-21 | Phc Holdings Corporation | Substrate for sample analysis, sample analysis device, sample analysis system, and method for removing liquid from liquid that contains magnetic particles |
| KR101565702B1 (ko) * | 2014-07-17 | 2015-11-04 | 한국과학기술원 | 휴대용 광-자기 말라리아 검출 장치 및 검출 방법 |
| TWI640624B (zh) * | 2014-08-29 | 2018-11-11 | 國立清華大學 | 細胞觀測裝置及使用其之細胞收集方法 |
| WO2016093332A1 (ja) | 2014-12-12 | 2016-06-16 | パナソニックヘルスケアホールディングス株式会社 | 試料分析用基板、試料分析装置、試料分析システムおよび試料分析システム用プログラム |
| DE102016104808A1 (de) * | 2016-03-15 | 2017-09-21 | Als Automated Lab Solutions Gmbh | Vorrichtung zum Einsetzen in ein bildgebendes System |
| JP6856227B2 (ja) * | 2017-02-09 | 2021-04-07 | 株式会社Cics | 計測装置 |
| CN107290534A (zh) * | 2017-07-12 | 2017-10-24 | 华讯方舟科技有限公司 | 一种血液细胞捕获芯片及方法 |
| CN109306323A (zh) * | 2017-07-28 | 2019-02-05 | 香港大学深圳医院 | 一种用于捕获细菌的磁力微流控芯片及其制备方法 |
| JP7404906B2 (ja) * | 2019-03-04 | 2023-12-26 | ソニーグループ株式会社 | 情報処理装置、及び顕微鏡システム |
| US11761895B2 (en) | 2019-03-04 | 2023-09-19 | Sony Group Corporation | Information processing apparatus and microscope system |
Citations (1)
| Publication number | Priority date | Publication date | Assignee | Title |
|---|---|---|---|---|
| JP2003107081A (ja) * | 2001-09-28 | 2003-04-09 | Olympus Optical Co Ltd | 画像解析方法、装置、及び記録媒体 |
Family Cites Families (5)
| Publication number | Priority date | Publication date | Assignee | Title |
|---|---|---|---|---|
| US7075642B2 (en) * | 2003-02-24 | 2006-07-11 | Intel Corporation | Method, structure, and apparatus for Raman spectroscopy |
| DE10314579A1 (de) * | 2003-03-31 | 2004-10-14 | Carl Zeiss Jena Gmbh | Verfahren und Vorrichtung zur Sequenzanalyse von Nukleinsäuren |
| US7956989B2 (en) * | 2007-01-22 | 2011-06-07 | University Of North Texas Health Science Center At Fort Worth | Surface plasmon assisted microscope |
| EP2257790B1 (en) * | 2008-03-03 | 2016-12-07 | University Of Maryland Baltimore County | Voltage-gated metal-enhanced fluorescence, chemiluminescence or bioluminescence methods and systems |
| KR20120051133A (ko) * | 2010-11-12 | 2012-05-22 | 삼성전자주식회사 | 미세유동장치 및 이를 이용한 헤모글로빈의 측정방법 |
-
2011
- 2011-01-13 JP JP2011005240A patent/JP5716406B2/ja active Active
- 2011-12-27 EP EP11855616.6A patent/EP2664667B1/en not_active Not-in-force
- 2011-12-27 US US13/977,417 patent/US9182349B2/en not_active Expired - Fee Related
- 2011-12-27 CN CN201180064270.3A patent/CN103339249B/zh not_active Expired - Fee Related
- 2011-12-27 WO PCT/JP2011/007293 patent/WO2012095935A1/ja not_active Ceased
Patent Citations (1)
| Publication number | Priority date | Publication date | Assignee | Title |
|---|---|---|---|---|
| JP2003107081A (ja) * | 2001-09-28 | 2003-04-09 | Olympus Optical Co Ltd | 画像解析方法、装置、及び記録媒体 |
Non-Patent Citations (4)
| Title |
|---|
| MEGAN MCNULTY ET AL.: "Evidence that a copper- metallothionein complex is responsible for fluorescence in acid-secreting cells of the Drosophila stomach", CELL TISSUE RES, vol. 304, 2001, pages 383 - 389, XP055119774 * |
| PETER A. ZIMMERMAN ET AL.: "DIAGNOSIS OF MALARIA BY MAGNETIC DEPOSITION MICROSCOPY", AM. J. TROP. MED. HYG., vol. 74, no. 4, 2006, pages 568 - 572, XP055119771 * |
| See also references of EP2664667A4 * |
| STEPHAN KARL ET AL.: "Enhanced detection of gametocytes by magnetic deposition microscopy predicts higher potential for Plasmodium falciparum transmission", MALARIA JOURNAL, vol. 7, 2008, pages 66, XP021036606 * |
Cited By (1)
| Publication number | Priority date | Publication date | Assignee | Title |
|---|---|---|---|---|
| US10982255B2 (en) * | 2012-05-10 | 2021-04-20 | Sony Corporation | Microchip for nucleic acid analysis |
Also Published As
| Publication number | Publication date |
|---|---|
| CN103339249A (zh) | 2013-10-02 |
| EP2664667A4 (en) | 2015-10-28 |
| CN103339249B (zh) | 2015-01-07 |
| JP2012143204A (ja) | 2012-08-02 |
| US20130288351A1 (en) | 2013-10-31 |
| EP2664667A1 (en) | 2013-11-20 |
| EP2664667B1 (en) | 2017-02-08 |
| US9182349B2 (en) | 2015-11-10 |
| JP5716406B2 (ja) | 2015-05-13 |
Similar Documents
| Publication | Publication Date | Title |
|---|---|---|
| JP5716406B2 (ja) | 細胞核観察基板及び細胞核観察装置 | |
| US10081830B2 (en) | Method of detecting nucleic acids, method of optically observing sample and fluorescent substance | |
| Gu et al. | Detection of mercury ion by infrared fluorescent protein and its hydrogel-based paper assay | |
| Hui et al. | Wide-field imaging and flow cytometric analysis of cancer cells in blood by fluorescent nanodiamond labeling and time gating | |
| Khalid et al. | Intrinsic fluorescence of selenium nanoparticles for cellular imaging applications | |
| Chen et al. | Fabrication of metal nanoshell quantum-dot barcodes for biomolecular detection | |
| CA2640551C (en) | Apparatus and methods for imaging and modification of biological samples | |
| Connally et al. | High resolution detection of fluorescently labeled microorganisms in environmental samples using time-resolved fluorescence microscopy | |
| Roger et al. | Evaluation of fluorescence-based viability stains in cells dissociated from scleractinian coral Pocillopora damicornis | |
| JP6074911B2 (ja) | 核酸解析用マイクロチップ | |
| JP6414238B2 (ja) | 核酸解析用マイクロチップ | |
| Gillette et al. | Wide-Field Optical Redox Imaging with Leading-Edge Detection Enables Assessment of Treatment Response and Heterogeneity in Patient-Derived Cancer Organoids | |
| Xu et al. | Cell growth measurement | |
| JP2004105027A (ja) | マラリア原虫測定方法及び装置 | |
| Datta et al. | Assessing Intracellular Metabolism of Immune Cells In Situ in Live Zebrafish Larvae by Autofluorescence Lifetime Imaging Microscopy of NAD (P) H and FAD | |
| Periasamy et al. | FLIM applications in the biomedical sciences | |
| Datta et al. | Imaging Microscopy of NAD (P) H and FAD | |
| Fusi et al. | Wide-field autofluorescence microscopy for the imaging of living cells | |
| Valta | Spectrally Tuned Lanthanide Photoluminescence for Point-of-Care Testing | |
| Bychkova | Polymeric Submicron Optical Ion-Selective Sensors |
Legal Events
| Date | Code | Title | Description |
|---|---|---|---|
| 121 | Ep: the epo has been informed by wipo that ep was designated in this application |
Ref document number: 11855616 Country of ref document: EP Kind code of ref document: A1 |
|
| REEP | Request for entry into the european phase |
Ref document number: 2011855616 Country of ref document: EP |
|
| WWE | Wipo information: entry into national phase |
Ref document number: 2011855616 Country of ref document: EP |
|
| WWE | Wipo information: entry into national phase |
Ref document number: 13977417 Country of ref document: US |
|
| NENP | Non-entry into the national phase |
Ref country code: DE |