WO2012115009A1 - 周期的静止物検出装置及び周期的静止物検出方法 - Google Patents
周期的静止物検出装置及び周期的静止物検出方法 Download PDFInfo
- Publication number
- WO2012115009A1 WO2012115009A1 PCT/JP2012/053834 JP2012053834W WO2012115009A1 WO 2012115009 A1 WO2012115009 A1 WO 2012115009A1 JP 2012053834 W JP2012053834 W JP 2012053834W WO 2012115009 A1 WO2012115009 A1 WO 2012115009A1
- Authority
- WO
- WIPO (PCT)
- Prior art keywords
- stationary object
- periodic stationary
- unit
- periodic
- value
- Prior art date
- Legal status (The legal status is an assumption and is not a legal conclusion. Google has not performed a legal analysis and makes no representation as to the accuracy of the status listed.)
- Ceased
Links
Images








Classifications
-
- G—PHYSICS
- G08—SIGNALLING
- G08G—TRAFFIC CONTROL SYSTEMS
- G08G1/00—Traffic control systems for road vehicles
- G08G1/16—Anti-collision systems
- G08G1/167—Driving aids for lane monitoring, lane changing, e.g. blind spot detection
-
- G—PHYSICS
- G06—COMPUTING OR CALCULATING; COUNTING
- G06T—IMAGE DATA PROCESSING OR GENERATION, IN GENERAL
- G06T7/00—Image analysis
- G06T7/20—Analysis of motion
- G06T7/246—Analysis of motion using feature-based methods, e.g. the tracking of corners or segments
-
- G—PHYSICS
- G06—COMPUTING OR CALCULATING; COUNTING
- G06V—IMAGE OR VIDEO RECOGNITION OR UNDERSTANDING
- G06V10/00—Arrangements for image or video recognition or understanding
- G06V10/40—Extraction of image or video features
- G06V10/42—Global feature extraction by analysis of the whole pattern, e.g. using frequency domain transformations or autocorrelation
- G06V10/421—Global feature extraction by analysis of the whole pattern, e.g. using frequency domain transformations or autocorrelation by analysing segments intersecting the pattern
-
- G—PHYSICS
- G06—COMPUTING OR CALCULATING; COUNTING
- G06V—IMAGE OR VIDEO RECOGNITION OR UNDERSTANDING
- G06V20/00—Scenes; Scene-specific elements
- G06V20/50—Context or environment of the image
- G06V20/56—Context or environment of the image exterior to a vehicle by using sensors mounted on the vehicle
-
- G—PHYSICS
- G06—COMPUTING OR CALCULATING; COUNTING
- G06V—IMAGE OR VIDEO RECOGNITION OR UNDERSTANDING
- G06V20/00—Scenes; Scene-specific elements
- G06V20/50—Context or environment of the image
- G06V20/56—Context or environment of the image exterior to a vehicle by using sensors mounted on the vehicle
- G06V20/58—Recognition of moving objects or obstacles, e.g. vehicles or pedestrians; Recognition of traffic objects, e.g. traffic signs, traffic lights or roads
-
- G—PHYSICS
- G06—COMPUTING OR CALCULATING; COUNTING
- G06T—IMAGE DATA PROCESSING OR GENERATION, IN GENERAL
- G06T2207/00—Indexing scheme for image analysis or image enhancement
- G06T2207/30—Subject of image; Context of image processing
- G06T2207/30248—Vehicle exterior or interior
- G06T2207/30252—Vehicle exterior; Vicinity of vehicle
Definitions
- the present invention relates to a periodic stationary object detection device and a periodic stationary object detection method.
- the object detection device described in Patent Document 1 is for judging a stationary solid object that exists independently. Therefore, it has been difficult to distinguish and recognize stationary solid objects (hereinafter referred to as periodic stationary objects) periodically present on the roadside, such as pylons, guardrail legs, and utility poles, from other three-dimensional objects.
- periodic stationary objects stationary solid objects periodically present on the roadside, such as pylons, guardrail legs, and utility poles, from other three-dimensional objects.
- the present invention has been made to solve the above-described problems, and an object of the present invention is to provide a periodic stationary object detection apparatus and a periodic stationary object detection method capable of accurately detecting a periodic stationary object. It is to provide.
- One embodiment of the present invention is a periodic stationary object detection device that detects a periodic stationary object existing around a moving body.
- This periodic stationary object detection device is mounted on a moving body and can capture an image of the periphery of the moving body, and a viewpoint that performs viewpoint conversion processing on an image captured by the imaging device and generates a bird's-eye view image
- a feature point extraction unit that extracts a feature point of a three-dimensional object for each of a plurality of small regions included in the predetermined region from the image data of the predetermined region of the bird's-eye image, and a feature point extracted by the feature point extraction unit
- a waveform data calculation unit that calculates waveform data corresponding to a distribution in a predetermined region on the bird's-eye view image, a peak information detection unit that detects peak information of the waveform data, and whether the peak information is greater than or equal to a predetermined first threshold value
- a periodic stationary object candidate detection unit that determines whether or not the three-dimensional object having the feature point extracted by
- Another aspect of the present invention is a periodic stationary object detection method for detecting a periodic stationary object existing around a moving body.
- This periodic stationary object detection method generates an aerial image by performing an imaging process of imaging the surroundings of the moving body by an imaging apparatus mounted on the moving body and a viewpoint conversion process on the image captured by the imaging apparatus.
- a feature point extraction step of extracting feature points of a three-dimensional object for each of a plurality of small regions included in the predetermined region Extracted from a viewpoint conversion step, a feature point extraction step of extracting feature points of a three-dimensional object for each of a plurality of small regions included in the predetermined region, and a feature point extraction step from image data of the predetermined region of the bird's-eye view image
- FIG. 1 is a schematic configuration diagram of a periodic stationary object detection device according to the first embodiment of the present invention, and shows an example in which the periodic stationary object detection device is mounted on a vehicle.
- FIG. 2 is a top view showing a traveling state of the host vehicle shown in FIG.
- FIG. 3 is a block diagram showing details of the computer shown in FIG. 4A and 4B are top views showing an outline of the processing of the alignment unit shown in FIG. 3, wherein FIG. 4A shows the moving state of the host vehicle, and FIG. 4B shows the outline of alignment.
- Figure 5 is a diagram showing the amount of movement of the candidate calculation unit handles the details shown in FIG.
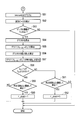
- FIG. 6 is a flowchart illustrating processing of the alignment unit and the three-dimensional object detection unit illustrated in FIG. 3.
- FIG. 7 is a flowchart showing processing of the periodicity determination unit shown in FIG.
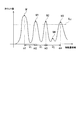
- FIG. 8 is a diagram showing a histogram generated by the counting unit shown in FIG.
- FIG. 9 is a flowchart illustrating processing of the movement range calculation unit and the periodic stationary object determination unit illustrated in FIG. 3.
- FIG. 10 is a diagram showing details of step S27 shown in FIG. 9, where (a) shows a case where another vehicle has entered the front side of the periodic stationary object, and (b) shows the case of (a).
- FIG. 11 is a schematic configuration diagram of a periodic stationary object detection device according to the second embodiment of the present invention, and shows an example in which the periodic stationary object detection device is mounted on a vehicle.
- FIG. 12 is a diagram illustrating a traveling state of the host vehicle illustrated in FIG. 11 and an imaging range of the imaging device.
- FIG. 13 is a block diagram showing details of the computer shown in FIG.
- FIG. 14 is a diagram illustrating detailed operations of the edge distribution calculation unit, the count unit, the periodic stationary object candidate detection unit, and the periodic stationary object determination unit illustrated in FIG. 13.
- FIG. 11 is a schematic configuration diagram of a periodic stationary object detection device according to the second embodiment of the present invention, and shows an example in which the periodic stationary object detection device is mounted on a vehicle.
- FIG. 12 is a diagram illustrating a traveling state of the host vehicle illustrated in FIG. 11 and an imaging range of the imaging device.
- FIG. 13 is a block diagram showing details of the computer shown in FIG.
- FIG. 14 is a diagram illustrating detailed
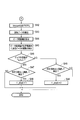
- FIG. 15 is a flowchart showing details of a periodic stationary object detection method according to the second embodiment of the present invention.
- FIG. 16 is a flowchart showing details of the periodic stationary object detection method according to the second embodiment of the present invention, and shows processing subsequent to FIG.
- FIG. 17 is a block diagram showing details of the computer of the periodic stationary object detection device according to the third embodiment of the present invention.
- FIG. 18 is a diagram illustrating a detailed operation of the alignment unit of FIG.
- FIG. 19 is a diagram illustrating a detailed operation of the difference calculation unit of FIG. (A) shows the difference when the edge distribution waveform is derived from a periodic stationary object, and (b) shows the difference when the edge distribution waveform is derived from a moving object.
- FIG. 20 is a flowchart showing details of the periodic stationary object detection method according to the third embodiment of the present invention, and corresponds to FIG.
- FIG. 21 is a flowchart showing details of a periodic stationary object detection method according to a modification of the third embodiment of the present invention, and corresponds to FIG.
- FIG. 1 is a schematic configuration diagram of a periodic stationary object detection device 1 according to the first embodiment of the present invention, and shows an example in which the periodic stationary object detection device 1 is mounted on a host vehicle V. .
- a periodic stationary object detection device 1 shown in FIG. 1 detects a periodic stationary object existing around the host vehicle V.
- the periodic stationary object detection device 1 is arranged on the roadside such as a pylon, a guardrail leg, or a power pole. It detects stationary objects that exist periodically.
- the host vehicle V will be described as an example of a moving body.
- the moving body is not limited to the host vehicle V, and may be another moving body such as a two-wheeled vehicle or a bicycle.
- the periodic stationary object detection device 1 includes a camera (imaging device) 10, a vehicle speed sensor 20 (speed detector), and a calculator 30.
- the camera 10 shown in FIG. 1 is attached so that the optical axis is at an angle ⁇ from the horizontal to the downward direction at the position of the height h behind the host vehicle V.
- the camera 10 images a predetermined detection area from this position.
- the vehicle speed sensor 20 detects the traveling speed of the host vehicle V, and calculates the speed from the wheel speed detected by, for example, a wheel speed sensor that detects the rotational speed of the wheel.
- the computer 30 detects a periodic stationary object existing around the host vehicle V based on an image captured by the camera 10 and a signal from the vehicle speed sensor 20.
- FIG. 2 is a top view showing a traveling state of the host vehicle V shown in FIG.
- the camera 10 images the vehicle rear side at a predetermined angle of view a.
- the angle of view a of the camera 10 is wide, and in addition to the lane in which the host vehicle V travels, it is possible to image the road side where the periodic stationary object exists.
- FIG. 3 is a block diagram showing details of the computer 30 shown in FIG. In FIG. 3, the camera 10 and the vehicle speed sensor 20 are also illustrated in order to clarify the connection relationship.
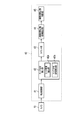
- the computer 30 includes a viewpoint conversion unit 31, a positioning unit 32, a three-dimensional object detection unit 33, a movement amount candidate calculation unit 34, a count unit 35, a movement range calculation unit 36, A periodic stationary object determination unit 37 and a lane change detection unit (lateral movement detection unit) 38 are provided.
- the viewpoint conversion unit 31 inputs captured image data obtained by imaging with the camera 10, and converts the input captured image data into a bird's-eye image data in a bird's-eye view state.
- the state viewed from a bird's-eye view is a state viewed from the viewpoint of a virtual camera looking down from above, for example, vertically downward. This viewpoint conversion is executed as described in Patent Document 1, for example.
- the alignment unit 32 sequentially inputs the bird's-eye image data obtained by the viewpoint conversion of the viewpoint conversion unit 31, and aligns the positions of the inputted bird's-eye image data at different times.
- FIG. 4 is a top view showing an outline of the processing of the alignment unit 32 shown in FIG. 3, (a) shows the moving state of the host vehicle V, and (b) shows an outline of the alignment.
- the vehicle V of the current time is located in V 1, and one unit time before the vehicle V is positioned at V 2.
- the other vehicle V O is located in the rear side region of the own vehicle V and is in a parallel running state with the own vehicle V, the other vehicle V O at the current time is located at V O1, and the other vehicle V one time before Assume that O is located at V O2 .
- the host vehicle V has moved a distance d at one time.
- “one hour before” may be a past time by a predetermined time (for example, one control cycle) from the current time, or may be a past time by an arbitrary time.
- the bird's-eye image PB t at the current time is as shown in Figure 4 (b).
- the bird's-eye image PB t it becomes a rectangular shape for the white line drawn on the road surface, relatively accurately, but has become a top view state, falling to the other vehicle V O which is located V O1 is generated is doing.
- the white line drawn on the road surface has a rectangular shape and is relatively accurately viewed from above, but is positioned at V O2. collapse has occurred for the other vehicle V O you are.
- the alignment unit 32 performs alignment of the bird's-eye images PB t and PB t ⁇ 1 as described above on the data. At this time, the alignment unit 32 is offset a bird's-eye view image PB t-1 before one unit time, to match the position and bird's-eye view image PB t at the current time.
- the offset amount d ′ is an amount corresponding to the moving distance d shown in FIG. 4A, and is determined based on the signal from the vehicle speed sensor 20 and the time from one time before to the current time.
- Three-dimensional object detection unit 33 is for detecting a plurality of three-dimensional object from the data of the difference image PD t. Specifically, the three-dimensional object detection unit 33 calculates the difference between the bird's-eye images PB t and PB t ⁇ 1 and generates data of the difference image PD t .
- the pixel value of the difference image PD t may be an absolute value of the difference between the pixel values of the bird's-eye images PB t and PB t ⁇ 1 , and the absolute value is predetermined in order to cope with a change in the illuminance environment. “1” may be set when the value is exceeded, and “0” may be set when the value is not exceeded.
- the three-dimensional object detection unit 33 determines that a three-dimensional object exists in the area detected as “1” on the data of the difference image PD t .
- FIG. 3 will be referred to again.
- the movement amount candidate calculation unit 34 calculates movement amount candidates of a plurality of three-dimensional objects detected by the three-dimensional object detection unit 33.
- FIG. 5 is a diagram showing details of processing of the movement amount candidate calculation unit 34 shown in FIG. 3, where (a) shows the difference image PD t at time t, and (b) shows the difference image PD at time t ⁇ 1. t-1 is shown.
- the movement amount candidate calculation unit 34 detects the ground contact point (feature point) of the three-dimensional object from the data of the difference image PD t ⁇ 1 at time t ⁇ 1 as shown in FIG.
- the contact point is a contact point between the three-dimensional object and the road surface.
- the movement amount candidate calculation unit 34 detects a position closest to the camera 10 of the host vehicle V among the detected three-dimensional objects as a grounding point.
- the movement amount candidate calculation unit 34 detects a ground point for each region (small region) where the three - dimensional object detection unit 33 determines that a three-dimensional object exists on the data of the difference image PD t-1 .
- movement amount candidate calculating unit 34 detects the ground contact point P 1 for the three-dimensional object O 1, detects a grounding point P 2 for three-dimensional object O 2, to detect a grounding point P 3 for three-dimensional objects O 3.
- the movement amount candidate calculation unit 34 sets an area T with a width W for the difference image PD t at time t as shown in FIG.
- the movement amount candidate calculation unit 34 sets a region T at a location corresponding to the ground points P 1 to P 3 of the data of the difference image PD t ⁇ 1 at time t ⁇ 1.
- the movement amount candidate calculation unit 34 detects the ground contact point of the three-dimensional object from the data of the difference image PD t at time t. Movement amount candidate calculating unit 34 at this time detects the ground contact point area three-dimensional object on the data of the difference image PD t by the three-dimensional object detection unit 33 is determined to be present in each (small region).
- the movement amount candidate calculation unit 34 detects a position closest to the camera 10 of the host vehicle V as a grounding point among the detected three-dimensional objects. That is, the movement amount candidate calculating unit 34 detects the ground contact point P 4 for three-dimensional object O 4, detects a grounding point P 5 on the three-dimensional object O 5, to detect the grounding point P 6 three-dimensional object O 6.
- the alignment unit 32, the three-dimensional object detection unit 33, and the movement amount candidate calculation unit 34 are included in the predetermined region from the image data of the predetermined region of the bird's-eye image (image data of the rear side region of the difference image).
- the image data of the predetermined region of the bird's-eye image image data of the rear side region of the difference image.
- For each of a plurality of small regions functions as a feature point extraction unit that extracts feature points (ground points) of the three-dimensional object.
- the movement amount candidate calculation unit 34 associates the ground points with each other. That is, the movement amount candidate calculating section 34, together with associated ground point P 4 with respect to the ground point P 1, associates ground point P 5 with respect to the ground point P 1, and, contact with respect to the ground point P 1 associate the point P 6. Similarly, the movement amount candidate calculation unit 34 associates the ground points P 4 to P 6 with the ground points P 2 and P 3 .
- the movement amount candidate calculation unit 34 calculates the distance between the associated grounding points P 1 to P 6 (that is, the movement amount candidate). Then, the movement amount candidate calculation unit 34 sets the calculated distance as a movement amount candidate. In this way, the movement amount candidate calculation unit 34 calculates a plurality of movement amount candidates for each three-dimensional object. As a result, the movement amount of the three-dimensional object is uniquely determined, and the situation in which an erroneous movement amount is calculated for a periodic stationary object in which similar image features appear periodically is suppressed. ing.
- the reason why the region T is provided is that even if an error occurs in the alignment of the bird's-eye view images PB t and PB t-1 due to pitching or yawing of the host vehicle V, the correspondence between the ground points P 1 to P 6 is stabilized. Is to do. Further, the correspondence between the ground points P 1 to P 6 is determined by matching processing of luminance distribution around the ground point of the bird's-eye images PB t and PB t ⁇ 1 .
- the count unit 35 counts the movement amount candidates calculated by the movement amount candidate calculation unit 34, and creates a histogram (waveform data) by counting.
- the count unit 35 has the same distance between the ground point P 1 and the ground point P 4 , the distance between the ground point P 2 and the ground point P 5, and the distance between the ground point P 3 and the ground point P 6. If there is, the count value is set to “3”.
- the counting unit 35 counts the movement amount candidates and creates a histogram, thereby corresponding to the distribution of the grounding points in the rear side region of the difference image (the relative positional relationship between the grounding points). (Based on) function as a waveform data calculation unit for calculating waveform data.
- the movement range calculation unit 36 calculates the movement range of the periodic stationary object on the bird's-eye view image based on the imaging interval of the camera 10 and the movement speed of the host vehicle V detected by the vehicle speed sensor 20. .
- the movement range calculation unit 36 calculates a movement range having a predetermined margin with respect to the speed of the host vehicle V.
- the margin is, for example, ⁇ 10 km / h.
- the movement range calculation unit 36 is a three-dimensional object that moves one pixel in one control cycle when the imaging interval of the camera 10 is 33 ms and the actual distance in the vehicle traveling direction covered by one pixel is 5 cm.
- the speed will be about 5.5 km / h.
- a margin of ⁇ 10 km / h is required to allow about 5.5 km / h.
- the periodic stationary object determination unit 37 determines whether or not a plurality of three-dimensional objects detected by the three-dimensional object detection unit 33 are periodic stationary objects.
- the periodic stationary object determination unit 37 includes a periodic stationary object candidate detection unit 37a and a periodicity determination unit 37b.
- the periodic stationary object determination unit 37 includes a histogram created by the counting unit 35, a movement range calculated by the movement range calculation unit 36, and a periodic stationary object candidate detected by the periodic stationary object candidate detection unit 37a.
- a plurality of three-dimensional objects detected by the three-dimensional object detection unit 33 based on (the stationary object that may be a periodic stationary object) and the periodicity determined by the periodicity determination unit 37b are periodic stationary objects. It is judged whether it is.
- FIG. 6 is a flowchart showing processing of the alignment unit 32 and the three-dimensional object detection unit 33 shown in FIG.
- the alignment unit 32 inputs data of bird's-eye images PB t and PB t ⁇ 1 at different times detected by the viewpoint conversion unit 31, and performs alignment (S1).
- the three-dimensional object detection unit 33 calculates a difference between the data of the bird's-eye images PB t and PB t ⁇ 1 aligned in step S1 (S2).
- the three-dimensional object detection unit 33 executes binarization processing based on the predetermined value and generates data of the difference image PD t (S3). And the process of the position alignment part 32 and the solid-object detection part 33 is complete
- FIG. 7 is a flowchart showing the processing of the periodic stationary object candidate detection unit 37a and the periodicity determination unit 37b shown in FIG. 3, and FIG. 8 shows the histogram generated by the counting unit 35 shown in FIG. FIG. As shown in FIG. 8, the counting unit 35 counts the same movement amount candidates among the calculated movement amount candidates. That is, in the example shown in FIG. 8, since a plurality of movement amounts m1, m2, m3, and m4 are detected, these count values are high.
- the periodic stationary object candidate detection unit 37a first detects the maximum value M (peak value; peak information) from the histogram (S11). Then, the periodic stationary object candidate detection unit 37a sets a predetermined threshold value Th 1 on the basis of the maximum value M detected at step S11 (S12).
- the predetermined threshold Th 1 is set to 70% of the maximum value M. For example, when the count value of the maximum value M is “7”, the predetermined threshold Th 1 is set to “4.9”.
- an appropriate threshold value is set even if the size of the count value changes due to the positional relationship between the host vehicle V and the three-dimensional object, the sunlight conditions, or the like. Can be set.
- the predetermined threshold Th 1 is 70% of the maximum value M, but is not limited to this.
- the periodic stationary object candidate detection unit 37a detects local maximum values M1 to M3 (peak values; peak information) that are equal to or greater than a predetermined threshold Th 1 (S13).
- the maximum value M is “7”
- the periodic stationary object candidate detection unit 37a detects local maximum values M1 to M3 having a count value of “5” or more.
- the periodic stationary object candidate detection unit 37a functions as a peak information detection unit that detects peak information of a histogram (waveform data).
- the periodic stationary object candidate detection unit 37a determines whether or not each solid object having the detected ground point is a periodic stationary object candidate based on whether or not the peak information is equal to or greater than a predetermined threshold. Judging.
- the periodic stationary object candidate detection unit 37a has a three-dimensional object (for example, certain 2) associated with the movement amount candidate corresponding to each of the local maximum values M and M1 to M3 (including the maximum value M).
- a three-dimensional object for example, certain 2
- the distance between the two grounding points coincides with any one of the local maximum values M and M1 to M3, it is determined that the two solid objects having the grounding point are periodic stationary object candidates.
- the periodicity determination unit 37b detects the interval (peak information) between the maximum values M, M1 to M3 (including the maximum value M), and votes the detected interval (S14). That is, Votes for distance D 1 in the example shown in FIG. 8, "2", number of votes for the interval D 2 is "1".
- the periodicity determination unit 37b determines periodicity (S15). At this time, the periodicity determination unit 37b determines periodicity based on whether or not the number of votes in step S14 is equal to or greater than a predetermined number of votes.
- the predetermined number of votes is the number of detected half of the detected three-dimensional object from bird's-eye image PB t. Therefore, when the detected number of the detected three-dimensional object from bird's-eye image PB t is "4", a predetermined number of votes is "2".
- the predetermined number of votes is not limited to the above, and may be a fixed value.
- the periodicity determining unit 37b reduces the predetermined threshold value Th 1 in step S12 (S16). Then, the process proceeds to step S17.
- the predetermined threshold Th 1 is 70% of the maximum value M, but is set to 60% of the maximum value M or the like.
- the period of lowering the predetermined threshold value Th 1 is about 1 second approximately, a predetermined threshold value Th 1 each time it is determined that there is periodicity is reconfigured.
- step S17 if it is determined that there is no periodicity (S15: NO), the predetermined threshold value Th 1 without being reduced, the process proceeds to step S17.
- the periodicity determination unit 37b determines the number of votes (peak information) of occurrence positions (intervals) of local maximum values M and M1 to M3 that are equal to or greater than the predetermined threshold Th 1 based on the maximum value M of the movement amount candidate count values.
- the periodicity is judged from the above. For this reason, a local maximum value having a relatively small value (for example, symbol M4 in FIG. 8) can be ignored, and it is difficult to be influenced by noise, and the periodicity can be determined with higher accuracy.
- step S ⁇ b> 17 the periodicity determination unit 37 b determines whether or not lateral movement exceeding a specified level is detected by the lane change detection unit 38 (S ⁇ b> 17). Specifically, the lane change detection unit 38 detects a lateral movement exceeding a specified value when the turn signal is on and a steering angle exceeding a specified value determined from the vehicle speed detected by the vehicle speed sensor is detected. Judge that
- the periodicity determining unit 37b when not reduce the predetermined threshold value Th 1 at step S16, initializes a threshold value Th 1 that were reduced (S18). Thereby, a periodic stationary object can be appropriately detected according to a change in the environment after the lane change. Then, the process shown in FIG. 7 ends. On the other hand, if the lateral movement of the above provisions is determined not to be detected (S17: NO), the predetermined threshold value Th 1 is processed without being initialized process shown in FIG. 7 is terminated.
- FIG. 9 is a flowchart showing processing of the movement range calculation unit 36 and the periodic stationary object determination unit 37 shown in FIG.
- the movement range calculation unit 36 calculates a stationary equivalent movement amount (S21). That is, the moving range calculation unit 36 calculates the moving range on the bird's-eye image of the periodic stationary object based on the imaging interval of the camera 10 and the moving speed of the host vehicle V detected by the vehicle speed sensor 20. At this time, the movement range calculation unit 36 calculates a movement range having a predetermined margin with respect to the speed of the host vehicle V.
- S21 stationary equivalent movement amount
- the periodic stationary object judgment unit 37 detects the periodic stationary object candidate when the periodic stationary object candidate detection unit 37a detects the periodic stationary object candidate and the detection is performed under a predetermined condition. It is determined that the object candidate is a periodic stationary object. Specifically, the periodic stationary object determination unit 37 determines whether or not the maximum values M and M1 to M3 (histogram peaks) are present within the range of movement amount (within the movement range) calculated in step S21. Judgment is made (S22). When it is determined that any one of the local maximum values M and M1 to M3 exists within the movement amount range (S22: YES), the periodic stationary object determination unit 37 determines that a periodic stationary object exists (periodic stationary object).
- the periodic stationary object candidate detected by the object candidate detection unit 37a is a periodic stationary object (S23). That is, the periodic stationary objects are often arranged at the same interval, and the specific count value tends to increase. In addition, since the periodic stationary object is stationary, the count value of the movement amount candidate should be within the movement range considering the speed of the moving object. Thus, if “YES” is determined in step S22, it can be said that the plurality of three-dimensional objects are periodic stationary objects. Then, the process shown in FIG. 9 ends.
- the periodic stationary object determination unit 37 determines that the periodicity determination unit 37b has periodicity. It is determined whether it has been determined (S24). When it is determined that the periodicity determination unit 37b has not determined that there is periodicity (S24: NO), the periodic stationary object determination unit 37 determines that the three-dimensional object is a moving object (S25). Then, the process shown in FIG. 9 ends.
- the periodic stationary judgment unit 37 detects the aperiodic maxima from the predetermined threshold value Th 1 or more maxima (S26).
- the aperiodic maximum value corresponds to, for example, a maximum value M3 shown in FIG.
- the maximum value M3 is different from the other maximum values M, M1, and M2 in the interval between the adjacent maximum values. For this reason, the periodic stationary object determination unit 37 determines that the maximum value M3 is a non-periodic maximum value having no periodicity.
- the periodic stationary object determination unit 37 indicates that a periodic stationary object exists. Judgment is made (S23).
- the periodic stationary object determination unit 37 determines whether or not the periodic maximum values M, M1, M2 are lower than the previous value ( S27). In this process, the periodic stationary object determination unit 37 calculates the average value of the periodic maximum values M, M1, and M2 in the current process, and also calculates the average value of the periodic maximum values in the previous process. Then, the periodic stationary object determination unit 37 determines whether the average value of the current process is lower than the average value of the previous process by a predetermined value or more.
- the periodic stationary object determination unit 37 determines whether there is another between the vehicle V and the periodic stationary object. It is determined that a vehicle or the like has entered, and a moving object is detected (S25). Then, the process shown in FIG. 9 ends.
- the periodic stationary object determination unit 37 determines the depth of the periodic stationary object from the viewpoint of the host vehicle V. It is determined that another vehicle or the like has entered the side, and a periodic stationary object is detected (S23). Then, the process shown in FIG. 9 ends.
- FIG. 10 is a diagram showing details of step S27 shown in FIG. 9, where (a) shows a case where another vehicle VO has entered the near side of the periodic stationary object, and (b) shows the state of (a). Shows a histogram of when. Also shows a histogram of the time of (c) shows a case where another vehicle V O enters the back side of the periodic stationary object, (d) is (c).
- a broken line indicates a histogram before entering another vehicle
- a solid line indicates a histogram after entering another vehicle.
- the other vehicle V O on the front side of the periodic stationary object enters.
- the periodic stationary object is shielded by another vehicle V O, as shown in FIG. 10 (b)
- the count value of the periodic maxima tends to decrease.
- the periodic stationary object determination unit 37 detects the other vehicle V O (moving object).
- the other vehicle V O to the back side of the periodic stationary object is to enters. In this case, it is not blocked periodically stationary object by another vehicle V O. Therefore, the count value of the periodic maximum value is hardly affected, and the count value of the periodic maximum value is not so small. If another vehicle V O to the back side of the periodic stationary object enters, since the vehicle V is not present other vehicle V O lane changeable position, in such a case, the periodic stationary judgment unit 37 Detects periodic stationary objects.
- a three-dimensional image is generated on the image data of the difference image from the image data of the difference image in the rear side area (predetermined area) in the bird's-eye view image.
- the ground contact points (feature points) of the three-dimensional object are extracted for each area where the object is determined to exist (for each of a plurality of small areas included in the predetermined area), and the distribution of the ground contact points in the rear side area on the bird's eye image Histogram (waveform data) corresponding to is calculated, and based on whether or not the peak information of the histogram (peak value, number of votes of peak interval, etc.) is equal to or greater than a predetermined threshold, It is determined whether the three-dimensional object is a periodic stationary object candidate. For this reason, according to the periodic stationary object detection device 1 and the periodic stationary object detection method, the periodicity (repeatability) of the periodic stationary object can be more clearly extracted as the peak information of the waveform data. Periodic stationary object candidates can be more easily extracted from the three-dimensional objects included in the image. This makes it possible to extract a periodic stationary object with higher accuracy.
- periodic stationary objects In many periodic stationary objects, stationary objects having a similar appearance are arranged at substantially equal intervals. When such a periodic stationary object is imaged by a moving imaging apparatus, it is difficult to determine which part of the periodic image corresponds to each element of the periodic stationary object in the previous image. In this case, it is difficult to determine whether the captured periodic stationary object is a stationary object or a moving object. Furthermore, depending on conditions such as the moving speed of the moving body, the imaging interval of the imaging device, and the pitch of the periodic stationary object, the periodic stationary object may be mistaken as a moving object. According to the periodic stationary object detection device 1 and the periodic stationary object detection method according to the present embodiment, as described above, it is possible to extract a periodic stationary object more accurately from the three-dimensional object included in the captured image. Thus, it is possible to prevent a periodic stationary object from being mistaken as a moving object.
- the periodic stationary object generates a differential region that periodically exists on the differential image. It is difficult to calculate the amount of movement by associating each periodic difference region with which part in the previous image corresponds to each of the periodic difference regions, and it is difficult to determine whether the region is a stationary object.
- the periodic stationary object detection device 1 and the periodic stationary object detection method according to the present embodiment the movement amount candidates of a plurality of detected solid objects are calculated, and the calculated movement amount candidates are counted. Thus, counting is performed in a state where it is unknown which part of each difference area corresponds to which part in the previous image.
- the plurality of three-dimensional objects are periodic stationary objects.
- the periodic stationary objects are often arranged at the same interval, and the specific count value tends to increase.
- the count value of the movement amount candidate should be within the movement range considering the speed of the moving object. Therefore, it can be said that a plurality of three-dimensional object in the specific case of the count value falls within the moving range in consideration of the speed of the moving object is the predetermined threshold value Th 1 or more is periodic stationary object. Therefore, the periodic stationary object can be detected with higher accuracy.
- the periodic stationary object detection device 1 and the periodic stationary object detection method according to the present embodiment a plurality of movement amount candidates are calculated for each three-dimensional object, and therefore the movement amount of the three-dimensional object is uniquely determined.
- the periodic stationary object detection device 1 and the periodic stationary object detection method according to the present embodiment in order to obtain the predetermined threshold Th 1 from the maximum value M of the counted values, even if the size of the count value by positional relationship and sunshine conditions got changed it is possible to set an appropriate threshold Th 1.
- the periodicity is determined from the generation positions of the maximum values M and M1 to M3 of the counted values, and the periodicity is determined. to reduce the predetermined threshold value Th 1 when it is determined that there is, it is possible to easily determine the periodic stationary once periodicity is determined. Meanwhile, until once the periodicity it is determined it is possible to suppress erroneous detection of the three-dimensional object resulting from the error of alignment without lowering the predetermined threshold value Th 1.
- the generation positions of the maximum values M, M1 to M3 that are equal to or greater than the predetermined threshold Th 1 based on the maximum value M of the count value Therefore, it is possible to ignore a local maximum value having a relatively small value, and it is difficult to be influenced by noise, so that the periodicity can be determined with higher accuracy.
- the detected lateral movement of the above provisions and, if you have reduced the predetermined threshold value Th 1, lowering to initialize the threshold value Th 1 was, can be the vehicle V becomes to be initialized when changing lanes, to detect the proper periodic stationary object according to changes in the environment after the lane change.
- the predetermined threshold value Th 1 excluding the maximum values M, M1, and M2 determined to be periodic in the current process.
- the average of the maximum values M, M1, M2 determined to have periodicity in the current process is the average of the maximum values when it is determined that there is periodicity in the previous process. If it is not smaller than the value by a predetermined value or more, it is determined that the plurality of solid objects are periodic stationary objects. On the other hand, when it is smaller than the predetermined value, it is determined that there is a moving object.
- a predetermined threshold value Th 1 or more maxima M3 excluding the maximum value M, M1, M2 it is determined that there is periodicity in the current process has been detected, for example, other vehicles such as angle of view It is assumed that the vehicle entered inside. In such a case, it is assumed that another vehicle or the like has entered the back side of the periodic stationary object as viewed from the host vehicle V and that the vehicle has entered the near side.
- the periodic maximum values M, M1, and M2 due to the periodic stationary object are hardly affected, and the aperiodic maximum value M3 tends to be detected.
- the periodic stationary object is blocked by the other vehicle or the like, so that the count values of the periodic maximum values M, M1, and M2 tend to be small.
- the average value of the maximum values M, M1, M2 determined to have periodicity in the current process is not smaller than a predetermined value than the average value of the local maximum values determined to have periodicity in the previous process With other vehicles etc. located in the back of the periodic stationary object which is not a position which can change lanes, it is not necessary to detect moving objects, such as the other vehicles concerned.
- the average value of the maximum values M, M1, M2 determined to have periodicity in the current process is smaller than the average value of the local maximum values determined to have periodicity in the previous process by a predetermined value or more. Since a vehicle or the like exists on the near side of the periodic stationary object that is a position where the lane can be changed, a moving object is detected.
- the periodic stationary object detection device 1 and the periodic stationary object detection method according to the present embodiment it is possible to make an appropriate determination according to an actual phenomenon.
- the captured image at the current time and the image one hour before are converted into a bird's-eye view and the converted bird's-eye view is aligned, and the difference image PD t is generated.
- the image one hour before may be converted into a bird's-eye view, and the converted bird's-eye view may be converted into an equivalent to an image captured again, and a difference image may be generated from this image and the image at the current time. That is, if the current image and the previous image are aligned, and the difference image PD t is generated from the difference between the two images that have been aligned, the bird's-eye view does not necessarily have to be generated clearly.
- FIG. 11 is a schematic configuration diagram of the periodic stationary object detection device 2 according to the present embodiment. This embodiment has shown the example in case the periodic stationary object detection apparatus 2 is mounted in the own vehicle V.
- the periodic stationary object detection device 2 includes a camera 10 and a calculator 40.
- FIG. 12 is a diagram showing an imaging range of the camera 10 shown in FIG. As shown in FIG. 12, the camera 10 images the rear side region of the host vehicle V at a predetermined angle of view a, as in the first embodiment.
- the angle of view a of the camera 10 is set so that the imaging range of the camera 10 includes the adjacent lane or roadside in addition to the lane in which the host vehicle V travels.
- the computer 40 executes various processes on the parts in the periodic stationary object detection areas A 1 and A 2 in the captured image captured by the camera 10. Thereby, the computer 40 determines whether or not the three-dimensional object existing in the detection areas A 1 and A 2 is a periodic stationary object.
- the detection areas A 1 and A 2 are rectangular when viewed from above.
- the positions of the detection areas A 1 and A 2 may be set from a relative position with respect to the host vehicle V, or may be set based on the position of the white line using an existing white line recognition technique or the like.
- the shape of the detection areas A 1 and A 2 on the bird's-eye view image is not limited to a rectangular shape. When the rectangular area in the real space is used as the detection area, the shapes of the detection areas A 1 and A 2 on the bird's-eye view image may be trapezoidal.
- the sides (sides along the traveling direction) of the detection areas A 1 and A 2 on the own vehicle V side are set as the ground lines L 1 and L 2 .
- the ground lines L 1 and L 2 mean lines on which the other vehicle V O existing in the lane adjacent to the lane in which the host vehicle V travels or a periodic stationary object present on the road side contacts the ground.
- the vehicle traveling direction of the distance from the rear end of the vehicle V to the front end portion of the detection area A 1, A 2, the detection area A 1, A 2 are determined to fit in at least the camera 10 within the angle of view a of . Further, the length of the detection areas A 1 and A 2 in the vehicle traveling direction and the width in the direction orthogonal to the vehicle traveling direction are determined based on the size of the periodic stationary object to be detected. In the present embodiment, in order to distinguish between the other vehicle V O periodic stationary, the length in the vehicle traveling direction is set to a length which may include at least another vehicle V O.
- the width in the direction orthogonal to the vehicle traveling direction is a length that does not include a lane that is further adjacent to the left and right adjacent lanes in the bird's-eye view image (that is, a lane that is adjacent to two lanes).
- FIG. 13 is a block diagram showing details of the computer 40 shown in FIG.
- the computer 40 includes a viewpoint conversion unit 41, an edge distribution calculation unit 42, a counting unit 43, a periodic stationary object candidate detection unit 44, and a periodic stationary object determination unit 45.
- the computer 40 is a computer composed of a CPU, RAM, ROM, and the like.
- the computer 40 performs image processing and the like in accordance with a preset program, so that a viewpoint conversion unit 41, an edge distribution calculation unit 42, a counting unit 43, a periodic stationary object candidate detection unit 44, a periodic stationary object determination unit 45, and the like. Implement the functions of each part.
- the viewpoint conversion unit 41 inputs captured image data of a predetermined area obtained by imaging with the camera 10.
- the viewpoint conversion unit 41 performs viewpoint conversion processing on the bird's-eye image data in a bird's-eye view state on the input captured image data.
- the bird's-eye view is a state seen from the viewpoint of a virtual camera looking down from the sky, for example, vertically downward (or slightly obliquely downward).
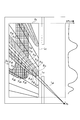
- FIG. 14 is a diagram illustrating detailed operations of the edge distribution calculation unit 42, the counting unit 43, the periodic stationary object candidate detection unit 44, and the periodic stationary object determination unit 45.
- FIG. 14 is illustrated and described only the vehicle traveling direction right including the detection area A 1, the edge distribution calculating unit 42, count portion 43, the periodic stationary object candidate detection unit 44, and the periodic stationary object determination part 45 performs the same processing with respect to the vehicle traveling direction left region including the detection area a 2.
- the edge distribution calculation unit 42 includes an edge element extraction unit 42a and an edge distribution waveform calculation unit 42b.
- the edge element extraction unit 42a is a bird's-eye image data whose viewpoint is converted by the viewpoint conversion unit 41 in order to detect a component of an edge of a periodic stationary object included in the bird's-eye image (hereinafter referred to as an edge element (feature point)).
- an edge element feature point
- a luminance difference is calculated. For each of a plurality of positions along a vertical imaginary line extending in the vertical direction in the real space, the edge element extraction unit 42a calculates a luminance difference between two pixels in the vicinity of each position.
- the edge element extraction unit 42a applies the first vertical virtual line corresponding to the line segment extending in the vertical direction in the real space and the line segment extending in the vertical direction in the real space with respect to the bird's-eye view image converted from the viewpoint.
- the corresponding second vertical imaginary line is set.
- the edge element extraction unit 42a continuously obtains a luminance difference between a point on the first vertical imaginary line and a point on the second vertical imaginary line along the first vertical imaginary line.
- the edge distribution waveform calculation unit 42b integrates the number of edge elements extracted by the edge element extraction unit 42a for each of a plurality of vertical virtual lines, and calculates an edge distribution waveform based on the integrated number of edge elements.
- Edge element extraction unit 42a corresponds to the line segment extending in the vertical direction from a point on the ground line L 1 in the real space, and the first virtual vertical line passing through the detection area A 1 L
- a plurality of ai (hereinafter referred to as attention line L ai ) are set.
- the edge element extraction unit 42a corresponds to each of the plurality of attention lines L ai , corresponds to a line segment extending in the vertical direction from a point on the ground line L 1 in real space, and passes through the detection region A 1 .
- a plurality of second vertical virtual lines L ri (hereinafter referred to as reference lines L ri ) are set.
- Each reference line L ri is set at a position that is separated from the corresponding attention line L ai in real space by a predetermined distance (for example, 10 cm).
- the line corresponding to the line segment extending in the vertical direction in the real space is a line radiating from the position P S of the camera 10 in the bird's-eye view image.
- the edge element extraction unit 42a sets a target point P aj on each attention line L ai.
- attention points P a1 to P a8 are set, but the number of attention points P aj is not particularly limited.
- the edge element extraction unit 42a sets a plurality of reference points P rj corresponding to the attention point P aj on each reference line L ri . Together with the corresponding reference points P rj and attention point P aj, it is set to substantially the same height in the real space. Note that the point of interest P aj and the reference point P rj do not necessarily have the exact same height, and of course, an error that allows the point of interest P aj and the reference point P rj to be regarded as the same height is allowed. It is.
- Edge element extracting section 42a are each the luminance difference between the corresponding target point P aj and the reference point P rj, continuously determined along each attention line L ai.
- the edge element extraction unit 42a calculates a luminance difference between the first attention point P a1 and the first reference point P r1, and the second attention point P a2 and the second reference point P A luminance difference is calculated from r2 .
- the luminance difference between the third to eighth attention points P a3 to P a8 and the third to eighth reference points P r3 to P r8 is sequentially obtained.
- Edge element extraction unit 42a determines that the brightness difference between the reference points P rj and attention point P aj is the case is not less than a predetermined value, the edge component is present between the reference point P rj and attention point P aj. In this manner, the edge element extraction unit 42a functions as a feature point extraction unit that extracts edge elements (feature points) existing along the vertical imaginary line for each of a plurality of vertical imaginary lines extending in the vertical direction in the real space. To do.
- the edge element extraction unit 42a obtains a three-dimensional object for each of a plurality of small regions (for a plurality of regions near the vertical virtual line) included in the predetermined region from image data of a predetermined region (detection region) of the bird's-eye view image. Feature points (edge elements) are extracted.
- the edge distribution waveform calculation unit 42b counts how many edge elements extracted by the edge element extraction unit 42a exist along the same attention line L ai .
- the edge distribution waveform calculation unit 42b stores the counted number of edge elements as an attribute of each attention line Lai .
- the edge distribution waveform calculation unit 42b executes the process of counting edge elements for all attention lines Lai .
- the length of the portions overlapping with the detection area A 1 of the attention line L ai becomes different depending on the position of the attention line L ai.
- the counted number of edge elements may be normalized by dividing by the length of the overlapping portion of the corresponding attention line Lai .
- the other vehicle V O is reflected in the detection area A 1.
- Attention line L ai is set to the rubber portion of the tire of the other vehicle V O, it is assumed that the reference line L ri is set therefrom 10cm equivalent apart tire on the wheel.
- the first attention point P a1 and the first reference point P r1 are located in the same tire portion, the luminance difference between them is small.
- the second to eighth attention points P a2 to P a8 are located in the rubber part of the tire, and the second to eighth reference points P r2 to P r8 are located in the wheel part of the tire. The brightness difference becomes large.
- the edge element extraction unit 42a performs the second to eighth attention points. It is detected that an edge element exists between P a2 to P a8 and the second to eighth reference points P r2 to P r8 . Since there are seven second to eighth attention points P a2 to P a8 along the attention line L ai , the edge element extraction unit 42a detects the edge element seven times. At this time, the edge distribution waveform calculation unit 42b sets the count value of the edge element to “7”.
- edge distribution waveform calculation unit 42b graphs the edge element count values obtained for each attention line Lai to obtain an edge distribution waveform (waveform data).
- edge distribution waveform calculation unit 42b is a vertical axis, the count value of the edge elements, on a plane the position on the ground line L 1 of the attention line L ai and the horizontal axis in the real space, the edge elements Plot the count value.
- the edge element count value obtained for each attention line L ai is used as the attention line L 1. only arranged in order of a1 ⁇ L an, it is possible to obtain a waveform of edge distribution.
- the other vehicle V O of the attention line L ai set in the rubber portion of the tire, at a position intersecting the ground line L 1 on the bird's-eye image the count value of the edge component is "7" It has become.
- the edge distribution waveform calculation unit 42b adds the number of edge elements extracted by the edge element extraction unit 42a for each of a plurality of vertical virtual lines extending in the vertical direction in the real space, and obtains the number of edge elements integrated. It functions as a waveform data calculation unit that calculates an edge distribution waveform (waveform data) based on it. In other words, the edge distribution waveform calculation unit 42b generates waveform data corresponding to the distribution of feature points (edge elements) in a predetermined area (detection area) on the bird's-eye view image (based on the relative positional relationship between the edge elements). calculate.
- the count unit 43 detects the peak of the edge distribution waveform calculated by the edge distribution waveform calculation unit 42b of the edge distribution calculation unit 42.
- the peak is a point at which the count value of the edge element turns from increasing to decreasing on the edge distribution waveform.
- the count unit 43 performs peak detection after performing noise removal processing on the edge distribution waveform using, for example, a low-pass filter, a moving average filter, or the like.
- a peak having a value equal to or greater than a predetermined threshold may be detected as a peak.
- the predetermined threshold value can be set to a value that is 60% of the maximum value of the edge distribution waveform, for example.
- the counting unit 43 counts the number of peaks (peak information) arranged at equal intervals among the detected peaks. Specifically, the count unit 43 calculates the distance between the detected peaks, extracts peaks whose calculated peak distance is within a predetermined range, and counts the number of the peaks.
- the “predetermined range” of the peak-to-peak distance may be a fixed value set in advance according to the type of the periodic stationary object to be detected, or may be set based on the peak-to-peak distance continuously detected for a predetermined time or more. It may be a variable value.
- the count unit 43 sometimes detects the peak detected from the edge distribution waveform by skipping the previously detected peak. In this case, the peak interval is detected with a size such as twice or three times the actual interval.
- the “predetermined range” is set so as to include a value corresponding to a multiple of the peak interval to be extracted. For example, when the peak interval to be extracted is X, the “predetermined range” of the peak-to-peak distance is set to X ⁇ 10 percent, 2X ⁇ 20 percent, and 3X ⁇ 30 percent.
- the count unit 43 functions as a peak information detection unit that detects peak information of waveform data.
- the periodic stationary object candidate detection unit 44 determines whether the three-dimensional object having the extracted edge element is periodically based on whether or not the number of peaks (peak information) counted by the counting unit 43 is equal to or greater than a predetermined threshold Th 2. It is judged whether it corresponds to a target stationary object candidate. Specifically, periodic stationary object candidate detection unit 44, when the number of peaks counted 43 has counted is the predetermined threshold value Th 2 or more, counted counterparts periodic stationary object candidate to each peak It is determined that Threshold Th 2, for example, pylon, guardrail legs, such as a telephone pole, a value determined according to the type of periodic stationary object to be detected can be determined through experimentation or the like. Specifically, the threshold Th 2 is set to a value of 3 to 100, for example.
- the periodic stationary object determination unit 45 determines that the periodic stationary object candidate is a periodic stationary object when the periodic stationary object candidate is continuously detected for a predetermined time. Specifically, when the state where the number of peaks is equal to or greater than the predetermined threshold value Th 2 is continuously detected by the periodic stationary object candidate detection unit 44 for a predetermined time, the periodic stationary object determination unit 45 detects It is determined that the possibility that the periodic stationary object candidate is a periodic stationary object is sufficiently high. Then, the periodic stationary object determination unit 45 determines that the object corresponding to each counted peak is a periodic stationary object.
- the “predetermined time” is a value determined according to the type of the periodic stationary object that is the detection target, and can be obtained through an experiment or the like. It may be a fixed value or may be varied according to the imaging interval of the camera 10 or the moving speed of the host vehicle V. Specifically, the “predetermined time” is set to 0.1 to 5 seconds, for example.
- 15 and 16 are flowcharts showing details of the periodic stationary object detection method according to the present embodiment. Note that in FIG. 15 and FIG. 16, for convenience, a description will be given of a process directed to the detection area A 1, can be processed in the same manner for the detection area A 2.
- step S ⁇ b> 31 the viewpoint conversion unit 41 inputs captured image data of a predetermined area obtained by imaging with the camera 10, performs viewpoint conversion processing on this, and obtains a bird's-eye view image. Create data.
- Edge distribution calculating section 42 sets a line segment extending in the vertical direction from a point on the ground line L 1 in the real space to the attention line L ai.
- the edge distribution calculating section 42 corresponds to the line segment extending in the vertical direction from a point on the ground line L 1 in the real space, and the line segment spaced from the corresponding attention line L ai predetermined distance in the real space Set to reference line L ri .
- the edge distribution calculating unit 42 in step S33, the k sets a k-number of target point P aj on each attention line L ai, on each reference line L ri, corresponding to each point of interest P aj
- Edge distribution calculating section 42, the corresponding point of interest P aj and the reference point P rj each other is set to be substantially the same height in the real space.
- the edge distribution calculating unit 42 in step S34, the luminance difference between corresponding point of interest P aj and the reference point P rj each other is equal to or greater than a predetermined value. If the luminance difference is equal to or more than the predetermined value, the edge distribution calculation unit 42 determines that the edge elements are present between the reference point P rj and attention point P aj became determination target, to step S35 Te, assigns "1" to the count value of the i-th attention line L ai (bincount (i)) . In step S34, if it is determined that the brightness difference is less than a predetermined value, the edge distribution calculating section 42, the absence of the edge elements between the reference point P rj and attention point P aj became determined target Judge and proceed to step S36.
- step S36 the edge distribution calculation unit 42 determines whether or not the process of step S34 has been executed for all the attention points Paj on the attention line L ai that is the current processing target. When it is determined that the process of step S34 has not been executed for all the attention points Paj , the edge distribution calculation unit 42 returns the process to step S34, and the next attention point Paj + 1 and the reference point Prj. A luminance difference from +1 is obtained, and it is determined whether or not the luminance difference is equal to or greater than a predetermined value. In this way, the edge distribution calculation unit 42 sequentially obtains the luminance difference between the attention point P aj and the reference point P rj along the attention line L ai , and the obtained luminance difference is predetermined. When the value is greater than or equal to the value, it is determined that an edge element exists.
- Edge distribution calculating unit 42 at step S35, after substituting "1" to the count value of the i-th attention line L ai (bincount (i)) , the process proceeds to step S37, where the next target A luminance difference between the point P aj + 1 and the reference point P rj + 1 is obtained, and it is determined whether or not the luminance difference is a predetermined value or more. When it is determined that the luminance difference is equal to or greater than the predetermined value, the edge distribution calculation unit 42 determines that an edge element exists between the target point P aj + 1 and the reference point P rj + 1 that are the determination targets. at step S38, the count value of the i-th attention line L ai (bincount (i)) to count up.
- step S37 If it is determined in step S37 that the luminance difference is less than the predetermined value, the edge distribution calculation unit 42 has an edge element between the target point P aj + 1 and the reference point P rj + 1 as the determination target. Is determined not to exist, step S38 is skipped, and the process proceeds to step S39.
- step S39 the edge distribution calculation unit 42 determines whether or not the processing of step S34 or step S37 has been executed for all the attention points P aj on the attention line L ai that is the current processing target. . If it is determined that the above processing has not been executed for all the attention points P aj , the edge distribution calculation unit 42 returns the process to step S37 and the next attention point P aj + 1 and the reference point P rj +. A luminance difference from 1 is obtained, and it is determined whether or not the luminance difference is a predetermined value or more. If it is determined in step S39 that the above processing has been executed for all the points of interest Paj , the edge distribution calculation unit 42 proceeds to step S41. In this way, the edge distribution calculation unit 42 counts how edge elements exist many pieces along the same attention line L ai, the number of counted edge elements, attributes of the attention line L ai (bincount ( Store as i)).
- step S36 When it is determined in step S36 that the process of step S34 has been performed on all the attention points Paj , the edge distribution calculation unit 42 has edge elements on the attention line Lai that is the current processing target. Judge that it does not exist. In step S40, the edge distribution calculation unit 42 substitutes “0” for bincount (i), and proceeds to step S41.
- step S41 the edge distribution calculation unit 42 determines whether or not the above processing has been performed for all n attention lines L ai . If it is determined that the above processing has not been performed for all the attention lines L ai , the edge distribution calculation unit 42 returns the processing to step S34 and performs the above processing for the next attention line L ai + 1. Execute. If it is determined in step S41 that the above processing has been executed for all the attention lines Lai , the edge distribution calculation unit 42 proceeds to step S42.
- the count unit 43 detects the peak of the edge distribution waveform calculated by the edge distribution calculation unit 42.
- step S44 the counting unit 43 calculates the distance between the detected peaks.
- step S45 the counting unit 43 extracts peaks whose calculated peak distance is within a predetermined range and counts the number of peaks.
- step S46 the periodic stationary object candidate detection unit 44, the number of peaks counted 43 has counted is equal to or the predetermined threshold value Th 2 or more. If the number of peaks is determined to be a predetermined threshold value Th 2 or more, the periodic stationary object candidate detection unit 44, those corresponding to the peaks counted is determined that the periodic stationary object candidate, step S47 Proceed with the process.
- the periodic stationary determining unit 45 the state number of peaks is the predetermined threshold value Th 2 or more is determined whether or not continuously detected a predetermined number of times or more.
- the periodic stationary object determination unit 45 detects that the object corresponding to each counted peak is periodically stationary.
- “1” is substituted for the flag f_shuki.
- step S47 the If the condition number of peaks is the predetermined threshold value Th 2 or more is judged not to be detected continuously more than a predetermined number of times, periodic stationary evaluation unit 45 skips step S48 , Maintain the value of the flag f_shuki. Thereafter, the processing in FIGS. 15 and 16 is terminated.
- step S46 if the number of peaks is determined to be less than the predetermined threshold value Th 2, periodic stationary object candidate detection unit 44, the process proceeds to step S49.
- the periodic stationary determining unit 45 determines whether it is detected continuously more than a predetermined number of times. When it is determined that the state where the number of peaks is less than the predetermined threshold Th 2 has been continuously detected a predetermined number of times or more, the periodic stationary object determination unit 45 determines that the object corresponding to each counted peak is periodically stationary. In step S50, “0” is substituted for the flag f_shuki.
- step S49 the If the condition number of peaks is less than a predetermined threshold value Th 2 is determined not to be detected continuously more than a predetermined number of times, periodic stationary evaluation unit 45 skips step S50 , Maintain the value of the flag f_shuki. Thereafter, the processing in FIGS. 15 and 16 is terminated.
- a plurality of vertical virtual line neighborhood areas (small areas) included in the predetermined area from image data of the predetermined area of the bird's eye image.
- the edge element (feature point) of the three-dimensional object is extracted every time, the edge distribution waveform (waveform data) corresponding to the distribution of the edge element in the predetermined area is calculated, and the number of peaks (peak information) of the edge distribution waveform is calculated. It is determined whether or not the three-dimensional object having the extracted edge element is a periodic stationary object candidate based on whether or not it is greater than or equal to a predetermined threshold value.
- the periodicity (repeatability) of the periodic stationary object can be more clearly extracted as the peak information of the waveform data, and the period can be extracted from the three-dimensional object included in the captured image.
- Target stationary object candidates can be extracted more easily. This makes it possible to extract a periodic stationary object with higher accuracy.
- an edge element that exists along the vertical imaginary line for each of a plurality of vertical imaginary lines extending in the vertical direction in real space is obtained based on the accumulated number of edge elements. Then, it is determined that when the number of peaks of the edge distribution waveform is the predetermined threshold value Th 2 or more, three-dimensional object having the extracted edge elements are periodic stationary object candidate. For this reason, even if it is not determined whether the detected three-dimensional object is a stationary object or a moving object, the case where the edges extending in the vertical direction are arranged with high density can be reliably detected, and the periodic stationary object can be detected. Periodic stationary object candidates that are more likely to be present can be detected more easily.
- the number of peaks arranged at equal intervals among the peaks of the edge distribution waveform is counted. For this reason, the edges extending in the vertical direction are arranged at high density and at equal intervals, and the periodic stationary object candidate that is more likely to be a periodic stationary object can be detected more reliably.
- the periodic stationary object candidate when the periodic stationary object candidate is continuously detected for a predetermined time, the periodic stationary object candidate is a period. It is determined to be a static stationary object. For this reason, it is possible to prevent erroneous detection due to noise and to detect the periodic stationary object more reliably.
- the schematic configuration of the periodic stationary object detection device 3 according to the present embodiment is the same as that of the periodic stationary object detection device 1 shown in FIG. 1, but includes a computer 40 ′ instead of the computer 30. That is, the periodic stationary object detection device 3 according to the present embodiment includes a camera 10, a vehicle speed sensor 20, and a calculator 40 '.
- FIG. 17 is a block diagram showing details of the computer 40 'according to the present embodiment.
- the computer 40 ′ includes a viewpoint conversion unit 41, an edge distribution calculation unit 42, a count unit 43 ′, a periodic stationary object candidate detection unit 44, a registration unit 51, and a difference calculation unit. 52 and a periodic stationary object determination unit 53.
- the computer 40 ' is a computer composed of a CPU, RAM, ROM, and the like.
- the computer 40 ′ performs image processing and the like according to a preset program, whereby a viewpoint conversion unit 41, an edge distribution calculation unit 42, a counting unit 43 ′, a periodic stationary object candidate detection unit 44, a positioning unit 51, a difference
- a viewpoint conversion unit 41 an edge distribution calculation unit 42
- a counting unit 43 ′ a counting unit 43 ′
- a periodic stationary object candidate detection unit 44 a positioning unit 51
- a difference The functions of each unit such as the calculation unit 52 and the periodic stationary object determination unit 53 are realized.
- the counting unit 43 ′ in the present embodiment detects the peak of the edge distribution waveform calculated by the edge distribution calculating unit 42 and counts the number thereof.
- the counting unit 43 ′ is different from the counting unit 43 in the second embodiment in that the number of peaks is counted without excluding peaks whose distance between peaks is outside the predetermined range.
- Periodic stationary object candidate detection unit 44 the number of peaks counted 43 'has counted (peak information) based on whether or not a predetermined threshold Th 3 or more, those periodic stationary for each peak It is determined whether or not it corresponds to an object candidate.
- periodic stationary object candidate detection unit 44 when the number of peaks counted 43 'has counted is the predetermined threshold value Th 3 above, those corresponding to the peak is a periodic stationary object candidate Is determined.
- Threshold Th 3 for example, pylon, guardrail legs, such as a telephone pole, a value determined according to the type of periodic stationary object to be detected can be determined through experimentation or the like.
- the threshold Th 3 is set to a value of 3 or more and 100 or less, for example.
- FIG. 18 is a diagram illustrating a detailed operation of the alignment unit 51.
- the alignment unit 51 sequentially inputs the edge distribution waveform calculated by the edge distribution calculation unit 42, and based on the moving speed of the host vehicle V detected by the vehicle speed sensor 20, the position of the input edge distribution waveform at different times is determined. It is to match. For example, an edge distribution calculation unit 42 and the edge distribution waveform E t-Delta] t which is calculated at time t-Delta] t (second time), the time t edge distribution waveform E t and the positioning unit 51 calculates the (first time) Is input. Then, it is assumed that the edge distribution waveform has moved by ⁇ with respect to the coordinate system due to the movement of the host vehicle V during one time ( ⁇ t).
- the positioning section 51 this time, as shown in FIG. 18, by shifting ⁇ along the edge distribution waveform E t on the horizontal axis, the position of the edge distribution waveform E t, the edge distribution waveform E t-Delta] t Match the position. In this way, the alignment unit 51 obtains the edge distribution waveform E t ′.
- the alignment of the edge distribution waveform corresponds to the attention line Lai corresponding to a point (for example, G1) on one edge distribution waveform and the point (for example, G2) on the other edge distribution waveform.
- the edge distribution waveform is translated so that the horizontal axis coordinate values of the point G1 and the point G2 coincide when the attention line L ai to be present is at the same or substantially the same position in the real space.
- the length of one time ( ⁇ t) may be a predetermined time such as one control cycle, or may be an arbitrary time.
- FIG. 19 is a diagram illustrating a detailed operation of the difference calculation unit 52.
- the difference calculation unit 52 receives the edge distribution waveform E t ′ calculated by the alignment unit 51 and the edge distribution waveform E t ⁇ t, and the distribution of absolute values
- the edge distribution waveform is derived from a periodic stationary object, the edge distribution waveform E t ⁇ t and the edge distribution waveform E t ′ are in good agreement, and therefore the absolute value of the difference
- the periodic stationary object determination unit 53 integrates the absolute value
- the threshold Th 4 is a value determined according to the type of a periodic stationary object that is a detection target, such as a pylon, a guardrail leg, or a utility pole, and can be obtained through an experiment or the like.
- Periodic stationary determining unit 53 when the ratio of the integrated value I D1 for the integral value I 1 (I D1 / I 1 ) is smaller than a predetermined threshold value Th 4 is determined that the periodic stationary object candidate is stationary To do.
- the periodic stationary object determination unit 53 determines that the periodic stationary object candidate is a periodic stationary object when a stationary stationary object candidate is detected continuously for a predetermined time. Specifically, when a state in which the ratio I D1 / I 1 is smaller than a predetermined threshold Th 4 is detected continuously for a predetermined time, the periodic stationary object determination unit 53 determines that the detected periodic stationary object candidate is periodic. Judge that the possibility of a stationary object has become sufficiently high. Then, the periodic stationary object determination unit 53 determines that the object corresponding to each counted peak is a periodic stationary object.
- the “predetermined time” is a value determined according to the type of the periodic stationary object that is the detection target, and can be obtained through an experiment or the like.
- the “predetermined time” is, for example, the reliability of the determination that the periodic stationary object candidate is a periodic stationary object, and the average occurrence interval of measurement errors such as the moving speed of the host vehicle V
- the shorter time is set to 0.1-5 seconds.
- FIG. 20 is a flowchart corresponding to FIG. 16 of the second embodiment, and is a flowchart showing details of the periodic stationary object detection method according to the present embodiment.
- the process from step S31 to step S41 of the periodic stationary object detection method according to the present embodiment is the same as the process from step S31 to step S41 of the second embodiment, illustration and description are omitted.
- a description will be given of a process directed to the detection area A 1, it can be processed in the same manner for the detection area A 2.
- the counting unit 43 In subsequent step S52, the counting unit 43 'detects the peak of the edge distribution waveform calculated by the edge distribution calculating unit 42, and counts the number thereof.
- the periodic stationary object candidate detection unit 44 determines whether a predetermined threshold Th 3 or more. If it is determined that the number of peaks is equal to or greater than the predetermined threshold Th 3 , the periodic stationary object candidate detection unit 44 determines that the object corresponding to each peak is a periodic stationary object candidate, and performs the process in step S54. Proceed. In step S53, when the number of peaks counted 43 'has counted is determined to be less than the predetermined threshold value Th 3 terminates the process of FIG. 20.
- the alignment unit 51 aligns the positions of the edge distribution waveforms at different times input from the edge distribution calculation unit 42 based on the moving speed of the host vehicle V detected by the vehicle speed sensor 20. Specifically, when the edge distribution waveform has moved by ⁇ with respect to the coordinate system of the graph due to the movement of the host vehicle V during one time ( ⁇ t), the alignment unit 51 detects the edge distribution waveform.
- the edge distribution waveform E t ′ is obtained by shifting E t by ⁇ along the horizontal axis.
- step S55 the difference calculation unit 52 calculates the absolute value
- the periodic stationary object determination unit 53 calculates the integral value I 1 of the edge distribution waveform E t ′ in step S56, and in the subsequent step S57, the integral value of the absolute value
- step S58 the ratio of the integrated value I D1 for the integral value I 1 a (I D1 / I 1) is calculated, and whether the value is a predetermined threshold value Th 4 is smaller than Based on the above, it is determined whether or not the periodic stationary object candidate detected by the periodic stationary object candidate detection unit 44 is stationary.
- the periodic stationary object determination unit 53 determines that the periodic stationary object candidate is stationary, and proceeds to step S59.
- step S59 the periodic stationary object determination unit 53 determines whether or not the state in which the ratio I D1 / I 1 is smaller than the predetermined threshold Th 4 has been continuously detected for a predetermined number of times, that is, has been continuously detected for a predetermined time. Judge whether or not. When it is determined that a state in which the ratio I D1 / I 1 is smaller than the predetermined threshold Th 4 has been continuously detected a predetermined number of times or more, the periodic stationary object determination unit 53 determines that the object corresponding to each counted peak is a period. In step S60, “1” is assigned to the flag f_shuki.
- step S59 if it is determined in step S59 that a state in which the ratio I D1 / I 1 is smaller than the predetermined threshold Th 4 has not been continuously detected for a predetermined number of times, the periodic stationary object determination unit 53 performs step S59. By skipping, the value of the flag f_shuki is maintained. Thereafter, the process of FIG.
- step S58 If it is determined in step S58 that the ratio I D1 / I 1 is greater than or equal to the predetermined threshold Th 4 , the periodic stationary object determination unit 53 advances the process to step S61.
- step S61 the periodic stationary object determination unit 53 determines whether or not a state in which the ratio I D1 / I 1 is equal to or greater than a predetermined threshold Th 4 is continuously detected a predetermined number of times or more.
- the periodic stationary object determination unit 53 determines that the object corresponding to each counted peak is It is determined that the object is not a periodic stationary object, and “0” is substituted for the flag f_shuki in step S62.
- step S61 when it is determined in step S61 that the state where the ratio I D1 / I 1 is equal to or greater than the predetermined threshold Th 4 has not been detected continuously for a predetermined number of times, the periodic stationary object determination unit 53 performs step S62. Is skipped and the value of the flag f_shuki is maintained. Thereafter, the process of FIG.
- the periodic stationary object detection device 3 and the periodic stationary object detection method from the image data of the predetermined area of the bird's-eye view image, a plurality of vertical virtual line neighborhood areas (small areas) included in the predetermined area
- the edge element (feature point) of the three-dimensional object is extracted every time, the edge distribution waveform (waveform data) corresponding to the distribution of the edge element in the predetermined area is calculated, and the number of peaks (peak information) of the edge distribution waveform is calculated. It is determined whether or not the three-dimensional object having the extracted edge element is a periodic stationary object candidate based on whether or not it is greater than or equal to a predetermined threshold value.
- the periodicity (repeatability) of the periodic stationary object can be more clearly extracted as the peak information of the waveform data, and the 3D included in the captured image Periodic stationary object candidates can be extracted more easily from objects. This makes it possible to extract a periodic stationary object with higher accuracy.
- the periodic stationary object detection device 3 and the periodic stationary object detection method according to the present embodiment for each of a plurality of vertical virtual lines extending in the vertical direction in the real space, a vertical virtual line is detected.
- the number of edge elements existing along the line is integrated, and an edge distribution waveform is obtained based on the integrated number of edge elements.
- Th 2 the predetermined threshold value
- the detected three-dimensional object is a stationary object or a moving object, it is reliably detected that the edges extending in the vertical direction are arranged at high density.
- the periodic stationary object detection device 3 and the periodic stationary object detection method according to the present embodiment based on the moving speed of the moving body, the position of the edge distribution waveform E t at time t, the time t-Delta] t according to the position of the edge distribution waveform E t-Delta] t at, aligned edges distributed waveform E t ', the difference between the distribution waveform between the edge distribution waveform E t-Delta] t at time t- ⁇ t
- is calculated.
- is integrated to calculate an integral value I D1
- the aligned edge distribution waveform E t ′ is integrated to calculate an integral value I 1 .
- the ratio of the integrated value I D1 for the integral value I 1 a (I D1 / I 1) was calculated, based on the value of the ratio is in whether or not a predetermined threshold Th 4 is smaller than the periodic stationary object candidate is stationary It is determined whether or not. For this reason, it is possible to detect stationary periodic stationary object candidates that are more likely to be periodic stationary objects, and it is possible to more easily and reliably detect periodic stationary objects.
- the periodic stationary object detection device 3 and the periodic stationary object detection method according to the present embodiment when it is detected continuously that the periodic stationary object candidate is stationary for a predetermined time, the periodic stationary object is detected. It is determined that the object candidate is a periodic stationary object. For this reason, it is possible to prevent erroneous detection due to noise and to detect the periodic stationary object more reliably.
- the ratio of the integrated value I D1 for the integral value I 1 a was calculated, based on its value to whether a predetermined threshold value Th 4 is smaller than the periodic stationary object
- the determination method is not limited to this.
- the difference calculation unit 52 calculates the distribution of the absolute value
- the periodic stationary object determination unit 53 integrates the absolute value
- the periodic stationary object candidate detection unit 44 determines whether or not the periodic stationary object candidate is stationary.
- Threshold Th 5 is, for example, pylon, guardrail legs, such as a telephone pole, a value determined according to the type of periodic stationary object to be detected can be determined through experimentation or the like.
- the periodic stationary object determination unit 53 determines that the periodic stationary object candidate is stationary when the ratio of the integrated value I D1 to the integrated value I D2 (I D1 / I D2 ) is smaller than a predetermined threshold Th 5. To do.
- the periodic stationary object determination unit 53 determines that the periodic stationary object candidate is a periodic stationary object when a stationary stationary object candidate is detected continuously for a predetermined time. Specifically, when a state in which the ratio I D1 / I D2 is smaller than a predetermined threshold Th 4 is detected continuously for a predetermined time, the periodic stationary object determination unit 53 determines that the detected periodic stationary object candidate is periodic. Judge that the possibility of a stationary object has become sufficiently high. Then, the periodic stationary object determination unit 53 determines that the object corresponding to each counted peak is a periodic stationary object.
- FIG. 21 is a diagram corresponding to FIGS. 16 and 20 and is a flowchart showing details of the periodic stationary object detection method according to the present modification.
- the process from step S31 to step S41 of the periodic stationary object detection method according to the present modification is the same as the process from step S31 to step S41 in the above-described embodiment, illustration and description thereof are omitted.
- the same processes as those described in the second and third embodiments are denoted by the same reference numerals and the description thereof is omitted.
- step S55 ′ the periodic stationary object determination unit 53 calculates the edge distribution waveform E t calculated by the alignment unit 51 and the edge distribution waveform E t ⁇ . From ⁇ t , a distribution of absolute values
- the periodic stationary object determination unit 53 calculates the integral value I D1 of the absolute value
- periodic stationary determining unit 53 in step S58 ', the ratio of the integrated value I D1 for the integral value I D2 of (I D1 / I D2) is calculated, the value is either predetermined threshold Th 5 is smaller than not Whether or not the periodic stationary object candidate detected by the periodic stationary object candidate detection unit 44 is stationary is determined. If the ratio I D1 / I D2 is determined as the predetermined threshold value Th 5 smaller, periodic stationary determining unit 53 determines that the periodic stationary object candidate is stationary, the process proceeds to step S59. On the other hand, if it is determined in step S58 that I D1 / I D2 is equal to or greater than the predetermined threshold Th 5 , the periodic stationary object determination unit 53 advances the process to step S61.
- the integrated value I D1 is calculated by integrating the first difference distribution waveform
- the ratio of the integrated value I D1 for the integral value I D2 of (I D1 / I D2) is calculated, based on the value of the ratio is in whether or not a predetermined threshold Th 5 is smaller than the period It is determined whether the target stationary object candidate is stationary.
- the above ratio is, since the denominator of the integral value I D2 of the difference between the edge distribution waveform E t-Delta] t in the edge distribution waveform E t and time t-Delta] t at time t, the edge distribution waveform E t, E t-
- the difference between the ratio value when ⁇ t is derived from a moving object and the ratio value when it is derived from a periodic stationary object becomes more prominent, and stationary periodic stationary object candidates can be detected more reliably. .
- the target compared with the predetermined threshold when determining whether or not the periodic stationary object candidate is stationary is the ratio I D1 / I 1 or the ratio I D1 / It is not limited to ID2 .
- the ratio is, for example, the ratio (I D1 / I 2 ) of the integrated value I D1 to the integrated value I 2 of the edge distribution waveform E t , or the integrated value I of the edge distribution waveform E t- ⁇ t calculated at time t- ⁇ t. 3 may be a ratio of the integrated value I D1 to 3 (I D1 / I 3 ).
- the integral values I 1 , I 2 , I 3 , I D1 , and I D2 constituting the denominator of the above ratio are all obtained by integrating the edge distribution waveform or the absolute value of the difference, but the edge distribution. It is good also as what integrated the waveform obtained by squaring each of a waveform or its difference.
- the vehicle speed of the host vehicle V is determined based on a signal from the vehicle speed sensor 20, but the present invention is not limited to this, and the speed may be estimated from a plurality of images at different times. In this case, a vehicle speed sensor becomes unnecessary, and the configuration can be simplified.
- the periodic stationary object detection device and the periodic stationary object detection method of the present invention feature points of a three-dimensional object are extracted for each of a plurality of small areas included in the predetermined area from image data of the predetermined area of the bird's-eye view image. And calculating waveform data corresponding to the distribution of feature points in a predetermined region on the bird's-eye image, and having the extracted feature points based on whether or not the peak information of the waveform data is greater than or equal to a predetermined threshold value. It is determined whether the three-dimensional object is a periodic stationary object candidate.
- the periodicity (repeatability) of the periodic stationary object can be more clearly extracted as the peak information of the waveform data, and the periodic stationary object candidate can be more easily selected from the three-dimensional objects included in the captured image. Can be extracted. This makes it possible to extract a periodic stationary object with higher accuracy.
Landscapes
- Engineering & Computer Science (AREA)
- Physics & Mathematics (AREA)
- General Physics & Mathematics (AREA)
- Multimedia (AREA)
- Theoretical Computer Science (AREA)
- Computer Vision & Pattern Recognition (AREA)
- Image Processing (AREA)
- Image Analysis (AREA)
- Traffic Control Systems (AREA)
- Geophysics And Detection Of Objects (AREA)
Abstract
Description
以下、本発明の好適な実施形態を図面に基づいて説明する。図1は、本発明の第1実施形態に係る周期的静止物検出装置1の概略構成図であって、周期的静止物検出装置1が自車両Vに搭載される場合の例を示している。図1に示す周期的静止物検出装置1は、自車両Vの周囲に存在する周期的静止物を検出するものであって、具体的にはパイロン、ガードレール脚部、電柱などのように路側に周期的に存在する静止物を検出するものである。なお、以下の例では自車両Vを移動体の一例として説明するが、移動体は自車両Vに限らず、二輪車や自転車など他の移動体であってもよい。
本実施形態に係る周期的静止物検出装置1及び周期的静止物検出方法によれば、上記のとおり、撮像画像に含まれる立体物の中からより精度良く周期的静止物を抽出することが可能になり、周期的静止物を移動物として誤認することを防止することが可能になる。
本実施形態に係る周期的静止物検出装置1及び周期的静止物検出方法によれば、検出された複数の立体物の移動量候補を算出し、算出された移動量候補をカウントするため、周期的な差分領域それぞれが前画像においてどの部位に対応するのか不明な状態でカウントすることとなる。そして、カウントされた移動量候補のカウント値のうち、移動体の移動範囲内におけるカウント値が閾値Th1以上であると判断した場合、複数の立体物が周期的静止物であると判断する。ここで、周期的静止物は、同じ間隔で並んでいることが多く、特定のカウント値が大きくなる傾向にある。また、周期的静止物は静止しているため、移動量候補のカウント値は移動体の速度等を考慮した移動範囲内に収まるべきである。よって、移動体の速度等を考慮した移動範囲内に収まる特定のカウント値が所定の閾値Th1以上である場合には複数の立体物が周期的静止物であるといえる。従って、より精度良く周期的静止物を検出することができる。
以下、本発明の第2実施形態を図面に基づいて説明する。なお、第1実施形態において説明したものと同等のものについては、それらと同一の符号を付して説明を省略する。
また、検出領域A1,A2の車両進行方向における長さ及び車両進行方向に直交する方向における幅は、検出対象となる周期的静止物の大きさに基づいて決定される。本実施形態においては、周期的静止物と他車両VOとを区別するため、車両進行方向における長さは、少なくとも他車両VOを含み得る長さに設定される。また、車両進行方向に直交する方向における幅は、鳥瞰画像において左右の隣接車線よりも更に隣接する車線(すなわち2車線隣りの車線)を含まない長さとされる。
エッジ要素抽出部42aは、図14に示すように、実空間で接地線L1上の点から鉛直方向に伸びる線分に該当し、且つ、検出領域A1を通過する第1鉛直仮想線Lai(以下、注目線Laiという)を複数設定する。注目線Laiの本数は特に限定されない。以下の説明では、n本の注目線Lai(i=1~n)が設定されたものとして説明する。
以下、本発明の第3実施形態を図面に基づいて説明する。なお、第1および第2実施形態において説明したものと同等のものについては、それらと同一の符号を付して説明を省略する。
上記第3実施形態では、積分値I1に対する積分値ID1の比(ID1/I1)を計算し、その値が所定の閾値Th4より小さいか否かに基づいて、周期的静止物候補が静止しているか否かを判定したが、判定方法はこれに限らない。
10 カメラ(撮像装置)
20 車速センサ(速度検出器)
30,40 計算機
31,41 視点変換部
32,51 位置合わせ部
33 立体物検出部
34 移動量候補算出部
35,43 カウント部
36 移動範囲算出部
37,45,53 周期的静止物判断部
37a 周期的静止物候補検出部
37b 周期性判定部
38 車線変更検出部(横移動検出部)
42 エッジ分布算出部
44 周期的静止物候補検出部
52 差分算出部
a 画角
PBt 鳥瞰画像
PDt 差分画像
V 自車両
Claims (15)
- 移動体の周囲に存在する周期的静止物を検出する周期的静止物検出装置であって、
前記移動体に搭載されて、前記移動体の周囲を撮像可能な撮像装置と、
前記撮像装置により撮像された画像に対して視点変換処理を行って鳥瞰画像を生成する視点変換部と、
前記鳥瞰画像の所定領域の画像データから、該所定領域に含まれる複数の小領域ごとに立体物の特徴点を抽出する特徴点抽出部と、
前記特徴点抽出部により抽出された特徴点の前記鳥瞰画像上の所定領域内における分布に対応した波形データを算出する波形データ算出部と、
前記波形データのピーク情報を検出するピーク情報検出部と、
前記ピーク情報が所定の第1閾値以上であるか否かに基づいて、前記特徴点抽出部により抽出された特徴点を有する立体物が周期的静止物候補であるか否かを判断する周期的静止物候補検出部と、
前記周期的静止物候補検出部により前記周期的静止物候補が検出され、かつ、その検出が所定の条件の下で為されたとき、当該周期的静止物候補が周期的静止物であると判定する周期的静止物判断部と、
を備えたことを特徴とする周期的静止物検出装置。 - 前記特徴点抽出部は、実空間において鉛直方向に伸びる複数の鉛直仮想線ごとに、当該鉛直仮想線に沿って存在するエッジ要素を抽出し、
前記波形データ算出部は、前記特徴点抽出部により抽出された前記エッジ要素の個数を前記複数の鉛直仮想線ごとに積算し、積算したエッジ要素の個数に基づいてエッジ分布波形を算出し、
前記ピーク情報検出部は、前記波形データ算出部が算出したエッジ分布波形のピークを検出し、検出したピークの個数をカウントするカウント部であり、
前記周期的静止物候補検出部は、前記カウント部がカウントしたピークの個数が所定の第2閾値以上であるとき、前記特徴点抽出部により抽出された特徴点を有する立体物が周期的静止物候補であると判定することを特徴とする請求項1に記載の周期的静止物検出装置。 - 前記カウント部は、前記波形データ算出部が算出したエッジ分布波形のピークを検出し、検出したピークのうち等間隔に並んだピークの個数をカウントすることを特徴とする請求項2に記載の周期的静止物検出装置。
- 前記周期的静止物判断部は、前記周期的静止物候補が所定時間継続して検出されたとき、当該周期的静止物候補が周期的静止物であると判定することを特徴とする請求項1~3に記載の周期的静止物検出装置。
- 前記移動体の移動速度を検出する速度検出器と、
前記速度検出器により検出された移動速度に基づいて、前記波形データ算出部により算出された第1時刻におけるエッジ分布波形の位置を、該第1時刻と異なる第2時刻におけるエッジ分布波形の位置に合わせる位置合わせ部と、
前記位置合わせ部が位置合わせしたエッジ分布波形と、前記第2時刻におけるエッジ分布波形との間の差分の分布波形を算出する差分算出部と、を更に備え、
前記周期的静止物判断部は、前記差分算出部が算出した差分の分布波形を積分して第1の積分値を算出するとともに、第1時刻におけるエッジ分布波形、第2時刻におけるエッジ分布波形、または位置合わせ部が位置合わせしたエッジ分布波形のいずれかを積分して第2の積分値を算出し、前記第2の積分値に対する前記第1の積分値の比を計算し、当該比の値が所定の第3閾値より小さいか否かに基づいて、前記周期的静止物候補が静止しているか否かを判定することを特徴とする請求項2に記載の周期的静止物検出装置。 - 前記移動体の移動速度を検出する速度検出器と、
前記速度検出器により検出された移動速度に基づいて、前記波形データ算出部により算出された第1時刻におけるエッジ分布波形の位置を、該第1時刻と異なる第2時刻におけるエッジ分布波形の位置に合わせる位置合わせ部と、
前記位置合わせ部が位置合わせしたエッジ分布波形と前記第2時刻におけるエッジ分布波形との間の第1差分の分布波形と、前記第1時刻におけるエッジ分布波形と前記第2時刻におけるエッジ分布波形との間の第2差分の分布波形と、を算出する差分算出部と、を更に備え、
前記周期的静止物判断部は、前記第1差分の分布波形を積分して第1の積分値を算出するとともに、前記第2差分の分布波形を積分して第2の積分値を算出し、第2の積分値に対する第1の積分値の比を計算し、当該比の値が所定の第4閾値より小さいか否かに基づいて、前記周期的静止物候補が静止しているか否かを判定することを特徴とする請求項2に記載の周期的静止物検出装置。 - 前記周期的静止物判断部は、前記周期的静止物候補が静止していることを所定時間継続して検出したとき、当該周期的静止物候補が周期的静止物であると判定することを特徴とする請求項5または6に記載の周期的静止物検出装置。
- 前記移動体の移動速度を検出する速度検出器と、
前記撮像装置の撮像間隔と前記速度検出器により検出された移動速度とに基づいて、前記鳥瞰画像上での周期的静止物の移動範囲を算出する移動範囲算出部と、を更に備え、
前記特徴点抽出部は、前記視点変換部により生成された異なる時刻の画像データの位置を合わせる位置合わせ部と、前記位置合わせ部により位置合わせされた異なる時刻の画像データの差分画像データに基づいて複数の立体物を検出する立体物検出部と、前記立体物検出部により検出された複数の立体物の移動量候補を算出する移動量候補算出部と、を備えており、
前記波形データ算出部は、前記移動量候補算出部により算出された移動量候補をカウントして、前記波形データとしてのヒストグラムを作成するカウント部を備えており、
前記周期的静止物候補検出部は、前記カウント部が作成したヒストグラムのピーク値が所定の第5閾値以上であるとき、当該ピークに対応する移動量候補に対応づけられた立体物が周期的静止物候補であると判定し、
前記周期的静止物判断部は、前記移動範囲算出部により算出された移動範囲内に前記ヒストグラムのピークが存在する場合、前記周期的静止物候補が周期的静止物であると判断することを特徴とする請求項1に記載の周期的静止物検出装置。 - 前記移動量候補算出部は、各立体物に対して複数の移動量候補を算出することを特徴とする請求項8に記載の周期的静止物検出装置。
- 前記周期的静止物候補検出部は、前記ピーク値の最大値から前記所定の第5閾値を求めることを特徴とする請求項8または9に記載の周期的静止物検出装置。
- 前記ピークの発生位置から周期性を判断し、周期性があると判断した場合に前記所定の第5閾値を低下させる周期性判定部を更に備えることを特徴とする請求項8~10のいずれか1項に記載の周期的静止物検出装置。
- 前記周期性判定部は、前記ピーク値の最大値から求めた前記所定の第5閾値以上の値を有するピークの発生位置から周期性を判断することを特徴とする請求項11に記載の周期的静止物検出装置。
- 前記移動体の横移動を検出する横移動検出部をさらに備え、
前記周期性判定部は、前記横移動検出部により規定以上の横移動が検出され、且つ、前記所定の第5閾値を低下させていた場合、低下させていた前記第5閾値を初期化することを特徴とする請求項11または12に記載の周期的静止物検出装置。 - 前記周期的静止物判断部は、前回処理において周期性があると判断されたときのピークの発生位置及びピーク値を記憶しており、今回処理において周期性があると判断されたピーク以外に前記所定の第5閾値以上のピーク値を有するピークが検出された場合、今回処理において周期性があると判断されたピーク値の平均値が前回処理における周期性があると判断されたピーク値の平均値よりも所定値以上小さくない場合、前記周期的静止物候補が周期的静止物であると判断すると共に、今回処理において周期性があると判断されたピーク値の平均値が前回処理における周期性があると判断されたピーク値の平均値よりも所定値以上小さい場合、移動物が存在すると判断することを特徴とする請求項8~13のいずれか1項に記載の周期的静止物検出装置。
- 移動体の周囲に存在する周期的静止物を検出する周期的静止物検出方法であって、
前記移動体に搭載された撮像装置により、前記移動体の周囲を撮像する撮像工程と、
前記撮像装置により撮像された画像に対して視点変換処理を行って鳥瞰画像を生成する視点変換工程と、
前記鳥瞰画像の所定領域の画像データから、該所定領域に含まれる複数の小領域ごとに立体物の特徴点を抽出する特徴点抽出工程と、
前記特徴点抽出工程により抽出された特徴点の前記鳥瞰画像上の所定領域内における分布に対応した波形データを算出する波形データ算出工程と、
前記波形データのピーク情報を検出するピーク情報検出工程と、
前記ピーク情報が所定の第1閾値以上であるか否かに基づいて、前記特徴点抽出工程により抽出された特徴点を有する立体物が周期的静止物候補であるか否かを判断する周期的静止物候補検出工程と、
前記周期的静止物候補検出工程により前記周期的静止物候補が検出され、かつ、その検出が所定の条件の下で為されたとき、当該周期的静止物候補が周期的静止物であると判定する周期的静止物判断工程と、
を備えたことを特徴とする周期的静止物検出方法。
Priority Applications (7)
| Application Number | Priority Date | Filing Date | Title |
|---|---|---|---|
| MX2013005980A MX321872B (es) | 2011-02-21 | 2012-02-17 | Sistema de deteccion de objeto estacionario periodico y metodo de deteccion de objeto estacionario periodico. |
| US13/821,918 US8903133B2 (en) | 2011-02-21 | 2012-02-17 | Periodic stationary object detection system and periodic stationary object detection method |
| RU2013118701/11A RU2549595C2 (ru) | 2011-02-21 | 2012-02-17 | Система обнаружения периодических стационарных объектов и способ обнаружения периодических стационарных объектов |
| JP2013501009A JP5783243B2 (ja) | 2011-02-21 | 2012-02-17 | 周期的静止物検出装置及び周期的静止物検出方法 |
| BR112013007085-4A BR112013007085B1 (pt) | 2011-02-21 | 2012-02-17 | Sistema e método de detecção de objeto fixo repetitivo |
| CN201280003127.8A CN103124995B (zh) | 2011-02-21 | 2012-02-17 | 周期性静止物体检测装置和周期性静止物体检测方法 |
| EP12750202.9A EP2680247B1 (en) | 2011-02-21 | 2012-02-17 | Periodic stationary object detection device and periodic stationary object detection method |
Applications Claiming Priority (2)
| Application Number | Priority Date | Filing Date | Title |
|---|---|---|---|
| JP2011-034097 | 2011-02-21 | ||
| JP2011034097 | 2011-02-21 |
Publications (1)
| Publication Number | Publication Date |
|---|---|
| WO2012115009A1 true WO2012115009A1 (ja) | 2012-08-30 |
Family
ID=46720790
Family Applications (1)
| Application Number | Title | Priority Date | Filing Date |
|---|---|---|---|
| PCT/JP2012/053834 Ceased WO2012115009A1 (ja) | 2011-02-21 | 2012-02-17 | 周期的静止物検出装置及び周期的静止物検出方法 |
Country Status (9)
| Country | Link |
|---|---|
| US (1) | US8903133B2 (ja) |
| EP (1) | EP2680247B1 (ja) |
| JP (1) | JP5783243B2 (ja) |
| CN (1) | CN103124995B (ja) |
| BR (1) | BR112013007085B1 (ja) |
| MX (1) | MX321872B (ja) |
| MY (1) | MY166665A (ja) |
| RU (1) | RU2549595C2 (ja) |
| WO (1) | WO2012115009A1 (ja) |
Cited By (8)
| Publication number | Priority date | Publication date | Assignee | Title |
|---|---|---|---|---|
| JP2014229067A (ja) * | 2013-05-22 | 2014-12-08 | 株式会社デンソー | 衝突緩和装置 |
| US9141870B2 (en) | 2012-04-16 | 2015-09-22 | Nissan Motor Co., Ltd. | Three-dimensional object detection device and three-dimensional object detection method |
| JP2017021803A (ja) * | 2015-07-10 | 2017-01-26 | 株式会社リコー | 道路境界物を検出する方法及び装置 |
| JP2018101200A (ja) * | 2016-12-19 | 2018-06-28 | 日立オートモティブシステムズ株式会社 | 物体検出装置 |
| KR20210014970A (ko) * | 2019-07-31 | 2021-02-10 | 현대엠엔소프트 주식회사 | 영상 기반 주행거리 측정 시스템의 보정 장치 및 방법 |
| JPWO2021199104A1 (ja) * | 2020-03-30 | 2021-10-07 | ||
| JP2023115574A (ja) * | 2022-02-08 | 2023-08-21 | 本田技研工業株式会社 | 学習方法、学習装置、移動体制御装置、移動体制御方法、およびプログラム |
| WO2024157307A1 (ja) * | 2023-01-23 | 2024-08-02 | 日本電気株式会社 | 推定装置、推定方法、及び推定プログラム |
Families Citing this family (16)
| Publication number | Priority date | Publication date | Assignee | Title |
|---|---|---|---|---|
| PH12013500314A1 (en) | 2010-08-19 | 2019-02-20 | Nissan Motor | Three-dimensional object detection device and three-dimensional object detection method |
| US9070042B2 (en) * | 2011-01-13 | 2015-06-30 | Panasonic Intellectual Property Management Co., Ltd. | Image processing apparatus, image processing method, and program thereof |
| JP5869239B2 (ja) * | 2011-06-21 | 2016-02-24 | 浜松ホトニクス株式会社 | 光測定装置、光測定方法、及び光測定プログラム |
| US10197782B2 (en) | 2011-06-21 | 2019-02-05 | Hamamatsu Photonics K.K. | Light measurement device, light measurement method, and light measurement program |
| BR112014002366B1 (pt) * | 2011-09-12 | 2021-10-05 | Nissan Motor Co., Ltd | Dispositivo e método de detecção de objeto tridimensional |
| US9230366B1 (en) * | 2013-12-20 | 2016-01-05 | Google Inc. | Identification of dynamic objects based on depth data |
| US9342747B2 (en) * | 2014-04-14 | 2016-05-17 | Bendix Commercial Vehicle Systems Llc | Vehicle driver assistance apparatus for assisting a vehicle driver in maneuvering the vehicle relative to an object |
| US9676326B2 (en) * | 2015-09-25 | 2017-06-13 | Ford Global Technologies, Llc | Drive history parking barrier alert |
| JP6793448B2 (ja) * | 2015-10-26 | 2020-12-02 | 株式会社デンソーテン | 車両状態判定装置、表示処理装置および車両状態判定方法 |
| KR102404891B1 (ko) * | 2015-12-23 | 2022-06-07 | 주식회사 에이치엘클레무브 | 타켓 물체 감지 방법 및 그 장치 |
| US9836673B2 (en) * | 2015-12-30 | 2017-12-05 | International Business Machines Corporation | System, method and computer program product for training a three dimensional object indentification system and identifying three dimensional objects using semantic segments |
| JP6561016B2 (ja) * | 2016-06-07 | 2019-08-14 | 株式会社Soken | 超音波センサ |
| JP6572862B2 (ja) * | 2016-10-14 | 2019-09-11 | 株式会社デンソー | 表示制御装置 |
| US11776405B2 (en) * | 2018-10-29 | 2023-10-03 | Lg Electronics Inc. | Apparatus and method for V2X communication |
| CN110782459B (zh) * | 2019-01-08 | 2021-02-19 | 北京嘀嘀无限科技发展有限公司 | 一种图像处理方法及装置 |
| US12430916B2 (en) * | 2022-01-19 | 2025-09-30 | Target Brands, Inc. | Safety compliance system and method |
Citations (5)
| Publication number | Priority date | Publication date | Assignee | Title |
|---|---|---|---|---|
| JP2007129560A (ja) | 2005-11-04 | 2007-05-24 | Toyota Motor Corp | 物体検出装置 |
| JP2007280132A (ja) * | 2006-04-07 | 2007-10-25 | Fuji Heavy Ind Ltd | 走行誘導障害物検出装置および車両用制御装置 |
| JP2008003941A (ja) * | 2006-06-23 | 2008-01-10 | Nissan Motor Co Ltd | 道路端認識装置、自動車、及び道路端認識方法 |
| JP2009266136A (ja) * | 2008-04-29 | 2009-11-12 | Mitsubishi Electric Corp | 道路構造物異常検知装置 |
| JP2010211701A (ja) * | 2009-03-12 | 2010-09-24 | Honda Motor Co Ltd | 車線認識装置 |
Family Cites Families (17)
| Publication number | Priority date | Publication date | Assignee | Title |
|---|---|---|---|---|
| JP3085094B2 (ja) * | 1994-07-14 | 2000-09-04 | トヨタ自動車株式会社 | 移動物体検出方法 |
| JP3304687B2 (ja) * | 1995-05-24 | 2002-07-22 | 日産自動車株式会社 | 車両用走行車線認識装置及び障害物検出装置・道路逸脱報知装置 |
| US5963664A (en) * | 1995-06-22 | 1999-10-05 | Sarnoff Corporation | Method and system for image combination using a parallax-based technique |
| JP2000161915A (ja) * | 1998-11-26 | 2000-06-16 | Matsushita Electric Ind Co Ltd | 車両用単カメラ立体視システム |
| US6411898B2 (en) * | 2000-04-24 | 2002-06-25 | Matsushita Electric Industrial Co., Ltd. | Navigation device |
| DE10035223A1 (de) * | 2000-07-20 | 2002-01-31 | Daimler Chrysler Ag | Vorrichtung und Verfahren zur Überwachung der Umgebung eines Objekts |
| JP3645196B2 (ja) * | 2001-02-09 | 2005-05-11 | 松下電器産業株式会社 | 画像合成装置 |
| US6999620B1 (en) * | 2001-12-10 | 2006-02-14 | Hewlett-Packard Development Company, L.P. | Segmenting video input using high-level feedback |
| US7003136B1 (en) * | 2002-04-26 | 2006-02-21 | Hewlett-Packard Development Company, L.P. | Plan-view projections of depth image data for object tracking |
| JP3864945B2 (ja) * | 2003-09-24 | 2007-01-10 | アイシン精機株式会社 | 路面走行レーン検出装置 |
| CA2455359C (en) * | 2004-01-16 | 2013-01-08 | Geotango International Corp. | System, computer program and method for 3d object measurement, modeling and mapping from single imagery |
| DE102005015088B4 (de) * | 2004-04-02 | 2015-06-18 | Denso Corporation | Fahrzeugumgebungsüberwachungssystem |
| DE102006060045A1 (de) * | 2006-12-19 | 2008-06-26 | Imi Intelligent Medical Implants Ag | Sehhilfe mit dreidimensionaler Bilderfassung |
| JP2008219063A (ja) * | 2007-02-28 | 2008-09-18 | Sanyo Electric Co Ltd | 車両周辺監視装置及び方法 |
| JP4378571B2 (ja) * | 2007-05-31 | 2009-12-09 | Necシステムテクノロジー株式会社 | 地図変化検出装置、地図変化検出方法およびプログラム |
| JP5109691B2 (ja) * | 2008-01-31 | 2012-12-26 | コニカミノルタホールディングス株式会社 | 解析装置 |
| US8306269B2 (en) | 2009-03-12 | 2012-11-06 | Honda Motor Co., Ltd. | Lane recognition device |
-
2012
- 2012-02-17 WO PCT/JP2012/053834 patent/WO2012115009A1/ja not_active Ceased
- 2012-02-17 RU RU2013118701/11A patent/RU2549595C2/ru active
- 2012-02-17 BR BR112013007085-4A patent/BR112013007085B1/pt active IP Right Grant
- 2012-02-17 JP JP2013501009A patent/JP5783243B2/ja active Active
- 2012-02-17 US US13/821,918 patent/US8903133B2/en active Active
- 2012-02-17 CN CN201280003127.8A patent/CN103124995B/zh active Active
- 2012-02-17 MY MYPI2013000757A patent/MY166665A/en unknown
- 2012-02-17 EP EP12750202.9A patent/EP2680247B1/en active Active
- 2012-02-17 MX MX2013005980A patent/MX321872B/es active IP Right Grant
Patent Citations (5)
| Publication number | Priority date | Publication date | Assignee | Title |
|---|---|---|---|---|
| JP2007129560A (ja) | 2005-11-04 | 2007-05-24 | Toyota Motor Corp | 物体検出装置 |
| JP2007280132A (ja) * | 2006-04-07 | 2007-10-25 | Fuji Heavy Ind Ltd | 走行誘導障害物検出装置および車両用制御装置 |
| JP2008003941A (ja) * | 2006-06-23 | 2008-01-10 | Nissan Motor Co Ltd | 道路端認識装置、自動車、及び道路端認識方法 |
| JP2009266136A (ja) * | 2008-04-29 | 2009-11-12 | Mitsubishi Electric Corp | 道路構造物異常検知装置 |
| JP2010211701A (ja) * | 2009-03-12 | 2010-09-24 | Honda Motor Co Ltd | 車線認識装置 |
Non-Patent Citations (1)
| Title |
|---|
| See also references of EP2680247A4 |
Cited By (15)
| Publication number | Priority date | Publication date | Assignee | Title |
|---|---|---|---|---|
| US9141870B2 (en) | 2012-04-16 | 2015-09-22 | Nissan Motor Co., Ltd. | Three-dimensional object detection device and three-dimensional object detection method |
| US9487217B2 (en) | 2013-05-22 | 2016-11-08 | Denso Corporation | Collision mitigation apparatus |
| JP2014229067A (ja) * | 2013-05-22 | 2014-12-08 | 株式会社デンソー | 衝突緩和装置 |
| JP2017021803A (ja) * | 2015-07-10 | 2017-01-26 | 株式会社リコー | 道路境界物を検出する方法及び装置 |
| JP2018101200A (ja) * | 2016-12-19 | 2018-06-28 | 日立オートモティブシステムズ株式会社 | 物体検出装置 |
| KR102703479B1 (ko) * | 2019-07-31 | 2024-09-05 | 현대오토에버 주식회사 | 영상 기반 주행거리 측정 시스템의 보정 장치 및 방법 |
| KR20210014970A (ko) * | 2019-07-31 | 2021-02-10 | 현대엠엔소프트 주식회사 | 영상 기반 주행거리 측정 시스템의 보정 장치 및 방법 |
| JPWO2021199104A1 (ja) * | 2020-03-30 | 2021-10-07 | ||
| CN115298566A (zh) * | 2020-03-30 | 2022-11-04 | 三菱电机株式会社 | 物体检测系统和物体检测方法 |
| JP7254243B2 (ja) | 2020-03-30 | 2023-04-07 | 三菱電機株式会社 | 物体検知システムおよび物体検知方法 |
| WO2021199104A1 (ja) * | 2020-03-30 | 2021-10-07 | 三菱電機株式会社 | 物体検知システムおよび物体検知方法 |
| JP2023115574A (ja) * | 2022-02-08 | 2023-08-21 | 本田技研工業株式会社 | 学習方法、学習装置、移動体制御装置、移動体制御方法、およびプログラム |
| JP7418481B2 (ja) | 2022-02-08 | 2024-01-19 | 本田技研工業株式会社 | 学習方法、学習装置、移動体制御装置、移動体制御方法、およびプログラム |
| US12597277B2 (en) | 2022-02-08 | 2026-04-07 | Honda Motor Co., Ltd. | Learning method, learning device, mobile object control device, mobile object control method, and storage medium |
| WO2024157307A1 (ja) * | 2023-01-23 | 2024-08-02 | 日本電気株式会社 | 推定装置、推定方法、及び推定プログラム |
Also Published As
| Publication number | Publication date |
|---|---|
| JP5783243B2 (ja) | 2015-09-24 |
| RU2013118701A (ru) | 2015-03-27 |
| MX321872B (es) | 2014-07-11 |
| JPWO2012115009A1 (ja) | 2014-07-07 |
| MY166665A (en) | 2018-07-18 |
| CN103124995A (zh) | 2013-05-29 |
| US8903133B2 (en) | 2014-12-02 |
| EP2680247A4 (en) | 2017-11-22 |
| RU2549595C2 (ru) | 2015-04-27 |
| EP2680247A1 (en) | 2014-01-01 |
| MX2013005980A (es) | 2013-07-15 |
| US20130322688A1 (en) | 2013-12-05 |
| BR112013007085A2 (pt) | 2016-06-14 |
| CN103124995B (zh) | 2015-07-01 |
| EP2680247B1 (en) | 2018-12-26 |
| BR112013007085B1 (pt) | 2021-02-23 |
Similar Documents
| Publication | Publication Date | Title |
|---|---|---|
| JP5783243B2 (ja) | 周期的静止物検出装置及び周期的静止物検出方法 | |
| US9141870B2 (en) | Three-dimensional object detection device and three-dimensional object detection method | |
| JP5776795B2 (ja) | 立体物検出装置 | |
| US8854456B2 (en) | Travel distance detection device and travel distance detection method | |
| US9177196B2 (en) | Vehicle periphery monitoring system | |
| KR101448411B1 (ko) | 입체물 검출 장치 및 입체물 검출 방법 | |
| US9189691B2 (en) | Three-dimensional object detection device and three-dimensional object detection method | |
| EP2960829A2 (en) | Lane boundary estimation device and lane boundary estimation method | |
| JP6226368B2 (ja) | 車両監視装置、および車両監視方法 | |
| US20150262365A1 (en) | Image processing device and image processing method | |
| JP2015165376A (ja) | 車線認識装置及び方法 | |
| CN104063882A (zh) | 一种基于双目的车辆视频测速方法 | |
| JP2013186663A (ja) | 横断歩道認識装置および横断歩道認識方法 | |
| JPWO2013129354A1 (ja) | 立体物検出装置 | |
| JP5091897B2 (ja) | 停止線検出装置 | |
| JP2013186664A (ja) | 横断歩道認識装置および横断歩道認識方法 | |
| JP6069938B2 (ja) | 飛び出し検出装置 | |
| JP2007316685A (ja) | 走路境界検出装置および走路境界検出方法 | |
| WO2014054124A1 (ja) | 路面標示検出装置及び路面標示検出方法 | |
| JP5974705B2 (ja) | 飛び出し検出装置 | |
| JP5732890B2 (ja) | 並走体検出装置及び並走体検出方法 | |
| JP5505439B2 (ja) | 移動体検出装置、コンピュータプログラム及び移動体検出方法 |
Legal Events
| Date | Code | Title | Description |
|---|---|---|---|
| WWE | Wipo information: entry into national phase |
Ref document number: 201280003127.8 Country of ref document: CN |
|
| 121 | Ep: the epo has been informed by wipo that ep was designated in this application |
Ref document number: 12750202 Country of ref document: EP Kind code of ref document: A1 |
|
| WWE | Wipo information: entry into national phase |
Ref document number: 2012750202 Country of ref document: EP |
|
| ENP | Entry into the national phase |
Ref document number: 2013501009 Country of ref document: JP Kind code of ref document: A |
|
| WWE | Wipo information: entry into national phase |
Ref document number: 13821918 Country of ref document: US |
|
| WWE | Wipo information: entry into national phase |
Ref document number: MX/A/2013/005980 Country of ref document: MX |
|
| NENP | Non-entry into the national phase |
Ref country code: DE |
|
| WWE | Wipo information: entry into national phase |
Ref document number: 1301004588 Country of ref document: TH |
|
| ENP | Entry into the national phase |
Ref document number: 2013118701 Country of ref document: RU Kind code of ref document: A |
|
| REG | Reference to national code |
Ref country code: BR Ref legal event code: B01A Ref document number: 112013007085 Country of ref document: BR |
|
| ENP | Entry into the national phase |
Ref document number: 112013007085 Country of ref document: BR Kind code of ref document: A2 Effective date: 20130326 |