WO2013140749A1 - 画像解析装置および方法並びにプログラム - Google Patents
画像解析装置および方法並びにプログラム Download PDFInfo
- Publication number
- WO2013140749A1 WO2013140749A1 PCT/JP2013/001640 JP2013001640W WO2013140749A1 WO 2013140749 A1 WO2013140749 A1 WO 2013140749A1 JP 2013001640 W JP2013001640 W JP 2013001640W WO 2013140749 A1 WO2013140749 A1 WO 2013140749A1
- Authority
- WO
- WIPO (PCT)
- Prior art keywords
- function
- ventilation
- lung
- ventilation function
- difference
- Prior art date
- Legal status (The legal status is an assumption and is not a legal conclusion. Google has not performed a legal analysis and makes no representation as to the accuracy of the status listed.)
- Ceased
Links
Images


Classifications
-
- G—PHYSICS
- G06—COMPUTING OR CALCULATING; COUNTING
- G06T—IMAGE DATA PROCESSING OR GENERATION, IN GENERAL
- G06T7/00—Image analysis
- G06T7/20—Analysis of motion
-
- A—HUMAN NECESSITIES
- A61—MEDICAL OR VETERINARY SCIENCE; HYGIENE
- A61B—DIAGNOSIS; SURGERY; IDENTIFICATION
- A61B5/00—Measuring for diagnostic purposes; Identification of persons
- A61B5/08—Measuring devices for evaluating the respiratory organs
- A61B5/091—Measuring volume of inspired or expired gases, e.g. to determine lung capacity
-
- A—HUMAN NECESSITIES
- A61—MEDICAL OR VETERINARY SCIENCE; HYGIENE
- A61B—DIAGNOSIS; SURGERY; IDENTIFICATION
- A61B5/00—Measuring for diagnostic purposes; Identification of persons
- A61B5/103—Measuring devices for testing the shape, pattern, colour, size or movement of the body or parts thereof, for diagnostic purposes
- A61B5/11—Measuring movement of the entire body or parts thereof, e.g. head or hand tremor or mobility of a limb
- A61B5/113—Measuring movement of the entire body or parts thereof, e.g. head or hand tremor or mobility of a limb occurring during breathing
-
- A—HUMAN NECESSITIES
- A61—MEDICAL OR VETERINARY SCIENCE; HYGIENE
- A61B—DIAGNOSIS; SURGERY; IDENTIFICATION
- A61B6/00—Apparatus or devices for radiation diagnosis; Apparatus or devices for radiation diagnosis combined with radiation therapy equipment
- A61B6/02—Arrangements for diagnosis sequentially in different planes; Stereoscopic radiation diagnosis
- A61B6/03—Computed tomography [CT]
- A61B6/032—Transmission computed tomography [CT]
-
- A—HUMAN NECESSITIES
- A61—MEDICAL OR VETERINARY SCIENCE; HYGIENE
- A61B—DIAGNOSIS; SURGERY; IDENTIFICATION
- A61B6/00—Apparatus or devices for radiation diagnosis; Apparatus or devices for radiation diagnosis combined with radiation therapy equipment
- A61B6/50—Apparatus or devices for radiation diagnosis; Apparatus or devices for radiation diagnosis combined with radiation therapy equipment specially adapted for specific body parts; specially adapted for specific clinical applications
-
- A—HUMAN NECESSITIES
- A61—MEDICAL OR VETERINARY SCIENCE; HYGIENE
- A61B—DIAGNOSIS; SURGERY; IDENTIFICATION
- A61B6/00—Apparatus or devices for radiation diagnosis; Apparatus or devices for radiation diagnosis combined with radiation therapy equipment
- A61B6/52—Devices using data or image processing specially adapted for radiation diagnosis
- A61B6/5211—Devices using data or image processing specially adapted for radiation diagnosis involving processing of medical diagnostic data
- A61B6/5217—Devices using data or image processing specially adapted for radiation diagnosis involving processing of medical diagnostic data extracting a diagnostic or physiological parameter from medical diagnostic data
-
- G—PHYSICS
- G06—COMPUTING OR CALCULATING; COUNTING
- G06T—IMAGE DATA PROCESSING OR GENERATION, IN GENERAL
- G06T7/00—Image analysis
- G06T7/0002—Inspection of images, e.g. flaw detection
- G06T7/0012—Biomedical image inspection
- G06T7/0014—Biomedical image inspection using an image reference approach
- G06T7/0016—Biomedical image inspection using an image reference approach involving temporal comparison
-
- G—PHYSICS
- G06—COMPUTING OR CALCULATING; COUNTING
- G06T—IMAGE DATA PROCESSING OR GENERATION, IN GENERAL
- G06T7/00—Image analysis
- G06T7/30—Determination of transform parameters for the alignment of images, i.e. image registration
- G06T7/33—Determination of transform parameters for the alignment of images, i.e. image registration using feature-based methods
-
- G—PHYSICS
- G06—COMPUTING OR CALCULATING; COUNTING
- G06T—IMAGE DATA PROCESSING OR GENERATION, IN GENERAL
- G06T7/00—Image analysis
- G06T7/60—Analysis of geometric attributes
- G06T7/62—Analysis of geometric attributes of area, perimeter, diameter or volume
-
- G—PHYSICS
- G16—INFORMATION AND COMMUNICATION TECHNOLOGY [ICT] SPECIALLY ADAPTED FOR SPECIFIC APPLICATION FIELDS
- G16H—HEALTHCARE INFORMATICS, i.e. INFORMATION AND COMMUNICATION TECHNOLOGY [ICT] SPECIALLY ADAPTED FOR THE HANDLING OR PROCESSING OF MEDICAL OR HEALTHCARE DATA
- G16H50/00—ICT specially adapted for medical diagnosis, medical simulation or medical data mining; ICT specially adapted for detecting, monitoring or modelling epidemics or pandemics
- G16H50/30—ICT specially adapted for medical diagnosis, medical simulation or medical data mining; ICT specially adapted for detecting, monitoring or modelling epidemics or pandemics for calculating health indices; for individual health risk assessment
-
- A—HUMAN NECESSITIES
- A61—MEDICAL OR VETERINARY SCIENCE; HYGIENE
- A61B—DIAGNOSIS; SURGERY; IDENTIFICATION
- A61B6/00—Apparatus or devices for radiation diagnosis; Apparatus or devices for radiation diagnosis combined with radiation therapy equipment
- A61B6/02—Arrangements for diagnosis sequentially in different planes; Stereoscopic radiation diagnosis
- A61B6/03—Computed tomography [CT]
- A61B6/037—Emission tomography
-
- A—HUMAN NECESSITIES
- A61—MEDICAL OR VETERINARY SCIENCE; HYGIENE
- A61B—DIAGNOSIS; SURGERY; IDENTIFICATION
- A61B6/00—Apparatus or devices for radiation diagnosis; Apparatus or devices for radiation diagnosis combined with radiation therapy equipment
- A61B6/46—Arrangements for interfacing with the operator or the patient
- A61B6/461—Displaying means of special interest
-
- G—PHYSICS
- G06—COMPUTING OR CALCULATING; COUNTING
- G06T—IMAGE DATA PROCESSING OR GENERATION, IN GENERAL
- G06T2207/00—Indexing scheme for image analysis or image enhancement
- G06T2207/10—Image acquisition modality
- G06T2207/10072—Tomographic images
-
- G—PHYSICS
- G06—COMPUTING OR CALCULATING; COUNTING
- G06T—IMAGE DATA PROCESSING OR GENERATION, IN GENERAL
- G06T2207/00—Indexing scheme for image analysis or image enhancement
- G06T2207/10—Image acquisition modality
- G06T2207/10072—Tomographic images
- G06T2207/10081—Computed x-ray tomography [CT]
-
- G—PHYSICS
- G06—COMPUTING OR CALCULATING; COUNTING
- G06T—IMAGE DATA PROCESSING OR GENERATION, IN GENERAL
- G06T2207/00—Indexing scheme for image analysis or image enhancement
- G06T2207/10—Image acquisition modality
- G06T2207/10072—Tomographic images
- G06T2207/10084—Hybrid tomography; Concurrent acquisition with multiple different tomographic modalities
-
- G—PHYSICS
- G06—COMPUTING OR CALCULATING; COUNTING
- G06T—IMAGE DATA PROCESSING OR GENERATION, IN GENERAL
- G06T2207/00—Indexing scheme for image analysis or image enhancement
- G06T2207/10—Image acquisition modality
- G06T2207/10072—Tomographic images
- G06T2207/10088—Magnetic resonance imaging [MRI]
-
- G—PHYSICS
- G06—COMPUTING OR CALCULATING; COUNTING
- G06T—IMAGE DATA PROCESSING OR GENERATION, IN GENERAL
- G06T2207/00—Indexing scheme for image analysis or image enhancement
- G06T2207/30—Subject of image; Context of image processing
- G06T2207/30004—Biomedical image processing
- G06T2207/30061—Lung
Definitions
- the present invention relates to an image analysis apparatus and method for analyzing the distribution of three-dimensional lung ventilation using a three-dimensional image representing the movement of the lungs during breathing, and a program for causing a computer to execute the image analysis method. It is about.
- multi-detector CT hereinafter referred to as multi-slice CT
- a plurality of detectors for detecting X-rays are prepared, and a plurality of tomographic images can be acquired simultaneously by rotating around the human body once.
- the number of detectors has increased exponentially due to technological progress, and at present, a multi-slice CT having a maximum of 320 columns is also used.
- the time required for the detector to make one rotation around the human body is about 0.35 seconds, and the imaging range in the body axis direction of the human body is also 16 cm.
- the exposure dose of the subject also increases.
- a manufacturer that manufactures a modality such as an imaging device can acquire a high-quality image at a lower dose.
- a reconstruction algorithm is also being developed. For this reason, photographing over a wide range and for a long time, in which the exposure dose has been increased, has come to be performed.
- 3D images of the entire lung region are also acquired in chronological order over a short time interval during a series of breathing operations in which the lungs are inhaled and exhaled. This makes it possible to observe the movement of the lung by breathing as if viewing a moving image.
- bronchial asthma and emphysema etc. are raised as respiratory diseases.
- lung ventilation is examined by performing a nuclear medicine test such as a spirometer or SPECT lung scintigram.
- spirometry measures the amount of breath exhaled by a subject and the time to exhale, and is recommended as a test for diagnosing lung diseases such as COPD (chronic obstruction failure disease).
- COPD chronic obstruction failure disease
- a lung region is extracted from a two-phase CT image of exhaled air and inhaled, and the displacement vector field in the lung region is obtained by aligning the extracted lung region using a non-rigid registration method, and the amount of divergence A method has been proposed for calculating the local ventilation of the lung by calculating (see Patent Document 1).
- the present invention has been made in view of the above circumstances, and an object thereof is to make it possible to confirm local abnormality of the lung along with the three-dimensional movement of the lung during breathing.
- An image analysis apparatus is an image analysis apparatus that analyzes a three-dimensional distribution of ventilation volume of a lung based on a series of three-dimensional images having different time phases about the lung, Lung region extraction means for extracting a lung region from each of the three-dimensional images; Alignment means for aligning lung regions between a series of three-dimensional images and calculating a displacement vector field in the lung regions; In each of the three-dimensional images, based on the displacement vector field, function calculating means for calculating a local ventilation function representing the temporal change of the ventilation at each point of the displacement vector field; Quantifying means for quantifying a difference between the local ventilation function and a reference ventilation function serving as a reference and calculating a quantitative value representing the difference is provided.
- a series of three-dimensional images of lungs with different time phases is obtained by taking images of the chest including the lungs of the same subject continuously at short time intervals and displaying them in time series order. Any image can be used as long as lung motion can be reproduced. Specifically, a three-dimensional image generated from a CT image or an MR image can be used.
- the quantifying means may be a means for calculating a difference function representing a difference between the local ventilation function and the reference ventilation function as a quantitative value.
- the quantification means calculates a difference function representing a difference between the local ventilation function and the reference ventilation function, and an integral value or an absolute value of the absolute value of the ventilation volume in the difference function.
- the maximum value may be calculated as a quantitative value.
- the quantifying means may be a means for calculating a difference in time until the predetermined ventilation volume is reached as a quantitative value in the local ventilation function and the reference ventilation function. .
- the image analysis apparatus may further include a display control means for visualizing the quantitative value on the displayed three-dimensional image or the two-dimensional image acquired from the three-dimensional image.
- the display control means may be a means for visualizing the quantitative value by mapping the quantitative value to each point of the displacement vector field in each of the three-dimensional image or the two-dimensional image. Good.
- the alignment means may be a means for performing alignment by a non-rigid registration method.
- the alignment unit may be a unit that performs alignment based on the correlation between the three-dimensional images.
- the three-dimensional image may be generated from a CT image or an MR image.
- the quantifying means may be a means for quantifying the difference after normalizing the local ventilation function and the reference ventilation function in the time axis direction.
- the quantification means quantifies the difference after normalizing the local ventilation function and the reference ventilation function with the maximum value of the local ventilation function or the reference ventilation function. It may be a means.
- the reference ventilation function is a function representing the volume change of the entire lung for the same subject from which a three-dimensional image is acquired, a vital capacity function for the same subject, and a lung of the same subject. It is good also as a function showing a volume change about a partial field of this, a ventilation function calculated based on many healthy persons, or a ventilation function calculated mathematically.
- An image analysis method is an image analysis method for analyzing a distribution of three-dimensional lung ventilation based on a series of three-dimensional images having different time phases for the lung, Extract lung regions from each of the 3D images, Aligning the lung region between a series of three-dimensional images, calculating a displacement vector field in the lung region, In each of the three-dimensional images, based on the displacement vector field, calculate a local ventilation function representing the relationship between time and ventilation at each point of the displacement vector field, The difference between the local ventilation function and the reference ventilation function serving as a reference is quantified, and a quantitative value representing this difference is calculated.
- the image analysis method according to the present invention may be provided as a program for causing a computer to execute the image analysis method.
- a lung region is extracted from each of a series of three-dimensional images having different time phases for the lung, and the lung regions are aligned between the series of three-dimensional images, so that a displacement vector field in the lung region is obtained. Is calculated.
- the local ventilation function at each point of the displacement vector field is calculated based on the displacement vector field, and the difference between the local ventilation function and the reference reference ventilation function is quantified.
- the difference is calculated as a quantitative value. For this reason, the three-dimensional movement of the lungs during breathing can be confirmed by displaying the three-dimensional images in chronological order. Moreover, abnormality of the local ventilation amount of the lung can be confirmed by the quantitative value.
- the three-dimensional movement of the lungs during breathing can be confirmed together with the local ventilation of the lungs.
- FIG. 1 is a schematic block diagram showing the configuration of an image analysis apparatus according to an embodiment of the present invention.
- Diagram conceptually showing the relationship between displacement vector divergence and deformation volume change Diagram for explaining calculation of average model ventilation function Diagram for explaining normalization of ventilation function Diagram to explain the comparison between the normalized local ventilation function and the normalized reference ventilation function at a part of the lung Diagram showing the difference function Figure showing a one-dimensional lookup table
- the figure for demonstrating the display of the VR image of a lung A flowchart showing processing performed in the present embodiment Diagram for explaining another example of quantification of local ventilation function and reference ventilation function
- the figure which shows the state which displayed the quantitative value on the lung area on the MPR cross section
- FIG. 1 is a schematic block diagram showing the configuration of an image analysis apparatus according to an embodiment of the present invention.
- the configuration of the image analysis device 1 shown in FIG. 1 is realized by executing an image analysis program read into the auxiliary storage device on a computer.
- This image analysis program is recorded on a recording medium such as a CD-ROM, or distributed via a network such as the Internet, and installed in a computer.
- the image analysis apparatus 1 includes an image acquisition unit 10, a storage unit 12, a lung region extraction unit 14, a registration unit 16, a function calculation unit 18, a quantification unit 20, a display control unit 22, and an input unit 24. .
- the three-dimensional image group Vg is transmitted from the modality 2 via the LAN.
- the three-dimensional image Vi is obtained by laminating a two-dimensional tomographic image obtained in order along the direction perpendicular to the tomographic plane on the chest to be diagnosed.
- It is generated by superimposing a plurality of tomographic images taken in the modality 2.
- the three-dimensional image acquired using the CT apparatus is data in which the amount of X-ray absorption is stored for each voxel (that is, pixel position) constituting a lattice point in the three-dimensional space, and for each pixel position.
- the data is given one signal value (a value indicating the amount of X-ray absorption when imaged with a CT apparatus).
- the three-dimensional image group Vg is composed of a series of three-dimensional images Vi acquired by, for example, photographing a subject at different time phases T1, T2,.
- the photographing of the subject is preferably performed in the order of expiration-inspiration-expiration, or in the order of inspiration-expiration-inspiration, but may be performed in the order of expiration-inspiration or inspiration-expiration.
- incidental information defined in the DICOM (Digital Imaging and Communications in Medicine) standard is added to the three-dimensional image Vi.
- the incidental information is allocated for each image information, for example, an image ID for identifying a three-dimensional image represented by each three-dimensional image Vi, a patient ID for identifying a subject, an examination ID for identifying an examination, and the like.
- Unique ID UID
- examination date when the image information was generated examination time
- patient information such as patient name, age, gender
- examination Information such as the site number (imaging site, chest in this embodiment), imaging conditions (whether or not a contrast medium is used, radiation dose, etc.), such as series number or collection number when multiple images are acquired in one examination May be included.
- the storage unit 12 is a large-capacity storage device such as a hard disk, and stores a three-dimensional image group Vg.
- the storage unit 12 stores a plurality of three-dimensional image groups Vg with different subjects (that is, with different patients) or with the same subject and with different shooting times.
- the lung region extraction unit 14 extracts a lung region from each of the three-dimensional images Vi.
- a method of extracting a lung region a method of extracting a signal value for each pixel from a three-dimensional image Vi by making a histogram and thresholding the lung region, a region expansion method based on a seed point representing the lung region (Region Any method such as Growing) can be used.
- a lesion area exists in the vicinity of the lung boundary, for example, as described in Japanese Patent Application Laid-Open No. 2008-253293
- the lung area corresponding to the lung area has a concave area corresponding to the lung area boundary. It is preferable to newly extract the lung region by performing interpolation by curve interpolation using the front and back curvatures.
- the alignment unit 16 aligns corresponding pixel positions in the lung region extracted from each of the three-dimensional images Vi between the three-dimensional images Vi, and calculates a displacement vector field in the lung region. Specifically, it is described in "V. Boldea et al.,” Lung Deformation Estimation with Non-rigid Registration for Radiotherapy Treatment “, Proceedings of MICCAI, Vol. 2878, pp. 770-777, 2003” (Reference 1) Using the above-described method, registration is performed by associating corresponding pixel positions between adjacent three-dimensional images in time phases, and a displacement vector field of a lung region between two three-dimensional images adjacent in time phases is obtained. calculate.
- the technique described in Reference 1 uses a non-rigid registration technique to perform alignment between lung regions extracted from two CT images on a voxel basis, and the similarity of signal values is maximum. In addition, this is a technique for obtaining a displacement vector field that minimizes elastic energy due to deformation.
- the alignment method is not limited to the method described in Reference 1, and is performed by calculating a correlation between three-dimensional images having adjacent time phases and obtaining a displacement vector field that minimizes the correlation. May be.
- the displacement vector field between two adjacent time phases (Ti to Ti + 1) calculated by the alignment is expressed as D (Ti) (x, y, z in the time between the two time phases. ).
- (x, y, z) is a three-dimensional coordinate of each point of the displacement vector field.
- F (Tk) (x, y, z) be the cumulative change amount of the displacement vector field up to a specific time Tk.
- each three-dimensional image Vi may be smoothed before alignment. Specifically, each three-dimensional image Vi is smoothed by calculating an average value of signal values at each pixel position of the three-dimensional image Vi using a smoothing filter of a predetermined size (for example, 3 ⁇ 3 ⁇ 3). You just have to. Thereby, when performing alignment, since the influence of the noise contained in the three-dimensional image Vi can be reduced, alignment can be performed more accurately.
- a smoothing filter of a predetermined size for example, 3 ⁇ 3 ⁇ 3
- the function calculation unit 18 uses the displacement vector field D (Ti) (x, y, z) calculated by the alignment unit 16 to calculate the displacement amount of the volume at each point of the displacement vector field per unit time. Calculated as the quantity P (Ti) (x, y, z).
- the divergence at each point of the displacement vector field in the lung region is calculated as the local ventilation in the lung.
- the local ventilation is the ventilation in an arbitrary partial region (local) in the lung.
- the local area is composed of one or a plurality of voxels adjacent to each other.
- Ventilation is the incompressible movement of air in the lung, and the lung parenchyma is deformed by the movement of air.
- Deformation of the lung parenchyma accompanying breathing makes it possible to apply the theory of elastic bodies by regarding the lungs as porous elastic bodies.
- Local deformation in an elastic body can be expressed by using a local displacement vector field and a deformation tensor (3 ⁇ 3 matrix form).
- the deformation tensor is It is known that it is diagonalized and its trace (sum of diagonal components) coincides with the divergence of the displacement vector.
- the local volume change rate can be approximated to a diagonal deformation tensor trace, that is, the volume change rate due to deformation can be regarded as coincident with the divergence of the displacement vector. It should be noted that in a tissue such as a pulmonary blood vessel where there is no movement of air, the volume change is negligible even if it is deformed, so the divergence is zero.
- FIG. 2 is a diagram conceptually showing the relationship between the divergence of the displacement vector field and the volume change due to deformation.
- D represents the displacement vector field at the point O1
- dx, dy, and dz represent minute displacements in the x, y, and z coordinate axis directions of the unit cube.
- the volume change of the unit cube is obtained by (1 + dx) ⁇ (1 + dy) ⁇ (1 + dz) ⁇ 1, and this can be approximated by dx + dy + dz. Therefore, the volume change rate of the unit cube can be regarded as coincident with the divergence of the displacement vector field.
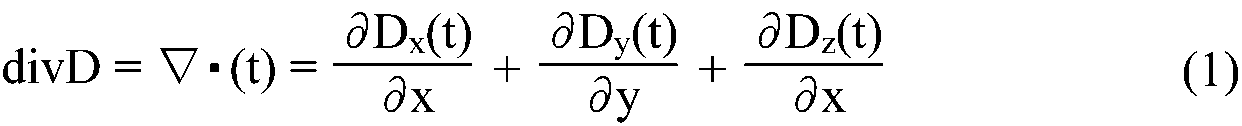
- Divergence is generally expressed as ⁇ ⁇ A using a divA or Hamilton operator when an arbitrary vector function is A (x, y, z).
- the vector function is the displacement vector field D (Ti) (x, y, z)
- the divergence divD can be calculated by the following equation (1), and the calculated divergence divD is The local ventilation P (Ti) (x, y, z) between certain time phases at each point of the displacement vector field.
- the function calculation unit 18 integrates the local ventilation amount P (Ti) (x, y, z) between the respective time phases for all the time phases, so that the local ventilation function Q representing the temporal change of the ventilation rate is obtained.
- (T) (x, y, z) is calculated.
- the quantification unit 20 quantifies the difference between the local ventilation function Q (t) (x, y, z) and the reference ventilation function V (t) (x, y, z) serving as a reference.
- the reference ventilation function will be described.
- a global ventilation function, a vital capacity ventilation function, a partial ventilation function, an average model ventilation function, or a mathematical model ventilation function is used as the reference ventilation function.
- the global ventilation function is a function representing the volume change of the entire lung for the same subject from which the three-dimensional image Vi is acquired, and the local ventilation function Q (t) (x, y, z at each point in the displacement vector field. ) Can be calculated by volume integration (volume integration) in the lung region.
- the global ventilation function represents the change over time in the ventilation volume of the entire lung region for the same subject from which the three-dimensional image Vi is acquired.
- the vital capacity ventilation function can be acquired by performing spirometry on the same subject from which the three-dimensional image Vi is acquired.
- the vital capacity ventilation function represents the change over time of the ventilation volume obtained by actual measurement for the same subject from which the three-dimensional image Vi is acquired.
- the partial ventilation function is a function that represents a volume change of a partial region when the lung field of the same subject from which the three-dimensional image Vi is acquired is divided into a plurality of regions, and local ventilation of each point in the displacement vector field.
- the quantity function Q (t) (x, y, z) can be calculated by volume integration for each partial region.
- diagnosis is performed by dividing the left and right lungs into six parts, upper, middle and lower, in proportion to the length of the entire lung. Each of these six parts can be set as a partial region.
- five regions obtained by extracting the mesenchyme from the lung region and dividing the lung into five lobes can be used as partial regions.
- the ventilation function is calculated at the boundary of the partial area by interpolating the partial ventilation function for each partial area near the boundary. You may make it change smoothly.
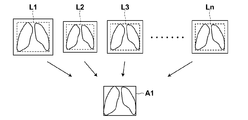
- FIG. 3 is a diagram for explaining the calculation of the average model ventilation function.
- the local ventilation function is calculated using a three-dimensional image in the same manner as described above for a large number of healthy persons.
- the region surrounding the local ventilation function space A1 and the lung region is a rectangular parallelepiped, but is illustrated by a rectangle in FIG. 3 for explanation.
- the local ventilation function Q (t) (x, y, z) at each point in the displacement vector field for a large number of healthy subjects is mapped to the local ventilation function space A1, and the local ventilation function at each point Calculate the average.
- the displacement vector at a point closest to that region Assign a local ventilation function for the field.
- the addition average of the local ventilation function at each point is calculated, and this is used as the average model ventilation function.
- a lung region of one of many healthy persons is set as a reference lung region, and the non-rigid registration method described above is used to set the reference lung region.
- the alignment of the lung regions of other healthy persons may be performed.
- the local ventilation function Q (t) (x, y, z) at each point in the displacement vector field for a large number of healthy subjects is mapped to the reference lung region after alignment, and local ventilation at each point is mapped.
- the average model ventilation function may be calculated by calculating the average of the quantity function.
- Mathematical model ventilation function is obtained by approximating the above-mentioned average model ventilation function with a mathematical formula.
- a lung ventilation function calculated from a ventilation model of The technique described in Reference 2 is a technique for verifying the deviation of the modeled respiratory ventilation function from the position of a specific feature point extracted from a three-dimensional image of a plurality of time phases.
- the method described in Reference 3 is a method of creating an artificial lung model and calculating an average ventilation function from the artificial model.
- the quantification unit 20 quantifies the difference between the local ventilation function Q (t) (x, y, z) and the reference ventilation function V (t) (x, y, z), and uses this difference as a quantitative value. calculate. In performing the quantification, the quantification unit 20 normalizes the local ventilation function Q (t) (x, y, z) and the reference ventilation function V (t) (x, y, z).
- the local ventilation function Q (t) (x, y, z) and the reference ventilation function V (t) (x, y, z) is normalized by its overall variable. Specifically, the local ventilation function Q (t) (x, y, z) and the reference ventilation function V (t) (x, y, z) are set to the respective maximum values Q (t) max and V ( t) Normalize by max.
- the normalized local ventilation function Q (t) (x, y, z) and the reference ventilation function V (t) (x, y, z) are respectively Q (t) (x, y, z) / Q. (T) max and V (t) (x, y, z) / V (t) max.
- FIG. 4 is a diagram for explaining normalization of the ventilation function.
- V (t) (x, y, z) standard ventilation volume function
- the reference ventilation function normalized in the time axis direction is normalized by the whole variable
- the local ventilation function Q is normalized by the whole variable.
- the normalized local ventilation function Q (t) (x, y, z) and the reference ventilation function V (t) (x, y, z) are expressed as Q ′ (t) (x, y, z), Let V ′ (t) (x, y, z).
- FIG. 5 is a diagram for explaining a comparison between a normalized local ventilation function and a normalized reference ventilation function at a certain part of the lung.
- the horizontal axis indicates time
- the vertical axis indicates the ventilation amount.
- time 0
- FIG. 6 shows the difference function. As shown in FIG. 6, the difference function B (t) is the difference between the local ventilation and the reference ventilation over time, more specifically, how much the local location ventilation is behind the reference ventilation. It will represent whether or not.
- a difference function may be calculated using the local ventilation function and the partial ventilation function for the partial region from which the partial ventilation function is acquired.
- the display control unit 22 displays the difference function B (t) (x, y, z) together with the three-dimensional image Vi when displaying the three-dimensional image Vi on the display 4. Specifically, a lung region is extracted from the three-dimensional image Vi, and a lung volume rendering image or surface rendering image (hereinafter simply referred to as a VR image) is displayed. Further, the difference function B (t) (x, y, z) is displayed by mapping on the surface of the lung VR image. That is, the signal value at the pixel position on the surface of the lung in each time phase is converted into a color corresponding to the value of the difference function B (t) (x, y, z) corresponding to the pixel position and displayed. For example, as shown in FIG.
- this color conversion uses a one-dimensional lookup table in which the value of the difference function B (t) is set on the horizontal axis and the color (R, G, B) is set on the vertical axis. Do it. Although only one lookup table is shown in FIG. 7, actually, three lookup tables are prepared for each of R, G, and B colors.
- the display control unit 22 refers to the lookup table and converts the signal value of each pixel on the lung surface into a display pixel value composed of each color of R, G, and B.
- the converted VR VR images are displayed on the display 4 in chronological order.
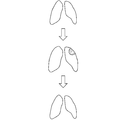
- FIG. 8 is a diagram for explaining the display of a lung VR image. As shown in FIG. 8, the display 4 displays a portion where the ventilation amount in the lungs is abnormal, along with a state of deformation corresponding to the lungs breathing. Note that a three-dimensional image of the lung is displayed on the display 4, but in FIG. 8, a two-dimensional image is shown for the sake of explanation. Moreover, in FIG. 8, the site
- the input unit 24 includes a known input device such as a keyboard and a mouse.
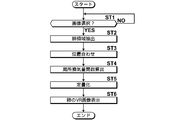
- FIG. 9 is a flowchart showing processing performed in the present embodiment. It is assumed that a plurality of lung three-dimensional images Vi are acquired by the image acquisition unit 10 and stored in the storage unit 12.
- the lung region extraction unit 14 reads the selected three-dimensional image Vi from the storage unit 12, A lung region is extracted from each of the three-dimensional images Vi (step ST2).
- the alignment unit 16 aligns the pixel positions corresponding to the lung regions extracted from each of the three-dimensional images Vi between the three-dimensional images Vi (step ST3). Thereby, the displacement vector field in each time phase of the three-dimensional image Vi is calculated.
- the function calculation unit 18 calculates a local ventilation function Q (t) (x, y, z) representing a temporal change in ventilation at each point of the displacement vector field (step ST4).
- the quantification unit 20 performs quantification, and the difference function B (t) (x, y, z), which is a function of the difference value between the local ventilation function and the reference ventilation function, is converted into the local ventilation function and the reference. It is calculated as a quantitative value representing the difference in the ventilation function (quantification, step ST5).
- the display control unit 22 displays the VR images of the lungs to which the difference function is mapped on the display 4 in time series order (step ST6), and ends the process.
- the difference function representing the difference between the local ventilation function and the reference ventilation function is mapped to a three-dimensional image and displayed in chronological order, so that the three-dimensional movement of the lungs during breathing is displayed.
- a local difference in the lung compared to the surrounding state can be confirmed by the mapped difference function.
- the ventilation amount is zero in principle.
- the reference ventilation function is a global ventilation function
- the local ventilation function at each part of the lung is the reference ventilation function and The function shape should be similar.
- the local ventilation function at the diseased site has a function shape different from the reference ventilation function. For this reason, the local abnormality of the lung can be detected by using the reference ventilation function as the global ventilation function.
- the reference ventilation function is the global ventilation function
- the reference ventilation function can be calculated accurately and easily.
- one reference ventilation function is calculated from the whole lung region and the difference between it and the local ventilation function is a quantitative value, the difference from the ventilation function for each part due to the influence of gravity, The difference from the ventilation function for each part that should be determined to be normal cannot be distinguished, and as a result, a part having such a difference may be detected as an abnormal part. For this reason, it is possible to detect only a locally abnormal part by quantifying the difference between the part ventilation function and the local ventilation function for each part by using the reference ventilation function as the part ventilation function. .
- the reference ventilation function a mean model ventilation function and a mathematical model ventilation function that are calculated in advance using healthy subjects, it becomes easier to identify abnormal sites, and due to the gravity of the lung field. It is possible to identify an abnormal part that excludes the influence of the bias of ventilation volume or the bias of physiological ventilation.
- the difference function B (t) is mapped on the surface of the lung in the VR VR image.
- the difference function B (t) is mapped on the cross-section of the lung in the VR image. Also good.
- the difference function B (t) is calculated as a quantitative value, but the maximum absolute value
- represents the difference in the maximum ventilation volume from the normal part in the part where the difference function B (t) is calculated.
- becomes maximum may be used as the quantitative value.
- This time Tk represents the time when the difference in ventilation volume from the normal part in the part for which the difference function B (t) is calculated becomes maximum. The time may be based on a predetermined time point, for example, at the start of expiration.
- the integral value of the difference function B (t) may be used as the quantitative value.
- the quantitative value represents the total sum of the differences in ventilation volume from the normal part in the part where the difference function B (t) is calculated.
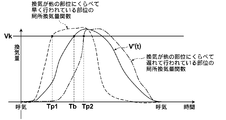
- the time Tp1 until the local ventilation function becomes a predetermined ventilation volume Vk is the reference ventilation volume. It becomes earlier than the time Tb until the function reaches the predetermined ventilation amount.
- the reference ventilation function becomes the predetermined ventilation amount for the time Tp2 until the local ventilation function becomes the predetermined ventilation amount. It becomes later than the time Tb until. Therefore, in the local ventilation function, the time from a certain reference time (for example, the time at the start of expiration as shown in FIG. 10) to the predetermined ventilation volume Vk, and the predetermined ventilation in the reference ventilation function.
- a difference value (for example, Tp ⁇ Tb) from the time until the amount Vk is reached may be calculated as a quantitative value.
- Tp ⁇ Tb the quantitative value at a certain part
- the quantitative value at a certain part is negative, that part is ventilated earlier than other parts, and if the quantitative value is positive, the air ventilation is different from other parts. It can be seen that the process is late.
- the quantitative value may be mapped to the VR image of the lung.
- the color of the lung surface does not change with the passage of time, but it is possible to confirm the state of lung movement and the site where the ventilation volume becomes an abnormal value.
- the quantitative value may be mapped on a cross-section obtained by cutting the lung in the VR image.
- the quantitative value may be displayed in an overlay on the lung region on the MPR cross section in the three-dimensional image Vi. In FIG. 11, the overlay display portion is indicated by hatching.
Landscapes
- Health & Medical Sciences (AREA)
- Engineering & Computer Science (AREA)
- Life Sciences & Earth Sciences (AREA)
- Medical Informatics (AREA)
- Physics & Mathematics (AREA)
- General Health & Medical Sciences (AREA)
- Public Health (AREA)
- Biomedical Technology (AREA)
- Pathology (AREA)
- Veterinary Medicine (AREA)
- Biophysics (AREA)
- Animal Behavior & Ethology (AREA)
- Heart & Thoracic Surgery (AREA)
- Molecular Biology (AREA)
- Surgery (AREA)
- Theoretical Computer Science (AREA)
- Computer Vision & Pattern Recognition (AREA)
- Nuclear Medicine, Radiotherapy & Molecular Imaging (AREA)
- Radiology & Medical Imaging (AREA)
- General Physics & Mathematics (AREA)
- Pulmonology (AREA)
- High Energy & Nuclear Physics (AREA)
- Optics & Photonics (AREA)
- Physiology (AREA)
- Oral & Maxillofacial Surgery (AREA)
- Dentistry (AREA)
- Multimedia (AREA)
- Geometry (AREA)
- Quality & Reliability (AREA)
- Data Mining & Analysis (AREA)
- Databases & Information Systems (AREA)
- Epidemiology (AREA)
- Primary Health Care (AREA)
- Apparatus For Radiation Diagnosis (AREA)
- Measurement Of The Respiration, Hearing Ability, Form, And Blood Characteristics Of Living Organisms (AREA)
Abstract
【課題】呼吸時における肺の3次元的な動きとともに、肺の局所的な異常を確認できるようにする。 【解決手段】肺領域抽出部(14)が、複数時相からなる3次元画像(Vi)から肺領域を抽出し、位置合わせ部(16)が、3次元画像(Vi)のそれぞれから抽出した肺領域に対応する画素位置を、3次元画像(Vi)間において位置合わせする。これにより、3次元画像(Vi)の各時相における変位ベクトル場が算出される。関数算出部(18)が、変位ベクトル場の各点における換気量の時間的な変化を表す局所換気量関数を算出し、定量化部(20)が、局所換気量関数および基準換気量関数の差分値の関数である差分関数を、局所換気量関数と基準換気量関数との相違を表す定量値として算出する。表示制御部(22)が、差分関数がマッピングされた肺のVR画像をディスプレイ(4)に時系列順に表示する。
Description
本発明は、肺の呼吸時の動きを表す3次元画像を用いて、肺の3次元的な換気量の分布を解析する画像解析装置および方法、並びに画像解析方法をコンピュータに実行させるためのプログラムに関するものである。
近年、医療機器(例えば多検出器型CT、以下マルチスライスCTとする等)の進歩により質の高い3次元画像が画像診断に用いられるようになってきている。マルチスライスCTにおいては、X線を検出するための検出器が複数列用意されており、人体の周囲を1回転することにより、同時に複数枚の断層画像が取得可能となっている。ここで、検出器の数は技術の進歩により指数的に増大しており、現在では最大320列のマルチスライスCTも利用されてきている。また、検出器が人体の周囲を1回転するのに要する時間は、0.35秒程度であり、さらに人体の体軸方向における撮影範囲も16cmに亘るものとなっている。このため、頭部や心臓等の部位では、複数の3次元画像を短い時間間隔により時系列で取得することが可能となっている。このように時系列で取得した3次元画像に含まれる注目する臓器を時系列順に表示することにより、心臓等の臓器が動く様子を動画像を見るように観察することが可能となる。また、頭部や心臓において、造影剤等が体内を巡る様子を、3次元的な画像において観察することも可能となる。
ところで、撮影範囲や撮影回数が多くなると被検体の被曝量も増えることになるが、近年、撮影装置等のモダリティを製造するメーカーにおいては、より低線量で高画質な画像が取得できるような画像再構成アルゴリズムの開発も行われている。このため、従来は被曝量が多くなっていた広範囲および長時間に亘る撮影も行われるようになってきている。
このような、モダリティの進歩により、肺に関しても、息を大きく吸ってから吐くという一連の呼吸の動作中において、肺領域全体(およそ30cm程度)の3次元画像も短い時間間隔により時系列順に取得可能になりつつあり、これにより、呼吸によって肺が動く様子を動画像を見るように観察することが可能となる。
一方、呼吸器の疾患としては、気管支ぜんそくおよび肺気腫等が上げられる。従来、これらの疾患に対しては、肺活量計(スパイロメトリ)、あるいはSPECTの肺シンチグラム等の核医学検査を行うことにより、肺の換気量を調べることが行われている。ここで、スパイロメトリは、被験者が吐き出す息の量と吐き出す時間を計測するものであり、COPD(慢性閉塞成敗疾患)等の肺疾患を診断するための検査として推奨されている。しかしながら、スパイロメトリは、肺全体の換気量や換気曲線(肺活量曲線)を求めることはできるものの、肺のどの部分の換気量が低下しているかについては確認することができない。また、SPECT検査では、肺の部位毎の換気の様子が可視化されるが、画質がそれほどよくないため、詳細な情報を得ることができない。また、放射線物質を体内に注入する必要があるため、患者の被曝量が多くなるという問題もある。
このため、呼気および吸気の2相のCT画像から肺領域を抽出し、非剛体レジストレーション手法を用いて、抽出した肺領域の位置合わせを行って肺領域における変位ベクトル場を求め、その発散量を計算することにより、肺の局所的な換気量を計算する手法が提案されている(特許文献1参照)。
また、肺が動く様子を表す3次元的な時系列画像において、各3次元画像に気道を配置し、各3次元画像における気道間の3次元グリッドポイントを抽出し、抽出したポイントの体積を測定することにより、気道の軟化症の広がりを計測する手法が提案されている(特許文献2参照)。
しかしながら、特許文献1に記載された手法では、呼気および吸気の2相のCT画像から肺の局所的な換気量を算出しているため、肺のいずれの部分から空気が取り込まれ始め、いずれの部分から空気が出ていくのかという、換気量の時間的な変化を確認することができない。一方、特許文献2に記載された手法は、呼吸時における肺の3次元的な動きおよび気道における軟化症の広がりを確認できるものの、肺の換気量を確認することはできない。
本発明は上記事情に鑑みなされたものであり、呼吸時における肺の3次元的な動きとともに、肺の局所的な異常を確認できるようにすることを目的とする。
本発明による画像解析装置は、肺についての時相が異なる一連の3次元画像に基づいて、肺の3次元的な換気量の分布を解析する画像解析装置であって、
3次元画像のそれぞれから肺領域を抽出する肺領域抽出手段と、
一連の3次元画像間において肺領域の位置合わせを行って、肺領域における変位ベクトル場を算出する位置合わせ手段と、
3次元画像のそれぞれにおいて、変位ベクトル場に基づいて、変位ベクトル場の各点における、換気量の時間的な変化を表す局所換気量関数を算出する関数算出手段と、
局所換気量関数と基準となる基準換気量関数との相違を定量化して、この相違を表す定量値を算出する定量化手段とを備えたことを特徴とするものである。
3次元画像のそれぞれから肺領域を抽出する肺領域抽出手段と、
一連の3次元画像間において肺領域の位置合わせを行って、肺領域における変位ベクトル場を算出する位置合わせ手段と、
3次元画像のそれぞれにおいて、変位ベクトル場に基づいて、変位ベクトル場の各点における、換気量の時間的な変化を表す局所換気量関数を算出する関数算出手段と、
局所換気量関数と基準となる基準換気量関数との相違を定量化して、この相違を表す定量値を算出する定量化手段とを備えたことを特徴とするものである。
「肺についての時相が異なる一連の3次元画像」としては、同一被写体の肺を含む胸部を短い時間間隔で連続して撮影を行うことにより取得し、時系列順に表示することにより、呼吸による肺の動きを再生することが可能であれば、任意の画像を用いることができる。具体的には、CT画像あるいはMR画像から生成した3次元画像等を用いることができる。
なお、本発明による画像解析装置においては、定量化手段を、局所換気量関数と基準換気量関数との差分を表す差分関数を、定量値として算出する手段としてもよい。
また、本発明による画像解析装置においては、定量化手段を、局所換気量関数と基準換気量関数との差分を表す差分関数を算出し、差分関数における換気量の絶対値の積分値または絶対値の最大値を定量値として算出する手段としてもよい。
また、本発明による画像解析装置においては、定量化手段を、局所換気量関数と基準換気量関数とにおける、所定の換気量に達するまでに時間の相違を、定量値として算出する手段としてもよい。
また、本発明による画像解析装置においては、表示される3次元画像または3次元画像から取得される2次元画像上において、定量値を可視化する表示制御手段をさらに備えるものとしてもよい。
また、本発明による画像解析装置においては、表示制御手段を、3次元画像または2次元画像のそれぞれにおける変位ベクトル場の各点に、定量値をマッピングすることにより、定量値を可視化する手段としてもよい。
また、本発明による画像解析装置においては、位置合わせ手段を、非剛体レジストレーション手法により位置合わせを行う手段としてもよい。
また、本発明による画像解析装置においては、位置合わせ手段を、3次元画像間の相関に基づいて位置合わせを行う手段としてもよい。
また、本発明による画像解析装置においては、3次元画像を、CT画像またはMR画像から生成されてなるものとしてもよい。
また、本発明による画像解析装置においては、定量化手段を、局所換気量関数および基準換気量関数を、時間軸方向に正規化した後に、相違を定量化する手段としてもよい。
また、本発明による画像解析装置においては、定量化手段を、局所換気量関数および基準換気量関数を、局所換気量関数または基準換気量関数の最大値により正規化した後に、相違を定量化する手段としてもよい。
また、本発明による画像解析装置においては、基準換気量関数を、3次元画像を取得した同一被検体についての肺全体の体積変化を表す関数、同一被検体についての肺活量関数、同一被検体の肺の部分領域についての体積変化を表す関数、多数の健常者に基づいて算出した換気量関数、または数学的に算出された換気量関数としてもよい。
本発明による画像解析方法は、肺についての時相が異なる一連の3次元画像に基づいて、肺の3次元的な換気量の分布を解析する画像解析方法であって、
3次元画像のそれぞれから肺領域を抽出し、
一連の3次元画像間において肺領域の位置合わせを行って、肺領域における変位ベクトル場を算出し、
3次元画像のそれぞれにおいて、変位ベクトル場に基づいて、変位ベクトル場の各点における、時間と換気量との関係を表す局所換気量関数を算出し、
局所換気量関数と基準となる基準換気量関数との相違を定量化して、この相違を表す定量値を算出することを特徴とするものである。
3次元画像のそれぞれから肺領域を抽出し、
一連の3次元画像間において肺領域の位置合わせを行って、肺領域における変位ベクトル場を算出し、
3次元画像のそれぞれにおいて、変位ベクトル場に基づいて、変位ベクトル場の各点における、時間と換気量との関係を表す局所換気量関数を算出し、
局所換気量関数と基準となる基準換気量関数との相違を定量化して、この相違を表す定量値を算出することを特徴とするものである。
なお、本発明による画像解析方法をコンピュータに実行させるためのプログラムとして提供してもよい。
本発明によれば、肺についての時相が異なる一連の3次元画像のそれぞれから肺領域が抽出され、一連の3次元画像間において肺領域の位置合わせが行われて、肺領域における変位ベクトル場が算出される。そして、3次元画像のそれぞれにおいて、変位ベクトル場に基づいて、変位ベクトル場の各点における局所換気量関数が算出され、局所換気量関数と基準となる基準換気量関数との相違が定量化されて、相違が定量値として算出される。このため、3次元画像を時系列順に表示することにより、呼吸時における肺の3次元的な動きを確認することができる。また、定量値により、肺の局所的な換気量の異常を確認することができる。
また、定量値を3次元画像上において可視化することにより、呼吸時における肺の3次元的な動きを、肺の局所的な換気量とともに確認することができる。
また、局所換気量関数および基準換気量関数を、時間軸方向に正規化した後に相違を定量化する、あるいは局所換気量関数または基準換気量関数の最大値により正規化した後に相違を定量化することにより、より正確に相違を定量化することができる。
以下、図面を参照して本発明の実施形態について説明する。図1は本発明の実施形態による画像解析装置の構成を示す概略ブロック図である。なお、図1に示す画像解析装置1の構成は、補助記憶装置に読み込まれた画像解析プログラムをコンピュータ上で実行することにより実現される。この画像解析プログラムは、CD-ROM等の記録媒体に記録され、もしくはインターネット等のネットワークを介して配布され、コンピュータにインストールされる。
本実施形態による画像解析装置1は、画像取得部10、記憶部12、肺領域抽出部14、位置合わせ部16、関数算出部18、定量化部20、表示制御部22および入力部24を備える。
画像取得部10は、マルチスライスCT装置またはMRI装置等のモダリティ2において、被写体の胸部を所定の時間間隔Δtで撮影して得られた複数の3次元画像Vi(i=1~n)からなる3次元画像群Vgを取得する、通信インターフェースの機能を有する。なお、3次元画像群VgはLAN経由でモダリティ2から送信される。
ここで、3次元画像Viは、診断対象となる胸部を断層面に垂直な方向に沿って順に得られる2次元の断層画像を積層することによって取得されるものであり、本実施形態においては、モダリティ2において撮影された複数の断層画像を重ね合わせることにより生成される。なお、CT装置を用いて取得した3次元画像は、3次元空間上での格子点を構成するボクセル(すなわち画素位置)毎にX線の吸収量を蓄えたデータとなり、各画素位置に対して1つの信号値(CT装置で撮影した場合は、X線の吸収量を示す値)が与えられたデータとなる。
3次元画像群Vgは、例えば、被写体を一定の時間間隔Δtからなる異なる時相T1、T2、・・・、Tnで撮影を行うことにより取得した、一連の3次元画像Viから構成される。なお、被写体の撮影は、呼気-吸気-呼気の順、または吸気-呼気-吸気の順にて行われることが好ましいが、呼気-吸気の順または吸気-呼気の順で行うようにしてもよい。
なお、3次元画像Viには、DICOM(Digital Imaging and Communications in Medicine)規格で規定された付帯情報が付加される。付帯情報は、例えば、個々の3次元画像Viにより表される3次元画像を識別するための画像ID、被写体を識別するための患者ID、検査を識別するための検査ID、画像情報毎に割り振られるユニークなID(UID)、その画像情報が生成された検査日、検査時刻、その画像情報を取得するための検査で使用されたモダリティの種類、患者氏名、年齢、性別等の患者情報、検査部位(撮影部位、本実施形態においては胸部)、撮影条件(造影剤の使用有無や、放射線量等)、1回の検査で複数の画像を取得したときのシリーズ番号あるいは採取番号等の情報が含まれうる。
記憶部12は、ハードディスク等の大容量の記憶装置であり、3次元画像群Vgが記憶される。なお、記憶部12には、被写体が異なる(すなわち患者が異なる)、あるいは同一被写体で撮影時期が異なる複数の3次元画像群Vgが記憶される。
肺領域抽出部14は、3次元画像Viのそれぞれから肺領域を抽出する。肺領域を抽出する手法としては、3次元画像Viから画素毎の信号値をヒストグラム化し、肺領域をしきい値処理することにより抽出する方法、肺領域を表すシード点に基づく領域拡張法(Region Growing)等、任意の手法を用いることができる。なお、肺の境界付近に病変領域が存在する場合には、例えば特開2008-253293号公報に記載されているように、病変領域である肺領域の凹部分を、肺領域の境界の凹部分前後における曲率を用いた曲線補間によって補間することにより、新たに肺領域に含めて抽出することが好ましい。
位置合わせ部16は、3次元画像Viのそれぞれから抽出した肺領域における対応する画素位置を、3次元画像Vi間において位置合わせして、肺領域における変位ベクトル場を算出する。具体的には、「V. Boldea et al., “Lung Deformation Estimation with Non-rigid Registration for Radiotherapy Treatment”, Proceedings of MICCAI, Vol. 2878, pp. 770-777, 2003」(参考文献1)に記載された手法を用いて、時相が隣接する3次元画像間において対応する画素位置を対応づけることにより位置合わせを行い、時相が隣接する2つの3次元画像間における肺領域の変位ベクトル場を算出する。参考文献1に記載された手法は、非剛体レジストレーション手法を用いて、2つのCT画像から抽出した肺領域同士の位置合わせをボクセルベースで行うものであり、信号値の類似度が最大で、かつ変形による弾性エネルギが最小となる変位ベクトル場を求める手法である。なお、位置合わせの手法としては、参考文献1の手法に限定されるものではなく、時相が隣接する3次元画像間の相関を算出し、相関が最小となる変位ベクトル場を求めることにより行ってもよい。
なお、以降の説明において、位置合わせにより算出された隣接する2つの時相(Ti~Ti+1)間の変位ベクトル場を、2つの時相の間の時間におけるD(Ti)(x,y,z)とする。ここで、(x,y,z)は変位ベクトル場の各点の3次元座標である。また、特定の時間Tkまでの変位ベクトル場の累積変化量をF(Tk)(x,y,z)とする。累積変化量F(Tk)(x,y,z)は、t=T1からt=Tkまで各時相間において取得される変位ベクトル場D(Ti)(x,y,z)を加算したものとなる。
また、位置合わせを行う前に、各3次元画像Viを平滑化するようにしてもよい。具体的には、所定サイズ(例えば3×3×3)の平滑化フィルタを用いて、3次元画像Viの各画素位置の信号値の平均値を算出することにより、各3次元画像Viを平滑化すればよい。これにより、位置合わせを行う場合に、3次元画像Viに含まれるノイズの影響を低減できるため、より正確に位置合わせを行うことができる。
関数算出部18は、位置合わせ部16が算出した変位ベクトル場D(Ti)(x,y,z)を用いて、単位時間当たりの変位ベクトル場の各点の容積の変位量を、局所換気量P(Ti)(x,y,z)として算出する。具体的には、上記特許文献1に記載されたように、肺領域の変位ベクトル場の各点における発散を、肺内の局所換気量として算出する。ここで、局所換気量とは、肺内の任意の一部の領域(局所)内における換気量をいう。本実施形態において局所は、1または互いに隣接する複数のボクセルで構成される。肺領域の変位ベクトル場における各点の発散と肺内の局所換気量との関係は、以下のように説明される。
すなわち、換気は肺内における空気の非圧縮性の移動であり、空気の移動により肺実質が変形する。呼吸に伴う肺実質の変形は、肺を多孔性の弾性体とみなすことにより、弾性体の理論を適用することが可能となる。弾性体における局所変形は、局所における変位ベクトル場と変形テンソル(3×3の行列形式)を用いて表すことができ、とくに、座標軸の方向を変形テンソル場の主方向にとれば、変形テンソルは対角化され、そのトレース(対角成分の和)は、変位ベクトルの発散と一致することが知られている。また、このとき局所における体積変化率は、対角化された変形テンソルのトレースと近似することができる、すなわち、変形による体積の変化率は変位ベクトルの発散に一致するとみなすことが可能である。なお、肺血管等、空気の移動のない組織では、変形はしても体積変化は無視し得るため発散は0となる。
図2は変位ベクトル場の発散と変形による体積変化との関係を概念的に示す図である。なお、図2において、Dは点O1における変位ベクトル場を表し、dx,dy,dzは単位立方体のx,y,z各座標軸方向の微小変位を示している。このとき、単位立方体の体積変化は、(1+dx)・(1+dy)・(1+dz)-1で求まるが、これは、dx+dy+dzで近似することができる。したがって、単位立方体の体積変化率は、変位ベクトル場の発散に一致するとみなせる。発散は任意のベクトル関数をA(x,y,z)とするときに、一般にdivAまたはハミルトンの演算子を用いて∇・Aと表記される。ここで、本実施形態においては、ベクトル関数は変位ベクトル場D(Ti)(x,y,z)であることから、発散divDは、下記の式(1)により算出でき、算出した発散divDが、変位ベクトル場の各点における、ある時相間における局所換気量P(Ti)(x,y,z)となる。
さらに関数算出部18は、各時相間の局所換気量P(Ti)(x,y,z)を全ての時相について積分することにより、換気量の時間的な変化を表す局所換気量関数Q(t)(x,y,z)を算出する。なお、t=T1~Tkまでの局所換気量関数Q(t)(x,y,z)は、t=T1~Tkまで局所換気量P(t)(x,y,z)を加算したものとなる。
定量化部20は、局所換気量関数Q(t)(x,y,z)と基準となる基準換気量関数V(t)(x,y,z)との相違を定量化する。まず、基準換気量関数について説明する。本実施形態においては、基準換気量関数として、大域換気量関数、肺活量換気関数、部分換気量関数、平均モデル換気量関数または数学モデル換気量関数を用いる。なお、これらの関数は、あらかじめ算出されて記憶部12に記憶されている。
大域換気量関数は、3次元画像Viを取得した同一被検体についての肺全体の体積変化を表す関数であり、変位ベクトル場における各点の局所換気量関数Q(t)(x,y,z)を、肺領域内において体積積分(容積積分)することにより算出することができる。大域換気量関数は、3次元画像Viを取得した同一被検体についての肺領域全体の換気量の時間による変化を表すものとなる。
肺活量換気関数は、3次元画像Viを取得した同一被検体についてスパイロメトリを行うことにより取得することができる。肺活量換気関数は、3次元画像Viを取得した同一被検体について、実際の測定により得られた換気量の時間による変化を表すものとなる。
部分換気量関数は、3次元画像Viを取得した同一被検体についての肺野を複数の領域に分割した場合における、部分領域の体積変化を表す関数であり、変位ベクトル場における各点の局所換気量関数Q(t)(x,y,z)を、部分領域毎に体積積分することにより算出することができる。ここで、COPDガイドラインにおいて用いられるGoddard分類においては、左右の肺を肺全体の長さに対する比率で上部、中部および下部の6つの部位に分割して診断が行われることから、Goddard分類にしたがって分割した6つ各部位のそれぞれを部分領域とすることができる。また、肺領域から葉間膜を抽出し、これにより肺を5葉に分割することにより得られる5つの部位を部分領域とすることもできる。また、肺領域から気管支、肺動脈および肺静脈を抽出し、気管支、肺動脈および肺静脈の特定の分岐毎の支配領域を算出し、その支配領域のそれぞれを部分領域とすることもできる。なお、部分領域の境界において、換気量関数が不連続であることが好ましくない場合は、部分領域毎の部分換気量関数を境界付近で補間することにより、部分領域の境界において、換気量関数を滑らかに変化させるようにしてもよい。
次に平均モデル換気量関数について説明する。図3は平均モデル換気量関数の算出を説明するための図である。まず多数の健常者について、上記と同様に3次元画像を用いて局所換気量関数を算出する。ここで、肺領域の大きさは個人により異なるため、所定の大きさの局所換気量関数空間A1を設定し、各個人の肺領域を囲む領域Lj(j=1~m)を局所換気量関数空間A1のサイズと一致するように正規化する。なお、局所換気量関数空間A1および肺領域を囲む領域は直方体であるが、説明のために図3においては矩形にて示している。そして、多数の健常者についての変位ベクトル場における各点の局所換気量関数Q(t)(x,y,z)を局所換気量関数空間A1にマッピングし、各点での局所換気量関数の平均を算出する。この際、局所換気量関数空間A1において、変位ベクトル場の各点が存在しない領域,すなわち、局所換気量関数空間A1において肺領域が全く存在しない領域については、その領域に最も近い点における変位ベクトル場の局所換気量関数を割り当てる。そして各点での局所換気量関数の加算平均を算出し、これを平均モデル換気量関数とする。なお、各点での局所換気量関数の加算平均を,所定サイズ(例えば3×3×3)の平滑化フィルタを用いて平滑化してもよい。これにより、ノイズの影響を低減して、より正確に平均モデル換気量関数を算出できる。
また、局所換気量関数空間A1への正規化に代えて、多数の健常者のうちの一人の肺領域を基準肺領域に設定し、上述した非剛体レジストレーション手法を用いて、基準肺領域に対して他の健常者の肺領域の位置合わせを行うようにしてもよい。この場合、位置合わせ後の基準肺領域に、多数の健常者についての変位ベクトル場における各点の局所換気量関数Q(t)(x,y,z)をマッピングし、各点での局所換気量関数の平均を算出することにより、平均モデル換気量関数を算出すればよい。
数学モデル換気量関数は、上述した平均モデル換気量関数を、数式にて近似したものを用いる。もしくは、「R. Werner et al., “Modeling Respiratory Lung Motion - a Biophysical Approach using Finite Element Methods”, Proc. of SPIE, Vol. 6916, pp. 69160N-1-69160N-11, 2008」(参考文献2)、あるいは「H. Kitaoka, “A 4D Model Generator of the Human Lung”, Forma, Vol. 26, pp. 19-24, 2011」(参考文献3)に記載されたように、あらかじめシミュレーションされた肺の換気モデルから算出された肺換気量関数を使用してもよい。参考文献2に記載された手法は、モデリングされた呼吸換気量関数が、複数時相の3次元画像から抽出された特定の特徴点の位置とのずれを検証する手法である。また、参考文献3に記載された手法は、肺の人工モデルを作成し、その人工モデルから平均的な換気量関数を算出する手法である。
定量化部20は、局所換気量関数Q(t)(x,y,z)と基準換気量関数V(t)(x,y,z)との相違を定量化し、この相違を定量値として算出する。定量化を行うに際し、定量化部20は、局所換気量関数Q(t)(x,y,z)と基準換気量関数V(t)(x,y,z)とを正規化する。
ここで、基準換気量関数が、大域換気量関数および部分換気量関数のように,同一の被検体から局所換気量関数と同時に取得したものである場合、基準換気量関数と局所換気量関数との時間軸方向のずれはないため、両関数の時間軸方向の正規化は不要である。一方、定量化に際しては、両関数の形状を比較することが重要であるため、局所換気量関数Q(t)(x,y,z)および基準換気量関数V(t)(x,y,z)をその全体の変量により正規化する。具体的には、局所換気量関数Q(t)(x,y,z)および基準換気量関数V(t)(x,y,z)を、それぞれの最大値Q(t)maxおよびV(t)maxにより正規化する。正規化した局所換気量関数Q(t)(x,y,z)および基準換気量関数V(t)(x,y,z)は、それぞれQ(t)(x,y,z)/Q(t)maxおよびV(t)(x,y,z)/V(t)maxとなる。
一方、基準換気量関数が肺活量換気関数、平均モデル換気量関数および数学モデル換気量関数である場合、両関数の時間軸方向においても正規化が必要である。このため、量関数の呼気のタイミングおよび吸気のタイミングにより正規化を行う。図4は換気量関数の正規化を説明するための図である。なお、図4においては、基準換気量関数V(t)(x,y,z)を正規化する場合について説明する。図4に示すように、局所換気量関数Q(t)(x,y,z)の吸気のタイミングTQ1および呼気のタイミングTQ2と、基準換気量関数V(t)(x,y,z)の吸気のタイミングTV1および呼気のタイミングTV2とはずれている。このため、基準換気量関数V(t)(x,y,z)における吸気のタイミングTV1および呼気のタイミングTV2が、局所換気量関数Q(t)(x,y,z)の吸気のタイミングTQ1および呼気のタイミングTQ2とそれぞれ一致するように、基準換気量関数V(t)(x,y,z)を正規化する。さらに、時間軸方向に正規化した基準換気量関数を全体の変量により正規化するとともに、局所換気量関数Qを全体の変量により正規化する。以下、正規化した局所換気量関数Q(t)(x,y,z)および基準換気量関数V(t)(x,y,z)をQ′(t)(x,y,z),V′(t)(x,y,z)とする。
ここで、肺の各部位に正常に空気が出入りしている場合は、正規化した局所換気量関数および基準換気量関数は一致するはずである。しかしながら、実際には、特定疾患の影響、重力の影響、あるいは生理学的に正常な呼吸運動により、これらが一致しないことがある。図5は肺のある部位における正規化された局所換気量関数と正規化された基準換気量関数との比較を説明するための図である。図5において横軸は時間を、縦軸は換気量を示している。また、呼吸の開始の時間を基準(すなわち時間=0)とし、呼気-吸気-呼気を行った状態での換気量を示している。肺の疾患の診断を行う際には、換気量が一致しない状況を確認することが重要である。このため、定量化部20は、正規化した局所換気量関数および基準換気量関数の差分値の関数である差分関数B(t)(x,y,z)(=Q′(t)(x,y,z)-V′(t)(x,y,z))を、定量値として算出する。図6は差分関数を示す図である。図6に示すように、差分関数B(t)は、時間の経過による局所換気量と基準換気量との相違、より具体的には、局所位置の換気が基準となる換気よりもどの程度遅れているかを表すものとなる。
なお、基準換気量関数が部分換気量関数である場合には、その部分換気量関数を取得した部分領域についての局所換気量関数とその部分換気量関数とを用いて差分関数を算出すればよい。
表示制御部22は、3次元画像Viをディスプレイ4に表示するに際し、差分関数B(t)(x,y,z)を3次元画像Viとともに表示する。具体的には、3次元画像Viから肺領域を抽出して、肺のボリュームレンダリング画像またはサーフェスレンダリング画像(以下、単にVR画像とする)を表示する。さらに、差分関数B(t)(x,y,z)を、肺のVR画像の表面にマッピング表示する。すなわち、各時相における肺の表面の画素位置における信号値を、その画素位置に対応する差分関数B(t)(x,y,z)の値に応じた色に変換して表示する。この色の変換は、例えば図7に示すように、横軸に差分関数B(t)の値を、縦軸に色(R,G,B)が設定された1次元のルックアップテーブルを用いて行う。なお、図7においては1つのルックアップテーブルのみを示しているが、実際には、R,G,Bの各色について3つのルックアップテーブルが用意されている。
表示制御部22は、ルックアップテーブルを参照して、肺の表面の各画素の信号値を、R,G,Bの各色からなる表示画素値に変換する。そして、変換された肺のVR画像をディスプレイ4に時系列順に表示する。図8は肺のVR画像の表示を説明するための図である。図8に示すように、ディスプレイ4には、肺における換気量が異常となる部分が、肺の呼吸に応じた変形の状態とともに表示される。なお、ディスプレイ4には肺の3次元画像が表示されるが、図8においては説明のために2次元画像にて示している。また、図8においては、吸気の状態において、局所的に換気量の異常が見られる部位を斜線にて示している。
入力部24は、キーボードおよびマウス等の公知の入力装置からなる。
次いで、本実施形態において行われる処理について説明する。図9は本実施形態において行われる処理を示すフローチャートである。なお、複数の肺の3次元画像Viは、画像取得部10により取得されて、記憶部12に記憶されているものとする。操作者が入力部24を操作することにより、表示する3次元画像の選択がなされると(ステップST1肯定)、肺領域抽出部14が、選択された3次元画像Viを記憶部12から読み出し、3次元画像Viのそれぞれから肺領域を抽出する(ステップST2)。そして、位置合わせ部16が、3次元画像Viのそれぞれから抽出した肺領域に対応する画素位置を、3次元画像Vi間において位置合わせする(ステップST3)。これにより、3次元画像Viの各時相における変位ベクトル場が算出される。
そして、関数算出部18が、変位ベクトル場の各点における換気量の時間的な変化を表す局所換気量関数Q(t)(x,y,z)を算出する(ステップST4)。次いで、定量化部20が定量化を行って、局所換気量関数および基準換気量関数の差分値の関数である差分関数B(t)(x,y,z)を、局所換気量関数および基準換気量関数の相違を表す定量値として算出する(定量化、ステップST5)。さらに、表示制御部22が、差分関数がマッピングされた肺のVR画像をディスプレイ4に時系列順に表示し(ステップST6)、処理を終了する。
ここで、癌、気管支ぜんそくおよび肺梗塞等の肺疾患では、肺の一部が硬化してしまい、肺胞の動きがよくない部分が存在する。しかしながら、単に画像を見るだけではそのような部分の診断は難しい。このため、スパイロメトリのように換気量を算出する検査方法もあるが、換気量だけでは、最終的に肺がどの程度空気を取り込んだかが分かるのみであり、肺の動きの状態は分からない。
本実施形態においては、局所換気量関数と基準換気量関数との相違を表す差分関数を3次元画像にマッピングして時系列順に表示するようにしたため、呼吸時における肺の3次元的な動きを確認することができ、かつマッピングされた差分関数により、周囲の状態と比較しての肺の局所的な異常を確認することができる。なお、肺野の一部が完全に硬化してしまって、空気の換気が行われていない場合、換気量が原理的には0になる。本実施形態においては、所定値以上の換気量を有する部位において、換気量が周囲の部位の換気量と比較して正常か異常かを確認でき、また、異常の場合は、どの程度異常かを目で見て確認することができる。したがって、本実施形態を用いて肺の状態を定期的に経過観察することにより、病状が悪化傾向にあるかどうかの診断を容易に行うことができる。
ここで、基準換気量関数を大域換気量関数とした場合、仮に肺全体に空気が均等に取り込まれて呼吸が行われたとすると、肺の各部位における局所換気量関数は、基準換気量関数と類似する関数形状となるはずである。しかしながら、肺に何らかの疾患がある場合は、疾患のある部位の局所換気量関数は、基準換気量関数と異なる関数形状となる。このため、基準換気量関数を大域換気量関数とすることにより、肺の局所的な異常を検出することができる。
一方、基準換気量関数を大域換気量関数とした場合、サンプリング点、すなわち変位ベクトル場を算出した点が少ないと、正確な換気量を推定できないおそれがある。一方、スパイロメトリにおいては、容易に連続した時間の換気量関数を取得することができるため、基準換気量関数を正確かつ容易に算出できる。
また、肺領域の全体から1つの基準換気量関数を算出し、それと局所換気量関数との相違を定量値とすると、重力の影響による部位毎の換気量関数との相違、あるいは本来生理学的に正常だと判断されるべき部位毎の換気量関数との相違を区別することができず、その結果、このような相違を有する部位も異常部位として検出されてしまうおそれがある。このため、基準換気量関数を部位換気量関数とし、部位毎に部位換気量関数と局所換気量関数との相違を定量化することにより、局所的に異常のある部位のみを検出することができる。
また、基準換気量関数を、健常者を用いて事前に計算された平均モデル換気量関数および数学モデル換気量関数とすることにより、さらに異常部位の特定が容易となるとともに、肺野の重力による換気量の偏り、あるいは生理学的に存在する換気量の偏りの影響を排除した異常部位の特定が可能となる。
なお、上記実施形態においては、肺のVR画像における肺の表面に差分関数B(t)をマッピングしているが、VR画像における肺を切断した断面上に差分関数B(t)をマッピングしてもよい。
また、上記実施形態においては、差分関数B(t)を定量値として算出しているが、図6に示す差分関数B(t)の絶対値の最大値|B(Tk)|を定量値として算出してもよい。この絶対値の最大値|B(Tk)|は、その差分関数B(t)を算出した部位における、正常な部位との最大の換気量の相違を表すものとなる。また、絶対値|B(t)|が最大となる時間Tkを定量値としてもよい。この時間Tkは、その差分関数B(t)を算出した部位における正常な部位との換気量の相違が最大となる時間を表すものとなる。なお、時間は例えば呼気の開始時のように所定の時点を基準とすればよい。また、差分関数B(t)の積分値を定量値としてもよい。この場合、定量値は、その差分関数B(t)を算出した部位における正常な部位との換気量の相違の総和を表すものとなる。
また、図10に示すように、空気の換気が他の部位と比較して早く行われている部位については、局所換気量関数が所定の換気量Vkとなるまでの時間Tp1は、基準換気量関数が所定換気量となるまでの時間Tbよりも早くなる。逆に、空気の換気が他の部位と比較して遅く行われている部位については、局所換気量関数が所定の換気量となるまでの時間Tp2は、基準換気量関数が所定換気量となるまでの時間Tbよりも遅くなる。このため、局所換気量関数において、ある基準となる時間(例えば図10に示すように呼気の開始時の時間)から所定の換気量Vkとなるまでの時間と、基準換気量関数における所定の換気量Vkとなるまでの時間との差分値(例えばTp-Tb)を定量値として算出してもよい。この場合、ある部位における定量値が負となれば、その部位は空気の換気が他の部位と比較して早く行われており、定量値が正となれば、空気の換気が他の部位と比較して遅く行われていることが分かる。
なお、このような差分関数でない定量値を算出した場合においても、肺のVR画像に定量値をマッピングすればよい。この場合、時間の経過によっても肺の表面の色は変化しないこととなるが、肺の動きの状態と換気量が異常値となる部位とを確認することができる。また、この場合においても、VR画像における肺を切断した断面上に定量値をマッピングしてもよい。さらに、図11に示すように、3次元画像ViにおけるMPR断面上の肺領域に定量値をオーバーレイ表示してもよい。なお、図11においてはオーバーレイ表示した部分を斜線にて示している。
Claims (14)
- 肺についての時相が異なる一連の3次元画像に基づいて、前記肺の3次元的な換気量の分布を解析する画像解析装置であって、
前記3次元画像のそれぞれから肺領域を抽出する肺領域抽出手段と、
前記一連の3次元画像間において前記肺領域の位置合わせを行って、前記肺領域における変位ベクトル場を算出する位置合わせ手段と、
前記3次元画像のそれぞれにおいて、前記変位ベクトル場に基づいて、該変位ベクトル場の各点における、換気量の時間的な変化を表す局所換気量関数を算出する関数算出手段と、
前記局所換気量関数と基準となる基準換気量関数との相違を定量化して、該相違を表す定量値を算出する定量化手段とを備えたことを特徴とする画像解析装置。 - 前記定量化手段は、前記局所換気量関数と前記基準換気量関数との差分を表す差分関数を前記定量値として算出する手段であることを特徴とする請求項1記載の画像解析装置。
- 前記定量化手段は、前記局所換気量関数と前記基準換気量関数との差分を表す差分関数を算出し、該差分関数における換気量の絶対値の積分値または該絶対値の最大値を前記定量値として算出する手段であることを特徴とする請求項1記載の画像解析装置。
- 前記定量化手段は、前記局所換気量関数と前記基準換気量関数とにおける、所定の換気量に達するまでに時間の相違を前記定量値として算出する手段であることを特徴とする請求項1記載の画像解析装置。
- 表示される前記3次元画像または該3次元画像から取得される2次元画像上において、前記定量値を、可視化する表示制御手段をさらに備えたことを特徴とする請求項1から4のいずれか1項記載の画像解析装置。
- 前記表示制御手段は、前記3次元画像または前記2次元画像のそれぞれにおける前記変位ベクトル場の各点に、前記定量値をマッピングすることにより、前記定量値を可視化する手段であることを特徴とする請求項5記載の画像解析装置。
- 前記位置合わせ手段は、非剛体レジストレーション手法により前記位置合わせを行う手段であることを特徴とする請求項1から6のいずれか1項記載の画像解析装置。
- 前記位置合わせ手段は、前記3次元画像間の相関に基づいて前記位置合わせを行う手段であることを特徴とする請求項1から6のいずれか1項記載の画像解析装置。
- 前記3次元画像は、CT画像またはMR画像から生成されてなることを特徴とする請求項1から8のいずれか1項記載の画像解析装置。
- 前記定量化手段は、前記局所換気量関数および前記基準換気量関数を、時間軸方向に正規化した後に、前記相違を定量化する手段であることを特徴とする請求項1から9のいずれか1項記載の画像解析装置。
- 前記定量化手段は、前記局所換気量関数および前記基準換気量関数を、前記局所換気量関数または前記基準換気量関数の最大値により正規化した後に、前記相違を定量化する手段であることを特徴とする請求項1から10のいずれか1項記載の画像解析装置。
- 前記基準換気量関数は、前記3次元画像を取得した同一被検体についての肺全体の体積変化を表す関数、前記同一被検体についての肺活量関数、前記同一被検体の前記肺の部分領域についての体積変化を表す関数、多数の健常者に基づいて算出した換気量関数、または数学的に算出された換気量関数であることを特徴とする請求項1から11のいずれか1項記載の画像解析装置。
- 肺についての時相が異なる一連の3次元画像に基づいて、前記肺の3次元的な換気量の分布を解析する画像解析方法であって、
前記3次元画像のそれぞれから肺領域を抽出し、
前記一連の3次元画像間において前記肺領域の位置合わせを行って、前記肺領域における変位ベクトル場を算出し、
前記3次元画像のそれぞれにおいて、前記変位ベクトル場に基づいて、該変位ベクトル場の各点における、時間と換気量との関係を表す局所換気量関数を算出し、
前記局所換気量関数と基準となる基準換気量関数との相違を定量化して、該相違を表す定量値を算出することを特徴とする画像解析方法。 - 肺についての時相が異なる一連の3次元画像に基づいて、前記肺の3次元的な換気量の分布を解析する画像解析方法をコンピュータに実行させるためのプログラムであって、
前記3次元画像のそれぞれから肺領域を抽出する手順と、
前記一連の3次元画像間において前記肺領域の位置合わせを行って、前記肺領域における変位ベクトル場を算出する手順と、
前記3次元画像のそれぞれにおいて、前記変位ベクトル場に基づいて、該変位ベクトル場の各点における、時間と換気量との関係を表す局所換気量関数を算出する手順と、
前記局所換気量関数と基準となる基準換気量関数との相違を定量化して、該相違を表す定量値を算出する手順とをコンピュータに実行させることを特徴とするプログラム。
Priority Applications (2)
| Application Number | Priority Date | Filing Date | Title |
|---|---|---|---|
| EP13763526.4A EP2829233A4 (en) | 2012-03-23 | 2013-03-13 | PICTURE ANALYSIS DEVICE, METHOD AND PROGRAM |
| US14/489,529 US9117287B2 (en) | 2012-03-23 | 2014-09-18 | Image analysis apparatus, method, and program |
Applications Claiming Priority (2)
| Application Number | Priority Date | Filing Date | Title |
|---|---|---|---|
| JP2012-066598 | 2012-03-23 | ||
| JP2012066598A JP5844187B2 (ja) | 2012-03-23 | 2012-03-23 | 画像解析装置および方法並びにプログラム |
Related Child Applications (1)
| Application Number | Title | Priority Date | Filing Date |
|---|---|---|---|
| US14/489,529 Continuation US9117287B2 (en) | 2012-03-23 | 2014-09-18 | Image analysis apparatus, method, and program |
Publications (1)
| Publication Number | Publication Date |
|---|---|
| WO2013140749A1 true WO2013140749A1 (ja) | 2013-09-26 |
Family
ID=49222231
Family Applications (1)
| Application Number | Title | Priority Date | Filing Date |
|---|---|---|---|
| PCT/JP2013/001640 Ceased WO2013140749A1 (ja) | 2012-03-23 | 2013-03-13 | 画像解析装置および方法並びにプログラム |
Country Status (4)
| Country | Link |
|---|---|
| US (1) | US9117287B2 (ja) |
| EP (1) | EP2829233A4 (ja) |
| JP (1) | JP5844187B2 (ja) |
| WO (1) | WO2013140749A1 (ja) |
Cited By (2)
| Publication number | Priority date | Publication date | Assignee | Title |
|---|---|---|---|---|
| CN105939439A (zh) * | 2015-03-02 | 2016-09-14 | 佳能株式会社 | 图像处理装置、摄像装置及图像处理方法 |
| JP2019141719A (ja) * | 2019-05-23 | 2019-08-29 | キヤノン株式会社 | 医用画像処理装置、医用画像処理方法 |
Families Citing this family (37)
| Publication number | Priority date | Publication date | Assignee | Title |
|---|---|---|---|---|
| DE102011017778A1 (de) * | 2011-04-29 | 2012-10-31 | Charité - Universitätsmedizin Berlin | Verfahren und Anordnung zur Gewebecharakterisierung von menschlichem oder tierischem Gewebe |
| WO2013111813A1 (ja) * | 2012-01-27 | 2013-08-01 | 株式会社 東芝 | 医用画像処理装置 |
| JP6106260B2 (ja) * | 2012-03-23 | 2017-03-29 | コーニンクレッカ フィリップス エヌ ヴェKoninklijke Philips N.V. | ボリュームレンダリング |
| JP6323451B2 (ja) * | 2013-05-28 | 2018-05-16 | コニカミノルタ株式会社 | 画像処理装置及びプログラム |
| US10424225B2 (en) * | 2013-09-23 | 2019-09-24 | SonoSim, Inc. | Method for ultrasound training with a pressure sensing array |
| JP5968928B2 (ja) * | 2014-02-14 | 2016-08-10 | 富士フイルム株式会社 | 医用画像表示制御装置およびその作動方法並びに医用画像表示制御プログラム |
| JP6411072B2 (ja) * | 2014-06-02 | 2018-10-24 | キヤノンメディカルシステムズ株式会社 | 医用画像処理装置、医用画像処理方法およびプログラム |
| US10062167B2 (en) * | 2014-08-15 | 2018-08-28 | Toshiba Medical Systems Corporation | Estimated local rigid regions from dense deformation in subtraction |
| US9972081B2 (en) * | 2014-10-30 | 2018-05-15 | Edda Technology, Inc. | Method and system for estimating a deflated lung shape for video assisted thoracic surgery |
| US10499992B2 (en) | 2014-10-30 | 2019-12-10 | Edda Technology, Inc. | Method and system for estimating a deflated lung shape for video assisted thoracic surgery in augmented and mixed reality |
| US9675317B2 (en) * | 2014-12-22 | 2017-06-13 | Toshiba Medical Systems Corporation | Interface identification apparatus and method |
| US9454814B2 (en) * | 2015-01-27 | 2016-09-27 | Mckesson Financial Holdings | PACS viewer and a method for identifying patient orientation |
| JP6494328B2 (ja) | 2015-03-02 | 2019-04-03 | キヤノン株式会社 | 画像処理装置、撮像装置、画像処理方法、画像処理プログラム、および、記憶媒体 |
| US10299752B2 (en) * | 2015-04-27 | 2019-05-28 | Toshiba Medical Systems Corporation | Medical image processing apparatus, X-ray CT apparatus, and image processing method |
| JP6413927B2 (ja) * | 2015-05-25 | 2018-10-31 | コニカミノルタ株式会社 | 動態解析装置及び動態解析システム |
| JP2017099616A (ja) * | 2015-12-01 | 2017-06-08 | ソニー株式会社 | 手術用制御装置、手術用制御方法、およびプログラム、並びに手術システム |
| KR102510760B1 (ko) * | 2016-02-15 | 2023-03-16 | 삼성전자주식회사 | 영상처리장치, 영상처리방법 및 이를 기록한 기록매체 |
| KR102728701B1 (ko) * | 2016-02-15 | 2024-11-12 | 삼성전자주식회사 | 영상처리장치, 영상처리방법 및 이를 기록한 기록매체 |
| JP6929689B2 (ja) | 2016-04-26 | 2021-09-01 | キヤノンメディカルシステムズ株式会社 | 医用画像処理装置及び医用画像診断装置 |
| JP6686733B2 (ja) * | 2016-06-23 | 2020-04-22 | コニカミノルタ株式会社 | 動態解析システム |
| JP2018000281A (ja) * | 2016-06-28 | 2018-01-11 | コニカミノルタ株式会社 | 動態解析システム |
| JP6970737B2 (ja) | 2016-08-18 | 2021-11-24 | ウィリアム・ボーモント・ホスピタルWilliam Beaumont Hospital | 4dコンピュータ断層撮影から呼吸性血液量変化を決定するシステム及び方法 |
| JP2018068814A (ja) * | 2016-11-01 | 2018-05-10 | 国立大学法人東北大学 | 画像処理装置、画像処理方法、及び、画像処理プログラム |
| JP2018122093A (ja) * | 2017-02-02 | 2018-08-09 | キヤノンメディカルシステムズ株式会社 | 医用画像処理装置、x線ct装置、及び医用画像処理方法 |
| JP7040908B2 (ja) * | 2017-09-28 | 2022-03-23 | 日鉄鋼板株式会社 | サンドイッチパネル、及び壁ユニット |
| GB201716890D0 (en) * | 2017-10-13 | 2017-11-29 | Optellum Ltd | System, method and apparatus for assisting a determination of medical images |
| JP7047574B2 (ja) * | 2018-04-26 | 2022-04-05 | コニカミノルタ株式会社 | 動態画像解析装置、動態画像解析システム、動態画像解析プログラム及び動態画像解析方法 |
| US10650585B2 (en) * | 2018-06-08 | 2020-05-12 | Data Integrity Advisors, Llc | System and method for geometrically-resolved radiographic X-ray imaging |
| EP3683765A1 (en) * | 2019-01-18 | 2020-07-22 | Koninklijke Philips N.V. | System for determining a tissue-specific property |
| JP7074101B2 (ja) * | 2019-03-20 | 2022-05-24 | コニカミノルタ株式会社 | 動態解析装置、動態解析システム、予測率算出方法及びプログラム |
| JP2021194139A (ja) * | 2020-06-11 | 2021-12-27 | コニカミノルタ株式会社 | 画像表示装置及びプログラム |
| JP7643875B2 (ja) * | 2021-01-15 | 2025-03-11 | キヤノン株式会社 | 情報処理装置、情報処理方法、及びプログラム |
| US12340527B2 (en) * | 2021-10-05 | 2025-06-24 | Koninklijke Philips N.V. | Inter- and extrapolation of chest image and mechanical ventilation settings into a time lapse series for progression monitoring and outcome prediction during long term mechanical ventilation |
| EP4197444A1 (en) | 2021-12-20 | 2023-06-21 | Koninklijke Philips N.V. | Lung volume estimation from radiographic images |
| CN116763331B (zh) * | 2023-05-16 | 2025-12-09 | 深圳市安健科技股份有限公司 | 一种基于dr的通气量测量方法及装置 |
| EP4403211B1 (en) * | 2023-06-30 | 2025-06-11 | Siemens Healthineers AG | A method for providing adapted 4d ct data |
| WO2025111647A1 (en) * | 2023-11-27 | 2025-06-05 | 4DMedical Limited | Method of assessing lung health |
Citations (7)
| Publication number | Priority date | Publication date | Assignee | Title |
|---|---|---|---|---|
| JPH09294728A (ja) * | 1996-05-02 | 1997-11-18 | Nippon Colin Co Ltd | 血圧監視装置 |
| JP2005028121A (ja) | 2003-06-17 | 2005-02-03 | Iyo Gazo Kenkyusho:Kk | 呼吸気ct画像による換気分布計測方法 |
| US20080009683A1 (en) | 2006-07-07 | 2008-01-10 | Siemens Medical Solutions Usa, Inc. | System and Method For Automatic Detection and Measurement of Malacia In The Airways |
| JP2008253293A (ja) | 2007-03-30 | 2008-10-23 | Fujifilm Corp | Ct画像からの肺野領域抽出方法 |
| JP2009153677A (ja) * | 2007-12-26 | 2009-07-16 | Konica Minolta Medical & Graphic Inc | 動態画像処理システム |
| JP2010268979A (ja) * | 2009-05-22 | 2010-12-02 | Konica Minolta Medical & Graphic Inc | 動画像処理装置及びプログラム |
| WO2012026146A1 (ja) * | 2010-08-27 | 2012-03-01 | コニカミノルタエムジー株式会社 | 胸部診断支援システム及びプログラム |
Family Cites Families (4)
| Publication number | Priority date | Publication date | Assignee | Title |
|---|---|---|---|---|
| US7221787B2 (en) * | 2002-12-10 | 2007-05-22 | Eastman Kodak Company | Method for automated analysis of digital chest radiographs |
| US8538111B2 (en) * | 2008-04-21 | 2013-09-17 | University Of South Florida | Method and apparatus for pulmonary ventilation imaging using local volume changes |
| RU2542096C2 (ru) * | 2009-01-30 | 2015-02-20 | Конинклейке Филипс Электроникс Н.В. | Система для представления информации о вентиляции легких |
| WO2012026145A1 (ja) * | 2010-08-27 | 2012-03-01 | コニカミノルタエムジー株式会社 | 診断支援システム及びプログラム |
-
2012
- 2012-03-23 JP JP2012066598A patent/JP5844187B2/ja active Active
-
2013
- 2013-03-13 WO PCT/JP2013/001640 patent/WO2013140749A1/ja not_active Ceased
- 2013-03-13 EP EP13763526.4A patent/EP2829233A4/en not_active Withdrawn
-
2014
- 2014-09-18 US US14/489,529 patent/US9117287B2/en active Active
Patent Citations (7)
| Publication number | Priority date | Publication date | Assignee | Title |
|---|---|---|---|---|
| JPH09294728A (ja) * | 1996-05-02 | 1997-11-18 | Nippon Colin Co Ltd | 血圧監視装置 |
| JP2005028121A (ja) | 2003-06-17 | 2005-02-03 | Iyo Gazo Kenkyusho:Kk | 呼吸気ct画像による換気分布計測方法 |
| US20080009683A1 (en) | 2006-07-07 | 2008-01-10 | Siemens Medical Solutions Usa, Inc. | System and Method For Automatic Detection and Measurement of Malacia In The Airways |
| JP2008253293A (ja) | 2007-03-30 | 2008-10-23 | Fujifilm Corp | Ct画像からの肺野領域抽出方法 |
| JP2009153677A (ja) * | 2007-12-26 | 2009-07-16 | Konica Minolta Medical & Graphic Inc | 動態画像処理システム |
| JP2010268979A (ja) * | 2009-05-22 | 2010-12-02 | Konica Minolta Medical & Graphic Inc | 動画像処理装置及びプログラム |
| WO2012026146A1 (ja) * | 2010-08-27 | 2012-03-01 | コニカミノルタエムジー株式会社 | 胸部診断支援システム及びプログラム |
Non-Patent Citations (5)
| Title |
|---|
| H. KITAOKA: "A 4D Model Generator of the Human Lung", FORMA, vol. 26, 2011, pages 19 - 24 |
| K. DU ET AL.: "Registration-based measurement of regional expiration volume ratio using dynamic 4DCT imaging", 2011 IEEE INTERNATIONAL SYMPOSIUM ON BIOMEDICAL IMAGING, 2011, pages 424 - 428, XP031944569 * |
| R. WERNER ET AL.: "Modeling Respiratory Lung Motion - a Biophysical Approach using Finite Element Methods", PROC. OF SPIE, vol. 6916, 2008, pages 69160N - 1,69160N-11 |
| See also references of EP2829233A4 |
| V. BOLDEA ET AL.: "Lung Deformation Estimation with Non-rigid Registration for Radiotherapy Treatment", PROCEEDINGS OF MICCAI, vol. 2878, 2003, pages 770 - 777 |
Cited By (2)
| Publication number | Priority date | Publication date | Assignee | Title |
|---|---|---|---|---|
| CN105939439A (zh) * | 2015-03-02 | 2016-09-14 | 佳能株式会社 | 图像处理装置、摄像装置及图像处理方法 |
| JP2019141719A (ja) * | 2019-05-23 | 2019-08-29 | キヤノン株式会社 | 医用画像処理装置、医用画像処理方法 |
Also Published As
| Publication number | Publication date |
|---|---|
| JP2013192912A (ja) | 2013-09-30 |
| US9117287B2 (en) | 2015-08-25 |
| JP5844187B2 (ja) | 2016-01-13 |
| EP2829233A4 (en) | 2015-11-18 |
| EP2829233A1 (en) | 2015-01-28 |
| US20150005659A1 (en) | 2015-01-01 |
Similar Documents
| Publication | Publication Date | Title |
|---|---|---|
| JP5844187B2 (ja) | 画像解析装置および方法並びにプログラム | |
| TWI866693B (zh) | 用於肺體積閘控x射線成像系統和方法,及其非暫態電腦可讀取儲存媒介 | |
| TWI840465B (zh) | 決定輻射參數的系統和方法以及其非暫態電腦可讀取儲存媒介 | |
| JP7524383B2 (ja) | 肺および血管の健康状態を検査し評価する方法 | |
| EP3052018B1 (en) | An electrical impedance tomography system | |
| CN105101878B (zh) | 医用图像处理装置以及医用图像处理方法 | |
| JP4560643B2 (ja) | 呼吸気ct画像による換気分布計測方法 | |
| US12602774B2 (en) | Regional pulmonary V/Q via image registration and multi-energy CT | |
| CN102802534B (zh) | 医用图像转换设备、方法和程序 | |
| CN103857340A (zh) | 心脏成像方法 | |
| EP3545845B1 (en) | Method for processing computed tomography imaging data of a suspect`s respiratory system | |
| Xue et al. | Effective lung ventilation estimation based on 4D CT image registration and supervoxels | |
| JP6273940B2 (ja) | 画像解析装置、画像撮影システム及び画像解析プログラム | |
| JP5068334B2 (ja) | 医用画像変換装置および方法並びにプログラム | |
| JP5068336B2 (ja) | 医用画像変換装置および方法並びにプログラム | |
| Nye et al. | Current state of hybrid imaging: attenuation correction and fusion | |
| KR101529658B1 (ko) | 장기의 기능 및 구조의 통합 분석 방법 | |
| Schoebinger et al. | Quantification of tumor mobility during the breathing cycle using 3D dynamic MRI | |
| HASHIMOTO et al. | Quantification of the Respiratory Activity of the Lung using CT Images | |
| Ding | Regional lung function and mechanics using image registration | |
| HK40047128A (en) | System and method for lung-volume-gated x-ray imaging |
Legal Events
| Date | Code | Title | Description |
|---|---|---|---|
| 121 | Ep: the epo has been informed by wipo that ep was designated in this application |
Ref document number: 13763526 Country of ref document: EP Kind code of ref document: A1 |
|
| REEP | Request for entry into the european phase |
Ref document number: 2013763526 Country of ref document: EP |
|
| WWE | Wipo information: entry into national phase |
Ref document number: 2013763526 Country of ref document: EP |
|
| NENP | Non-entry into the national phase |
Ref country code: DE |