WO2014021238A1 - Image pickup apparatus, depth information acquisition method and program - Google Patents
Image pickup apparatus, depth information acquisition method and program Download PDFInfo
- Publication number
- WO2014021238A1 WO2014021238A1 PCT/JP2013/070406 JP2013070406W WO2014021238A1 WO 2014021238 A1 WO2014021238 A1 WO 2014021238A1 JP 2013070406 W JP2013070406 W JP 2013070406W WO 2014021238 A1 WO2014021238 A1 WO 2014021238A1
- Authority
- WO
- WIPO (PCT)
- Prior art keywords
- image
- focusing position
- movement amount
- focus movement
- depth information
- Prior art date
- Legal status (The legal status is an assumption and is not a legal conclusion. Google has not performed a legal analysis and makes no representation as to the accuracy of the status listed.)
- Ceased
Links
Classifications
-
- G—PHYSICS
- G02—OPTICS
- G02B—OPTICAL ELEMENTS, SYSTEMS OR APPARATUS
- G02B7/00—Mountings, adjusting means, or light-tight connections, for optical elements
- G02B7/28—Systems for automatic generation of focusing signals
- G02B7/36—Systems for automatic generation of focusing signals using image sharpness techniques, e.g. image processing techniques for generating autofocus signals
- G02B7/38—Systems for automatic generation of focusing signals using image sharpness techniques, e.g. image processing techniques for generating autofocus signals measured at different points on the optical axis, e.g. focussing on two or more planes and comparing image data
-
- H—ELECTRICITY
- H04—ELECTRIC COMMUNICATION TECHNIQUE
- H04N—PICTORIAL COMMUNICATION, e.g. TELEVISION
- H04N23/00—Cameras or camera modules comprising electronic image sensors; Control thereof
- H04N23/60—Control of cameras or camera modules
- H04N23/67—Focus control based on electronic image sensor signals
- H04N23/676—Bracketing for image capture at varying focusing conditions
-
- G—PHYSICS
- G06—COMPUTING OR CALCULATING; COUNTING
- G06T—IMAGE DATA PROCESSING OR GENERATION, IN GENERAL
- G06T7/00—Image analysis
- G06T7/50—Depth or shape recovery
- G06T7/55—Depth or shape recovery from multiple images
- G06T7/571—Depth or shape recovery from multiple images from focus
-
- H—ELECTRICITY
- H04—ELECTRIC COMMUNICATION TECHNIQUE
- H04N—PICTORIAL COMMUNICATION, e.g. TELEVISION
- H04N23/00—Cameras or camera modules comprising electronic image sensors; Control thereof
- H04N23/70—Circuitry for compensating brightness variation in the scene
- H04N23/743—Bracketing, i.e. taking a series of images with varying exposure conditions
-
- H—ELECTRICITY
- H04—ELECTRIC COMMUNICATION TECHNIQUE
- H04N—PICTORIAL COMMUNICATION, e.g. TELEVISION
- H04N5/00—Details of television systems
- H04N5/222—Studio circuitry; Studio devices; Studio equipment
- H04N5/2224—Studio circuitry; Studio devices; Studio equipment related to virtual studio applications
- H04N5/2226—Determination of depth image, e.g. for foreground/background separation
-
- G—PHYSICS
- G06—COMPUTING OR CALCULATING; COUNTING
- G06T—IMAGE DATA PROCESSING OR GENERATION, IN GENERAL
- G06T2207/00—Indexing scheme for image analysis or image enhancement
- G06T2207/10—Image acquisition modality
- G06T2207/10028—Range image; Depth image; 3D point clouds
Definitions
- the present invention relates to technology for measuring depth information of an object from a plurality of images captured by altering the focusing position.
- the Depth from Defocus (DFD) method such as that described in Japanese Patent Application Publication No. H01-167610 (PTL1) has been proposed as a method for acquiring a depth of a captured scene from an image acquired by an image pickup apparatus.
- DFD Depth from Defocus
- a plurality of images having different amounts of blur are acquired by controlling the imaging parameters of an imaging optical system, and the respective magnitudes and correlation amounts of blur are calculated by using measurement object pixels and pixels peripheral to these in the plurality of acquired images.
- the depth is calculated by using the relationship therebetween.
- depth measurement by the DFD method it is possible to calculate the depth by one imaging system, and therefore such a method is advantageous in that it can be incorporated into a commercially
- the inventors discovered that the imaging conditions which are set for the plurality of images to be acquired have an effect on the depth estimate accuracy (measurement accuracy) , and the measurable range, and also that the desirable imaging conditions vary depending on the characteristics of the imaging optical system.
- an image pickup apparatus which acquires depth information about an object from- a plurality of images which are captured by varying the focusing position.
- the depth information about an object may be any depth information about an object.
- the relative depth (distance) and the absolute depth (distance) may be a distance on the side of an image plane or a distance on the side of an object.
- the present invention in. its first aspect provides an image pickup apparatus, comprising: an imaging unit which acquires a first image by capturing an object at a first focusing position, and which acquires a second image after acquiring the first image, by capturing the object at a second focusing position which is different from the first focusing position, the second image having different blur from the first image; a depth information determination unit determining depth information of the object on the basis of a difference in blur between the first image and the second image; and a focusing position setting unit setting a focus movement amount which is a difference between the first focusing position and the second focusing position, in accordance with an F-number of the imaging unit, wherein the focusing position setting unit sets the second focusing position in such a manner that an absolute value of the focus movement amount is larger when the F- number is large, compared to when the F-number is
- the present invention in its second aspect provides an image pickup apparatus, comprising: an imaging unit which acquires a first image by capturing an object at a first focusing position, and which acquires a second image after acquiring the first image, by capturing the object at a second focusing position which is different from the first focusing position, the second image having different blur from the first image; a depth information
- a focus movement amount which is a difference between the first focusing position and the second focusin position, satisfies the formula given below:
- d focus movement amount at image plane
- k coefficient
- F F-number
- the present invention in its third aspect provides a depth information acquisition method, comprising: a first imaging step of acquiring a first image by capturing an object at a first focusing position; a second imaging step of acquiring a second image having different blur from the first image, by capturing the object at a second focusing position which is different from the first focusing position, after the first imaging step; and a depth information determining step of determining depth
- the second imaging step includes a focusing position setting step of setting a focus movement amount which is a difference between the first focusing position and the second focusing position in accordance with an F-number during imaging, and in the focusing position setting step, the second focusing position is set in such a manner that an absolute value of the focus movement amount is larger when the F-number is large, compared to when the F-number is relatively small.
- the present invention in its fourth aspect provides a depth information acquisition method, comprising: a first imaging step of acquiring a first image by capturing an object at a first focusing position; a second imaging step of acquiring a second image having different blur from the first image, by capturing the object at a second focusing position which is different from the first focusing position, after the first imaging step; and a depth information acquisition method, comprising: a first imaging step of acquiring a first image by capturing an object at a first focusing position; a second imaging step of acquiring a second image having different blur from the first image, by capturing the object at a second focusing position which is different from the first focusing position, after the first imaging step; and a depth information acquisition method, comprising: a first imaging step of acquiring a first image by capturing an object at a first focusing position; a second imaging step of acquiring a second image having different blur from the first image, by capturing the object at a second focusing position which is different from the first focusing position, after
- the second focusing position is set in such a manner that a focus movement amount, which is a difference between the first focusing position and the second focusing position, satisfies the formula given below:
- d focus movement amount at image plane
- k coefficient
- F F-number
- the present invention in its fifth aspect provides a program which causes a computer to execute the respective steps of the depth information acquisition method according to the present invention.
- the present invention it is possible to set suitable imaging conditions in accordance with the characteristics of an optical system and/or the purpose of depth measurement, in an image pickup apparatus which acquires depth information about an object from a plurality of images which are captured by varying the focusing position .
- Fig. 1 is a diagram showing a composition of an imaging pickup apparatus relating to a first embodiment of the present invention
- Fig. 2 is a diagram plotting a cross-section of a
- Fig. 3 is a diagram showing defocusing
- Fig. 4 is a diagram showing the characteristics of a PSF peak ratio relating to the first embodiment of the invention.
- Figs. 5A to 5F are diagrams showing change in the PSF peak ratio with change in the focus movement amount
- Figs. 6A and 6B are diagrams showing the dependence on the focus movement amount, of the depth measurement range and the value range of the PSF peak ratio
- Fig. 7 is a diagram showing the relationship between the focus movement amount and the F-number
- Figs. 8A and 8B are diagrams showing the dependence on the focus movement amount of the depth measurement range
- Fig. 9 is a diagram showing the characteristics of a PSF peak ratio relating to a second embodiment of the invention.
- Fig. 10 is a diagram showing the dependence on the focus movement amount of a PSF peak ratio gradient
- Fig. 11 is a diagram showing defocusing
- Figs. 12A to 12F are diagrams showing the
- Figs. 13A to 13C are diagrams showing the dependence on the focus movement amount, of the depth measurement range and the PSF correlation amount
- Fig. 14 is a diagram showing change in an evaluation value with the focus movement amount
- Fig. 15 is a diagram showing a relationship between object depth and image plane depth.
- Fig. 16 is a diagram showing the characteristics of a PSF peak ratio when the focus movement amount is a maximum. Description of Embodiments
- the present invention relates to technology for acquiring depth information about an object on the basis of difference in the respective blur of two or more images which are captured by varying the focusing position, and thus proposes improvements in a so-called Depth from
- Defocus (DFD) method The present inventors discovered that, when estimating the depth in respective pixels from a plurality of images having different focusing positions, the settings of the focusing positions in each image can affect the depth estimate accuracy and the size of the measurable depth range. Furthermore, the inventors also discovered that the desirable conditions in relation to the focusing position vary with the characteristics of the optical system of the image pickup apparatus. Therefore, the present description proposes designing the focusing position conditions of the image used for depth estimation, in accordance with the characteristics of the optical system of the image pickup apparatus.
- the present description proposes automatically changing the focusing position conditions accordingly, in the case of an image pickup apparatus having variable characteristics of the optical system (although the user may expressly change the characteristics, or the image pickup apparatus may change the characteristics automatically in accordance with the imaging mode or the environment) .
- Fig. 1 shows a schematic view of a composition of an imaging optical system and focusing positions when an image for depth estimation is captured.
- the optical system is aligned with a first focusing position (for example, the light path indicated by the solid line) , and an image of the object is captured.
- the optical system is changed to a second focusing position (for example, the light path indicated by the broken line), and an image of the same object is captured. Consequently, two images having different blur are obtained.
- the focus movement amount is determined . as indicated below from the F-number (F) of the optical system and the wavelength of the light used to capture the images.
- the focus movement amount in the formula given below is an amount of movement on the image plane side, and in Fig. 1, is the distance indicated by the symbol d. Furthermore, the first focusing position (image plane position) is taken to be 0.
- Formula 1 indicates that, when the F-number of the optical system is large, the absolute value of the focus movement amount d should be made larger than when the F- number is relatively small.
- the focus movement amount d is set so as to satisfy Formula 2 described below, using the proportionality coefficient k.
- the basic principle of the DFD method is to estimate the depth information about the object (the depth
- the degree of change in blur between the images is dependent on the characteristics of the imaging optical system, that is, the depth of field of the imaging optical system. In other words, if the depth of field is shallow, sufficient change in blur is obtained even if the focus movement amount is small, but if the depth of field is deep, then sufficient change in blur is not obtained unless the focus movement amount is made large. Since the depth of field is directly proportional to then a desired change in blur is obtained by specifying the focus movement amount d, as shown in Formula 1 and Formula 2.
- This coefficient k and the depth measurement in Formula 2 will be described. This coefficient k can be used as a
- the range of the coefficient k indicated in Formula 2 is especially effective in cases where an indicator other than the broadening (magnitude) of blur (for example, an indicator such as the peak change of a PSF or the correlation of a PSF, etc.) is used as a depth measurement indicator. This is because, in the case of a method which evaluates broadening of the blur, when the focus movement amount d specified in Formula 2 is used, the blur is too small and hence there is a risk that this will lead to a decline in measurement accuracy.
- an indicator other than the broadening (magnitude) of blur for example, an indicator such as the peak change of a PSF or the correlation of a PSF, etc.
- the coefficient k should be set to a value in the range of -16 ⁇ k ⁇ -8, 8 ⁇ k ⁇ 16. Since the depth measurement range becomes smaller, the closer the absolute value of the coefficient k to the upper limit value of 16 indicated in Formula 2, then this range is suitable for judging whether or not an object under observation is situated within a particular depth range.
- the coefficient k should be set to a range of -8 ⁇ k ⁇ 0, 0 ⁇ k ⁇ 8. This is because, since the depth measurement range becomes greater, the smaller the absolute value of the coefficient k, then this range is suitable for separation in two or more layers. However, with the range -1 ⁇ k ⁇ 0, 0 ⁇ k ⁇ 1, although the depth measurement range is large, the depth resolution declines and therefore, it is more desirable to adopt a range of -8 ⁇ k ⁇ -1, 1 ⁇ k ⁇ 8.
- the coefficient k has a value in the range of -4 ⁇ k ⁇ -2, and 2 ⁇ k ⁇ 4. In this range, the balance between the size of the depth
- the measurement range and the depth resolution is especially good and it is possible to measure a broad depth range with high accuracy.
- Fig. 1 shows a schematic view of a principal
- composition of an image pickup apparatus relating to a first embodiment of the present invention.
- the image pickup apparatus 100 includes an imaging optical system 10, an image sensor 11, an image pickup unit 12, a focusing position setting unit 13 and a depth
- the imaging optical system 10 used in the present embodiment may be a fixed- focus optical system or a variable-focus optical system, and may be constituted by an imaging optical system of a normal image pickup apparatus which captures images.
- the image sensor 11 which is arranged on the image plane may be an image sensor having a color filter, a monochrome image sensor, or a three-plate type image sensor.
- the image pickup apparatus captures a first image, which is captured by focusing at a desired object depth indicated by the solid line in Fig. 1, and a second image in which the focusing position is shifted as indicated by the dotted line in Fig. 1.
- the focus movement amount in this case is the symbol d shown in Fig. 1, and is the difference in the optical axis direction between the focusing positions at the image plane.
- the image pickup unit 12 captures a first image by driving the imaging optical system 10 to focus on the object. Thereupon, the image pickup unit 12 drives the imaging optical system 10 so as to move the image plane through a focus movement amount d set by the focusing position setting unit 13, and captures a second image.
- the focusing position setting unit 13 sets the amount of movement d of the image plane from the first focusing position, in accordance with the F-number during imaging, by using Formula 2.
- the coefficient k in Formula 2 is a previously given value.
- the image pickup apparatus has a variable F-number, but in the case of an image pickup apparatus having a fixed F-number, a focus movement amount d set previously by Formula 2 is saved in a memory of the image pickup apparatus.
- the first image and the second image which are captured by the image pickup unit 12 are output to the depth information determination unit 14.
- Table 1 shows imaging conditions according to the present embodiment.
- the focus movement amount is set to a value that is suited to cases where depth is measured by using the defocusing characteristics of the peak value of a PSF (Point Spread Function) (the PSF-number at the central coordinates of the PSF) .
- PSF Point Spread Function
- the present embodiment is described here with reference to the PSF of an ideal imaging optical system which has no aberration, but it is also possible to adopt the same approach for an actual imaging optical system.
- the ideal shape of a PSF which does not have any aberration at the focusing position is a shape such as a Gaussian function in which the value at the central coordinates of the PSF is a peak and the value decreases smoothly from this peak.
- the cross- sectional shape of the PSF is depicted by a solid line.
- Fig. 2 show the cross-section of the PSF when the image is defocused by 20 ⁇ m, 40 ⁇ m, 60 ⁇ m, 80 ⁇ m, respectively.
- the value of the central coordinate of the PSF is defined as the "peak value of the PSF".
- Fig. 3 is a diagram showing change due to defocusing in the PSF peak value at the image plane under the imaging conditions according to the present embodiment shown in Table 1, in an ideal case where there is no aberration in the imaging optical system.
- the peak value of the PSF becomes a maximum at the focusing position, and declines as the image becomes defocused, progressively approaching zero while oscillating in the manner of a SINC function.
- the value in the peripheral regions is larger than in the center of the PSF coordinates, as indicated by the dotted lines which are defocused by 60 ⁇ m or 80 ⁇ m in Fig. 2.
- the peak value in the case of a large amount of defocusing of this kind is much smaller than the peak at the focusing position, and the uncertainty is increased due to detecting the effects of noise, and the like.
- the depth can be calculated, provided that the defocusing change of the PSF peak value can be determined from the captured image.
- the peak value of the PSF of the imaging optical system due to the effects of the object, it is difficult to determine, from only one image, the peak value of the PSF of the imaging optical system. Therefore, a plurality of images are used, each captured by varying the imaging conditions in order to eliminate the effects of the object. A ratio should be taken in order to cancel out the effects of the object. More specifically, it is possible to carry out depth measurement by matching the value of the PSF peak ratio obtained from two images which are actually captured to the defocusing characteristics of the PSF peak ratio of the imaging optical system, which is determined theoretically.
- Fig. 4 shows the defocusing characteristics of the PSF peak values of two images and the defocusing
- the lateral axis indicates the focusing position at the image plane.
- the curve indicated by the solid line in Fig. 4 shows the defocussing characteristics of the ratio between the peak values of two PSFs for different focusing positions.
- the two curves indicated by the dotted lines are the defocusing characteristics of the peak values of two PSFs for different focusing positions.
- the case shown here relates to the PSF in an ideal imaging optical system which is free of aberration and has a focusing position at infinity .
- the PSF peak ratio traces a symmetrical curve which has a maximum value of 1, has a peak in a central position between the two focusing positions, and
- the amount of defocus Zi from the focusing position at the image plane is determined from the value of the PSF peak ratio.
- the focal length f and the object distance (depth) s are used to determine
- OTFr Fourier transform of the PSF
- This OTFr value is a value which is independent of the scene, because the scene S is cancelled out, as shown in Formula 5.
- the average value of the OTFr should be determined as indicated in the expression below. If the peak of the PSF is situated in the center of the images II, I2, then the PSF peak ratio, PSFr, is given by:
- the value of the defocusing characteristics of the PSF peak ratio falls gradually from the central position between the two different focusing positions, reaches a local minimum value, and then rises again, subsequently repeating this pattern. This is because, as shown in Fig. 3, the
- the maximum peak in the defocusing characteristics curve of the PSF peak value and the PSF peak ratio is called the “maximum peak” or the “primary peak”
- the local minimum values which respectively appear first on the front side and the rear side of the maximum peak are called the “primary minimum values”.
- the PSF peak values from the primary minimum value onwards have a low value and are readily affected by noise, and the like, as can be seen by observing the defocusing characteristics of the PSF peak values in Fig. 3.
- the position of the primary minimum value of the PSF peak ratio which defines the depth measurement range is dependent on the position of the primary minimum value of the defocusing characteristics of the PSF peak value (the dotted line in Fig. 4) .
- the position of the primary minimum value of the PSF peak ratio on the front side corresponds to the position of the primary minimum value on the front side of the PSF peak value of the image which has a focusing position to the rear side, of the two images having different focusing positions.
- the position of the primary minimum value of the PSF peak ratio on the rear side corresponds to the position of the primary minimum value on the rear side of the PSF peak value of the image having a focusing position to the front side.
- the depth measurement range can be determined by the position of the primary minimum values of the defocusing characteristics of the PSF peak value. In other words, this indicates that the depth measurement range can be set in accordance with the focus movement amount .
- Figs. 5A to 5F show the defocusing characteristics of the PSF peak value and the change in the PSF peak ratio, when the focus movement amount is changed.
- the focus movement amount is expressed as a difference in the
- the focus movement amount gradually becomes larger, from Fig. 5A toward Fig. 5F.
- the value at the point of intersection of the defocussing characteristics of the two PSF peak values is set respectively to 99.8%, 90%, 70%, 50%, 20% and 5% of the maximum value of the PSF peak value. It can be seen that, as the focus movement amount increases, the characteristics of the PSF peak ratio (solid line) change. More
- the depth measurement range (the range between the primary minimum value position on the front side and the primary minimum value position on the rear side of the PSF peak ratio) becomes gradually narrower as the focus movement amount becomes larger.
- the value range of the PSF peak ratio (the difference between the maximum value and the primary minimum value of the PSF peak ratio) broadens sharply as the focus movement amount becomes larger and thereafter gradually approaches 1.
- the depth resolution becomes higher, the broader the value range of the PSF .peak ratio, and hence the tolerance with respect to variable factors, such as noise, becomes higher and the depth measurement accuracy is improved.
- Figs. 6A and 6B respectively show change in the depth measurement range in accordance with the focus movement amount, and change in the range of the value of the PSF peak ratio.
- the horizontal axis represents the focus movement amount and the vertical axis represents the depth measurement range on the side of the image plane.
- the horizontal axis represents the focus movement amount and the vertical axis represents the value range.
- the PSF peak ratio is normalized and therefore the maximum value of the value range is 1. There is a singular point when the focus movement amount is zero, since depth measurement is not possible in this case.
- the focusing position conditions are set in such a manner that both a wide depth measurement range and a high depth resolution (broad value range) can be achieved simultaneously. More specifically, the focus movement amount should be set in such a manner that the depth measurement range is no less than 80% of the maximum range and in such a manner that the value range is no less than approximately 90% of the maximum value range.
- the value range is set to no less than approximately 90% of the maximum value range in order to improve the SN ratio of the PSF peak ratio. Taking account of the fact that the signal containing several percent of noise, an error of approximately two times the noise is generated in respect of the PSF peak ratio. Therefore, even with objects which are situated at the same depth, due to the effects of noise, the value of the PSF peak ratio is different.
- the reliable number of depth divisions is a number obtained by dividing the value range of the PSF peak ratio by the width Consequently, the reliable depth
- resolution increases as the value range of the PSF peak ratio becomes greater, and therefore it is suitable to set the value range to be no less than approximately 90% of the maximum value range.
- the value range becomes larger, the larger the focus movement amount, as shown in Fig. 6B.
- the depth measurement range decreases as the focus movement amount becomes larger (Fig. 6A) .
- it is necessary to apply a limit to the focus movement amount and a range of no less than 80% of the maximum range is satisfactory and a range of approximately 90% thereof is more desirable.
- the absolute value of the focus movement amount should be set to no less than roughly 0.01 mm (see Fig. 6B) .
- the absolute value of the focus movement amount should be no more than roughly 0.036 mm (see Fig. 6A) .
- the focus movement amount should be set to a range of -0.036 mm to -0.01 mm or 0.01 mm to 0.036 mm.
- the focus movement amount is set to -0.020 mm
- the value range is set to no less than approximately 90% of the maximum value range
- the depth measurement range is set to 90% of the maximum range.
- Fig. 7 is a graph which plots the F-number on the horizontal axis and plots the focus movement amount on the vertical axis.
- the focusing position setting unit 13 calculates the focus movement amount d by Formula 2 using the changed F-number and a predetermined value of the coefficient k, and sets a first focusing position and a second focusing position on the basis of this focus movement amount d.
- the focusing position setting unit 13 may carry out the calculation in Formula 2, but it is also possible to previously store a correspondence table of the F-number and the focus movement amount such as that shown in Table 2, in the memory, and to read out a focus movement amount corresponding to the changed F-number, from the table.
- the focusing position setting unit 13 may calculate the focus movement amount d on the basis of Formula 2, and may prepare a table for each coefficient k.
- Formula 2 is a function including the
- the focus movement amount should be decided by the wavelength which is used for depth measurement (in other words, the wavelength of the light used for capturing the first and second images) . If a color filter is arranged on the image sensor, then the blur differs with the wavelength and therefore it is desirable to carry out depth measurement respectively for each color. In this case, the focus movement amount should be set by using the central
- the central wavelength of the G pixel filter is used to set the focus movement amount .
- the wavelength which is the design reference of the imaging optical system should be used. This is because, in general, the aberration is corrected satisfactorily at the design wavelength.
- the d line (587.56 nm) , which is used generally as the design reference of the imaging optical system, is employed.
- the defocussing characteristics of the PSF of the first image have the shape of a Gaussian function, as indicated by the dotted line which has a peak at the 0 position (the shape up to the primary minimum value) .
- the focusing position of the second image is moved toward the side of infinity.
- the focusing position is moved in the negative direction at the image plane (the other dotted line in Fig. 8A) .
- the depth measurement range is to be broadened toward the image pickup apparatus from the focusing position of the first image, then the focusing position of the second image is moved toward the side of the image pickup apparatus. As shown in Fig. 8B, the depth measurement range also becomes broader in the positive direction, by moving the focusing position of the second image in the positive direction at the image plane.
- the measurement range from the focusing position toward infinity on the object side is broadened.
- the description of the present embodiment has related to the focus movement amount when the depth is measured by using two images, namely, an image at a desired focusing position and an image in which the focusing position has been moved. In the case of these conditions, when
- the peak of the PSF peak ratio occurs at the central position between the focusing positions of the two images, rather than at the desired focusing position. This result is not suitable for cases where the PSF peak ratio is used directly as relative depth information, without being converted to a depth. If the PSF peak ratio is used directly as the relative depth information, it is desirable to capture one image each respectively at a position displaced to the front side and the rear side of the desired focusing position. The difference between the two focusing positions to the front and rear sides in this case is taken as the focus movement amount according to the present embodiment, and the peak of the PSF peak ratio obtained from the two images is moved so as to achieve the desired focusing position. By this means,- it is possible to use the calculated PSF peak ratio directly as relative depth information.
- the focus movement amount during imaging is determined in accordance with the F- number and a plurality of images can be captured.
- the image pickup apparatus relating to a second embodiment has a similar composition to the image pickup apparatus relating to the first embodiment. Although the composition is similar, the policy for setting the focus movement amount (and more specifically, the set value of the coefficient k) is different.
- the present embodiment describes conditions of the focusing position which are suited to judging whether or not an object is situated within a particular depth range (two-layer separation) .
- Table 3 shows imaging conditions according to the present embodiment.
- the F-number is made small and the focus movement amount (absolute value) is made large.
- the focus movement amount in order to narrow the depth measurement range, the focus movement amount should be made large. However, if the focus movement amount is made too large, then a problem arises in that the reliability of the PSF peak ratio declines. Therefore, the maximum value of the focus movement amount is restricted as follows.
- the PSF peak value is a maximum at the focusing position, and declines as defocusing occurs, assuming a primary minimum value when the amount of defocus from the focusing position is a prescribed amount ( ⁇ 75 ⁇ m in the example in Fig. 4) .
- Fig. 16 shows a case where the positions of the primary minimum values of two PSF peak values are overlapping.
- the PSF peak ratio can be calculated, this ratio is in a region where both PSF peak values have fallen and is liable to be affected by noise, etc., and therefore it is not possible to determine an effective PSF peak ratio.
- the focus movement amount is made larger than this, then similarly, it is not possible to calculate an effective PSF peak ratio.
- the focus movement amount in this case is calculated to be 150 ⁇ m, in the case of an ideal optical system having an F-number of 4.
- a focus movement amount suited to a narrow depth measurement range can be obtained by setting the coefficient k to ⁇ 16 or a value close to this, in Formula 2.
- the focus movement amount should be set using a coefficient k in the range of -16 ⁇ k ⁇ -8, 8 ⁇ k ⁇ 16.
- Fig. 9 shows the PSF peak ratio (solid line) under the imaging conditions of the present embodiment, and the defocusing characteristics of the PSF peak value (dotted line) at the two focusing positions.
- the depth measurement range is a narrow 12 ⁇ m and the value range of the PSF peak ratio is approximately 90% of the maximum, then it is possible to measure a narrow depth range with high accuracy.
- the ratio is in a region where the PSF peak values of the two focusing positions are low and therefore the value of the PSF peak ratio is liable to be affected by noise, etc., and varies greatly with slight change. Consequently, the reliability of the calculated PSF peak ratio is low, and even if the value range is broad, accurate depth resolution cannot be achieved.
- the PSF peak ratio is kept to an extremely low value. Consequently, it is possible to extract only the depth measurement range, by separating cases where the PSF peak value is equal to or greater than a certain threshold value from other cases. In other words, this is suitable for carrying out two-layer depth separation which extracts the depth measurement range only, or three-layer depth separation which distinguishes between the front and rear sides.
- the threshold value may be set to a value no less than the PSF peak ratio in the maximum depth measurement range, and desirably, is set to
- the depth measurement according to the present embodiment is depth measurement in an intermediate region between two focusing positions, and this depth measurement range does not overlap with the focusing position of the images which are captured. Therefore, if an image which is sharply focused in the extracted depth range is required, then an image of the desired focus may also be captured separately. Moreover, it is also possible to capture two images for depth measurement and an image of the desired focus, continuously, in line with the change in the focusing position.
- the image pickup apparatus it is possible to capture an image which is suited to separating a particular depth range from other ranges.
- the image pickup apparatus relating to a third embodiment has a similar composition to the image pickup apparatus relating to the first embodiment. Although the composition is the same, the policy for setting the focus movement amount is different.
- Table 4 shows imaging conditions according to the present embodiment.
- the characteristic features of the imaging conditions of the present embodiment are that, in order to carry out broader depth measurement, the F-number is made larger and the focus movement amount is made smaller.
- the focus movement amount should be made as small as possible. However, if the focus movement amount is small, as shown in Fig. 6B, then the value range is also small and the depth resolution
- the focus movement amount should be set to a position at which the value range becomes no less than approximately 70% of the maximum. More desirably, the value range should be no less than 90%.
- the focus movement amount in the present embodiment is set to a range where the value range becomes 90%.
- k 0.266, and this satisfies the range of the
- coefficient k which is specified by Formula 2. This is a focus movement amount that is suited to depth measurement in a broad range and in particular where the coefficient k is a value close to 0.
- the image pickup apparatus it is possible to capture an image which is suited to measuring the depth in a broad range.
- the image pickup apparatus relating to a fourth embodiment has a similar composition to the image pickup apparatus relating to the first embodiment. Although the composition is the same, the policy for setting the focus movement amount is different.
- imaging conditions for raising the depth resolution at a desired focusing position is described.
- the number of captured images is two, namely, a first image which is captured at a desired focusing position and a second image which is captured at a displaced focusing position .
- Fig. 10 is a diagram which plots the gradient of the PSF peak ratio at the desired focusing position when the wavelength is 587.56 nm and the F-number is 4.
- the horizontal axis in Fig. 10 is the focus movement amount.
- the gradient of the PSF peak ratio becomes a maximum when the focus movement amount is ⁇ 0.031 mm.
- the image pickup apparatus Accordingly, in the image pickup apparatus according to the present embodiment, it is possible to capture images for depth measurement in such a manner that the depth resolution at the desired focusing position becomes a maximum.
- the image pickup apparatus relating to a fifth embodiment has a similar composition to the image pickup apparatus relating to the first embodiment. Although the composition is the same, the policy for setting the focus movement amount is different. In the present embodiment, the focus movement amount is set in such a manner that the desired focusing position (the focusing position of the first image) is included in the depth measurement range.
- the depth measurement range becomes narrower, the greater the focus movement amount.
- the focusing position of the first image (the 0 ⁇ m position on the horizontal axis) is included in the depth measurement range, but as the focus movement amount becomes larger as in Figs. 5E and 5F, then the focusing position of the first image moves out of the depth measurement range.
- the focusing position of the first image is included in the depth measurement range in cases where the focus movement amount (absolute value) is smaller than the minimum defocus amount.
- coefficient k is chosen so that the focus movement amount d obtained by Formula 2 is smaller than the minimum defocus amount .
- the focus movement amount d should be set to a range of -0.075 mm to +0.075 mm (excluding 0 mm).
- the range of the coefficient k in this case is .
- the depth measurement range is only one side, either the front side or the rear side, of the focusing position of the first image. This direction matches the direction in which the focus is moved when capturing the second image.
- the image pickup apparatus relating to a sixth embodiment has a similar composition to the image pickup apparatus relating to the first embodiment. Although the composition is similar, the indicator used for depth measurement is different. Table 5 shows imaging conditions used in the present embodiment.
- the depth measurement using the PSF correlation amount uses, as an indicator, the extent of similarity between the shapes of the PSF of two images.
- the normalized cross- correlation NCC can be calculated by Formula 8 below, using the same partial regions of the two captured images for Cfl and Cf2:
- Fig. 11 shows the defocusing characteristics of the PSF correlation amount obtained by Formula 8, using the imaging conditions according to the present embodiment.
- the curve shown by the solid line in Fig. 11 is a curve which plots the defocusing characteristics of the
- the two curves indicated by the dotted lines are the normalized defocusing characteristics of the variance of two PSFs for different focusing positions.
- the value of the defocusing characteristics of the PSF correlation amount falls gradually from the central position between the two different focusing positions, reaches a minimum value, and then rises again, subsequently repeating this pattern.
- the maximum peak is called the "maximum peak” or the "primary peak”
- the local minimum values which respectively appear initially on the front side and the rear side of the maximum peak are called the "primary minimum values”.
- Figs. 12A to 12F show the defocusing characteristics of the PSF variance and the change in the PSF correlation amount (normalized cross-correlation value) , when the focus movement amount is changed.
- the focus movement amount is expressed as a difference in the horizontal axis direction between the defocussing characteristics of two PSF variance values (dotted line) .
- the focus movement amount gradually becomes larger, from Fig. 12A toward Fig. 12F.
- examples are shown in which the value at the point of intersection of the defocussing characteristics of the two PSF variance values (the point of intersection of the dotted lines) is set respectively to 95%, 90%, 70%, 50%, 30% and 10% of the maximum value of the PSF variance. It can be seen that, as the focus movement amount
- the characteristics of the PSF correlation amount (solid line) change. More specifically, it can be seen that the depth measurement range (the range between the primary minimum value position on the front side and the primary minimum value position on the rear side of the maximum peak of the PSF correlation amount) becomes
- the value range of the PSF correlation amount (the difference between the maximum value and the primary minimum value of the PSF correlation amount) broadens and then narrows, as the focus movement amount becomes larger.
- the depth resolution becomes higher, the broader the range of the value of the PSF correlation amount, and hence the tolerance with respect to variable factors, such as noise, becomes higher and the depth measurement accuracy is improved.
- Figs. 13A and 13B respectively show change in the depth measurement range in accordance with the focus movement amount, and change in the range of the value of the PSF correlation amount.
- the horizontal axis represents the focus movement amount and the vertical axis represents the depth measurement range on the side of the image plane. There is a singular point when the focus movement amount is zero, since depth measurement is not possible in this case.
- the PSF correlation amount is normalized and therefore the maximum value of the value range is 1.
- the value range is a maximum when the focus movement amount is in the vicinity of ⁇ 0.078 mm.
- Fig. 13C shows change in the gradient of the PSF correlation amount at the focusing position of the first image, with the focus movement amount.
- the value range is a maximum when the focus movement amount is in the vicinity of ⁇ 0.054 mm.
- the maximum value of the focus movement amount should be set up to a distance at which the value at the point of
- intersection between the two PSF variances falls to 1/e 2 from the maximum value of the PSF variance.
- the point of intersection between the two PSF variances is at the midpoint between the two focusing positions (in other words, at half of the focus movement amount) , and therefore the. conditions described above can also be expressed as making the focus movement amount (absolute value) smaller than two times the amount of defocus at which the PSF variance becomes 1/e 2 of the maximum value. This is based on the same approach as the definition of the beam waist diameter of a laser. To satisfy this condition, the value of the coefficient k in Formula 2 should be set to around 10 or lower.
- the imaging conditions are set in such a manner that the breadth of the depth
- an evaluation value is calculated by respectively normalizing the three factors: the depth measurement range, the value range and the gradient of the PSF correlation amount at the focusing position, and weighted-averaging the factors.
- the focus movement amount which achieves the largest evaluation value is set. In the present embodiment, evaluation is made by using the same weight for each factor.
- the optimal focus movement amount is +0.055 mm. The results of this are shown in Fig. 14.
- the focus movement amount d -0.055 mm
- a normalized cross- correlation is used as an example of depth measurement based on the PSF correlation amount, but it is also
- the focus movement amount should be set using at least one of the measurement range, the value range and the gradient of the correlation value at the focusing position.
- the depth measurement technology according to the present invention described above is desirably applied in an image pickup apparatus, such as a digital camera or a camcorder, or an image processing apparatus or a computer which carries out image processing of image data obtained by an image pickup apparatus.
- an image pickup apparatus such as a digital camera or a camcorder
- an image processing apparatus or a computer which carries out image processing of image data obtained by an image pickup apparatus.
- the technology of the present invention can also be applied to electronic equipment of various types which incorporates an image pickup apparatus or an image processing apparatus of this kind (equipment such as mobile telephones, smartphones, tablet terminals, and personal computers).
- the functions of the depth information determination unit may be composed in any way. For example, it is possible to incorporate a depth
- the depth information determination unit into a computer having an image pickup apparatus, in such a manner that a computer acquires images captured by the image pickup apparatus and carries out a depth calculation on the basis of the images. Furthermore, the depth information determination unit may be incorporated into a computer which has network access by a wired or wireless connection, a plurality of images may be acquired by the computer via the network, and a depth calculation may be carried out on the basis of these images.
- the depth information thus obtained can be used for various image processing, such as dividing up image regions, generating three-dimensional images and depth images, emulating blur effects, and so on.
- Actual installation in the apparatuses described above can a software (program) -based installation or a hardware-based installation.
- a software (program) -based installation or a hardware-based installation.
- processes for achieving the object of the present invention can also be implemented by storing- a program in the memory of a computer (such as a microcomputer, or FPGA) which is incorporated into an image pickup apparatus or an image processing apparatus.
- a computer such as a microcomputer, or FPGA
- a special processor such as an ASIC, is provided to achieve all or a portion of the processes according to the present invention by a logic circuit.
- aspects of the present invention can also be realized by a computer of a system or apparatus (or devices such as a CPU or MPU) that reads out and executes a program
- apparatus by, for example, reading out and executing a program recorded on a memory device to perform the
- the program is provided to the computer for example via a network or from a recording medium of various types serving as the memory device (e.g., non-transitory computer-readable medium) .
- a network or from a recording medium of various types serving as the memory device (e.g., non-transitory computer-readable medium) .
Landscapes
- Engineering & Computer Science (AREA)
- Computer Vision & Pattern Recognition (AREA)
- Physics & Mathematics (AREA)
- Multimedia (AREA)
- Signal Processing (AREA)
- General Physics & Mathematics (AREA)
- Optics & Photonics (AREA)
- Theoretical Computer Science (AREA)
- Studio Devices (AREA)
- Automatic Focus Adjustment (AREA)
- Measurement Of Optical Distance (AREA)
- Focusing (AREA)
- Length Measuring Devices By Optical Means (AREA)
Description
DESCRIPTION
Title of Invention
IMAGE PICKUP APPARATUS, DEPTH INFORMATION ACQUISITION METHOD AND PROGRAM
Technical Field
[0001]
The present invention relates to technology for measuring depth information of an object from a plurality of images captured by altering the focusing position.
Background Art
[0002]
Conventionally, the Depth from Defocus (DFD) method such as that described in Japanese Patent Application Publication No. H01-167610 (PTL1) has been proposed as a method for acquiring a depth of a captured scene from an image acquired by an image pickup apparatus. ' In the DFD method, a plurality of images having different amounts of blur are acquired by controlling the imaging parameters of an imaging optical system, and the respective magnitudes and correlation amounts of blur are calculated by using measurement object pixels and pixels peripheral to these in the plurality of acquired images.
Since the magnitude and correlative amount of the blur change in accordance with the depth to the object in
the image, the depth is calculated by using the relationship therebetween. With depth measurement by the DFD method, it is possible to calculate the depth by one imaging system, and therefore such a method is advantageous in that it can be incorporated into a commercially
available image pickup apparatus.
[0003]
In a conventional DFD method, the fact that the magnitude of blur due to the imaging optical system changes in accordance with the depth from the object is used to estimate the depth information of the object on the basis of the magnitude of blur in a plurality of images. Since the depth can be calculated theoretically provided that the imaging conditions of the respective images are known, then no particular mention of desirable imaging conditions is made in PTLl or Japanese Patent No. 4403477 (PTL2) .
However, as a result of ongoing research, the inventors discovered that the imaging conditions which are set for the plurality of images to be acquired have an effect on the depth estimate accuracy (measurement accuracy) , and the measurable range, and also that the desirable imaging conditions vary depending on the characteristics of the imaging optical system.
Citation List
Patent Literature
[0004]
[PTL1] Japanese Patent Application Publication No. H01-167610
[PTL2] Japanese Patent No. 4403477
Summary of Invention
[0005]
Therefore, it is an object of the present invention to provide technology for setting suitable imaging
conditions in accordance with the characteristics of an optical system and/or the purpose of depth measurement, in an image pickup apparatus which acquires depth information about an object from- a plurality of images which are captured by varying the focusing position.
The depth information about an object may be
information on a relative depth (distance) from a central position between focusing positions of two images to an object, information on a relative depth (distance) from a focusing position of either one image to an object, or information on an absolute depth (distance) from the image pickup apparatus during imaging to an object. Here, the relative depth (distance) and the absolute depth (distance) may be a distance on the side of an image plane or a distance on the side of an object.
[0006]
The present invention in. its first aspect provides an image pickup apparatus, comprising: an imaging unit which acquires a first image by capturing an object at a first
focusing position, and which acquires a second image after acquiring the first image, by capturing the object at a second focusing position which is different from the first focusing position, the second image having different blur from the first image; a depth information determination unit determining depth information of the object on the basis of a difference in blur between the first image and the second image; and a focusing position setting unit setting a focus movement amount which is a difference between the first focusing position and the second focusing position, in accordance with an F-number of the imaging unit, wherein the focusing position setting unit sets the second focusing position in such a manner that an absolute value of the focus movement amount is larger when the F- number is large, compared to when the F-number is
relatively small.
[0007]
The present invention in its second aspect provides an image pickup apparatus, comprising: an imaging unit which acquires a first image by capturing an object at a first focusing position, and which acquires a second image after acquiring the first image, by capturing the object at a second focusing position which is different from the first focusing position, the second image having different blur from the first image; a depth information
determination unit determining depth information of the object on the basis of a difference in blur between the
first image and the second image; and a focusing position setting unit setting the second focusing position in such manner that a focus movement amount, which is a difference between the first focusing position and the second focusin position, satisfies the formula given below:

where d: focus movement amount at image plane; k: coefficient; F: F-number;
 wavelength of light used to capture first and second images.
[0008]
The present invention in its third aspect provides a depth information acquisition method, comprising: a first imaging step of acquiring a first image by capturing an object at a first focusing position; a second imaging step of acquiring a second image having different blur from the first image, by capturing the object at a second focusing position which is different from the first focusing position, after the first imaging step; and a depth information determining step of determining depth
information of the object on the basis of a difference in blur between the first image and the second image, wherein the second imaging step includes a focusing position setting step of setting a focus movement amount which is a difference between the first focusing position and the second focusing position in accordance with an F-number during imaging, and in the focusing position setting step, the second focusing position is set in such a manner that
an absolute value of the focus movement amount is larger when the F-number is large, compared to when the F-number is relatively small.
[0009]
The present invention in its fourth aspect provides a depth information acquisition method, comprising: a first imaging step of acquiring a first image by capturing an object at a first focusing position; a second imaging step of acquiring a second image having different blur from the first image, by capturing the object at a second focusing position which is different from the first focusing position, after the first imaging step; and a depth
information determining step of determining depth
information of the object on the basis of a difference in blur between the first image and the second image, wherein the second focusing position is set in such a manner that a focus movement amount, which is a difference between the first focusing position and the second focusing position, satisfies the formula given below:

where d: focus movement amount at image plane; k: coefficient; F: F-number; wavelength of light used to

capture first and second images.
[0010]
The present invention in its fifth aspect provides a program which causes a computer to execute the respective steps of the depth information acquisition method according
to the present invention.
[0011]
According to' the present invention, it is possible to set suitable imaging conditions in accordance with the characteristics of an optical system and/or the purpose of depth measurement, in an image pickup apparatus which acquires depth information about an object from a plurality of images which are captured by varying the focusing position .
Further features of the present invention will become apparent from the following description of exemplary embodiments with reference to the attached drawings.
Brief Description of Drawings
[0012]
Fig. 1 is a diagram showing a composition of an imaging pickup apparatus relating to a first embodiment of the present invention;
Fig. 2 is a diagram plotting a cross-section of a
PSF;
Fig. 3 is a diagram showing defocusing
characteristics of a PSF peak value;
Fig. 4 is a diagram showing the characteristics of a PSF peak ratio relating to the first embodiment of the invention;
Figs. 5A to 5F are diagrams showing change in the PSF peak ratio with change in the focus movement amount;
Figs. 6A and 6B are diagrams showing the dependence on the focus movement amount, of the depth measurement range and the value range of the PSF peak ratio;
Fig. 7 is a diagram showing the relationship between the focus movement amount and the F-number;
Figs. 8A and 8B are diagrams showing the dependence on the focus movement amount of the depth measurement range;
Fig. 9 is a diagram showing the characteristics of a PSF peak ratio relating to a second embodiment of the invention;
Fig. 10 is a diagram showing the dependence on the focus movement amount of a PSF peak ratio gradient;
Fig. 11 is a diagram showing defocusing
characteristics of a PSF correlation amount;
Figs. 12A to 12F are diagrams showing the
characteristics of a PSF correlation amount relating to a sixth embodiment;
Figs. 13A to 13C are diagrams showing the dependence on the focus movement amount, of the depth measurement range and the PSF correlation amount;
Fig. 14 is a diagram showing change in an evaluation value with the focus movement amount;
Fig. 15 is a diagram showing a relationship between object depth and image plane depth; and
Fig. 16 is a diagram showing the characteristics of a PSF peak ratio when the focus movement amount is a maximum.
Description of Embodiments
[0013]
The present invention relates to technology for acquiring depth information about an object on the basis of difference in the respective blur of two or more images which are captured by varying the focusing position, and thus proposes improvements in a so-called Depth from
Defocus (DFD) method. The present inventors discovered that, when estimating the depth in respective pixels from a plurality of images having different focusing positions, the settings of the focusing positions in each image can affect the depth estimate accuracy and the size of the measurable depth range. Furthermore, the inventors also discovered that the desirable conditions in relation to the focusing position vary with the characteristics of the optical system of the image pickup apparatus. Therefore, the present description proposes designing the focusing position conditions of the image used for depth estimation, in accordance with the characteristics of the optical system of the image pickup apparatus. Furthermore, the present description proposes automatically changing the focusing position conditions accordingly, in the case of an image pickup apparatus having variable characteristics of the optical system (although the user may expressly change the characteristics, or the image pickup apparatus may change the characteristics automatically in accordance with
the imaging mode or the environment) .
[0014]
The basic approach for setting the focusing position conditions in the present invention will be described below, whereupon specific conditions corresponding to the purpose of depth measurement will be described by way of example, with reference to respective embodiments.
[0015]
<Setting focusing position conditions>
Fig. 1 shows a schematic view of a composition of an imaging optical system and focusing positions when an image for depth estimation is captured. When estimating the depth, firstly, the optical system is aligned with a first focusing position (for example, the light path indicated by the solid line) , and an image of the object is captured. Thereupon, the optical system is changed to a second focusing position (for example, the light path indicated by the broken line), and an image of the same object is captured. Consequently, two images having different blur are obtained.
[0016]
In this case, in the present invention, the
difference between the first focusing position and the second focusing position (called the "focus movement amount") is determined . as indicated below from the F-number (F) of the optical system and the wavelength
 of the light used to capture the images. The focus movement
amount in the formula given below is an amount of movement on the image plane side, and in Fig. 1, is the distance indicated by the symbol d. Furthermore, the first focusing position (image plane position) is taken to be 0.
of the light used to capture the images. The focus movement
amount in the formula given below is an amount of movement on the image plane side, and in Fig. 1, is the distance indicated by the symbol d. Furthermore, the first focusing position (image plane position) is taken to be 0.
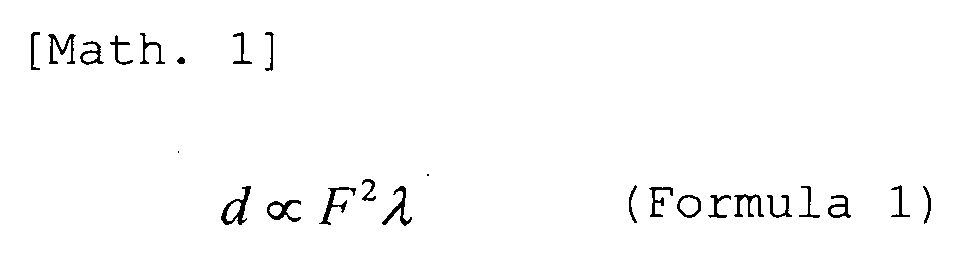
Formula 1 indicates that, when the F-number of the optical system is large, the absolute value of the focus movement amount d should be made larger than when the F- number is relatively small.
[0017]
Moreover, desirably, the focus movement amount d is set so as to satisfy Formula 2 described below, using the proportionality coefficient k.

[0018]
<Meaning of condition formula>
The basic principle of the DFD method is to estimate the depth information about the object (the depth
information in each pixel) by extracting the change in blur from a plurality of images having different imaging
conditions. In the below descriptions, the depth
information about the object means the relative depth
(distance) from the focusing position on the side of the
image plane. The degree of change in blur between the images is dependent on the characteristics of the imaging optical system, that is, the depth of field of the imaging optical system. In other words, if the depth of field is shallow, sufficient change in blur is obtained even if the focus movement amount is small, but if the depth of field is deep, then sufficient change in blur is not obtained unless the focus movement amount is made large. Since the depth of field is directly proportional to
 then a desired change in blur is obtained by specifying the focus movement amount d, as shown in Formula 1 and Formula 2.
[0019]
Next, a relationship between the value of the
coefficient k and the depth measurement in Formula 2 will be described. This coefficient k can be used as a
parameter for adjusting the depth measurement accuracy
(resolution) and the measurable depth range (also simply called "depth measurement range") . The present inventors discovered by simulation and experimentation that a
desirable range- of the coefficient k is as indicated below.
[0020]
As shown in Formula 2, the coefficient k should be a value in the range
 . This is because, if k is smaller than -16 or is greater than +16, then the blur of the object becomes greater and the measurement accuracy declines. A case of k = 0 is excluded because a difference in blur is not obtained between images having
the same focusing position. The range of the coefficient k indicated in Formula 2 is especially effective in cases where an indicator other than the broadening (magnitude) of blur (for example, an indicator such as the peak change of a PSF or the correlation of a PSF, etc.) is used as a depth measurement indicator. This is because, in the case of a method which evaluates broadening of the blur, when the focus movement amount d specified in Formula 2 is used, the blur is too small and hence there is a risk that this will lead to a decline in measurement accuracy.
. This is because, if k is smaller than -16 or is greater than +16, then the blur of the object becomes greater and the measurement accuracy declines. A case of k = 0 is excluded because a difference in blur is not obtained between images having
the same focusing position. The range of the coefficient k indicated in Formula 2 is especially effective in cases where an indicator other than the broadening (magnitude) of blur (for example, an indicator such as the peak change of a PSF or the correlation of a PSF, etc.) is used as a depth measurement indicator. This is because, in the case of a method which evaluates broadening of the blur, when the focus movement amount d specified in Formula 2 is used, the blur is too small and hence there is a risk that this will lead to a decline in measurement accuracy.
[0021]
If the purpose of the depth measurement is a two- layer depth separation, in other words, to judge whether or not an object is included in a particular depth range, then the coefficient k should be set to a value in the range of -16 ≤ k < -8, 8 < k ≤ 16. Since the depth measurement range becomes smaller, the closer the absolute value of the coefficient k to the upper limit value of 16 indicated in Formula 2, then this range is suitable for judging whether or not an object under observation is situated within a particular depth range.
[0022]
On the other hand, if the purpose of the depth measurement is to judge the depth separation of multiple layers, in other words, to judge in which of three or more depth ranges an object is included, then the coefficient k should be set to a range of -8 ≤ k < 0, 0 < k ≤ 8. This is
because, since the depth measurement range becomes greater, the smaller the absolute value of the coefficient k, then this range is suitable for separation in two or more layers. However, with the range -1 ≤ k < 0, 0 < k ≤ 1, although the depth measurement range is large, the depth resolution declines and therefore, it is more desirable to adopt a range of -8 ≤ k < -1, 1 < k ≤ 8.
[0023]
Moreover, it is suitable if the coefficient k has a value in the range of -4 < k ≤ -2, and 2 ≤ k < 4. In this range, the balance between the size of the depth
measurement range and the depth resolution is especially good and it is possible to measure a broad depth range with high accuracy.
[0024]
<First embodiment>
Fig. 1 shows a schematic view of a principal
composition of an image pickup apparatus relating to a first embodiment of the present invention.
The image pickup apparatus 100 includes an imaging optical system 10, an image sensor 11, an image pickup unit 12, a focusing position setting unit 13 and a depth
information determination unit 14. The imaging optical system 10 used in the present embodiment may be a fixed- focus optical system or a variable-focus optical system, and may be constituted by an imaging optical system of a normal image pickup apparatus which captures images. The
image sensor 11 which is arranged on the image plane may be an image sensor having a color filter, a monochrome image sensor, or a three-plate type image sensor.
[0025]
The image pickup apparatus according to the present embodiment captures a first image, which is captured by focusing at a desired object depth indicated by the solid line in Fig. 1, and a second image in which the focusing position is shifted as indicated by the dotted line in Fig. 1. The focus movement amount in this case is the symbol d shown in Fig. 1, and is the difference in the optical axis direction between the focusing positions at the image plane.
[0026]
The operation of the image pickup apparatus 100 is now described. When imaging starts, the image pickup unit 12 captures a first image by driving the imaging optical system 10 to focus on the object. Thereupon, the image pickup unit 12 drives the imaging optical system 10 so as to move the image plane through a focus movement amount d set by the focusing position setting unit 13, and captures a second image.
[0027]
The focusing position setting unit 13 sets the amount of movement d of the image plane from the first focusing position, in accordance with the F-number during imaging, by using Formula 2. The coefficient k in Formula 2 is a
previously given value. Here, it is assumed that the image pickup apparatus has a variable F-number, but in the case of an image pickup apparatus having a fixed F-number, a focus movement amount d set previously by Formula 2 is saved in a memory of the image pickup apparatus.
[0028]
The first image and the second image which are captured by the image pickup unit 12 are output to the depth information determination unit 14. The depth
information determination unit 14 calculates depth
information about the object, on the basis of difference between the blur of the two input images.
[0029]
Table 1 shows imaging conditions according to the present embodiment.

[0030]
In the case of the imaging conditions in Table 1, the range of the maximum focus movement amount d obtained from Formula 2 is:
-0.150 mm < d < 0.150 mm, d ≠ 0.
Consequently, the focus movement amount shown in Table 1 satisfies Formula 2. In the imaging conditions in Table 1, the coefficient k is set to 2.13.
[0031]
Next, the criteria for setting the focus movement amount under the imaging conditions according to the present embodiment will be described.
The focus movement amount is set to a value that is suited to cases where depth is measured by using the defocusing characteristics of the peak value of a PSF (Point Spread Function) (the PSF-number at the central coordinates of the PSF) . The present embodiment is described here with reference to the PSF of an ideal imaging optical system which has no aberration, but it is also possible to adopt the same approach for an actual imaging optical system. The ideal shape of a PSF which does not have any aberration at the focusing position is a shape such as a Gaussian function in which the value at the central coordinates of the PSF is a peak and the value decreases smoothly from this peak. In Fig. 2, the cross- sectional shape of the PSF is depicted by a solid line. However, as defocusing occurs, the value at the central coordinate of the PSF decreases, and the shape deforms. The dotted lines in Fig. 2 show the cross-section of the PSF when the image is defocused by 20 μm, 40 μm, 60 μm, 80 μm, respectively.
[0032]
By detecting the relative change between two images in the value of the central coordinate of the PSF, it is possible to calculate the amount of defocus and hence the depth, can be measured. In the present description, the value of the central coordinate of the PSF is defined as the "peak value of the PSF".
[0033]
Next, the relationship between the defocusing
characteristics of the PSF peak value and the depth
measurement will be described. The defocusing
characteristics of the PSF peak value described above are described here with reference to Fig. 3. Fig. 3 is a diagram showing change due to defocusing in the PSF peak value at the image plane under the imaging conditions according to the present embodiment shown in Table 1, in an ideal case where there is no aberration in the imaging optical system.
[0034]
As shown in Fig. 3, the peak value of the PSF becomes a maximum at the focusing position, and declines as the image becomes defocused, progressively approaching zero while oscillating in the manner of a SINC function. In this case, as the image becomes defocused until reaching the vicinity of local minimum values which appear initially both before and after the focusing position, there are cases where the value in the peripheral regions is larger than in the center of the PSF coordinates, as indicated by
the dotted lines which are defocused by 60 μm or 80 μm in Fig. 2. The peak value in the case of a large amount of defocusing of this kind is much smaller than the peak at the focusing position, and the uncertainty is increased due to detecting the effects of noise, and the like.
[0035]
<PSF peak ratio
Next, a method for calculating a depth from the peak value of the PSF will be described.
The depth can be calculated, provided that the defocusing change of the PSF peak value can be determined from the captured image. However, due to the effects of the object, it is difficult to determine, from only one image, the peak value of the PSF of the imaging optical system. Therefore, a plurality of images are used, each captured by varying the imaging conditions in order to eliminate the effects of the object. A ratio should be taken in order to cancel out the effects of the object. More specifically, it is possible to carry out depth measurement by matching the value of the PSF peak ratio obtained from two images which are actually captured to the defocusing characteristics of the PSF peak ratio of the imaging optical system, which is determined theoretically.
[0036]
Fig. 4 shows the defocusing characteristics of the PSF peak values of two images and the defocusing
characteristics of the PSF peak ratio, as determined
theoretically from the imaging conditions shown in Table 1. The lateral axis indicates the focusing position at the image plane. The curve indicated by the solid line in Fig. 4 shows the defocussing characteristics of the ratio between the peak values of two PSFs for different focusing positions. The two curves indicated by the dotted lines are the defocusing characteristics of the peak values of two PSFs for different focusing positions. The case shown here relates to the PSF in an ideal imaging optical system which is free of aberration and has a focusing position at infinity .
[0037]
When finding the peak ratio, the values are
normalized using the largest peak value as a denominator. Consequently, the PSF peak ratio traces a symmetrical curve which has a maximum value of 1, has a peak in a central position between the two focusing positions, and
progressively declines away from the peak.
[0038]
From the foregoing, it is possible to determine the relative depth from the central position between the focusing positions of two images, by calculating the PSF peak ratio. In this case, it is possible to distinguish between the values before and after the peak, depending on which of the PSF peak values is used for normalizing the values.
[0039]
Furthermore, in order to determine the depth Zo on the object side from the PSF peak ratio, the amount of defocus Zi from the focusing position at the image plane is determined from the value of the PSF peak ratio. Next, the focal length f and the object distance (depth) s are used to determine

the depth s' on the image plane side, and the amount of defocus Zi is used as follows

to convert to the distance (depth) on the object side. The corresponding results are shown in Fig. 15.
[0040]
<Method for calculating PSF peak ratio from images> The method for calculating the PSF peak ratio from two images which have actually been captured will now be described. The corresponding local regions I1 and 12 in the two images are represented by the convolution of the scene s and the PSF1 and the convolution of the scene s and the PSF2, respectively. If these regions after a Fourier transform are called FI1 and FI2, and the Fourier transform of the scene s is called S, then the ratio therebetween is
given by:

Here, the optical transfer function obtained by a
Fourier transform of the PSF is called the OTF, and the ratio between the two OTFs is called OTFr. This OTFr value is a value which is independent of the scene, because the scene S is cancelled out, as shown in Formula 5.
[0041]
If the peak ratio PSFr of the PSF is determined from the OFTr, then the average value of the OTFr should be determined as indicated in the expression below. If the peak of the PSF is situated in the center of the images II, I2, then the PSF peak ratio, PSFr, is given by:

If this is expressed discretely, then the following expression :

is obtained.
[0042]
It is possible to obtain the amount of defocus of the
object in the images II and 12, in other words, the depth information, by matching the PSF peak ratio, PSFr, which is calculated from the images by Formula 7, to the defocusing characteristics of the PSF peak ratio such as that shown in Fig. 4.
[0043]
<Depth measurement range>
Next, the depth measurement range in the depth measurement using the PSF peak ratio will be described with reference to Fig. 4.
As indicated by the solid line in Fig. 4, the value of the defocusing characteristics of the PSF peak ratio falls gradually from the central position between the two different focusing positions, reaches a local minimum value, and then rises again, subsequently repeating this pattern. This is because, as shown in Fig. 3, the
defocusing characteristics of the PSF peak value oscillate. Below, the maximum peak in the defocusing characteristics curve of the PSF peak value and the PSF peak ratio is called the "maximum peak" or the "primary peak", and the local minimum values which respectively appear first on the front side and the rear side of the maximum peak are called the "primary minimum values".
[0044]
The PSF peak values from the primary minimum value onwards have a low value and are readily affected by noise, and the like, as can be seen by observing the defocusing
characteristics of the PSF peak values in Fig. 3.
Therefore, when the ratio is found, the variation increases and the reliability is low. Therefore, the depth
measurement range which is reliable should be set from the position of the primary minimum value on the front side of the maximum peak to the position of the primary minimum value on the rear side, in the defocusing characteristics of the PSF peak ratio (the solid line in Fig. 4). In the example in Fig. 4, this range is from -75 μm to 55 μm. The negative side in Fig. 3 is the front side.
[0045]
Here, the position of the primary minimum value of the PSF peak ratio which defines the depth measurement range is dependent on the position of the primary minimum value of the defocusing characteristics of the PSF peak value (the dotted line in Fig. 4) . As shown in Fig. 4, the position of the primary minimum value of the PSF peak ratio on the front side corresponds to the position of the primary minimum value on the front side of the PSF peak value of the image which has a focusing position to the rear side, of the two images having different focusing positions. On the other hand, the position of the primary minimum value of the PSF peak ratio on the rear side corresponds to the position of the primary minimum value on the rear side of the PSF peak value of the image having a focusing position to the front side.
[0046]
Therefore, in depth measurement which uses the PSF peak ratio as an indicator, the depth measurement range can be determined by the position of the primary minimum values of the defocusing characteristics of the PSF peak value. In other words, this indicates that the depth measurement range can be set in accordance with the focus movement amount .
[0047]
<Focus movement amount and PSF peak ratio
characteristics>
Next, the relationship between the focus movement amount and the change in the depth measurement range, and the relationship between the focus movement amount and the change in the value range of the PSF peak ratio will be described, and the setting of a more suitable focus
movement amount will be explained.
[0048]
Figs. 5A to 5F show the defocusing characteristics of the PSF peak value and the change in the PSF peak ratio, when the focus movement amount is changed. The focus movement amount is expressed as a difference in the
horizontal axis direction between the defocussing
characteristics of two PSF peak values (dotted line) . In other words, the focus movement amount gradually becomes larger, from Fig. 5A toward Fig. 5F. Here, examples are shown in which the value at the point of intersection of the defocussing characteristics of the two PSF peak values
(the point of intersection of the dotted lines) is set respectively to 99.8%, 90%, 70%, 50%, 20% and 5% of the maximum value of the PSF peak value. It can be seen that, as the focus movement amount increases, the characteristics of the PSF peak ratio (solid line) change. More
specifically, it can be seen that the depth measurement range (the range between the primary minimum value position on the front side and the primary minimum value position on the rear side of the PSF peak ratio) becomes gradually narrower as the focus movement amount becomes larger.
[0049]
Similarly, it can be seen that the value range of the PSF peak ratio (the difference between the maximum value and the primary minimum value of the PSF peak ratio) broadens sharply as the focus movement amount becomes larger and thereafter gradually approaches 1. The depth resolution becomes higher, the broader the value range of the PSF .peak ratio, and hence the tolerance with respect to variable factors, such as noise, becomes higher and the depth measurement accuracy is improved.
[0050]
Figs. 6A and 6B respectively show change in the depth measurement range in accordance with the focus movement amount, and change in the range of the value of the PSF peak ratio. In Fig. 6A, the horizontal axis represents the focus movement amount and the vertical axis represents the depth measurement range on the side of the image plane.
Similarly, in Fig. 6B, the horizontal axis represents the focus movement amount and the vertical axis represents the value range. Here, the PSF peak ratio is normalized and therefore the maximum value of the value range is 1. There is a singular point when the focus movement amount is zero, since depth measurement is not possible in this case.
[0051]
<Policy with regard to optimal focus movement amount> In the present embodiment, the focusing position conditions are set in such a manner that both a wide depth measurement range and a high depth resolution (broad value range) can be achieved simultaneously. More specifically, the focus movement amount should be set in such a manner that the depth measurement range is no less than 80% of the maximum range and in such a manner that the value range is no less than approximately 90% of the maximum value range.
[0052]
The value range is set to no less than approximately 90% of the maximum value range in order to improve the SN ratio of the PSF peak ratio. Taking account of the fact that the signal containing several percent of noise, an error of approximately two times the noise is generated in respect of the PSF peak ratio. Therefore, even with objects which are situated at the same depth, due to the effects of noise, the value of the PSF peak ratio is different. Here, if the value of the PSF peak ratio of objects situated at the same depth is brought within a
width σ, then the reliable number of depth divisions is a number obtained by dividing the value range of the PSF peak ratio by the width Consequently, the reliable depth

resolution increases as the value range of the PSF peak ratio becomes greater, and therefore it is suitable to set the value range to be no less than approximately 90% of the maximum value range.
[0053]
In the PSF peak ratio, the value range becomes larger, the larger the focus movement amount, as shown in Fig. 6B. However, the depth measurement range decreases as the focus movement amount becomes larger (Fig. 6A) . In order to maintain a broad depth measurement range, it is necessary to apply a limit to the focus movement amount, and a range of no less than 80% of the maximum range is satisfactory and a range of approximately 90% thereof is more desirable.
[0054]
In order to set the value range to no less than 90% under the imaging conditions of the present embodiment, the absolute value of the focus movement amount should be set to no less than roughly 0.01 mm (see Fig. 6B) .
Furthermore, in order to achieve a depth measurement range of no less than 114 μm, which is 80% of a maximum depth measurement range of 142 μm, the absolute value of the focus movement amount should be no more than roughly 0.036 mm (see Fig. 6A) . In other words, in order to satisfy the
conditions described above, the focus movement amount should be set to a range of -0.036 mm to -0.01 mm or 0.01 mm to 0.036 mm.
[0055]
In the present embodiment, the focus movement amount is set to -0.020 mm, the value range is set to no less than approximately 90% of the maximum value range, and the depth measurement range is set to 90% of the maximum range. The imaging conditions of the present embodiment which satisfy these conditions have an advantageous effect in that, since the focus movement amount is small, the imaging interval can be shortened. Furthermore, since the focus movement amount is small, the maximum value of the PSF peak ratio is close to the focusing position of the first image and hence there is an advantageous effect in that depth measurement before and after the focusing position becomes possible.
[0056]
<F-number dependence>
In the imaging conditions according to the present embodiment, the focus movement amount is d = -0.020 mm, the F-number is F = 4, the wavelength is = 587.56 nm, and the

coefficient is k = 2.13. This value of the coefficient k satisfies 2 ≤ k < 4, which is a condition that achieves a good balance between the breadth of the depth measurement range and the depth resolution which was described above.
[0057]
In the image pickup apparatus according to the
present embodiment, the values shown in Table 2 are
obtained when Formula 2 is used to determine the optimal focus movement amount d when the F-number is changed during imaging.. Fig. 7 is a graph which plots the F-number on the horizontal axis and plots the focus movement amount on the vertical axis.

[0058]
If the F-number is changed automatically or by a user operation during imaging, then the focusing position setting unit 13 calculates the focus movement amount d by Formula 2 using the changed F-number and a predetermined value of the coefficient k, and sets a first focusing position and a second focusing position on the basis of this focus movement amount d. In this case, the focusing position setting unit 13 may carry out the calculation in Formula 2, but it is also possible to previously store a correspondence table of the F-number and the focus movement amount such as that shown in Table 2, in the memory, and to read out a focus movement amount corresponding to the changed F-number, from the table. Furthermore, it is also
possible to enable the value of the coefficient k to be changed by an operation by the user. In this case, the focusing position setting unit 13 may calculate the focus movement amount d on the basis of Formula 2, and may prepare a table for each coefficient k.
[0059]
In the case of an image pickup apparatus having a fixed F-number, the focus should be moved in accordance with a value which has been set previously so as to satisfy Formula 2. Furthermore, in the case of an image pickup apparatus having a fixed F-number, it is possible to enable the value of the coefficient k to be changed by an
operation by the user.
[0060]
<Wavelength determination>
Here, Formula 2 is a function including the
wavelength, and therefore it is desirable for the focus movement amount to be decided by the wavelength which is used for depth measurement (in other words, the wavelength of the light used for capturing the first and second images) . If a color filter is arranged on the image sensor, then the blur differs with the wavelength and therefore it is desirable to carry out depth measurement respectively for each color. In this case, the focus movement amount should be set by using the central
wavelength of the color filter. Also, it is necessary to capture images by moving the focus in accordance with the
number of colors of the color filter. In order to simplify this, in the case of an RGB pixel arrangement, for example, a large number of green (G) pixels are arranged and
therefore it is desirable to carry out depth measurement using the G pixels. In this case, the central wavelength of the G pixel filter is used to set the focus movement amount .
[0061]
Furthermore, in the case of an image sensor having no color filter, light of wavelengths in the whole visible light range is input, and therefore the wavelength which is the design reference of the imaging optical system should be used. This is because, in general, the aberration is corrected satisfactorily at the design wavelength. In the present embodiment, the d line (587.56 nm) , which is used generally as the design reference of the imaging optical system, is employed.
[0062]
<Focus movement direction>
The focus movement amount has been described as above, and now the focus movement direction will be
described with reference to Figs. 8A and 8B.
If the 0 position in Fig. 8A is taken to be the focusing position at the image plane of the first image, the defocussing characteristics of the PSF of the first image have the shape of a Gaussian function, as indicated by the dotted line which has a peak at the 0 position (the
shape up to the primary minimum value) .
[0063]
Here, if the depth measurement range is to be
broadened toward infinity from the focusing position of the first image, then the focusing position of the second image is moved toward the side of infinity. In this case, the focusing position is moved in the negative direction at the image plane (the other dotted line in Fig. 8A) .
Consequently, the peak of the PSF peak ratio is moved in the negative direction as indicated by the solid line in Fig. 8A. Here, it can be seen that the depth measurement range becomes broader in the negative direction.
On the other hand, if the depth measurement range is to be broadened toward the image pickup apparatus from the focusing position of the first image, then the focusing position of the second image is moved toward the side of the image pickup apparatus. As shown in Fig. 8B, the depth measurement range also becomes broader in the positive direction, by moving the focusing position of the second image in the positive direction at the image plane.
In the present embodiment, by moving the focusing position of the second image in the negative direction from the focusing position of the first image, the measurement range from the focusing position toward infinity on the object side is broadened.
[0064]
<Three-images capturing>
The description of the present embodiment has related to the focus movement amount when the depth is measured by using two images, namely, an image at a desired focusing position and an image in which the focusing position has been moved. In the case of these conditions, when
determining the PSF peak ratio, the peak of the PSF peak ratio occurs at the central position between the focusing positions of the two images, rather than at the desired focusing position. This result is not suitable for cases where the PSF peak ratio is used directly as relative depth information, without being converted to a depth. If the PSF peak ratio is used directly as the relative depth information, it is desirable to capture one image each respectively at a position displaced to the front side and the rear side of the desired focusing position. The difference between the two focusing positions to the front and rear sides in this case is taken as the focus movement amount according to the present embodiment, and the peak of the PSF peak ratio obtained from the two images is moved so as to achieve the desired focusing position. By this means,- it is possible to use the calculated PSF peak ratio directly as relative depth information.
[0065]
From the foregoing, by capturing a total of three images at the desired focusing position, and at focusing positions to the front and rear sides thereof, it is possible directly to determine relative depth change at the
desired focusing position.
[0066]
It is also possible to capture an image of a desired- focus after capturing images for depth measurement, but since the previously measured depth range is already known and the desired focusing position is located in between the images used for depth measurement, then it is desirable to capture the image of the desired focus continuously while capturing images for depth measurement.
Furthermore, by capturing three or more images at a focus movement amount between the adjacent two images which is specified according to the present embodiment, and repeating depth measurement for each set of two images, it is also possible to carry out depth measurement through a broader range.
[0067]
In the case of the image pickup apparatus according to the present embodiment, in acquiring depth information based on the DFD method which uses the defocusing
characteristics of the PSF peak, the focus movement amount during imaging is determined in accordance with the F- number and a plurality of images can be captured.
Consequently, it is always possible to capture a plurality of images having different focusing positions that are optimal for depth measurement.
[0068]
<Second embodiment>
The image pickup apparatus relating to a second embodiment has a similar composition to the image pickup apparatus relating to the first embodiment. Although the composition is similar, the policy for setting the focus movement amount (and more specifically, the set value of the coefficient k) is different.
[0069]
The present embodiment describes conditions of the focusing position which are suited to judging whether or not an object is situated within a particular depth range (two-layer separation) . When performing two-layer
separation, it is beneficial if the depth measurement range is narrow. Table 3 shows imaging conditions according to the present embodiment.

In the imaging conditions according to the present embodiment, in order to narrow the depth measurement range, the F-number is made small and the focus movement amount (absolute value) is made large.
[0070]
As shown in Fig. 6A, in order to narrow the depth
measurement range, the focus movement amount should be made large. However, if the focus movement amount is made too large, then a problem arises in that the reliability of the PSF peak ratio declines. Therefore, the maximum value of the focus movement amount is restricted as follows.
[0071]
As shown in Fig. 4, the PSF peak value is a maximum at the focusing position, and declines as defocusing occurs, assuming a primary minimum value when the amount of defocus from the focusing position is a prescribed amount (±75 μm in the example in Fig. 4) . Fig. 16 shows a case where the positions of the primary minimum values of two PSF peak values are overlapping. In the case of Fig. 16, although the PSF peak ratio can be calculated, this ratio is in a region where both PSF peak values have fallen and is liable to be affected by noise, etc., and therefore it is not possible to determine an effective PSF peak ratio. Furthermore, if the focus movement amount is made larger than this, then similarly, it is not possible to calculate an effective PSF peak ratio. Therefore, the position where the primary minimum values of the two PSF peak values overlap with each other should be set as the maximum value of the focus movement amount. The focus movement amount in this case is calculated to be 150 μm, in the case of an ideal optical system having an F-number of 4. When the value of the coefficient k in Formula 2 is calculated, the result is
 [0072]
From the foregoing, a focus movement amount suited to a narrow depth measurement range can be obtained by setting the coefficient k to ±16 or a value close to this, in Formula 2. In practical terms, the focus movement amount should be set using a coefficient k in the range of -16 ≤ k < -8, 8 < k ≤ 16.
[0073]
The imaging conditions according to the present embodiment are imaging conditions which are set so as to satisfy these conditions. More specifically, the focus movement amount is set using a value of k = 14.3. Fig. 9 shows the PSF peak ratio (solid line) under the imaging conditions of the present embodiment, and the defocusing characteristics of the PSF peak value (dotted line) at the two focusing positions.
[0074]
In the case of these conditions, since the depth measurement range is a narrow 12 μm and the value range of the PSF peak ratio is approximately 90% of the maximum, then it is possible to measure a narrow depth range with high accuracy. However, in the depth measurement range of the PSF peak ratio, the ratio is in a region where the PSF peak values of the two focusing positions are low and therefore the value of the PSF peak ratio is liable to be affected by noise, etc., and varies greatly with slight change. Consequently, the reliability of the calculated
PSF peak ratio is low, and even if the value range is broad, accurate depth resolution cannot be achieved.
[0075]
On the other hand, in the region outside the depth measurement range, since one of the two PSF peak values is sufficiently large, then the PSF peak ratio is kept to an extremely low value. Consequently, it is possible to extract only the depth measurement range, by separating cases where the PSF peak value is equal to or greater than a certain threshold value from other cases. In other words, this is suitable for carrying out two-layer depth separation which extracts the depth measurement range only, or three-layer depth separation which distinguishes between the front and rear sides. The threshold value may be set to a value no less than the PSF peak ratio in the maximum depth measurement range, and desirably, is set to
approximately 20% of the value range of the PSF peak ratio.
[0076]
The depth measurement according to the present embodiment is depth measurement in an intermediate region between two focusing positions, and this depth measurement range does not overlap with the focusing position of the images which are captured. Therefore, if an image which is sharply focused in the extracted depth range is required, then an image of the desired focus may also be captured separately. Moreover, it is also possible to capture two images for depth measurement and an image of the desired
focus, continuously, in line with the change in the focusing position.
[0077]
As stated previously, in the image pickup apparatus according to the present embodiment, it is possible to capture an image which is suited to separating a particular depth range from other ranges.
[0078]
<Third embodiment>
The image pickup apparatus relating to a third embodiment has a similar composition to the image pickup apparatus relating to the first embodiment. Although the composition is the same, the policy for setting the focus movement amount is different.
[0079]
In the present embodiment, a focus movement amount which is suited to measuring a broader depth range is described. Table 4 shows imaging conditions according to the present embodiment.
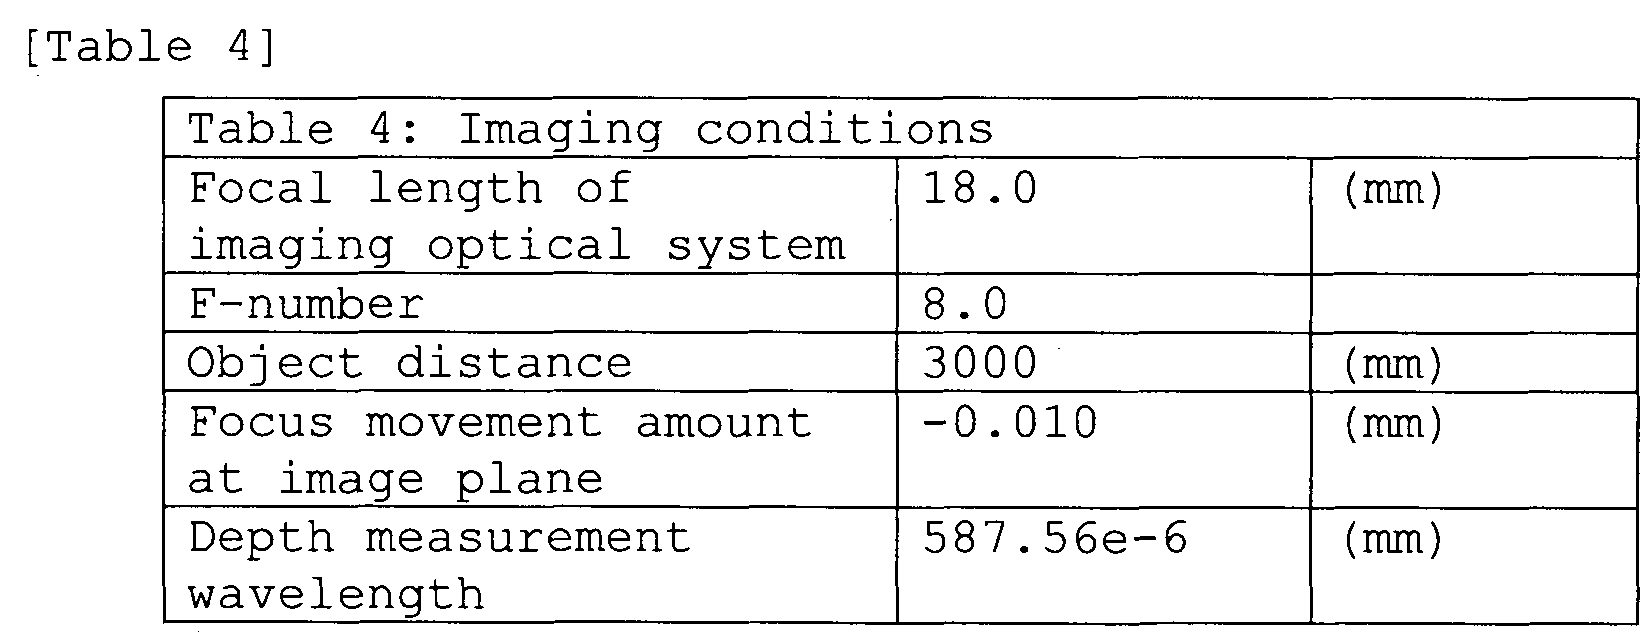
The characteristic features of the imaging conditions of
the present embodiment are that, in order to carry out broader depth measurement, the F-number is made larger and the focus movement amount is made smaller.
[0080]
If it is wished to broaden the depth measurement range, then as shown in Fig. 6A, the focus movement amount should be made as small as possible. However, if the focus movement amount is small, as shown in Fig. 6B, then the value range is also small and the depth resolution
declines. Furthermore, since the value range is narrow, then the value is relatively liable to be affected by noise and the depth measurement accuracy declines. Consequently, if a broader depth measurement range is adopted, the focus movement amount should be set to a position at which the value range becomes no less than approximately 70% of the maximum. More desirably, the value range should be no less than 90%.
[0081]
The focus movement amount in the present embodiment is set to a range where the value range becomes 90%. In the case of the imaging conditions according to the present embodiment, if the value of k in Formula 2 is calculated, then k = 0.266, and this satisfies the range of the
coefficient k which is specified by Formula 2. This is a focus movement amount that is suited to depth measurement in a broad range and in particular where the coefficient k is a value close to 0.
[0082]
As stated previously, in the image pickup apparatus according to the present embodiment, it is possible to capture an image which is suited to measuring the depth in a broad range.
[0083]
<Fourth embodiment>
The image pickup apparatus relating to a fourth embodiment has a similar composition to the image pickup apparatus relating to the first embodiment. Although the composition is the same, the policy for setting the focus movement amount is different.
[0084]
In the present embodiment, imaging conditions for raising the depth resolution at a desired focusing position is described. Similarly to the first embodiment, the number of captured images is two, namely, a first image which is captured at a desired focusing position and a second image which is captured at a displaced focusing position .
[0085]
The depth resolution becomes higher, the greater the gradient of the PSF peak ratio. This is because the amount of change in the PSF peak ratio with respect to the depth difference becomes larger. Consequently, in order to maximize the depth resolution at the desired focusing position, the focus movement amount should be set so as to
achieve a maximum gradient of the PSF peak ratio at that focusing position. Fig. 10 is a diagram which plots the gradient of the PSF peak ratio at the desired focusing position when the wavelength is 587.56 nm and the F-number is 4. The horizontal axis in Fig. 10 is the focus movement amount. The gradient of the PSF peak ratio becomes a maximum when the focus movement amount is ±0.031 mm.
[0086]
In this case, when the value of the coefficient k in Formula 2 is calculated, the result is k = 3.30. In practical terms, if the coefficient k is set to a range of -4 < k ≤ -2 and 2 ≤ k < 4, then a sufficient depth
resolution is obtained at the focusing position. As described above, in the image pickup apparatus according to the present embodiment, it is possible to capture images for depth measurement in such a manner that the depth resolution at the desired focusing position becomes a maximum.
[0087]
<Fifth embodiment>
The image pickup apparatus relating to a fifth embodiment has a similar composition to the image pickup apparatus relating to the first embodiment. Although the composition is the same, the policy for setting the focus movement amount is different. In the present embodiment, the focus movement amount is set in such a manner that the desired focusing position (the focusing position of the
first image) is included in the depth measurement range.
[0088]
As shown in Figs. 5A to 5F, the depth measurement range becomes narrower, the greater the focus movement amount. In Figs. 5A to 5D, the focusing position of the first image (the 0 μm position on the horizontal axis) is included in the depth measurement range, but as the focus movement amount becomes larger as in Figs. 5E and 5F, then the focusing position of the first image moves out of the depth measurement range.
[0089]
Here, if the amount of defocus when the PSF peak value has the primary minimum value is called the minimum defocus amount, then the focusing position of the first image is included in the depth measurement range in cases where the focus movement amount (absolute value) is smaller than the minimum defocus amount. In other words, in order that the focusing position of the first image is included in the depth measurement range, the value for the
coefficient k is chosen so that the focus movement amount d obtained by Formula 2 is smaller than the minimum defocus amount .
[0090]
Since the minimum defocus amount is approximately 0.075 mm when F = 4 and
 = 587.56 nm, then the focus movement amount d should be set to a range of -0.075 mm to +0.075 mm (excluding 0 mm). The range of the coefficient k
in this case is
= 587.56 nm, then the focus movement amount d should be set to a range of -0.075 mm to +0.075 mm (excluding 0 mm). The range of the coefficient k
in this case is
 .
.
[0091]
If the focus movement amount is equal to the minimum defocus amount, then the depth measurement range is only one side, either the front side or the rear side, of the focusing position of the first image. This direction matches the direction in which the focus is moved when capturing the second image.
[0092]
<Sixth embodiment>
The image pickup apparatus relating to a sixth embodiment has a similar composition to the image pickup apparatus relating to the first embodiment. Although the composition is similar, the indicator used for depth measurement is different. Table 5 shows imaging conditions used in the present embodiment.
[Table 5]

[0093]
In the present embodiment, a method for setting a focus movement amount in a case where depth measurement is carried out using the PSF correlation amount, rather than
the PSF peak value, will be described.
The depth measurement using the PSF correlation amount uses, as an indicator, the extent of similarity between the shapes of the PSF of two images.
[0094]
As a depth measurement method using the PSF
correlation amount, it is possible to employ a normalized cross-correlation, for example. The normalized cross- correlation NCC can be calculated by Formula 8 below, using the same partial regions of the two captured images for Cfl and Cf2:

Fig. 11 shows the defocusing characteristics of the PSF correlation amount obtained by Formula 8, using the imaging conditions according to the present embodiment. The curve shown by the solid line in Fig. 11 is a curve which plots the defocusing characteristics of the
normalized cross-correlation of two PSFs at the image plane having different focusing positions captured under the imaging conditions according to the present embodiment. The two curves indicated by the dotted lines are the normalized defocusing characteristics of the variance of two PSFs for different focusing positions.
[0095]
Thereupon, the depth measurement range in the depth measurement using the PSF correlation amount will be described with reference to Fig. 11.
As indicated by the solid line in Fig. 11, the value of the defocusing characteristics of the PSF correlation amount falls gradually from the central position between the two different focusing positions, reaches a minimum value, and then rises again, subsequently repeating this pattern. In the case of the defocusing characteristics curve of the PSF correlation amount also, the maximum peak is called the "maximum peak" or the "primary peak", and the local minimum values which respectively appear initially on the front side and the rear side of the maximum peak are called the "primary minimum values".
[0096]
<Focus movement amount and PSF correlation amount characteristics>
Next, the relationship between the focus movement amount and the change in the depth measurement range, and the relationship between the focus movement amount and the change in the value range of the PSF correlation amount will be described, and the setting of a more suitable focus movement amount will be explained.
[0097]
Figs. 12A to 12F show the defocusing characteristics of the PSF variance and the change in the PSF correlation amount (normalized cross-correlation value) , when the focus
movement amount is changed. The focus movement amount is expressed as a difference in the horizontal axis direction between the defocussing characteristics of two PSF variance values (dotted line) . In other words, the focus movement amount gradually becomes larger, from Fig. 12A toward Fig. 12F. Here, examples are shown in which the value at the point of intersection of the defocussing characteristics of the two PSF variance values (the point of intersection of the dotted lines) is set respectively to 95%, 90%, 70%, 50%, 30% and 10% of the maximum value of the PSF variance. It can be seen that, as the focus movement amount
increases, the characteristics of the PSF correlation amount (solid line) change. More specifically, it can be seen that the depth measurement range (the range between the primary minimum value position on the front side and the primary minimum value position on the rear side of the maximum peak of the PSF correlation amount) becomes
gradually narrower as the focus movement amount becomes larger .
[0098]
Similarly, it can be seen that the value range of the PSF correlation amount (the difference between the maximum value and the primary minimum value of the PSF correlation amount) broadens and then narrows, as the focus movement amount becomes larger. The depth resolution becomes higher, the broader the range of the value of the PSF correlation amount, and hence the tolerance with respect to
variable factors, such as noise, becomes higher and the depth measurement accuracy is improved.
[0099]
Figs. 13A and 13B respectively show change in the depth measurement range in accordance with the focus movement amount, and change in the range of the value of the PSF correlation amount. In Fig. 13A, the horizontal axis represents the focus movement amount and the vertical axis represents the depth measurement range on the side of the image plane. There is a singular point when the focus movement amount is zero, since depth measurement is not possible in this case.
Similarly, in Fig. 13B, the horizontal axis
represents the focus movement amount and the vertical axis represents the value range. Here, the PSF correlation amount is normalized and therefore the maximum value of the value range is 1. The value range is a maximum when the focus movement amount is in the vicinity of ±0.078 mm.
Furthermore, Fig. 13C shows change in the gradient of the PSF correlation amount at the focusing position of the first image, with the focus movement amount. The value range is a maximum when the focus movement amount is in the vicinity of ±0.054 mm.
[0100]
The greater the focus movement amount, the lower the variance of the PSF in the region where the PSF correlation amount is determined. In this region, the PSF becomes very
broad and the PSF correlation amount is liable to be affected by noise. Therefore, the maximum value of the focus movement amount is limited by a certain extent. The maximum value of the focus movement amount should be set up to a distance at which the value at the point of
intersection between the two PSF variances falls to 1/e2 from the maximum value of the PSF variance. The point of intersection between the two PSF variances is at the midpoint between the two focusing positions (in other words, at half of the focus movement amount) , and therefore the. conditions described above can also be expressed as making the focus movement amount (absolute value) smaller than two times the amount of defocus at which the PSF variance becomes 1/e2 of the maximum value. This is based on the same approach as the definition of the beam waist diameter of a laser. To satisfy this condition, the value of the coefficient k in Formula 2 should be set to around 10 or lower.
[0101]
<Policy with regard to optimal focus movement amount> In the present embodiment, the imaging conditions are set in such a manner that the breadth of the depth
measurement range, the breadth of the value range and the height of the depth resolution at the focusing position of the first image are all satisfied simultaneously. More specifically, an evaluation value (score) is calculated by respectively normalizing the three factors: the depth
measurement range, the value range and the gradient of the PSF correlation amount at the focusing position, and weighted-averaging the factors. The focus movement amount which achieves the largest evaluation value is set. In the present embodiment, evaluation is made by using the same weight for each factor. Here, the optimal focus movement amount is +0.055 mm. The results of this are shown in Fig. 14.
In the imaging conditions according to the present embodiment, the focus movement amount d = -0.055 mm, the F- number is F = 4, and the wavelength
 = 587.56 nm. If the value of the coefficient k in Formula 2 is calculated from these values, then k = 5.85, and the range of the
coefficient k stipulated in Formula 2 is satisfied.
[0102]
In the present embodiment, a normalized cross- correlation is used as an example of depth measurement based on the PSF correlation amount, but it is also
possible to calculate a PSF correlation amount by another method. Furthermore, the focus movement amount should be set using at least one of the measurement range, the value range and the gradient of the correlation value at the focusing position.
[0103]
installation example>
The depth measurement technology according to the present invention described above is desirably applied in
an image pickup apparatus, such as a digital camera or a camcorder, or an image processing apparatus or a computer which carries out image processing of image data obtained by an image pickup apparatus. Furthermore, the technology of the present invention can also be applied to electronic equipment of various types which incorporates an image pickup apparatus or an image processing apparatus of this kind (equipment such as mobile telephones, smartphones, tablet terminals, and personal computers). In the
embodiment described above, a composition which
incorporates the functions of the depth information
determination unit into the main body of the image pickup apparatus was described, but the functions of the depth information determination unit may be composed in any way. For example, it is possible to incorporate a depth
information determination unit into a computer having an image pickup apparatus, in such a manner that a computer acquires images captured by the image pickup apparatus and carries out a depth calculation on the basis of the images. Furthermore, the depth information determination unit may be incorporated into a computer which has network access by a wired or wireless connection, a plurality of images may be acquired by the computer via the network, and a depth calculation may be carried out on the basis of these images. The depth information thus obtained can be used for various image processing, such as dividing up image regions, generating three-dimensional images and depth
images, emulating blur effects, and so on.
[0104]
Actual installation in the apparatuses described above can a software (program) -based installation or a hardware-based installation. For example, various
processes for achieving the object of the present invention can also be implemented by storing- a program in the memory of a computer (such as a microcomputer, or FPGA) which is incorporated into an image pickup apparatus or an image processing apparatus. Furthermore, desirably, a special processor, such as an ASIC, is provided to achieve all or a portion of the processes according to the present invention by a logic circuit.
[0105]
Aspects of the present invention can also be realized by a computer of a system or apparatus (or devices such as a CPU or MPU) that reads out and executes a program
recorded on a memory device to perform the functions of the above-described embodiment ( s ) , and by a method, the steps of which are performed by a computer of a system or
apparatus by, for example, reading out and executing a program recorded on a memory device to perform the
functions of the above-described embodiment (s) . For this purpose, the program is provided to the computer for example via a network or from a recording medium of various types serving as the memory device (e.g., non-transitory computer-readable medium) .
While the present invention has been described with reference to exemplary embodiments, it is to be understood that the invention is not limited to the disclosed
exemplary embodiments. The scope of the following claims is to be accorded the broadest interpretation so as to encompass all such modifications and equivalent structures and functions.
This application claims the benefit of Japanese Patent Application No. 2012-169753, filed on July 31, 2012 and Japanese Patent Application No. 2013-145333, filed on July 11, 2013, which are hereby incorporated by reference herein in their entirety.'
Claims
1. An image pickup apparatus, comprising:
an imaging unit which acquires a first image by capturing an object at a first focusing position, and which acquires a second image after acquiring the first image, by capturing the object at a second focusing position which is different from the first focusing position, the second image having different blur from the first image;
a depth information determination unit determining depth information of the object on the basis of a
difference in blur between the first image and the second image ; and
a focusing position setting unit setting a focus movement amount which is a difference between the first focusing position and the second focusing position, in accordance with an F-number of the imaging unit,
wherein the focusing position setting unit sets the second focusing position in such a manner that an absolute value of the focus movement amount is larger when the F- number is large, compared to when the F-number is
relatively small.
2. An image pickup apparatus, comprising:
an imaging unit which acquires a first image by capturing an object at a first focusing position, and which acquires a second image after acquiring the first image, by
capturing the object at a second focusing position which is different from the first focusing position, the second image having different blur from the first image;
a depth information determination unit determining depth information of the object on the basis of a
difference in blur between the first image and the second image; and
a focusing position setting unit setting the second focusing position in such a manner that a focus movement amount, which is a difference between the first focusing position and the second focusing position, satisfies the formula given below:

where d: focus movement amount at image plane; k:
coefficient; F: F-number;
 wavelength of light used to capture first and second images.
3. The image pickup apparatus according to claim 1 or 2, wherein the depth information determination unit determines the depth information on the basis of a ratio between a peak value of a PSF obtained from the first image and a peak value of a PSF obtained from the second image.
4. The image pickup apparatus according to claim 3,
wherein the peak value of the PSF of the imaging unit is a maximum at a focusing position and decreases as defocusing occurs, reaching a local minimum value when an
amount of defocus from the focusing position is a prescribed amount, and
an absolute value of the focus movement amount is set to a value smaller than the prescribed amount.
5. The image pickup apparatus according to claim 1 or 2, wherein the depth information determination unit determines the depth information on the basis of a correlation between a PSF obtained from the first image and a PSF obtained from the second image.
6. The image pickup apparatus according to claim 5,
wherein a variance value of the PSF of the imaging unit is a maximum at a focusing position and decreases as defocusing occurs, reaching a value 1/e2 of the maximum value when an amount of defocus from the focusing position is a prescribed amount, and
an absolute value of the focus movement amount is set to a value smaller than two times the prescribed amount.
7. The image pickup apparatus according to any one of claims 1 to 6,
wherein, if the depth information determination unit is a unit which determines whether or not the object is included in one particular depth range,
the focus movement amount is set so as to satisfy the formula given below:

where d: focus movement amount at image plane; k: coefficient; F: F-number; wavelength of light used to

capture first and second images.
8. The image pickup apparatus according to any one of claims 1 to 6,
wherein, if the depth information determination unit is a unit which determines in which of three or more depth ranges the object is included,
the focus movement amount is set so as to satisfy the formula given below:

where d: focus movement amount at image plane; k: coefficient; F: F-number; wavelength of light used to

capture first and second images.
9. The image pickup apparatus according to claim 8,
wherein the focus movement amount is set so as to satisfy the formula given below:

10. The image pickup apparatus according to any one of claims 1 to 9,
wherein, if the depth information determination unit determines depth information of an object which is situated to the side of infinity from the first focusing position,
then the second focusing position is set to the side of infinity from the first focusing position.
11. The image pickup apparatus according to any one of claims 1 to 9,
wherein, if the depth information determination unit determines depth information of an object which is situated to the side of the image pickup apparatus from the first focusing position,
then the second focusing position is set to the side of the image pickup apparatus from the first focusing position .
12. The image pickup apparatus according to any one of claims 2 and 7 to 9,
wherein the imaging unit has an image sensor equipped with a color filter having an arrangement of RGB pixels, and
is a central wavelength of a color filter of a green pixel.
13. The image pickup apparatus according to any one of claims 2 and 7 to 9, wherein
 is 587.56 nm.
14. A depth information acquisition method, comprising: a first imaging step of acquiring a first image by capturing an object at a first focusing position;
a second imaging step of acquiring a second image having different blur from the first image, by capturing the object at a second focusing position which is different from the first focusing position, after the first imaging step; and
a depth information determining step of determining depth information of the object on the basis of a
difference in blur between the first image and the second image,
wherein the second imaging step includes a focusing position setting step of setting a focus movement amount which is a difference between the first focusing position and the second focusing position in accordance with an F- number during imaging, and
in the focusing position setting step, the second focusing position is set in such a manner that an absolute value of the focus movement amount is larger when the F- number is large, compared to when the F-number is
relatively small.
15. A depth information acquisition method, comprising: a first imaging step of acquiring a first image by capturing an object at a first focusing position;
a second imaging step of acquiring a second image having different blur from the first image, by capturing the object at a second focusing position which is different from the first focusing position, after the first imaging
step; and
a depth information determining step of determining depth information of the object on the basis of a
difference in blur between the first image and the second image,
wherein the second focusing position is set in such a manner that a focus movement amount, which is a difference between the first focusing position and the second focusing position, satisfies the formula given below:

where d: focus movement amount at image plane; k: coefficient; F: F-number;
 wavelength of light used to capture first and second images.
16. A program which causes a computer to execute the respective steps of the depth information acquisition method according to claim 14 or 15.
Priority Applications (2)
| Application Number | Priority Date | Filing Date | Title |
|---|---|---|---|
| US14/406,866 US9762788B2 (en) | 2012-07-31 | 2013-07-23 | Image pickup apparatus, depth information acquisition method and program |
| EP13825372.9A EP2880399B1 (en) | 2012-07-31 | 2013-07-23 | Image pickup apparatus, depth information acquisition method and program |
Applications Claiming Priority (4)
| Application Number | Priority Date | Filing Date | Title |
|---|---|---|---|
| JP2012169753 | 2012-07-31 | ||
| JP2012-169753 | 2012-07-31 | ||
| JP2013145333A JP6157249B2 (en) | 2012-07-31 | 2013-07-11 | Imaging apparatus, distance information acquisition method, and program |
| JP2013-145333 | 2013-07-11 |
Publications (1)
| Publication Number | Publication Date |
|---|---|
| WO2014021238A1 true WO2014021238A1 (en) | 2014-02-06 |
Family
ID=50027913
Family Applications (1)
| Application Number | Title | Priority Date | Filing Date |
|---|---|---|---|
| PCT/JP2013/070406 Ceased WO2014021238A1 (en) | 2012-07-31 | 2013-07-23 | Image pickup apparatus, depth information acquisition method and program |
Country Status (4)
| Country | Link |
|---|---|
| US (1) | US9762788B2 (en) |
| EP (1) | EP2880399B1 (en) |
| JP (1) | JP6157249B2 (en) |
| WO (1) | WO2014021238A1 (en) |
Cited By (1)
| Publication number | Priority date | Publication date | Assignee | Title |
|---|---|---|---|---|
| CN103795933A (en) * | 2014-03-03 | 2014-05-14 | 联想(北京)有限公司 | Image processing method and electronic device |
Families Citing this family (17)
| Publication number | Priority date | Publication date | Assignee | Title |
|---|---|---|---|---|
| JP2607637Y2 (en) | 1993-03-17 | 2002-03-04 | 三菱長崎機工株式会社 | Conveyor with vertical head |
| JP6157249B2 (en) * | 2012-07-31 | 2017-07-05 | キヤノン株式会社 | Imaging apparatus, distance information acquisition method, and program |
| JP6091228B2 (en) * | 2013-01-30 | 2017-03-08 | キヤノン株式会社 | Image processing apparatus and imaging apparatus |
| JP6173156B2 (en) * | 2013-10-02 | 2017-08-02 | キヤノン株式会社 | Image processing apparatus, imaging apparatus, and image processing method |
| JP5866493B2 (en) | 2013-11-19 | 2016-02-17 | パナソニックIpマネジメント株式会社 | Imaging device |
| US9928598B2 (en) | 2014-10-31 | 2018-03-27 | Canon Kabushiki Kaisha | Depth measurement apparatus, imaging apparatus and depth measurement method that calculate depth information of a target pixel using a color plane of which a correlation value is at most a threshold |
| JP6555990B2 (en) * | 2014-10-31 | 2019-08-07 | キヤノン株式会社 | Distance measuring device, imaging device, and distance measuring method |
| JP6521676B2 (en) | 2015-03-09 | 2019-05-29 | キヤノン株式会社 | Motion information acquisition apparatus and motion information acquisition method |
| CN107170007B (en) * | 2016-03-02 | 2019-12-27 | 钰立微电子股份有限公司 | Image device with image defocusing function and method for generating defocused image |
| JP6921500B2 (en) * | 2016-10-24 | 2021-08-18 | キヤノン株式会社 | Distance detection device and distance detection method |
| US10277889B2 (en) * | 2016-12-27 | 2019-04-30 | Qualcomm Incorporated | Method and system for depth estimation based upon object magnification |
| JP6413170B1 (en) * | 2017-06-22 | 2018-10-31 | エスゼット ディージェイアイ テクノロジー カンパニー リミテッドSz Dji Technology Co.,Ltd | Determination apparatus, imaging apparatus, imaging system, moving object, determination method, and program |
| KR102382865B1 (en) * | 2017-06-28 | 2022-04-05 | 삼성전자주식회사 | Camera Module, Electronic Device including Camera Module |
| JP7002050B2 (en) * | 2018-07-11 | 2022-02-10 | パナソニックIpマネジメント株式会社 | Imaging device |
| JP2020162628A (en) * | 2019-03-28 | 2020-10-08 | ソニー株式会社 | Optical systems, endoscopes, and medical image processing systems |
| CN112529951B (en) * | 2019-09-18 | 2024-06-25 | 华为技术有限公司 | Method, device and electronic device for acquiring extended depth of field image |
| JP7451120B2 (en) | 2019-09-20 | 2024-03-18 | キヤノン株式会社 | Image processing device, image processing method, imaging device, program |
Citations (4)
| Publication number | Priority date | Publication date | Assignee | Title |
|---|---|---|---|---|
| JPH01167610A (en) | 1987-11-27 | 1989-07-03 | Univ New York State | Method and apparatus for determining the distance between a surface section of a three-dimensional spatial scene and a camera device |
| JP4403477B2 (en) | 2000-01-26 | 2010-01-27 | ソニー株式会社 | Image processing apparatus and image processing method |
| WO2012066774A1 (en) | 2010-11-17 | 2012-05-24 | パナソニック株式会社 | Image pickup device and distance measuring method |
| WO2012070208A1 (en) * | 2010-11-24 | 2012-05-31 | パナソニック株式会社 | Image capturing device, image capturing method, program and integrated circuit |
Family Cites Families (7)
| Publication number | Priority date | Publication date | Assignee | Title |
|---|---|---|---|---|
| JPS58218631A (en) * | 1982-06-15 | 1983-12-19 | Olympus Optical Co Ltd | F-number detecting method |
| JP6157249B2 (en) * | 2012-07-31 | 2017-07-05 | キヤノン株式会社 | Imaging apparatus, distance information acquisition method, and program |
| JP6091228B2 (en) | 2013-01-30 | 2017-03-08 | キヤノン株式会社 | Image processing apparatus and imaging apparatus |
| JP2015036632A (en) | 2013-08-12 | 2015-02-23 | キヤノン株式会社 | Distance measuring device, imaging device, distance measuring method |
| JP6173156B2 (en) * | 2013-10-02 | 2017-08-02 | キヤノン株式会社 | Image processing apparatus, imaging apparatus, and image processing method |
| JP5866493B2 (en) * | 2013-11-19 | 2016-02-17 | パナソニックIpマネジメント株式会社 | Imaging device |
| US9361698B1 (en) * | 2014-11-12 | 2016-06-07 | Amazon Technologies, Inc. | Structure light depth sensor |
-
2013
- 2013-07-11 JP JP2013145333A patent/JP6157249B2/en active Active
- 2013-07-23 WO PCT/JP2013/070406 patent/WO2014021238A1/en not_active Ceased
- 2013-07-23 US US14/406,866 patent/US9762788B2/en active Active
- 2013-07-23 EP EP13825372.9A patent/EP2880399B1/en active Active
Patent Citations (4)
| Publication number | Priority date | Publication date | Assignee | Title |
|---|---|---|---|---|
| JPH01167610A (en) | 1987-11-27 | 1989-07-03 | Univ New York State | Method and apparatus for determining the distance between a surface section of a three-dimensional spatial scene and a camera device |
| JP4403477B2 (en) | 2000-01-26 | 2010-01-27 | ソニー株式会社 | Image processing apparatus and image processing method |
| WO2012066774A1 (en) | 2010-11-17 | 2012-05-24 | パナソニック株式会社 | Image pickup device and distance measuring method |
| WO2012070208A1 (en) * | 2010-11-24 | 2012-05-31 | パナソニック株式会社 | Image capturing device, image capturing method, program and integrated circuit |
Non-Patent Citations (4)
| Title |
|---|
| PHAM D T ET AL.: "PATTERN RECOGNITION", vol. 32, 1 May 1999, ELS EVIER, article "Depth from defocusing using a neural network", pages: 715 - 727 |
| SCHECHNER Y Y ET AL.: "COMPUTER VISION, 1999. THE PROCEEDINGS OF THE SEVENTH IEEE INTERNATIONAL AL CONFERENCE", vol. 2, 20 September 1999, IEEE, article "The optimal axial interval in estimating depth from defocus", pages: 843 - 848 |
| See also references of EP2880399A4 |
| YOAV Y.SCHECHNER ET AL.: "The Optimal Axial Interval in Estimating Depth from Defocus", COMPUTER VISION,1999.THE PROCEEDINGS OF SEVENTH IEEE INTERNATIONAL CONFERENCE ON, vol. 2, 1999, pages 843 - 848, XP010350487 * |
Cited By (1)
| Publication number | Priority date | Publication date | Assignee | Title |
|---|---|---|---|---|
| CN103795933A (en) * | 2014-03-03 | 2014-05-14 | 联想(北京)有限公司 | Image processing method and electronic device |
Also Published As
| Publication number | Publication date |
|---|---|
| JP6157249B2 (en) | 2017-07-05 |
| EP2880399A4 (en) | 2016-05-11 |
| US20150109514A1 (en) | 2015-04-23 |
| EP2880399B1 (en) | 2019-02-06 |
| US9762788B2 (en) | 2017-09-12 |
| EP2880399A1 (en) | 2015-06-10 |
| JP2014044408A (en) | 2014-03-13 |
Similar Documents
| Publication | Publication Date | Title |
|---|---|---|
| US9762788B2 (en) | Image pickup apparatus, depth information acquisition method and program | |
| US10070038B2 (en) | Image processing apparatus and method calculates distance information in a depth direction of an object in an image using two images whose blur is different | |
| US9781344B2 (en) | Processing device, image pickup device and processing method for obtaining distance information from a difference in blur degree | |
| US9607240B2 (en) | Image processing apparatus, image capturing apparatus, image processing method, image capturing method, and non-transitory computer-readable medium for focus bracketing | |
| US10326927B2 (en) | Distance information producing apparatus, image capturing apparatus, distance information producing method and storage medium storing distance information producing program | |
| JP6245885B2 (en) | Imaging apparatus and control method thereof | |
| US9251589B2 (en) | Depth measurement apparatus, image pickup apparatus, and depth measurement program | |
| CN105391932B (en) | Image processing device and control method thereof, imaging device and control method thereof | |
| US9076214B2 (en) | Image acquisition apparatus and image processing apparatus using selected in-focus image data | |
| US9131145B2 (en) | Image pickup apparatus and control method therefor | |
| JP2015034732A (en) | Distance calculation device, imaging apparatus, and distance calculation method | |
| US20160080727A1 (en) | Depth measurement apparatus, imaging apparatus, and depth measurement method | |
| CN108710192B (en) | Statistical data-based autofocus system and method | |
| EP3576402B1 (en) | Image processing apparatus, image processing method, and storage medium | |
| US20180352171A1 (en) | Image capture apparatus, image processing system, and control method thereof | |
| US10326951B2 (en) | Image processing apparatus, image processing method, image capturing apparatus and image processing program | |
| US11032465B2 (en) | Image processing apparatus, image processing method, imaging apparatus, and recording medium | |
| JP2016066995A (en) | Image deviation amount calculation device, imaging device and image deviation amount calculation method | |
| JP6685550B2 (en) | Autofocus device and autofocus program | |
| JP6558978B2 (en) | Image processing apparatus, image processing method, and program | |
| WO2016042721A1 (en) | Positional shift amount calculation apparatus and imaging apparatus |
Legal Events
| Date | Code | Title | Description |
|---|---|---|---|
| 121 | Ep: the epo has been informed by wipo that ep was designated in this application |
Ref document number: 13825372 Country of ref document: EP Kind code of ref document: A1 |
|
| WWE | Wipo information: entry into national phase |
Ref document number: 14406866 Country of ref document: US |
|
| WWE | Wipo information: entry into national phase |
Ref document number: 2013825372 Country of ref document: EP |
|
| NENP | Non-entry into the national phase |
Ref country code: DE |