WO2014074889A2 - Method of determining and managing total cardiodiabetes risk - Google Patents
Method of determining and managing total cardiodiabetes risk Download PDFInfo
- Publication number
- WO2014074889A2 WO2014074889A2 PCT/US2013/069257 US2013069257W WO2014074889A2 WO 2014074889 A2 WO2014074889 A2 WO 2014074889A2 US 2013069257 W US2013069257 W US 2013069257W WO 2014074889 A2 WO2014074889 A2 WO 2014074889A2
- Authority
- WO
- WIPO (PCT)
- Prior art keywords
- cardiodiabetes
- insulin
- risk
- glucose
- patient
- Prior art date
- Legal status (The legal status is an assumption and is not a legal conclusion. Google has not performed a legal analysis and makes no representation as to the accuracy of the status listed.)
- Ceased
Links
Classifications
-
- G—PHYSICS
- G01—MEASURING; TESTING
- G01N—INVESTIGATING OR ANALYSING MATERIALS BY DETERMINING THEIR CHEMICAL OR PHYSICAL PROPERTIES
- G01N33/00—Investigating or analysing materials by specific methods not covered by groups G01N1/00 - G01N31/00
- G01N33/48—Biological material, e.g. blood, urine; Haemocytometers
- G01N33/50—Chemical analysis of biological material, e.g. blood, urine; Testing involving biospecific ligand binding methods; Immunological testing
- G01N33/68—Chemical analysis of biological material, e.g. blood, urine; Testing involving biospecific ligand binding methods; Immunological testing involving proteins, peptides or amino acids
- G01N33/6893—Chemical analysis of biological material, e.g. blood, urine; Testing involving biospecific ligand binding methods; Immunological testing involving proteins, peptides or amino acids related to diseases not provided for elsewhere
-
- G—PHYSICS
- G16—INFORMATION AND COMMUNICATION TECHNOLOGY [ICT] SPECIALLY ADAPTED FOR SPECIFIC APPLICATION FIELDS
- G16H—HEALTHCARE INFORMATICS, i.e. INFORMATION AND COMMUNICATION TECHNOLOGY [ICT] SPECIALLY ADAPTED FOR THE HANDLING OR PROCESSING OF MEDICAL OR HEALTHCARE DATA
- G16H50/00—ICT specially adapted for medical diagnosis, medical simulation or medical data mining; ICT specially adapted for detecting, monitoring or modelling epidemics or pandemics
- G16H50/30—ICT specially adapted for medical diagnosis, medical simulation or medical data mining; ICT specially adapted for detecting, monitoring or modelling epidemics or pandemics for calculating health indices; for individual health risk assessment
-
- G—PHYSICS
- G01—MEASURING; TESTING
- G01N—INVESTIGATING OR ANALYSING MATERIALS BY DETERMINING THEIR CHEMICAL OR PHYSICAL PROPERTIES
- G01N2800/00—Detection or diagnosis of diseases
- G01N2800/04—Endocrine or metabolic disorders
- G01N2800/042—Disorders of carbohydrate metabolism, e.g. diabetes, glucose metabolism
-
- G—PHYSICS
- G01—MEASURING; TESTING
- G01N—INVESTIGATING OR ANALYSING MATERIALS BY DETERMINING THEIR CHEMICAL OR PHYSICAL PROPERTIES
- G01N2800/00—Detection or diagnosis of diseases
- G01N2800/32—Cardiovascular disorders
- G01N2800/325—Heart failure or cardiac arrest, e.g. cardiomyopathy, congestive heart failure
Definitions
- the patent application relates to personalized or patient-specific cardiodiabetes health reports and methods of generating such reports.
- this application describes how a patient-specific information relevant to a patient's cardiodiabetes risk are collected, selected, organized, and presented on the cardiodiabetes health reports to guide and allow a physician or healthcare provider in the choice of therapy or therapies that will be maximally effective for a specific patient, to monitor the response to the chosen therapy and reduce the patient's risk of developing cardiodiabetes and/or its complications.
- Beta cell dysfunction, insulin resistance, glycemic control, inflammation, and dyslipidemia are all separate but inextricably inter-related physiological processes that work together in the initiation and progression or remission of cardiodiabetes. Therefore, standard diagnostic tests and panels that measure the contribution of one physiological process without integrating data from the others can lead to an incomplete clinical picture and this lack of access to more comprehensive information by healthcare providers may result in sub-optimal decision-making when selecting treatments for patients based on test results to reduce their risk of cardiodiabetes and improve their health.
- This invention relates to a method, through the use of a computer processor, of generating a report that contains a patient-specific information relevant to the assessment of a patient's cardiodiabetes risk.
- the method comprises (a) collecting, using the processor, the results of a biomarker test specific to a patient, wherein the biomarker test includes quantitative measurement of at least one biomarker from at least three (3) of the following panels: (1) a total glycemic control panel; (2) a beta cell function panel; (3) an insulin resistance panel; (4) an inflammation panel; and (5) a dyslipidemia panel, (b) selecting, using the processor, a cardiodiabetes categorical risk level based on the patient's results of the biomarker test, (c) organizing, using the processor, the results of the biomarker test and the cardiodiabetes categorical risk level in a patient-specific cardiodiabetes health report, and (d) presenting the patient-specific cardiodiabetes health report, wherein the report comprises the cardiodia
- the total glycemic control panel includes one or more biomarkers selected from glucose, HbAlc, fructosamine, glycation gap, D-mannose, and 1,5-anhydroglucitol (1,5-AG) and, optionally, a-hydroxybutyrate (AHB).
- biomarkers selected from glucose, HbAlc, fructosamine, glycation gap, D-mannose, and 1,5-anhydroglucitol (1,5-AG) and, optionally, a-hydroxybutyrate (AHB).
- the beta cell function panel includes one or more biomarkers selected from serum amylase, anti- glutamic acid decarboxylase (GAD) autoantibody, c-peptide, and intact pro-insulin and, optionally, one or more biomarkers selected from ; glucagon-like peptide 1 (GLP-1); c-peptide/insulin ratio; intact pro-insulin/insulin ratio; [c-peptide + pro-insulin]/insulin ratio; an autoantibody against pancreatic islet cells; an autoantibody against amylase alpha-2 and a-hydroxybutyrate (AHB).
- GLP-1 glucagon-like peptide 1
- GLP-1 glucagon-like peptide 1
- c-peptide/insulin ratio intact pro-insulin/insulin ratio
- [c-peptide + pro-insulin]/insulin ratio an autoantibody against pancreatic islet cells
- the insulin resistance panel include one or more biomarkers selected from D-mannose, leptin, adiponectin, ferritin, and free fatty acids (FFA), and, optionally, one or more biomarkers selected from a-hydroxybutyrate (AHB); oleic acid; linoleoyl-glycerophosphocholine (L-GPC); lipoprotein insulin resistance (LP-IR) score; glucagon-like peptide 1 (GLP-1); mannose binding lectin (MBL) level, activity, genetic polymorphisms or known haplotypes thereof; and body mass index (BMI).
- biomarkers selected from D-mannose, leptin, adiponectin, ferritin, and free fatty acids (FFA), and, optionally, one or more biomarkers selected from a-hydroxybutyrate (AHB); oleic acid; linoleoyl-glycerophosphocholine (L-GPC); lipoprotein insulin resistance (LP
- the inflammation panel includes one or more biomarkers selected from lipoprotein-associated phospholipase A2
- LpPLA2 fibrinogen, high sensitivity C-reactive protein (hsCRP), myeloperoxidase (MPO) and F2-isoprostanes and, optionally, one or more biomarkers selected from the group consisting of serum amyloid A and variants thereof; HSP-70; IL-6; TNF-a; haptoglobin and variants thereof; secretory phospholipase A2 (sPLA2); pregnancy-associated plasma protein-A (PAPP-A); and mannose binding lectin (MBL) level, activity, genetic polymorphisms or known haplotypes thereof.
- hsCRP high sensitivity C-reactive protein
- MPO myeloperoxidase
- F2-isoprostanes F2-isoprostanes and, optionally, one or more biomarkers selected from the group consisting of serum amyloid A and variants thereof; HSP-70; IL-6; TNF-a; haptoglobin and variants thereof; secretor
- the dyslipidemia panel includes one or more biomarkers selected from LDL-C; HDL-C; triglycerides; apolipoprotein B-48 (ApoB-48); remnant-like lipoprotein particles (RLPs) or RLP-associated cholesterol (RLP-c); linoleoyl- glycerophosphocholine (L-GPC); and at least one additional lipid particle measurement selected from the group consisting of LDL-P, HDL-P (total), large VLDL-P, small LDL-P, large HDL-P, VLDL size, LDL size, HDL size and LP-IR score and, optionally, one or more biomarkers selected from the group consisting of the lipid particle measurements of enumerated in Figures 2 and 3; the measurement of cholesterol and/or triglycerides contained within one or more specific subtypes of lipoprotein particles and remnants thereof; and mannose binding lectin (MBL) level, activity, genetic
- MDL mannose binding lect
- the total glycemic control panel may comprise (1) two or more biomarkers or (2) three or more biomarkers selected from glucose, HbAlc, fructosamine, glycation gap, D- mannose, 1,5-anhydroglucitol (1,5-AG).
- the beta cell function panel may comprise (1) two or more biomarkers or (2) three or more biomarkers selected from serum amylase, anti- glutamic acid decarboxylase (GAD) autoantibody, c-peptide, and intact pro-insulin.
- biomarkers selected from serum amylase, anti- glutamic acid decarboxylase (GAD) autoantibody, c-peptide, and intact pro-insulin.
- the insulin resistance panel may comprise (1) two or more biomarkers or (2) three or more biomarkers selected from D-mannose, leptin, adiponectin, ferritin, and free fatty acids (FFA).
- biomarkers selected from D-mannose, leptin, adiponectin, ferritin, and free fatty acids (FFA).
- the inflammation panel may comprise (1) two or more biomarkers or (2) three or more biomarkers selected from the group consisting of lipoprotein-associated phospho lipase A2 (LpPLA2), fibrinogen, high sensitivity C-reactive protein (hsCRP), myeloperoxidase (MPO) and F2-isoprostanes.
- LpPLA2 lipoprotein-associated phospho lipase A2
- hsCRP high sensitivity C-reactive protein
- MPO myeloperoxidase
- F2-isoprostanes F2-isoprostanes.
- the dyslipidemia panel may comprise (1) two or more biomarkers or (2) three or more biomarkers selected from the group consisting LDL-C; HDL-C; triglycerides;
- apolipoprotein B-48 ApoB-48
- RLPs remnant-like lipoprotein particles
- RLP-c RLP-associated cholesterol
- L-GPC linoleoyl-glycerophosphocholine
- at least one additional lipid particle measurement selected from the group consisting of LDL-P, HDL-P (total), large VLDL- P, small LDL-P, large HDL-P, VLDL size, LDL size, HDL size and LP-IR score.
- the cardiodiabetes categorical risk level can be selected by comparing the biomarker test results of the patient with the standard reference levels of the biomarkers and can be categorized as optimal (low risk), intermediate (elevated risk) or high risk. [0019] In one embodiment, the method further includes evaluating the cardiodiabetes categorical risk level against one or more clinical endpoint components of the cardiodiabetic disease.
- These one or more clinical endpoint components of cardiodiabetic disease encompasss, e.g., measurements of blood glucose level at any time point in an OGTT or mixed meal challenge, measurements of blood insulin level at any time during an OGTT or mixed meal challenge, early signs of impaired first and/or second phase insulin secretion, early signs of impaired incretin response, early signs of impaired glucose disposal rate, early signs of adipose insulin resistance, early signs of hepatic insulin resistance, early signs of microvascular cardiodiabetic disease, and early signs of macrovascular cardiovascular disease.
- the evaluated cardiodiabetes categorical risk level is then entered to the patient-specific cardiodiabetes health report.
- the patient-specific cardiodiabetes health report provides information relative to a patient's risk of a cardiodiabetes disorder and complications thereof, wherein the the
- cardiodiabetes disorder and complications thereof may include insulin resistance, metabolic syndrome, type 2 diabetes mellitus (T2DM), type 1 diabetes mellitus (T1DM), fatty liver, diabetic nephropathy, diabetic neuropathy, vasculitis, atherosclerosis, coronary artery disease (CAD), vulnerable plaque formation, myocardial infarction (MI), cardiomyopathy, endothelial dysfunction, hypertension, occlusive stroke, ischemic stroke, transient ischemic event (TIA), deep vein thrombosis (DVT), dyslipidemia, gestational diabetes (GDM), periodontal disease, obesity, morbid obesity, chronic and acute infections, pre-term labor, diabetic retinopathy, and systemic or organ-specific inflammation.
- T2DM type 2 diabetes mellitus
- T1DM type 1 diabetes mellitus
- fatty liver diabetic nephropathy, diabetic neuropathy, vasculitis, atherosclerosis, coronary artery disease (CAD), vulnerable plaque formation, myocardial in
- Another embodiment of the invention further includes selecting a
- the therapy regimen may encompass administration of a drug or supplement; additional diagnostic testing; treatment for chronic infection; referral to a health specialist or a related specialist; making or maintaining lifestyle choices based on said patient- specific cardiodiabetes health report, or combinations thereof.
- the drug may be an anti-inflammatory agent, an anti-inflammatory agent, an anti-inflammatory agent, an anti-inflammatory agent, an anti-inflammatory agent, an anti-inflammatory agent, an anti-inflammatory agent, an anti-inflammatory agent, an anti-inflammatory agent, an anti-inflammatory agent, an anti-inflammatory agent, an anti-inflammatory agent, an anti-inflammatory agent, an anti-inflammatory agent, an anti-inflammatory agent, an anti-inflammatory agent, an anti-inflammatory agent, an anti-inflammatory agent, an anti-inflammatory agent, an anti-inflammatory agent, an anti-inflammatory agent, an anti-inflammatory agent, an anti-inflammatory agent, an anti-inflammatory agent, an anti-inflammatory agent, an anti-inflammatory agent, an anti-inflammatory agent, an anti-inflammatory agent, an anti-inflammatory agent, an anti-inflammatory agent, an anti-inflammatory agent, an anti-inflammatory agent, an anti-inflammatory agent, an anti-inflammatory agent, an anti-inflammatory agent, an anti-inflammatory agent, an anti-inflammatory agent, an anti-inflammatory agent, an anti-inflammatory agent, an anti-inflammatory agent, an anti-inflammatory agent, an anti-inflammatory
- antithrombotic agent an anti-platelet agent, a fibrinolytic agent, a lipid reducing agent, a direct thrombin inhibitor, a glycoprotein Ilb/IIIa receptor inhibitor, an agent that binds to cellular adhesion molecules and inhibits the ability of white blood cells to attach to such molecules, a PCSK9 inhibitor, an MTP inhibitor, mipmercin, a calcium channel blocker, a beta-adrenergic receptor blocker, an angiotensin system inhibitor, a glitazone, a GLP-1 analog,
- thiazolidinedionones biguanides, neglitinides, alpha glucosidase inhibitors, insulin, a dipeptidyl peptidase IV inhibitor, metformin, sulfonurea or peptidyl diabetic drugs.
- Examples of lifestyle choices may include changes in diet and nutrition, changes in exercise, smoking reduction or elimination, or a combination thereof.
- the biological sample may be blood component, saliva or urine.
- the computer processor can be operably coupled to a computer database and may include executed software programs for data interpretation.
- the cardiodiabetes health report may be printed, faxed, or in an electronic format viewable on a personal computer or handheld device.
- the quantitative measurements of the biomarkers can be transformed collectively by a mathematical operation using the processor to generating a cardiodiabetes index score.
- the cardiodiabetes categorical risk level is assigned in conjunction with the generated cardiodiabetes index score by the processor.
- the generated cardiodiabetes index score is compared with a reference value range and is assigned to a cardiodiabetes categorical risk level that includes optimal (low risk), intermediate (elevated risk) or high risk.
- the generated cardiodiabetes index score is further evaluated against one or more clinical endpoint components of cardiodiabetic disease as described hereinabove.
- the patient-specific cardiodiabetes health report may include the generated cardiodiabetes index score and the cardiodiabetes categorical risk level is assigned in conjunction with the generated cardiodiabetes index score by the processor.
- Figure 1 shows an exemplary of a metabolic panel.
- Figure 2 shows an exemplary lipid and lipoprotein test panel.
- Figure 3 shows an exemplary lipoprotein test panel for particle size and particle number measurements.
- Figure 4 shows the OGTT curve for FFA times C-peptide in a 2-hour glucose response (minus Glycomark, MBL Mass).
- Figure 5 shows the OGTT curve for FFA times C-peptide in a 2-hour glucose response (plus Glycomark, MBL Mass).
- Figure 6 shows the OGTT curve for FFA times C-peptide in a 1-hour glucose response (minus Glycomark, MBL Mass).
- Figure 7 shows the OGTT curve for FFA times C-peptide in a 1-hour glucose response (plus Glycomark, MBL Mass).
- Figure 8 shows a Heat map display of absolute value of Pearson's correlation between individual biomarkers and cluster component scores corresponding to Table 2 (7 clusters).
- Figure 9 shows Heat map of absolute value of Pearson's correlation between individual biomarkers and cluster component scores corresponding to Table 7 (13 clusters).
- Figure 10 shows the ROC curve for Model 1.
- Figure 11 shows the ROC curve for Model 2.
- Figure 12 shows the ROC curve for Model 3.
- Figure 13 shows the ROC curve for Model 4.
- Figure 14 shows the ROC curve for Model 5.
- Figure 15 shows the ROC curve for Model 6.
- Figure 16 shows the ROC curve for Model 7.
- Figure 17 shows the ROC curve for Model 8.
- Figure 18 shows the ROC curve for Model 9.
- Figure 19 shows the ROC curve for Model 10
- Figure 20 shows the ROC curve for Model 11
- Figure 21 shows the ROC curve for Model 12
- Figure 22 shows the ROC curve for Model 13.
- Figure 23 shows the ROC curve for Model 14.
- Figure 24 shows the ROC curve for Model 15.
- Figure 25 shows the ROC curve for Model 16.
- Cardiovascular disease is the major cause of death in patients with type 2 diabetes mellitus (T2DM).
- T2DM type 2 diabetes mellitus
- the objective of the invention is to bring together panels of the most predictive and informative diagnostic analytes in 5 different metabolic processes that underpin the development of T2DM and cardiovascular disease in order to facilitate diagnosis, optimize therapy, and lower the patients' cardiovascular risk and risk of developing full T2DM, thus improving outcome.
- the analytes in the method described herein for of cardiodiabetes risk management relate to five unique and inter-related panels of tests with diagnostic and prognostic value for: 1) Total Glycemic Control, 2) Beta Cell Function, 3) Insulin Resistance, 4)
- physiologically related areas give different information that allows clinicians to choose therapies that will be maximally effective for a given patient, monitor the response to the chosen therapy(ies), and reduce the patient's risk of development of cardiovascular diseases and other serious complications of insulin resistance, inflammation, diabetes, and dyslipidemia.
- the simultaneous use of multiple biomarkers with independent classification power will increase the performance of the biomarker panel in characterizing cardiodiabetes.
- Inflammation LpPLA2 fibrinogen, hsCRP, HSP 70, IL-6, TNF-a, SAA variants,
- MPO Myeloperoxidase
- F2- haptoglobin variants secretory isoprostanes phospholipase A2 (sPLA2) ;pregnancy- associated plasma peptide A (PAPP-A), MBL amount, activity, or genetic polymorphisms thereof.
- sPLA2 secretory isoprostanes phospholipase A2
- PAPP-A pregnancy- associated plasma peptide A
- MBL amount, activity, or genetic polymorphisms thereof.
- the value of the measured analyte used in the assessment of cardiodiabetes risk may be the actual measured value, or in some cases a mathematically transformation of the value, embodied by the non-limiting examples of natural logarithms (Ln), ratios of a biomarker to one or more other biomarkers, or quotients.
- Ln natural logarithms
- all protein biomarkers claimed refer to any and all of the variants comprising the "wild type" protein, variants due to SNPs, variants due to differential associations of multiple primary chains into secondary, tertiary, quaternary structures, post-translational modifications, glycosylations, fragments, dimers, trimers, tetramers, and n-mers, etc.
- Glucose when measured in blood should be within a normal range, and if elevated, becomes an indicator of insulin resistance (also known as metabolic syndrome) and forms of diabetes mellitus. Measurement of glucose can usually be done in the fasting state and values below 100 are considered normal. Measurement of glucose can be done once, or serial measurements of glucose and insulin can be taken together in the form of an oral glucose tolerance test (OGTT). In a normal patient, baseline glucose and insulin increase when the patient ingests a bolus of glucose, and repeated measurements show glucose and insulin rise then return to the normal baseline values within an hour or 2 hours after ingestion of the sugar. In insulin resistant patients, blood glucose and/or insulin levels remain elevated for a longer period of time. Measurement of glucose at any given time does not give an indication of long or short- term control of blood glucose and presence of disease and this measurement must be combined with other measured analytes such as those listed hereinbelow to make a definitive diagnosis of insulin resistance and diabetes.
- OGTT oral glucose tolerance test
- Insulin and intact pro-insulin are currently measured to determine the level of pancreatic beta cell function and can be used as markers for insulin resistance, type 2 diabetes, and type 1 diabetes. Very low levels of forms of insulin may indicate that the pancreatic beta cells are not secreting insulin and type 1 diabetes is present. Fasting insulin above the normal baseline value may also indicate that an individual is insulin-resistant or is developing type-2 diabetes mellitus. Insulin is more commonly measured than pro-insulin although both correlate with cardiodiabetes and cardiovascular risk from insulin resistance and diabetes. Both are commonly measured and can be used to track disease progression and therapy effectiveness. Intact insulin is therefore an informative biomarker regarding cardiodiabetic risk when added as an accessory biomarker to the panel of claimed core biomarkers for both the Beta Cell Function panel and the Insulin Resistance Panel.
- T2DM and insulin resistance are products of beta cell dysfunction.
- insulin immunoreactivity refers to all molecules detectable by an insulin antibody, i.e. insulin, proinsulin, and proinsulin-like material.
- Hyperproinsulinemia is more frequent in type 2 diabetes and has been attributed to either a direct ⁇ -cells defect or an indirect effect of cell dysregulation under sustained elevated blood glucose (hyperglycemia).
- C-peptide levels may be elevated as a result of increased ⁇ -cell activity observed in hyperinsulinism of insulin resistance or T2DM, from renal insufficiency, and from obesity.
- C- peptide may be measured in women with PCOS as an approximation of level of insulin resistance; also, C-pep can be used as a proxy measurement for insulin secretion in Type 1 diabetics who are insulin-dependent. Correlation has been found between higher C-peptide levels and increasing hyperlipoproteinemia and hypertension.
- HbAlc or hemoglobin Ale is a glycosylated form of hemoglobin that is elevated in the serum of patients with persistently high blood glucose, such as patients with insulin resistance and type 2 diabetes. HbAlc equilibrates in the serum over 6-12 weeks and, therefore, measurement of this analyte gives only an estimate of the patient's long-term control over blood- glucose levels. HbAlc is commonly measured to track progression of insulin resistance/diabetes and to assess therapy effectiveness.
- 1,5-anhydroglucitol (1,5 AG), an analyte that increases in urine but decreases in blood when blood glucose undergoes excessively high elevations for longer than normal periods of time after patients eat meals. These short term elevations are referred herein as "post-prandial excursions.”
- 1,5 AG is a non-metabolized monosaccharide present in small amounts in most foods.
- 1,5 AG reflects peak glucose levels over 1-2 weeks (short term glucose control). These peaks, not detected by standard HbAlC testing, are associated with the cardiovascular complications of diabetes.
- 1,5 AG levels may assist in monitoring drug efficacy and treatment alterations including diet and exercise regimens in patients with their HbAlC at or near goal.
- 1,5 A-G levels decrease in urine when blood glucose levels rise because glucose competes for the glucose transporters, GLUT2 and GLUT5, in the kidneys.
- glucose and 1,5 AG are pushed into the urine through via GLUT2 and GLUT5 transporters and, therefore, less 1 ,5 AG is retained in the blood, resulting in higher urine 1,5 AG levels.
- glucose and 1,5 AG compete more strongly for the GLUT2 and GLUT5 transporters in kidney than D-mannose (discussed below), D-mannose will be elevated in plasma before 1,5 AG (before glucose excursions reach the renal threshold).
- 1,5 AG can be a useful biomarker for large post-prandial glucose excursions and a clinically relevant biomarker.
- the inclusion of 1 ,5 AG to the Total Glycemic Control Panel, as described herein a novel advantage over traditional glycemic control panels.
- the inclusion of D- mannose to the traditional test panels may further provide earlier information regarding dysregulation of glycemic control than 1,5 AG due to differences in renal uptake of the 2 sugars. This is primarily because 1,5 AG blood levels do not change with a single OTT, and may not change measurably during or after an OGTT, or until several glucose loads have been administered.
- 1 ,5 AG assay for postprandial hyperglycemia is marketed commercially by GlycoMark and developed by Nippon Kayaku, Inc.
- Fructosamine measures amino acids conjugated to sugars and is measurably elevated in hyperglycemic patients. This analyte provides a good approximation of glucose control over the past 10-14 days. It may not be specific to post-prandial glucose excursions, but can be a good indicator of the level of glycemic control in a longer time frame than 1,5 AG and AHB, and a shorter time frame than HbAlc.
- Glycation Gap also known as glycosylation gap
- glycosylation gap is the discordance between
- HbAlc and fructosamine are associated with glycemic control.
- glycated serum proteins or fructosamine, and glycated albumin reflect average glucose levels over a matter of days to weeks and are more sensitive to large glucose fluctuations but these glycated proteins are not specifically clinically measured in assessing cardiodiabetes risk for a variety of reasons.
- the difference between the actual measured HbAlc concentration and the predicted HbAlc from glycated serum protein is called the glycation gap.
- the glycation gap value predicts diabetic co-morbidities more reliably than HbAlc alone.
- D-Mannose is a sugar that is present in human blood and tissues. D-mannose is a hexose-like glucose, but its uptake and metabolism is completely different. Mannose levels in plasma are much less variable than glucose levels, and mannose levels correlate much more closely to the CVs of daily glucose fluctuations than glucose itself. Because mannose transporters are insulin independent, unlike the GLUT4 glucose transporter, mannose levels increase less than glucose levels in response to a meal and don't follow the same kinetic patterns in an OGTT test (Sone et. al., 2003).
- Mannose is one of the sugars that can be transported passively into the pancreas, along with glucose, as the pancreas passively monitors blood glucose for rises that indicate the need to secrete greater amounts of insulin after meals.
- GLUT 2 and GLUT5 transporters are the transporters that normally excrete 1,5 anhydroglucitol (1,5 A-G) and take up excess glucose for urinary excretion during episodes of hyperglycemia. These transporters also take up mannose and fructose, but when mannose and fructose are removed from the circulation by the kidneys (under normal physiological conditions), they are not excreted into the urine like 1,5 A-G and glucose (Yamanouchi, et. al, 1996).
- 1,5 A-G and glucose compete with mannose and fructose for GLUT2 and GLUT5 transporters on the renal tubules, the presence of elevated levels of 1,5 A-G and glucose may competitively inhibit reabsorption of mannose. Therefore the amount of D-mannose in the bloodstream is a valuable addition to the glycemic control panel, as the only other analyte that is non-metabolized and whose measurement depends entirely on kidney elimination is 1,5 AG. .
- plasma mannose levels vary measurably during OGTT and HI, whereas 1,5 AG may not decrease till hours later, or until after administration of several hyperglycemic loads. Therefore, while the analytes are related in terms of ability to show dysregulated glycemic control, their time course and metabolic fates distinguish them from one another such that they each give unique information as part of a panel.
- D-mannose has been shown to be a biomarker of early hepatic insulin resistance. It has been shown a proportion of D-mannose in the blood is derived from the breakdown of liver glycogen (glycogenolysis) (see Taguchi et. al, 2005). Hepatic
- glycogenolysis and gluconeogenesis may be dysregulated in the livers of insulin resistant and diabetic humans and animal models (see Cersosimo et al., 2011), potentially resulting in altered blood mannose levels.
- Another study showed that there was an association between levels of plasma D-mannose and fatty liver in a cohort of non-diabetic subjects with NAFLDNASH (see Kalhan, et. al., 2010).
- Fatty liver is an often silent, asymptomatic early development in the continuum of insulin resistance and diabetes; it is associated with dyslipidemia and increases risk of atherosclerosis, and often occurs in conjunction with elevated free fatty acids.
- Hepatic insulin resistance may result in fatty liver, and may drive the development of peripheral (vascular) insulin resistance and cardiodiabetes. Therefore, the inclusion of mannose in the panel for insulin resistance is a novel approach because mannose, unlike the other biomarkers, can be linked mechanistically to the development of hepatic insulin resistance rather than pancreatic or other organs.
- D-mannose is a unique biomarker for dysregulation of glycemic control, beta cell dysfunction, and insulin resistance, and because it gives information on different physiological pathways that contribute to cardiodiabetes, it confers novelty to the biomarker panel described herein.
- Serum Amylase is a unique biomarker for dysregulation of glycemic control, beta cell dysfunction, and insulin resistance, and because it gives information on different physiological pathways that contribute to cardiodiabetes, it confers novelty to the biomarker panel described herein.
- Serum Amylase is an enzyme produced by the pancreas, and is an analyte that most people associate with pancreatitis and pancreatic cancer.
- low serum amylase is more commonly associated with the pancreatic dysfunction and insulin deficiency in patients with type 1 diabetes and with type 2 diabetes, and with the pathogenesis of insulin resistance in obese animal models.
- low serum amylase has also been associated with increased risk of metabolic abnormalities, metabolic syndrome (MetS), and diabetes, which may be due to the pancreatic exocrine/endocrine relationship; also, serum amylase levels are inversely correlated with most cardiometabolic risk factors, including obesity (Nakajima et al., 201 la).
- serum amylase generally correlates inversely with BMI (Nakajima et al., 201 lb). But low serum amylase has been shown to correlate with decreased baseline plasma insulin levels and insulin secretion, as well as asymptomatic insulin resistance, even after adjustment for BMI (Muneyuki et. al., 2012). Also, the lowest quartile of serum amylase measurements in one study was significantly associated with the increased risk for metabolic syndrome and diabetes even after adjustment for clinical confounders such as estimated glomerular filtration rate (eGFR; Nakajima et al., 2011(a)); however, the decline in serum amylase was independent of smoking status, which is itself a strong predictor of the development of insulin resistance and cardiovascular disease. Accordingly, serum amylase may reflect abnormal glucose metabolism, and impaired insulin action due to either insulin resistance or inadequate insulin secretion.
- eGFR estimated glomerular filtration rate
- serum amylase confers not only a biomarker of beta cell dysfunction that is independent of kidney dysfunction as measured by eGFR, but the association of lowered serum amylase may provide insight into whether the etiology of a patient's metabolic abnormality is due to T1DM or T2DM (insulin resistance).
- T1DM or T2DM insulin resistance
- T1DM pancreatic beta cells
- This triple utility also makes serum amylase useful for the monitoring of therapy of type 1 diabetics, whose diabetes is of autoimmune origin and is known to go into periods of remission in many individuals just as other autoimmune diseases do.
- Type 2 diabetics may develop Type 1 diabetes due to aforementioned autoimmune processes while many adult-onset patients who are presumed to be Type 2 are in fact misdiagnosed type 1 diabetics.
- serum amylase may add unique diagnostic and prognostic utility to the beta cell dysfunction panel and critical information for therapy guidance.
- Anti-GAD autoantibody is the predominant autoantibody to pancreatic islet cells detectable in the plasma of patients who are developing TIDM. TIDM is often thought of as only occurring during childhood; adult-onset diabetes is usually presumed to be T2DM.
- TIDM insulin-deficiency remission
- T2DM pancreatic diabetics
- Standard beta cell dysfunction/glycemic control panels may not identify Type 1 diabetics and distinguish them from T2DM, as most of these diagnostic panels focus on exclusive
- testing for anti-GAD antibody, serum amylase, and the other analytes in the core panel, in addition to some analytes listed in the supplementary panel, provides a novel beta cell dysfunction measurement tool to allow clinicians to diagnose, prognose, monitor, and guide therapy decisions in the context of either TIDM or the T2DM continuum.
- AHB has been experimentally evaluated to be of significance in placing patients on a continuum of glucose tolerance from NGT to full-blown T2DM, and has been correlated with impaired whole-body glucose disposal rate and insulin resistance. It has also been positively correlated with metabolic syndrome and BMI.
- AHB levels in human blood are specifically correlated to an impaired first-phase insulin secretory response, which suggests sub-clinical beta cell dysfunction particularly when measured in individuals with apparently normal glucose tolerance by all other measures.
- Glucagon-like peptide-1 is an incretin derived from the intestinal L cell that secretes it as a gut hormone. GLP-1 has a half-life of less than 2 minutes in the circulation due to rapid degradation by the enzyme dipeptidyl peptidase-4. GLP-1 is a potent antihyperglycemic hormone that induces glucose-dependent stimulation of insulin secretion but suppresses glucagon secretion. When the plasma glucose concentration is in the normal fasting range, GLP-1 does not continue to stimulate insulin release to cause hypoglycemia.
- GLP-1 may restore glucose sensitivity of pancreatic ⁇ -cells, and inhibits pancreatic ⁇ -cell apoptosis, as well as stimulating the proliferation and differentiation of insulin-secreting ⁇ -cells.
- an impaired first-phase insulin secretion response may be seen on an OGTT, and hyperglycemia results.
- GLP-1 is similar to AHB in this effect, in that elevated levels of AHB appear to inhibit secretion of insulin by pancreatic beta cells, and low levels of GLP-1 fail to stimulate a first phase insulin secretion response (and protect beta cells from damage), thus delivering a 1-2 punch on beta-cell related aspects of glycemic control. Insulin Resistance
- Mannose Binding Lectin is the plasma acute phase protein that binds mannose and proteins that have been glycated with mannose, and especially those on bacterial cell walls. MBL activates the complement cascade through the lectin pathway and is important in the innate immune response. MBL deficiency is one of the most frequent
- MBL deficiency is associated with inflammation, infections, development of gestational diabetes (GDM), development of autoimmunity, and is associated with the appearance of early insulin resistance, early atherosclerosis and more progressive forms of atherosclerosis (see Megia, et. al, 2004).
- GDM gestational diabetes
- MBL has been implicated in dyslipidemias and atherosclerosis because it assists in cholesterol efflux from macrophages, which is important in clearing atherosclerotic deposits from vascular walls; therefore insufficient MBL amount or activity can lead to accelerated atherosclerotic processes, especially in the context of cardiodiabetes.
- MBL can bind lipoproteins and enhance the monocyte/macrophage clearance of LDL. MBL is also known to enhance HDL-mediated cholesterol efflux from macrophages (see Fraser and Tenner, 2010).
- MBL deficiency has been correlated with the severity of atherosclerotic disease
- MBL deficiency doubled risk of MI (Vengen, et al, 2012).
- MBL genotypes are known to confer susceptibility to or resistance to atherosclerosis as well as infections, such as C. pneumonia, a gram-negative organism that is known to also initiate atherosclerosis.
- humans with MBL deficiencies tend to have recurring C. pneumonia infections, and other infections, due in part to MBL's role in normal innate immunity (complement cascade initiation).
- C. pneumonia infections and other infections, due in part to MBL's role in normal innate immunity (complement cascade initiation).
- MBL A allele had a reduced frequency of the MBL A allele and an increased frequency of the MBL B, C, and D alleles compared with apparently healthy controls.
- Other studies have found that populations like Inuit Canadians who have remarkably low levels of atherosclerosis and also resistance to C.
- MBL-A alleles have much higher allele frequency of the functional wild-type MBL-A alleles (Hegele et. al., 1999).
- Polymorphisms in the MBL gene promoter may also contribute to the MBL deficiency syndrome (Madsen et al., 1995 and Salimans, et. al, 2004). It is the interplay of these alleles in the MBL gene itself and the promoter region that determines the amount of the protein expressed in the blood and the functionality (activity) of the MBL.
- genotypes Only seven haplotypes (out of a possible 64) are commonly found combining to form 28 genotypes (Garred et al. 2009). In disease association studies, these genotypes are usually grouped into assumed low (YO/Y O and YO/XA), medium (YA/YO and XA/XA) and high (YA/YA and YA/XA) conferring categories (Wallis and Lynch 2007). Most, but not all, individuals with A/A genotypes have serum MBL >600 ng/mL and those with O/O genotypes generally have serum MBL below 200 ng/mL (Swierzko et al. 2009).
- the A/O groups are highly heterogeneous with respect to serum MBL values, despite average values being reported at ⁇ 400 ng/mL and perhaps a majority having concentrations ⁇ 600 ng/mL. (Chalmers et al., 2011)
- MBL deficiency is not a condition that is often screened for.
- One reason that the therapy is not used often is that people are not screened; even if they were to be screened genetically, some studies show that heterozygotes with defective genes are symptomatic, and others show that homozygotes only are symptomatic and affected. Further confounding the picture is that people with genotypes who "should" have MBL deficiency have normal levels of the protein in their plasma and do not have symptoms of the disease.
- there is no company that has adopted a complete screening approach wherein patients are screened for genotype in MBL gene, its promoter region, absolute amount of MBL present in serum, and the biological activity level of the MBL protein (Kuipers et. al., 2002).
- MBL deficiency e.g., intravenous enzyme replacement therapies
- Enzon Pharmaceutical has developed rhMBL and it has been used clinically for treatment of a number of different conditions related to MBL deficiency (Peterson 2006).
- Adiponectin Adiponectin
- Adiponectin is an adipocyte-specific protein that inhibits smooth muscle cell proliferation and adhesion of monocytes to endothelial cells and can thereby inhibit
- arteriosclerosis In addition, it promotes lipid metabolism, enhances insulin sensitivity, and plays a key role in the pathogenesis of the metabolic syndrome.
- Leptin is an adipocyte-derived protein hormone that modulates the central nervous system to alter appetite and energy utilization, as well as regulating many other physiological functions. These affects occur by its action on neuroreceptors in the brain. Leptin circulates at concentrations proportional to the amount of body fat. It increases with insulin resistance, and has an association with obesity-related cardiovascular disease. Elevations of leptin appear to cause hunger signals, which result in overeating. Consumption of fish (and fish oils), as well as caloric restriction, have been shown to favorably reduce leptin. Insulin resistance leads to leptin resistance and a reversal of the former can have a positive impact on leptin levels.
- AHB is a metabolite that has been correlated in the literature to impaired glucose disposal, the metabolic syndrome, and peripheral insulin resistance as measured by the clamp technique. It is used clinically together with L-GPC and OA to classify patients according to their glucose tolerance, i.e. NGT, IGT, etc. Levels of AHB increase with development of insulin resistance and diabetes. It has not previously been shown in humans to specifically predict elevated glucose during any timepoint during an OGTT in isolation at baseline in a subject in whom all baseline measurements classify the subject as NGT.
- Linoleoyl GPC is a metabolite that has been correlated in the literature to impaired glucose disposal, the metabolic syndrome, and peripheral insulin resistance as measured by the clamp technique. It is used clinically together with AHB and OA to classify patients according to their glucose tolerance, i.e. NGT, IGT, etc. The level of linoleoyl GPC decreases with development of insulin resistance and diabetes but the mechanism is not understood.
- Oleic acid is a free fatty acid that makes up 80% of the free fatty acid pool in the blood. Levels may vary significantly in the blood of patients at various stages of T2DM development in insulin resistant patients, and OA increases with the progression of T2DM.
- Insulin resistance (IR) Score is derived from the alpha (a) hydroxybutyrate (AHB), linoleoyl glycerolphosphocholine (GPC), and oleic acid in addition to mathematical weighting with factors like insulin level. These biomarkers together form the QuantoseTM IR diagnostic test developed by Metabolon, Inc. for measuring insulin resistance to detect prediabetes earlier and with greater sensitivity than traditional glycemic markers such as glucose and hemoglobin Ale. See U.S. Patent No. 8,187,830 and U.S. Patent Application Publication Nos. 2012/0208215 Al and 2012/0122981 Al .
- High sensitivity C-reactive protein is a nonspecific inflammatory marker produced by the liver in response to inflammatory cytokines and macrophages.
- CRP may be elevated due to infection, autoimmune disease, or other inflammatory stimulus.
- CRP is a strong and independent risk marker for primary and secondary coronary heart disease (CHD) events, sudden death, stroke and peripheral vascular disease. Elevation of hsCRP is also associated with insulin resistance and metabolic syndrome. When CRP is elevated on repeated measurements, an acute cause is less likely and systemic inflammation such as that associated with
- CRP chronic respiratory disease 2019
- CRP chronic respiratory disease 2019
- a diet rich in plant sterols, soy protein, viscous fiber, and almonds has been shown to have CRP-lowering effects comparable to that of lovastatin 20 mg/day.
- Medications that may lower CRP include statins, fibrates, and fish oil. Reducing global CHD risk by aggressive treatment of the traditional risk factors by established therapies may also be beneficial.
- MPO Myeloperoxidase
- MPO Myeloperoxidase
- MACE major adverse cardiovascular events
- markedly elevated values are associated with increased risk for MACE in the ensuing 6 months.
- MPO is on the outside of the vessel wall and is a leukocyte-derived enzyme that catalyzes the formation of oxidants and results in the formation of oxidized LDL, which is atherogenic.
- Lipoprotein-associated phospholipase A 2 (Lp-PLA 2 )
- Lipoprotein-associated phospholipase A 2 (Lp-PLA 2 ) is an inflammatory risk marker that, unlike hs-CRP, is not an acute phase reactant.
- LpPLA 2 is an enzyme responsible for the hydrolysis of oxidized phospholipid on LDL. It is a specific marker for vascular endothelial growth factor (IL-12).
- Lp-PLA 2 is produced by macrophages and circulates in association with LDL particles. Inside the vessel wall, Lp-PLA 2 , reacting with oxidized LDL, specifically cleaves oxidized phospholipids to produce bioactive intermediates (lysophosphatidylcholine and oxidized free fatty acids) that up regulate inflammation. Lp-PLA 2 is indicative of vulnerable plaque. Thus, when both MPO and Lp-PLA 2 are elevated, it creates a condition where oxidized phospholipids are formed, which can subsequently be cleaved to bioactive products that up regulate and maintain the inflammatory pathway.
- Elevated levels of Lp-PLA 2 indicate a 2 fold increase risk for C VD events and ischemic stroke.
- High plasma Lp-PLA 2 is associated with increased risk for cardiovascular disease and events (myocardial infarction and stroke). Increased values have also been associated with endothelial dysfunction and peripheral arterial disease.
- Lp-PLA 2 is the only test that is FDA-approved to assess risk for stroke. Patients in the upper tertile for both CRP and Lp- PLA 2 are at highest risk. In the Atherosclerosis risks in communities (ARIC) study, patients with both CRP and Lp-PLA 2 in the upper tertile of the population had 5 times increased risk for myocardial infarction and 11 times increased risk for stroke. Statins, fibric acids, and niacin have been shown to have Lp-PLA 2 lowering effects.
- Fibrinogen is an acute phase soluble plasma glycoprotein that is synthesized primarily in the liver and converted by thrombin into fibrin during the blood coagulation process. Normal fibrinogen levels in blood are between 1.5 and 3.5 g/litre but can increase three-fold during acute phase stimulation (see Gordon et al, 1985), particularly in response to increased IL- 6 production (Gabay et al., 1999, Mackiewicz et al., 1991). Fibrinogen increases in the context of inflammatory processes such as those leading to adverse cardiovascular events, e.g, MI and strokes.
- Increased fibrinogen may also be suggestive of acute infection /inflammation or other chronic inflammatory disease, which should be appropriately investigated; however, it is also associated with the onset of insulin resistance and T2DM.
- Data from prospective studies indicates that increased concentration of CRP or fibrinogen is associated with an increased risk for the development of ischemic cardiovascular events. Fibrinogen levels are reduced by smoking cessation,, alcohol, and estrogens, but especially strongly by exercise. The fibrates have significant fibrinogen-lowering effects but, at the present time, it is unknown whether reduction of fibrinogen levels will alter clinical outcomes.
- fibrinogen includes the parent protein, as well as its derivatives and degradation products, such as D-dimer and fibrinogen degradation products (FDP).
- FDP fibrinogen degradation products
- fibrinogen as an inflammatory marker in a multimarker panel for cardiodiabetes risk management confers novelty because fibrinogen levels are so strongly influenced by exercise, and sedentary lifestyle is itself a risk factor for cardiodiabetes.
- fibrinogen is particularly useful in a panel when repeat measurements are taken to assess patient compliance with a prescribed exercise regimen and/or to assess the need to administer fibrates.
- dyslipidemia is associated with the development of the metabolic syndrome and T2DM, and despite multiple studies correlating this dyslipidemia to risk of cardiovascular disease in individuals with metabolic syndrome and diabetes, many thought leaders fail to measure or understand the contribution of dyslipidemia to cardiodiabetes disease development and progression.
- R.A. DeFronzo discussed how elevated free fatty acid levels impaired insulin secretion; however, there is no discussion of blood lipids and lipoproteins.
- the importance of dyslipidemia (beyond the customary LDL-c and HDL-c numbers as risk factors for cardiovascular disease) seems to have been largely ignored by many thought leaders in the field of diabetes research.
- lipid and lipoprotein-related biomarkers for the sub-panel and super panel are based on their individual and composite predictive value (far beyond LDL-c and HDL-c) in determining risk of development of cardiodiabetes, as well as for their use in selection of appropriate therapy and monitoring.
- LDL-C LDL particle numbers
- HDL-c correlates very poorly to cardiovascular risk
- HDL-p number and size correlate much better.
- small, dense HDL HDL3 or sdHDL
- sdHDL small, dense HDL
- the lack of sdHDL and its associated anti-oxidative anti-inflammatory activity in metabolic syndrome and diabetes is related to the development of atherogenic dyslipidemia, and is linked to the constellation of risk factors including hypertriglyceridemia, hyperglycemia, hyperinsulinemia, insulin resistance, and increased atherogenic ApoB with decreased anti-athero genie HDL (Kontush, A. et al, 2006).
- lipids and lipoproteins not previously related specifically to cardiodiabetic risk, and it is believed that these have never been run together in a panel for the purpose of diagnosing, monitoring, and prognosing cardiodiabetes risk, particularly in combination with the other unique biomarkers in other panels.
- FFAs Free Fatty Acids
- Free Fatty Acids are indicative of dyslipidemia when they are elevated, and are known to cause insulin resistance in adipose tissue and muscle tissue.
- An elevated total FFA alone does not imply risk of cardiodiabetes or poor glycemic control; however, when measured in the context of other biomarkers comprising abnormal glycemic control, beta cell dysfunction, insulin resistance, and/or inflammation, the elevated FFAs can then be interpreted together with the other biomarkers to categorize cardiodiabetes risk, either by classification of cardiodiabetes risk by categorical risk level (low/optimal, intermediate, high), or by the incorporation of FFA into a risk score.
- Triglycerides Triglycerides
- Triglycerides are a type of lipid that enable transference of adipose fat and blood glucose from the liver to the bloodstream; they are exported by the liver particularly in the case of diets high in carbohydrate and when blood glucose is high such as in the case of patients with impaired glucose tolerance and diabetes. It is thought that triglycerides may be related to hepatic insulin resistance (for instance, in NAFLD and NASH that occur at very high frequency in diabetics and people with metabolic syndrome). High levels of triglycerides in the bloodstream have been linked to atherosclerosis and, and increased risk of heart disease and stroke.
- Apolipoprotein B-48 Apolipoprotein B-48
- Remnants RLP and RLP-c
- ApoB-48 is one of the 2 main isoforms of Apolipoprotein B. ApoB48 is synthesized exclusively by the small intestine, while ApoB-100 (aka ApoB) is synthesized by the liver. ApoB-48 shares 48% of ApoBlOO's sequence, except for the C-terminal LDL receptor binding region. Therefore ApoB-48 does not bind to LDL receptor and it has a different physiological role than ApoB.
- ApoB-48 protein is unique protein to chylomicrons from the small intestine; after most of the lipids in a chylomicron have been absorbed, ApoB-48 in the bloodstream returns to the liver as part of the chylomicron remnant (RLP), where it is endocytosed and degraded independent of the LDL receptor. It is not surprising then, that ApoB-48 and RLP-c clustered together in cluster 5 of the 11 -cluster analysis discussed herein. Therefore, the ApoB-48 lipoprotein is unique in its origin because it is the only lipoprotein produced by the gut (which also produces the incretin hormones such as GLP-1 and GIP).
- Remnant-Like Lipoprotein Particles and their associated cholesterol measures (RLP-c) are plasma lipoproteins that contribute to atherosclerosis.
- RLPs are generated from the breakdown of very low density lipoprotein (VLDL), intermediate density lipoprotein (IDL) or low density lipoprotein (LDL), are rich in triglycerides, and are highly atherogenic. These particles have similar atherogenic and inflammatory properties to oxidized LDL (ox- LDL). It has been suggested that especially in patients with metabolic syndrome, reducing plasma RLPs by therapy for hyperlipidemia may prevent endothelial dysfunction and the development of atherosclerosis (Nakajima et al., 2006).
- RLPs or RLPc assays or measurements are unavailable for diagnosis, prognosis, treatment guidance, or therapy monitoring for cardiodiabetes in the context of the other sub- panels described herein.
- the measurement of RLPs and RLP-c in conjunction with these other biomarkers and biomarker panels may offer additional advantage over traditional assays and are clinically actionable in assessing risk of cardiodiabetes, presence of cardiodiabetes, and in the selection of therapy, and monitoring of the condition.
- Linoleoyl-Glycerophosphocholine L-GPC
- L-GPC is a lipid, a glycerophosphocholine conjugate that has been correlated in the literature to impaired glucose disposal, the metabolic syndrome, and peripheral insulin resistance as measured by the clamp technique. It is used clinically together with AHB and OA to classify patients according to their glucose tolerance, i.e. NGT, IGT, etc. The level of linoleoyl GPC decreases with development of insulin resistance and diabetes but the mechanism is not understood. L-GPC is known to enhance insulin secretion in vitro by a beta cell line when added to culture media.
- LP-IR score is a measure of insulin resistance derived from measurements of lipoprotein particle sizes and numbers. It is a measure of insulin resistance, therefore, that is based purely on dyslipidemic factors and no others.
- a patient may have an LP-IR score that indicates that they are insulin resistant, while all biomarkers of glycemic control, beta dysfunction and other IR markers are normal; the converse may also be true. Therefore, the LP- IR score and its components give information on only one dimension of cardiodiabetes risk. Combining this score or its component values with additional biomarkers drawn from the claimed groups is more sensitive and specific for measuring cardiodiabetes risk.
- cardiobetes is defined as any condition related to the development and initiation of the diabetic disease process or cardiovascular disease, or complications arising therefrom, including but not limited to the following: insulin resistance, metabolic syndrome, type 2 diabetes mellitus (T2DM), type 1 diabetes mellitus (T1DM), fatty liver, diabetic nephropathy, diabetic neuropathy, vasculitis, atherosclerosis, coronary artery disease (CAD), vulnerable plaque formation, myocardial infarction (MI), cardiomyopathy, endothelial dysfunction, hypertension, occlusive stroke, ischemic stroke, transient ischemic event (TIA), deep vein thrombosis (DVT), dyslipidemia, gestational diabetes (GDM), periodontal disease, obesity, morbid obesity, chronic and acute infections, pre-term labor, diabetic retinopathy, and systemic or organ-specific inflammation.
- T2DM type 2 diabetes mellitus
- T1DM type 1 diabetes mellitus
- fatty liver diabetic nephropathy, diabetic neuro
- cardiovascular disease cardiovascular disease
- diabetes cardiovascular disease
- diabetes cardiovascular disease
- diabetes cardiovascular disease
- the term “metabolic syndrome” may also be used herein to refer to this condition.
- a cardiodiabetic subject might not exhibit one or more of the normal symptoms of diabetes including, but not limited to, hyperglycemia, fatigue, unexplained weight loss, excessive thirst, excessive urination, excessive eating, poor wound healing, infections, altered mental status and blurry vision.
- a cardiodiabetic subject is at high risk for cardiovascular disease
- diabetes mellitus cardiovascular diseases, and cardiodiabetes are the phenotypes that result from abnormalities in specific contributory pathophysiological mechanisms. The more metabolic pathways leading to development of cardiodiabetic conditions are affected, the greater the health risk of the individual.
- Diabetic dyslipidemia or "Type II diabetes with dyslipidemia” means a condition characterized by Type II diabetes, reduced HDL, elevated serum triglycerides, and elevated small, dense LDL particles.
- hyperglycemia refers to elevated blood glucose levels in the body, which results from metabolic defects in production and utilization of glucose.
- a subject is identified as hyperglycemic if the subject has a fasting blood glucose level that consistently exceeds 126 mg/dl.
- hypoglycemia is a lower than normal blood glucose
- hypoglycemia blood glucose concentration below 63 mg/dL or causing patient symptoms such as hypotonia, flush and weakness that are recognized symptoms of hypoglycemia and that disappear with appropriate caloric intake.
- Severe hypoglycemia is defined as a hypoglycemic episode that required glucagon injections, glucose infusions, or help by another party.
- diabetes condition refers to a condition characterized by impaired glucose production and/or utilization and includes diabetes mellitus (e.g., type 1 diabetes mellitus (T1DM), type 2 diabetes mellitus (T2DM), and gestational diabetes), pre-diabetes, metabolic syndrome, hyperglycemia, impaired glucose tolerance, impaired fasting glucose, cardiodiabetes, latent autoimmune diabetes of adults (LAD A) and atypical forms of Type I diabetes such as insulin autoimmune syndrome (IAS).
- T1DM type 1 diabetes mellitus
- T2DM type 2 diabetes mellitus
- gestational diabetes pre-diabetes
- metabolic syndrome e.g., type 1 diabetes mellitus (T1DM), type 2 diabetes mellitus (T2DM), and gestational diabetes
- pre-diabetes e.g., type 1 diabetes mellitus (T1DM), type 2 diabetes mellitus (T2DM), and gestational diabetes
- pre-diabetes
- cardiovascular diseases refer to the class of diseases that involve the heart, blood vessels (arteries and veins) or the circulation.
- cardiovascular diseases include, but are not limited to, hypertension, aneurysm, angina, arrhythmia, coronary heart disease, heart failure, congestive heart failure, atherosclerosis, arteriosclerosis, dyslipidemia, hyperlipidemia, hypercholesterolemia, stroke, cerebrovascular disease, myocardial infarction and peripheral vascular disease.
- Dyslipidemia refers to a disorder of lipid and/or lipoprotein metabolism, including lipid and/or lipoprotein overproduction or deficiency. Dyslipidemias may be manifested by elevation of the triglyceride concentrations, and a decrease in the "good" high- density lipoprotein (HDL) cholesterol concentration in the blood.
- HDL high- density lipoprotein
- Diabetic dyslipidemia or “Type II diabetes with dyslipidemia” refers to a condition characterized by Type II diabetes mellitus, reduced HDL-C, elevated serum
- HDL-cholesterol triglycerides
- triglyceride For adults with diabetes, it has been recommended that the levels HDL-cholesterol, and triglyceride be measured every year. Optimal HDL-cholesterol levels are equal to or greater than 40 mg/dL (1.02 mmol/L), and desirable triglyceride levels are less than 150 mg/dL (1.7 mmol/L).
- Mated dyslipidemia means a condition characterized by elevated serum cholesterol and elevated serum triglycerides.
- Elevated total cholesterol means total cholesterol at a concentration in an individual at which lipid-lowering therapy is recommended, and includes, without limitation, “elevated LDL-C”, “elevated VLDL-C,” “elevated IDL-C” and “elevated non-HDL-C.”
- Total cholesterol concentrations of less than 200 mg/dL, 200-239 mg/dL, and greater than 240 mg/dL are considered desirable, borderline high, and high, respectively.
- LDL-C concentrations of 100 mg/dL, 100-129 mg/dL, 130-159 mg/dL, 160-189 mg/dL, and greater than 190 mg/dL are considered optimal, near optimal/above optimal, borderline high, high, and very high, respectively.
- Elevated lipoprotein means a concentration of lipoprotein in a subject at which lipid-lowering therapy is recommended.
- Elevated triglyceride means a concentration of triglyceride in the serum or liver at which lipid-lowering therapy is recommended, and includes “elevated serum triglyceride” and “elevated liver triglyceride.” n certain embodiments, triglyceride concentration of 150-199 mg/dL, 200-499 mg/dL, and greater than or equal to 500 mg/dL is considered borderline high, high, and very high, respectively.
- High density lipoprotein-C means cholesterol associated with high density lipoprotein particles. Concentration of HDL-C in serum (or plasma) is typically quantified in mg/dL or nmol/L.
- serum HDL-C and “plasma HDL-C” mean HDL-C in the serum and plasma, respectively.
- HDL may be divided into subclasses by the size of the particles; HDL-2 is the larger subclass of HDL particles, generally thought to be protective against cardiodiabetic disease.
- HDL-3 is the subclass of small HDL particles, thought to be less beneficial.
- HDL-1 refers to all of the subtypes of HDL particles. Cholesterol may be measured for each size subclass of particles.
- Heypercholesterolemia means a condition characterized by elevated cholesterol or circulating (plasma) cholesterol, LDL-cholesterol and VLDL-cholesterol, as per the guidelines of the Expert Panel Report of the National Cholesterol Educational Program (NCEP) of
- LDL low-density lipoprotein
- Heyperlipidemia or "hyperlipemia” is a condition characterized by elevated serum lipids or circulating (plasma) lipids. This condition manifests an abnormally high concentration of fats.
- the lipid fractions in the circulating blood are cholesterol, low density lipoproteins, very low density lipoproteins and triglycerides.
- Hypertriglyceridemia means a condition characterized by elevated triglyceride levels.
- subject includes, without limitation, mammals, such as humans or non-human animals.
- Non-human animals may include non-human primates, farm animals, sports animals, rodents or pets.
- a typical subject is human and may be referred to as a patient.
- Mammals other than humans can be advantageously used as subjects that represent animal models of the cardiovascular disease or for veterinarian applications.
- a "biological sample” encompasses a variety of sample types obtained from a subject with a biological origin. Typically used here is a biological fluid sample including, but not limited to, blood, cerebral spinal fluid (CSF), interstitial fluid, urine, sputum, saliva, mucous, stool, lymphatic, or any other secretion, excretion, or and other bodily liquid samples.
- CSF cerebral spinal fluid
- interstitial fluid urine, sputum, saliva, mucous, stool, lymphatic, or any other secretion, excretion, or and other bodily liquid samples.
- Exemplary biological fluid sample can be a blood component such as plasma, serum, red blood cells, whole blood, platelets, white blood cells, or components or mixtures thereof.
- biomarkers from a subject can be measured, detected and analyzed using various assays, methods and detection systems known to one of skill in the art.
- Methods to measure or detect levels of biomarkers include, but are not limited to, mass spectrometry (MS), gas chromatography (GC), liquid chromatography (LC), matrix-assisted laser desorption ionization-time of flight (MALDI-TOF), ion spray spectroscopy, ultra-violet spectroscopy (UV- vis), fluorescence analysis, radiochemical analysis, near-infrared spectroscopy (near-IR), infrared (IR) spectroscopy, nuclear magnetic resonance spectroscopy (NMR), light scattering analysis (LS), and combinations thereof.
- MS mass spectrometry
- GC gas chromatography
- LC liquid chromatography
- MALDI-TOF matrix-assisted laser desorption ionization-time of flight
- UV- vis ultra-violet spectroscopy
- fluorescence analysis radiochemical analysis
- radiochemical analysis radiochemical analysis
- near-IR near-infrared spectroscopy
- IR infrared
- NMR nuclear
- the term “measure” refers to a quantitative or qualitative determination of the amount or concentration of a molecule or a substance.
- level refers to a quantitative or qualitative determination of the amount or concentration of a molecule or a substance.
- concentration can refer to an absolute or relative quantity.
- the level of each biomarker can be compared to a reference level of the corresponding biomarker, and the difference, if any, in the measured level of the biomarker in the subject compared to the reference level is then identified. This difference is used to determine the risk value or risk category as described herein
- a “reference value” or “reference level” can be an absolute value; a relative value; a value that has an upper and/or lower limit; a range of values; an average value; a median value, a mean value, or a value as compared to a particular control or baseline value.
- a reference value can be based on an individual sample value, such as for example, a value obtained from a sample from the subject being tested, but at an earlier point in time. The reference value can be based on a large number of samples, such as from population of healthy subjects, or based on a pool of samples including or excluding the sample to be tested.
- the test results of each biomarker of a biomarker panel can be associated with a set of categorical risk level, for example, cardiodiabetes categorical risk level, cardiovascular categorical risk level or diabetes categorical risk level.
- categorical risk level e.g., categorical risk level of optimal (low risk), intermediate (elevated risk) or high risk
- the practitioner can classify the condition or disease state of a patient and recommend a therapy regimen to facilitate diagnosis, optimize therapy and lower the patient's cardiodiabetes risk.
- a particular set categorical risk level for example, cardiodiabetes categorical risk level
- the risk categories and the boundaries dividing them for any biomarker are not limited to those disclosed herein and can be found in the art.
- the therapy regimen chosen by a physician, practitioner or health provider can depend on the patient-specific cardiodiabetes health report.
- the patient-specific cardiodiabetes health report includes a cardiodiabetes categorical risk level for assessing the cardiodiabetic health significance of the test results of each of the biomarker test or a plurality of biomarker tests from each of the biomarker panel.
- the therapy regimen may depend on which category from a range of categories particular to each biomarker the measured concentration or levels of each biomarker falls in. In various exemplary embodiments, the therapy regimen may depend on the combination of risk levels for different symptoms or diseases that are indicated by a biomarker panel.
- the quantity or activity measurements of each of the biomarker test for each biomarker panel of the subject can be compared to a reference value. Differences in the measurements of biomarkers in the subject sample compared to the reference value are then identified and a categorical risk value is assigned.
- methods according to the invention may also involve administering the selected therapy regimen to the subject to reduce the risk of a diabetes disorder or cardiovascular disease or any complications thereof.
- Yet another aspect of the invention relates to a method of prognosing, diagnosing, and/or predicting risk of diabetes and cardiovascular disease in a subject. This method is based on the results of determining the categorical risk level of Glycemic Control, Beta Cell
- a reference index value range that defines risk categories may be one according to recognized standards for diagnostic cutoffs and risk calculation.
- Therapeutic intervention may be triggered or selected based on at least one, at least two, at least three, at least four, or at least five members of the 5 specified biomarker panel tests that display data for measured analytes or calculated scores falling within an intermediate and/or a high risk category range, as described above.
- the reference index value range that defines risk categories may be one according to recognized standards for diagnostic cutoffs and risk calculation.
- the method also involves selecting a therapy regimen based on the results of determining the risk level of Glycemic Control, Beta Cell Dysfunction, Insulin
- cardiodiabetes e.g. diabetes and cardiovascular disease or disorders or complications thereof.
- a therapy regimen includes, for example, drugs or supplements.
- the drug or supplement may be any suitable drug or supplement useful for the treatment or prevention of diabetes and related cardiovascular disease or disorders or complications thereof.
- suitable agents may include an anti-inflammatory agent, an antithrombotic agent, an anti-platelet agent, a fibrinolytic agent, a lipid reducing agent, a direct thrombin inhibitor, a glycoprotein Ilb/IIIa receptor inhibitor, an agent that binds to cellular adhesion molecules and inhibits the ability of white blood cells to attach to such molecules, a PCSK9 inhibitor, an MTP inhibitor, mipmercin, a calcium channel blocker, a beta-adrenergic receptor blocker, an angiotensin system inhibitor, a glitazone, a GLP-1 analog, thiazolidinedionones, biguanides, neglitinides, alpha glucosidase inhibitors, insulin, a dipeptidyl peptidase IV inhibitor, metformin, a sulf
- a therapy regimen may also include treatment for chronic infections such as urinary tract infections (UTIs), reproductive tract infections, and periodontal disease.
- Therapies may include appropriate antibiotics and/or other drugs, and surgical procedures and/or dentifrice for the treatment of periodontal disease.
- a therapy regimen may include referral to a healthcare specialist or related specialist based on the determining of risk levels.
- the determining may cause referral to a cardiologist, endocrinologist, ophthalmologist, lipidologist, weight loss specialist, registered dietician, health coach, personal trainer, etc. Further therapeutic intervention by specialists based on the determining may take the form of cardiac catherization, stents, imaging, coronary bypass surgeries, EKG, Doppler, hormone testing and adjustments, weight loss regimens, changes in exercise routine, diet, and other personal lifestyle habits.
- Anti-inflammatory agents may include but are not limited to, Aldlofenac;
- Aldlometasone Dipropionate Algestone Acetonide; Alpha Amylase; Amcinafal; Amcinafide; Amfenac Sodium; Amiprilose Hydrochloride; Anakinra; Anirolac; Anitrazafen; Apazone;
- Fendosal Fenpipalone; Fentiazac; Flazalone; Fluazacort; Flufenamic Acid; Flumizole;
- Flunisolide Acetate Flunixin; Flunixin Meglumine; Fluocortin Butyl; Fluorometholone Acetate; Fluquazone; Flurbiprofen; Fluretofen; Fluticasone Propionate; Furaprofen; Furobufen;
- Anti-thrombotic and/or fibrinolytic agents may include but are not limited to,
- Plasminogen to plasmin via interactions of prekallikrein, kininogens, Factors XII, XHIa, plasminogen proactivator, and tissue plasminogen activator[TPA]), Streptokinase; Urokinase: Anisoylated Plasminogen-Streptokinase Activator Complex; Pro-Urokinase; (Pro-UK); rTPA (alteplase or activase; r denotes recombinant); rPro-UK; Abbokinase; Eminase; Sreptase Anagrelide Hydrochloride; Bivalirudin; Dalteparin Sodium; Danaparoid Sodium; Dazoxiben Hydrochloride; Efegatran Sulfate; Enoxaparin Sodium; Ifetroban; Ifetroban Sodium; Tinzaparin Sodium; retaplase; Trifenagrel; Warfarin; Dextrans
- Anti-platelet agents may include but are not limited to, Clopridogrel;
- Antiserotonin drugs Caffeine; Theophyllin Pentoxifyllin; Ticlopidine; and Anagrelide.
- Lipid-reducing agents include but are not limited to, gemfibrozil, cholystyramine, colestipol, nicotinic acid, probucol lovastatin, fluvastatin, simvastatin, atorvastatin, pravastatin, cerivastatin, and other HMG-CoA reductase inhibitors.
- Direct thrombin inhibitors may include, but are not limited to, hirudin, hirugen, hirulog, agatroban, PPACK, and thrombin aptamers.
- Glycoprotein Ilb/IIIa receptor inhibitors are both antibodies and non-antibodies, and may include, but are not limited to, ReoPro (abcixamab), lamifiban, and tirofiban.
- Calcium channel blockers are a chemically diverse class of compounds having important therapeutic value in the control of a variety of diseases including several
- Calcium channel blockers are a heterogenous group of drugs that prevent or slow the entry of calcium into cells by regulating cellular calcium channels (see REMINGTON, THE SCIENCE AND
- calcium channel blockers may include, but are not limited to, anrinone, amlodipine, bencyclane, felodipine, fendiline, flunarizine, isradipine, nicardipine, nimodipine, perhexilene, gallopamil, tiapamil and tiapamil analogues (such as 1993RO-11-2933), phenytoin, barbiturates, and the peptides dynorphin, omega-conotoxin, and omega-agatoxin, and the like and/or pharmaceutically acceptable salts thereof.
- anrinone amlodipine, bencyclane, felodipine, fendiline, flunarizine, isradipine, nicardipine, nimodipine, perhexilene, gallopamil, tiapamil and tiapamil analogues (such as 1993RO-11-2933), phenytoin,
- Beta-adrenergic receptor blocking agents are a class of drugs that antagonize the cardiovascular effects of catecholamines in angina pectoris, hypertension, and cardiac arrhythmias.
- Beta-adrenergic receptor blockers may include, but are not limited to, atenolol, acebutolol, alprenolol, beftunolol, betaxolol, bunitrolol, carteolol, celiprolol, hedroxalol, indenolol, labetalol, levobunolol, mepindolol, methypranol, metindol, metoprolol,
- metrizoranolol oxprenolol, pindolol, propranolol, practolol, practolol, sotalolnadolol, tiprenolol, tomalolol, timolol, bupranolol, penbutolol, trimepranol, 2-(3-(l,l-dimethylethyl)-amino-2- hydroxypropoxy)-3-pyridenecarbonitrilHCl, l-butylamino-3-(2,5-dichlorophenoxy- )-2- propanol, 1 -isopropylamino-3-(4-(2-cyclopropylmethoxyethyl)phenoxy)-2-propanol, 3- isopropylamino- 1 -(7-methylindan-4-yloxy)-2-butanol, 2-(3-t-butylamino-2
- An angiotensin system inhibitor is an agent that interferes with the function, synthesis or catabolism of angiotensin II.
- agents are well known to those of ordinary skill in the art and may include but are not limited to, angiotensin-converting enzyme ("ACE") inhibitors, angiotensin II antagonists, angiotensin II receptor antagonists, agents that activate the catabolism of angiotensin II, and agents that prevent the synthesis of angiotensin I from which angiotensin II is ultimately derived.
- ACE angiotensin-converting enzyme
- the renin-angiotensin system is involved in the regulation of hemodynamics and water and electrolyte balance. Factors that lower blood volume, renal perfusion pressure, or the concentration of Na+ in plasma tend to activate the system, while factors that increase these parameters tend to suppress its function.
- Angiotensin (renin-angiotensin) system inhibitors are compounds that act to interfere with the production of angiotensin II from angiotensinogen or angiotensin I or interfere with the activity of angiotensin II.
- Such inhibitors are well known to those of ordinary skill in the art and, may include but are not limited to, compounds that act to inhibit the enzymes involved in the ultimate production of angiotensin II, including renin and ACE. They also include compounds that interfere with the activity of angiotensin II, once produced.
- classes of such compounds may include antibodies (e.g., to renin), amino acids and analogs thereof (including those conjugated to larger molecules), peptides (including peptide analogs of angiotensin and angiotensin I), pro-renin related analogs, etc.
- renin-angiotensin system inhibitors may include but are not limited to, renin inhibitors, ACE inhibitors, and angiotensin II antagonists, which are well known to those of ordinary skill in the art.
- Examples of drugs that act to interfere with PSK9's interaction with LDL receptors may include but are not limited to, Aln-PCS (Alnylam); REG 727 (Regeneron); and AMG-145 (Amgen).
- the drugs and/or supplements can be administered via any standard route of administration known in the art, including, but not limited to, parenteral (e.g., intravenous, intraarterial, intramuscular, subcutaneous injection, intrathecal), oral (e.g., dietary), topical, transmucosal, or by inhalation (e.g., intrabronchial, intranasal or oral inhalation, intranasal drops).
- parenteral e.g., intravenous, intraarterial, intramuscular, subcutaneous injection, intrathecal
- oral e.g., dietary
- topical e.g., transmucosal
- inhalation e.g., intrabronchial, intranasal or oral inhalation, intranasal drops
- oral administration is the preferred mode of administration.
- a therapy regimen may also include giving recommendations on making or maintaining lifestyle choices useful for the treatment or prevention of diabetes and
- cardiovascular disease based on the results of determining the amounts of analytes and calculated scores and their associated risk levels in the subject.
- the lifestyle choices can involve changes in diet, changes in exercise, reducing or eliminating smoking, or a combination thereof.
- the therapy regimen may include but are not limited to, glucose control, lipid metabolism control, weight loss control, and smoking cessation.
- the lifestyle choice is one that will affect risk for developing or having a cardiovascular disease or disorder (see Haskell et al., "Effects of Intensive Multiple Risk Factor Reduction on Coronary Atherosclerosis and Clinical Cardiac Events in Men and Women with Coronary Artery Disease,” Circulation 89(3):975-990 (1994); Ornish et al, "Intensive Lifestyle Changes for Reversal of Coronary Heart Disease,” JAMA 220(23): 2001-2007 (1998); and Wister et al, "One-year Follow-up of a Therapeutic Lifestyle Intervention Targeting Cardiovascular Disease Risk," CMAJ 177(8):859-865 (2007), which are hereby incorporated by reference in their entirety).
- Reports based on the results of determining the subject's diabetes and related cardiovascular disease risk may be generated.
- the reports may include suggested therapy regimens selected based on the subject's diabetes and cardiovascular disease risk.
- This report may be transmitted or distributed to a patient's doctor or directly to the patient. Following transmission or distribution of the report, the subject may be coached or counseled based on the therapy recommendations.
- a health practitioner may generally refer to any individual that is trained to provide health care services, including, but are not limited to, a physician, physician assistant, nurse, midwife, dietitian, therapist, psychologist, pharmacist, clinical officer, phlebotomist, emergency medical technician, medical laboratory scientist, medical prosthetic technician, social worker, community health worker, and a wide variety of other human resource trained to provide some type of health care service.
- Health practitioners can work in hospitals, health care centers, or other service delivery points, including care and treatment services in private homes; or in academic training, research, and administration.
- Treating the subject involves administering to the subject an agent suitable to treat a diabetes, or cardiovascular disease or disorder or to lower the risk of a subject developing a future diabetes or cardiovascular disease or disorder.
- Suitable agents include an antiinflammatory agent, an antithrombotic agent, an anti-platelet agent, a fibrinolytic agent, a lipid reducing agent, a direct thrombin inhibitor, a glycoprotein Ilb/IIIa receptor inhibitor, an agent that binds to cellular adhesion molecules and inhibits the ability of white blood cells to attach to such molecules, a PCSK9 inhibitor, an MTP inhibitor, mipmercin, a calcium channel blocker, a beta-adrenergic receptor blocker, an angiotensin system inhibitor, a glitazone, a GLP-1 analog, thiazolidinedionones, biguanides, neglitinides, alpha glucosidase inhibitors, an insulin, a dipeptidyl peptidase IV inhibitor, metformin, a s
- a therapy regimen may also include treatment for chronic infections such as
- Therapies may include appropriate antibiotics and/or other drugs, and surgical procedures and/or dentifrice for the treatment of periodontal disease.
- a therapy regimen may include referral to a healthcare specialist or related specialist based on the determining of risk levels.
- the determining may cause referral to a cardiologist, endocrinologist, opthamologist, lipidologist, weight loss specialist, registered dietician, "health coach", personal trainer, etc. Further therapeutic intervention by specialists based on the determining may take the form of cardiac catherization, stents, imaging, coronary bypass surgeries, EKG, Doppler, hormone testing and adjustments, weight loss regimens, changes in exercise routine, diet, and other personal lifestyle habits.
- the methods may include monitoring the status of diabetes and cardiovascular disease state or risk in a subject or the effects of therapeutic agents on subjects with
- Monitoring may involve determining the risk levels in analytes and scores (measured within a panel or multiple panels as described above) in a subject's biological samples taken from the subject over time (e.g., before and after therapy). For example, an increase in function for one or more analytes on one or more panels (improvement in risk level) in a biological sample taken at the subsequent time as compared to the initial time indicates that a subject's risk of developing diabetes or a cardiovascular disease is decreased. A deterioration in function of one or more analytes on one or more panels (elevation of risk level) indicates that the subject's risk of having diabetes or a cardiovascular disease is increased.
- Monitoring may also include determining success of treatment(s) for infection and inflammation, and acting on said determining to affect resolution of the condition. For example, treatment of periodontitis to resolution by antibiotics, surgical procedure and hygienic dentifrice (improvement in risk level) would indicate that the subject's risk of having diabetes or a cardiovascular disease is decreased.
- Monitoring can also assess the risk for developing diabetes and cardiovascular disease.
- This method involves determining if the subject is at an elevated risk for developing diabetes and cardiovascular disease, which may include assigning the subject to a risk category selected from the group consisting of high risk, intermediate risk, and low risk (i.e., optimal) groups for developing or having diabetes or cardiovascular disease.
- This method also involves repeating the determining if the subject is at an elevated risk for developing diabetes and cardiovascular disease after a period of time (e.g., before and after therapy). The method may also involve comparing the first and second risk categories determining, based on the
- the physical structure is a combination of diagnostic analytes predictive for the conditions above that can aid in diagnsosis and therapy guidance, arranged in panels on a report seen by a healthcare provider or patient. For each analyte in each panel, the measured level derived from the patient sample is compared to known references ranges and the corresponding level of risk is assigned.
- the measures of risk for development of insulin resistance, diabetes, and cardiodiabetes for given analytes are defined as optimal (low risk), intermediate (elevated risk), and high risk.
- risk level will be assigned in conjunction with a group of analytes of 2 or more in the form or a ratio or index score. In some cases an overall risk level will be assigned based on relative risks of individual scores or analytes in related groups.
- the quantitative measurements of the biomarkers can be transformed collectively by a mathematical operation using the processor to generate a cardiodiabetes index score.
- the cardiodiabetes categorical risk level can then be assigned in conjunction with the generated cardiodiabetes index score by the processor.
- the generated cardiodiabetes index score is compared with a reference value range.
- the cardiodiabetes categorical risk level and cardiodiabetes index score can be further evaluated against one or more clinical endpoint components of the cardiodiabetic disease.
- the evaluated cardiodiabetes categorical risk level and generated cardiodiabetes index score can be included in the patient-specific cardiodiabetes health report by the processor.
- clinical endpoint generally refers to occurrence of a disease, symptom, sign or laboratory abnormality that constitutes one of the target outcomes of the diagnostic test results.
- These one or more clinical endpoint components of cardiodiabetic disease include, e.g., measurements of blood glucose level at any time point in an OGTT or mixed meal challenge, measurements of blood insulin level at any time during an OGTT or mixed meal challenge, early signs of impaired first and/or second phase insulin secretion, early signs of impaired incretin response, early signs of impaired glucose disposal rate, early signs of adipose insulin resistance, early signs of hepatic insulin resistance, early signs of microvascular cardiodiabetic disease, and early signs of macrovascular cardiovascular disease.
- the patient-specific cardiodiabetes health reports may be printed, faxed, in paper ("real") or electronic ("virtual") format viewable on a PC or handheld device such as a cell phone.
- the cardiodiabetes health reports can be secured so that they can be accessed only by a physician and/or in some variations the patient.
- the cardiodiabetes health reports may contain transformed data, or graphics formatted in the manner according to the methods described by Warnick, Caffrey and Hoefner in U.S. Provisional Patent Applications, 61/684,056, filed August 16, 2012 and 61/778,595, filed 3/13/2013, respectively and both patent applications are entitled "Method of Data Transformation and Presentation for Panels of Grouped Diagnostic Analytes.”
- a biological sample from a patient is contacted.
- the biological sample is assayed by means of diagnostic tests familiar to those in the art, and analytes in the biological sample are measured. In some cases ratios or indices are calculated based on these measured values.
- Measured values and indices are compared to known reference ranges that are either standard in industry or empirically determined by clinical study within HDL. Risk levels of optimal, intermediate or high are assigned based on the comparison of the measured or calculated values to the standard reference range.
- the values of the analytes and scores and their associated risk levels are arranged on a report for viewing by a healthcare provider or patient.
- the five groups are: 1) Total Glycemic Control, 2) Beta Cell Function, 3) Insulin Resistance, 4) Inflammation, and 5) Dyslipidemia.
- Therapies are defined as drug therapies, nutritional supplements, surgical intervention, and advising the patient to make lifestyle changes such as diet, exercise, weight loss, and
- improvement of dental hygiene can also constitute a program of "active surveillance” and repeat monitoring of patient progress.
- biomarkers and analytes are “core” analytes and integral to each panel.
- proinsulin/insulin, and c-peptide + proinsulin/insulin may be calculated but omitted from the report if the values are not abnormal. Alternatively, they may be reported in the body of the report along with the amounts of analytes themselves (when measured and reported), or mentioned as a "comment” in the "notes” section at the end of the report.
- Glycemic control panel is also novel.
- the addition of one or more of the following to the core panel described in Table 1, column 2, "optional accessory” is also novel.
- Beta Cell Function Panel the core claimed tests are serum amylase, anti-GAD antibody, c-peptide, intact pro-insulin.
- measuring at least one of the biomarkers comprised from the list of optional/accessory biomarkers in Table 1 column 2 confers further novelty.
- the optional CLIX score in the beta cell function panel is novel because the score (which incorporates in its calculation time- course measurements of serum creatinine, glucose and C-peptide) is a useful proxy for insulin secretion/pancreatic function in Type-1 diabetics who take exogenous insulin as well as in IR/T2DM patients; additionally detection of auto-antibodies known to be responsible for development of Type 1 diabetes, and low levels of serum amylase also allow Type 1 diabetics to be distinguished from Type 2 and insulin resistant patients. Further novelty arises because the CLIX score is better able to distinguish early stages of insulin resistance than the
- the CLIX score also allows for diagnosis of improvement or deterioration in pancreatic function, particularly in Type 1 diabetics who are taking exogenous insulin therapy, via its measurement of baseline C-pep in conjunction with the serial measurements of C-pep (a proxy for insulin secretion) taken during the CLIX.
- Other novel aspects of this test panel arise from inclusion of the additional analytes fasting C-peptide (which is cleaved to pro-insulin), intact pro-insulin (which is cleaved to insulin), and insulin itself.
- this particular panel of biomarkers for Beta Cell Dysfunction compared to standard panels commonly sold (such as combinations of insulin, pro-insulin, and c-peptide in conjunction with fasting plasma glucose), is that this panel not only distinguishes between Type 1 and Type 2 diabetics, it can also measure deterioration or improvement in pancreatic beta cell function in both type 1 and type 2 diabetics, and the panel can also detect the very early stages of insulin
- the core biomarker panel includes FPM, leptin, adiponectin, ferritin, and Free Fatty Acids (FFA) . Additionally, the measurement of at least 1 , at least 2, etc. biomarkers from the list comprising: alpha hydroxybutyrate, Oleic Acid, L-GPC, IR Score (Metabolon), HOMA IR Score, CLLX, OGTT, fasting plasma glucose, acylcarnitines, and the ratio of mannose/glucose at any timepoint during an OGTT.
- FPM Free Fatty Acids
- the core analytes include LpPLA 2 , fibrinogen, hsCRP,
- F2-isoprostanes and Myeloperoxidase (MPO), in addition to at least 1 of the following analytes from the list comprising: fibrinogen degredation products (FDP), D-dimer, oxidized phospholipids, oxidized lipoproteins, HSP 60, HSP 70, Cytokines and acute-phase reactants such as IL-6, MCP-1, TNF-a, IL-18, IL-10, and serum amyloid A (SAA); soluble endothelial adhesion molecules such as ICAM (intercellular adhesion molecule), VCAM (vascular cell adhesion molecule), E-selectin; von Willebrand factor (vWF), secretory phospholipase A2 (sPLA2), Vascular endothelial growth factor (VEGF), placental growth factor (P1GF), hepatocyte growth factor (HGF), and matrix metalloproteinases (MMPs), including MMP-1, -2, and -9, as well
- the core analytes include all lipids and lipoproteins in Figure 2, and Lipoprotein Remnants, as the core biomarker panel.
- Lipoprotein Remnants which are primarily derived from IDL and VLDL
- the core panel confers novelty as it is not currently commercially offered with this specific panel of tests.
- at least one, at least 2, at least 3, at least 4, at least 5, at least 6, at least 7, or at least 8, of the additional measurements in Figure 3 are also included.
- VLDLl VLDL2, VLDL3, remnant lipoprotein
- LDL density patterns LDL density patterns, HDL density patterns, oxidized LDL, oxidized HDL, oxidized ApoA-1, oxidized ApoB, ApoB-48, ApoC-1, ApoC-2, ApoC-3, ApoE, ApoE genotype
- HDL particles with integrated SAA HDL particles with integrated ApoC-1, HDL particles with bound endotoxin
- HDL electronegativity LDL electroengativity
- IDL electronegativity HDL particle stability, LDL particle stability, IDL particle stability, VLDL particle stability, and absolute amount of Mannose Binding Protein (MBP) (aka Mannose Binding Lectin, MBL), biological activity of MBL, and associated genetic polymorphisms and known haplotypes thereof are also included.
- MBP Mannose Binding Protein
- Each disjoint cluster labeled X1-X7 or X1-X13, includes a cluster component score based on a linear combination of the weighted, standardized biomarker values contained within that cluster.
- the linear combinations were obtained using principal components (PC) analysis to maximize the amount of explained variability; however, the PC are rotated (i.e. not orthogonal) hence the disjoint clusters are correlated.
- PC identifies groups of well-correlated biomarkers (that share an unobserved dimension in the data). The natural log was taken to make the biomarkers more symmetric and thus reduce the influence of outliers in the dataset.
- Inherent in the PC analysis are methods to optimize explained variability, which is the variability that is not random.
- PC explains total variability which includes common (shared) variability among the markers, and random error.
- the number of clusters was determined by considering: eigenvalues, minimum R-squared value between a biomarker and its cluster component score, total variability explained in the data, and subject matter knowledge.
- the clusters biomarkers membership and the amount of variation explained in each biomarker by its own cluster are given in Table 2 (7 cluster model) and Table 5 (13 cluster model).
- Table 5 7 cluster model
- Seven of the ten new biomarkers created 5 new clusters representing additional axes of information.
- a heat map was used to show the absolute value of the correlation between the values of each biomarker and each cluster component score ( Figures 8 and 9).
- the clusters form blocks of high correlation values, which can be seen on the main diagonal of the heat map. This indicates those variables that are homogeneous (shown in yellow and light tan color). Whereas blue and purple colors indicate independence between clusters and biomarkers; green represents moderate correlations.
- analysis in Table 6 was performed. The area under the OGTT curve for FFA times C-peptide, and 1-hr, and 2-hr glucose responses were modeled as the dependent variables to determine which biomarkers are related to these endpoints; this analysis is a non-limiting example of how meaning is provided and assigned to the clusters.
- cluster component score (first column, explained variability with
- IR-1 IR-3 Desaturase IR-2 (L- Function Control 3 Index (Ferritin)
- X indicates a variable was selected in at least 500 of the 1000 bootstrapped samples.
- the OGTT Index was calculated for all subjects, and then it plus the 10 additional biomarkers listed in Table 2 were eligible to be selected as predictor variables in linear models for the dependent responses (i.e. endpoints). To improve generalization of the results, 1000 bootstrapped samples were created and predictor variables were selected if they were included in the final model that minimized Akaike's information criterion (AIC) in at least 500 of the samples.
- AIC Akaike's information criterion
- MBL Mannose Binding Lectin
- glucola 75mg glucose solution
- Additional blood samples were collected at either (1) 30, 60, 90, and 120 minutes, or at (2) 60 and 120 minutes, from completion of the glucola. All patients avoided eating, drinking, or smoking during the testing period.
- Study #1 Subjects: 217 consecutive nondiabetic subjects underwent a 75 g oral glucose tolerance test (OGTT) and fasting blood collection to evaluate risk of diabetes between March 2012 and May 2013 at several outpatient centers across the US (Madison, WI; Jackson, MS; Montgomery, AL; Charleston, SC; Seattle, WA; and Salt Lake City, UT).
- Clinical indications for testing included obesity, history of first-degree family members with diabetes, and presence of one or more components of the metabolic syndrome, including impaired fasting glucose. Samples were sent by overnight courier to Health Diagnostic Laboratory, Inc.
- IR Insulin resistance
- TH Transient hyperglycemia
- the reclassification was tested when a-HB was added to the fully adjusted logistic regression model with the integrated discrimination improvement (IDI) metric, which can be described as the average increase in sensitivity given no change in specificity.
- IDI integrated discrimination improvement
- the percentage of subjects who had model probabilities changed in the correct direction (i.e., increased for those with events and decreased for non-events) due to the addition of a-HB to the fully adjusted model was tested with the continuous net reclassification index (NRI).
- SAS® version 9.3 (Cary, NC) was used for all analyses, with the critical level set to 0.05 to prescribe statistical significance.
- Figures 8 and 9 show heat maps of the absolute value of the Pearson's correlation between the values of each biomarker and each cluster component score (7 and 13 clusters, respectively). As shown in Figure 9, the clusters form blocks of high correlation values, which can be seen on the main diagonal of the heat map. This indicates those variables that are homogeneous (shown in yellow and light tan color), whereas blue and purple colors indicate independence between clusters and biomarkers; green represents moderate correlations.
- Base model is BMI, Ln(fasting glucose), Ln(fasting insulin), Ln(Alc).
- Index Score comprises a set of 6 biomarkers from claimed panels, specifically 1) Lipids (FFA and L-GPC) 2) beta cell function (C-peptide and AHB), and insulin resistance— (hepatic-ferritin and adipose- adiponectin).
- Study #1 Predictive Improvement in 1-hour Glucose Clinical Endpoint by addition of claimed biomarkers.
- biomarkers comprising the groups beta cell function (AHB and c-peptide), Glycemic Control (1,5 AG, mannose) Insulin
- Base model is BMI, Ln(fasting glucose), Ln(fasting insulin), Ln(Alc).
- Index Score comprises a set of 6 biomarkers from claimed panels, specifically 1) Lipids (FFA and L-GPC) 2) beta cell function (C-peptide and AHB), and insulin resistance— (hepatic-ferritin and adipose- adiponectin).
- Lipids FFA and L-GPC
- beta cell function C-peptide and AHB
- insulin resistance— hepatic-ferritin and adipose- adiponectin
- Beta cell function panel (8 BIOMARKERS);
- Insulin resistance panel 13 BIOMARKERS
- i. lipoprotein insulin resistance score LP IR SCORE (MISSING 22%)
- Lipoprotein-associated phospholipase A 2 LPPLA2 (MISSING 29%)
- F2-isoprostanes F2I (MISSFNG 66%)
- Mannose binding lectin (MBL) amount MLB MASS
- Mannose binding lectin (MBL) activity MLB_MASP2_FUNCTION
- LDL-C LDL C (MISSING 22%)
- HDL-C HDL C (MISSING 22%)
- Triglycerides TRIG (MISSING 22%)
- HDL-P (total) HDL P (MISSING 22%)
- VLDL size VLDL SIZE (MISSING 31%)
- HDL size HDL SIZE (MISSING 22%)
- LP-IR score LP IR SCORE (MISSING 22%)
- LGPC 124 0 17.50 6.50 5.60 43.30 1.00 1.85
- Table 12a Statistical Model Summary for Individual Biomarkers. Statistics were derived by comparison of each individual biomarker to a stringent base model containing log(fasting glucose), HbAlc, and BMI.
- Table 12b Categorization by function of individually significant biomarkers enumerated in Table 12a.
- Glycemic Control G-GAP Fructosamine, Log(Mannose), Log(AHB)
- Beta Cell Function Amylase C-peptide, Log(Proinsulin), GLP1, C-peptide/Insulin, Log(AHB)
- Insulin Resistance Ferritin FFA, OA, LGPC, Log(MLB/MASP2 activity), Log(AHB), GLP1,
- ROC curves demonstrate the use of claimed analytes from various categories to improve upon the accuracy of categorization and/or prediction of clinical endpoints based solely on the base model of fasting glucose, HbAlc and BMI.
- Models 1-13 were constructed with each of the following inputs over the base model, which consists of the log of fasting glucose, HbAlc, and BMI.
- the log (fasting glucose) was used rather than the absolute value of fasting glucose in order to derive the most stringent base model possible against which to test the biomarkers in Study 3.
- Models 1-5 describe the prediction of the categorical endpoint of prediabetes versus normal when specific additional biomarkers are added to the base model.
- Model 1 contains ferritin, log HDL2, LGPC, log MBL activity, c-peptide, GLP-1, log mannose, LPPLA2, shown in figure 10.
- Model 2 contains ferritin, log HDL2, LGPC, log MBL activity, c-peptide, GLP-1, log mannose, LPPLA2, log(AHB) and FRUCT, and is shown in figure 11.
- Model 3 contains amylase, cpep/insulin, ferritin, log HDL2, LGPC, log MBL activity, log mannose, LPPLA2 and is shown in figure 12.
- Model 4 contains ferritin, FFA, log HDL2, AHB, C-pep, LPPLA2, G-GAP, and is shown in figure 13.
- Model 5 contains log Mannose, ferritin, FFA, log HDL2, AHB, C-pep, LPPLA2, and G-GAP and is shown in Figure 14.
- Models # 1-5 For models 1-5 there were 45 cases and 67 controls.
- GLP-1 log mannose
- LPPLA2 log mannose
- Model 6-8 describe the prediction of the clinical endpoint of 1 hr glucose > 155 mg/dL with the addition of the following biomarkers to the base model.
- Model 6 amylase, log mannose, FFA, ferritin, LGPC, log proinsulin, log AHB, and is shown in figure 15.
- Model 7 1,5 AG, log AHB, amylase, c-pep, OA, log HDL2, and is shown in figure 16.
- Model 8 1,5 AG, log AHB, amylase, c-pep, OA, log HDL2, ferritin and LPPLA2, and is shown in figure 17. All of the models 6-8 had significant biomarkers classifying 1-hour glucose > 155 mg/dL.
- Model #9-13 Endpoint prediction of 2 hr glucose > 140. For models 9-13 there were 33 cases and 101 controls.
- ferritin FFA, MPO, fructosamine, log AHB, amylase, cpep/proinsulin
- Models 9-13 describe endpoint prediction of 2 hr glucose > 140 mg/dL with the addition of the following biomarkers to the base model.
- Model 9 ferritin, FFA, log proinsulin, MPO, G-GAP, fructosamine, log AHB, and is shown in figure 18.
- Model 10 ferritin, FFA, log proinsulin, MPO, G-GAP, and LGPC, and is shown in figure 19.
- Model 11 amylase, cpep/proinsulin, ferritin, FFA, MPO, fructosamine, log AHB and is shown in figure 20.
- Model 12 GLPl, amylase, cpep/proinsulin, ferritin, FFA, MP, fructosamine, and log AHB, and is shown in figure 21.
- Model 13 MBL activity, amylase, cpep/proinsulin, ferritin, FFA, MPO, fructosamine, and log AHB, and is shown in figure 22.
- the base logistic regression model included: log(fasting glucose), HbAlc, and BMI.
- the AUC i.e. c-statistic
- Table 21 Odds ratio (OR) per 1 SD increase for a group of biomarkers, which classify patients with 1-hour glucose > 155 mg/dL
- the base logistic regression model included: log(fasting glucose), HbAlc, and BMI.
- the AUC i.e. c-statistic
- the base logistic regression model included: log(fasting glucose), HbAlc, and BMI.
- the AUC i.e. c-statistic
- Table 23 Cluster Summary for 11 cluster analysis N
- Cluster 12 AG15 1.0000 0.0556 0.0000
- Yamanouchi, et al Common reabsorption system of 1,5 anhydro-D-glucitol, fructose and mannose in rat tubules, Biochim. Biophys. Acta, 1291(l):89-95, 1996.
- Lipid accumulation product is a powerful index for recognizing insulin resistance in non-diabetic individuals, Eur. J. Clin. Nutr., 66(9): 1035-1038, 2012.
- Gall, W.E. et al., Alpha-hydroxybutyrate is an early biomarker of insulin resistance and glucose intolerance in a non-diabetic population, PLoS, 5(5):el0883, pp. 1-11, 2010.
Landscapes
- Health & Medical Sciences (AREA)
- Engineering & Computer Science (AREA)
- Life Sciences & Earth Sciences (AREA)
- Biomedical Technology (AREA)
- Pathology (AREA)
- Medical Informatics (AREA)
- Urology & Nephrology (AREA)
- Public Health (AREA)
- Molecular Biology (AREA)
- General Health & Medical Sciences (AREA)
- Immunology (AREA)
- Chemical & Material Sciences (AREA)
- Hematology (AREA)
- Cell Biology (AREA)
- Medicinal Chemistry (AREA)
- Proteomics, Peptides & Aminoacids (AREA)
- Primary Health Care (AREA)
- Microbiology (AREA)
- Epidemiology (AREA)
- Databases & Information Systems (AREA)
- Data Mining & Analysis (AREA)
- Food Science & Technology (AREA)
- Biotechnology (AREA)
- Physics & Mathematics (AREA)
- Analytical Chemistry (AREA)
- Biochemistry (AREA)
- General Physics & Mathematics (AREA)
- Investigating Or Analysing Biological Materials (AREA)
- Medicines That Contain Protein Lipid Enzymes And Other Medicines (AREA)
- Measuring Or Testing Involving Enzymes Or Micro-Organisms (AREA)
- Management, Administration, Business Operations System, And Electronic Commerce (AREA)
Abstract
Description

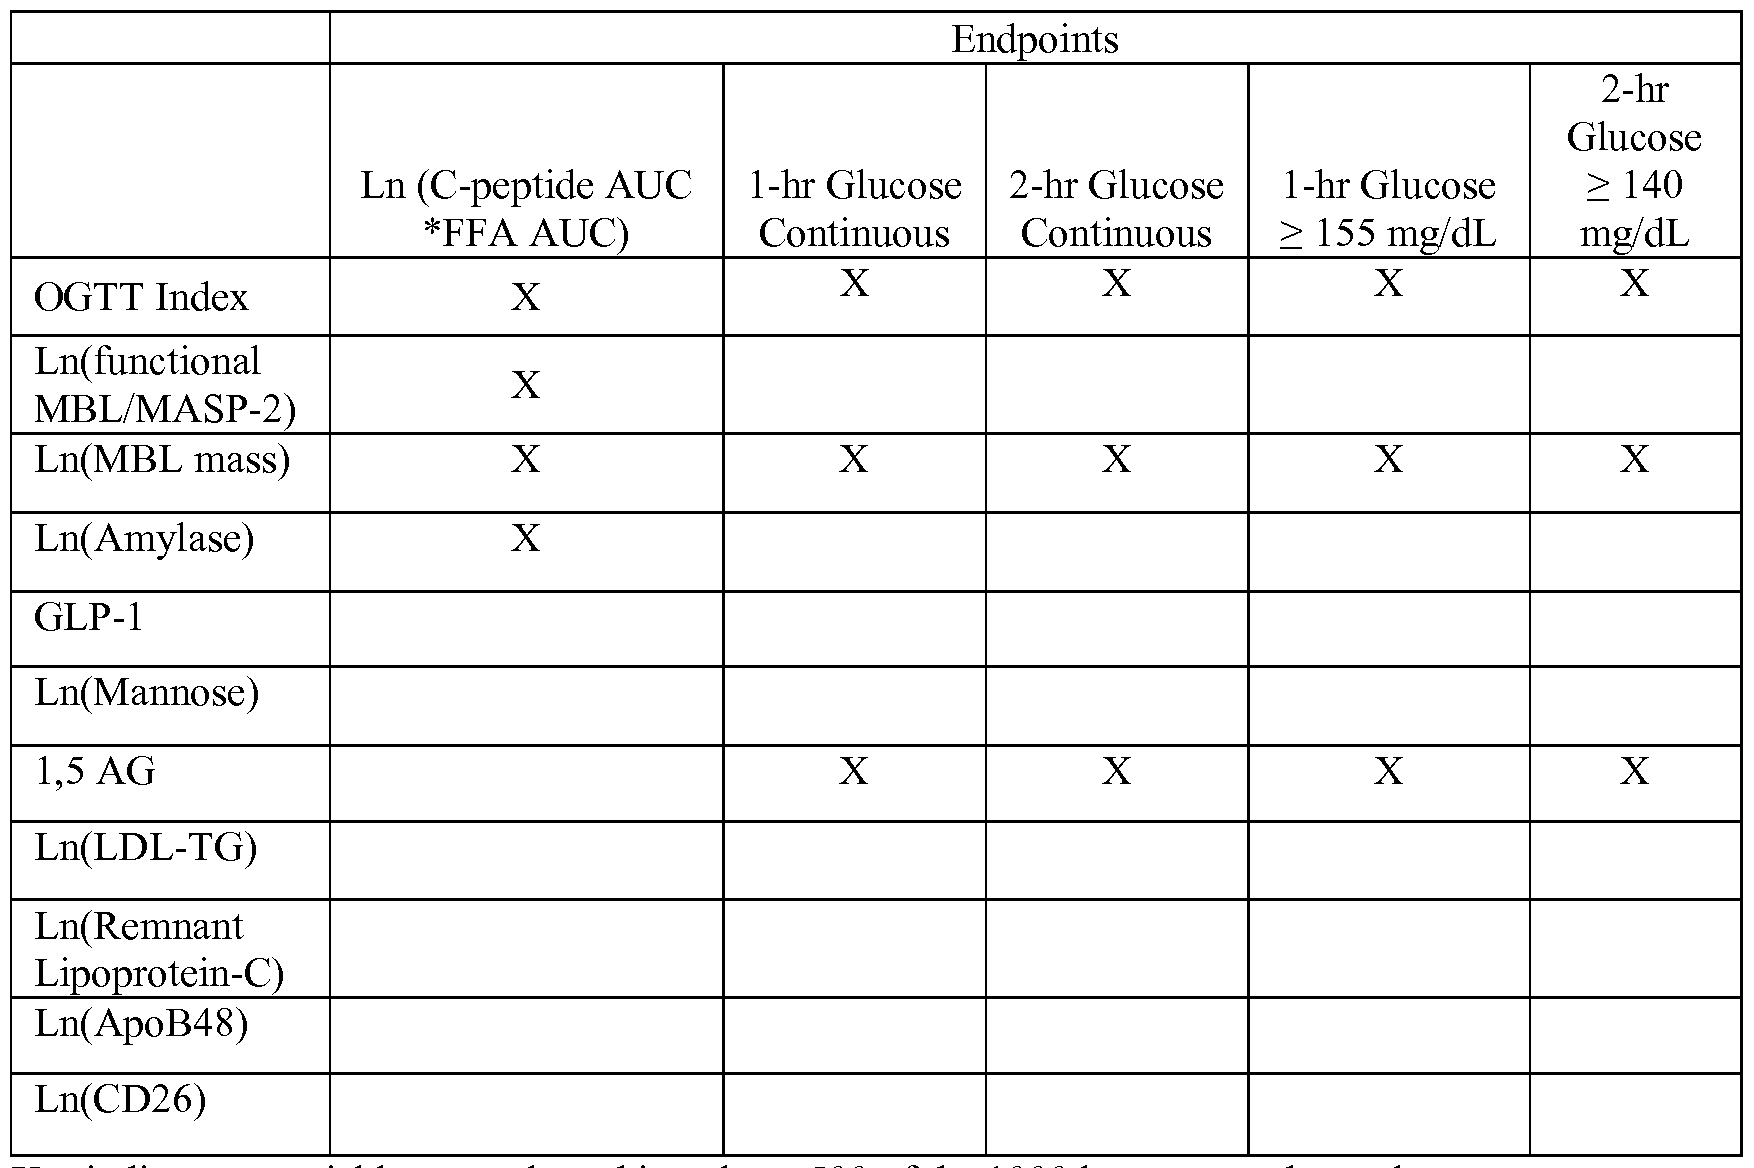
Claims
Priority Applications (4)
| Application Number | Priority Date | Filing Date | Title |
|---|---|---|---|
| AU2013342146A AU2013342146A1 (en) | 2012-11-08 | 2013-11-08 | Method of determining and managing total cardiodiabetes risk |
| EP13795932.6A EP2917737A2 (en) | 2012-11-08 | 2013-11-08 | Method of determining and managing total cardiodiabetes risk |
| JP2015541946A JP2016505811A (en) | 2012-11-08 | 2013-11-08 | How to determine and control the overall risk of diabetic heart disease |
| CA2890921A CA2890921A1 (en) | 2012-11-08 | 2013-11-08 | Method of determining and managing total cardiodiabetes risk |
Applications Claiming Priority (4)
| Application Number | Priority Date | Filing Date | Title |
|---|---|---|---|
| US201261724071P | 2012-11-08 | 2012-11-08 | |
| US61/724,071 | 2012-11-08 | ||
| US14/038,698 US20140324460A1 (en) | 2012-09-26 | 2013-09-26 | Method for determining and managing total cardiodiabetes risk |
| US14/038,698 | 2013-09-26 |
Publications (2)
| Publication Number | Publication Date |
|---|---|
| WO2014074889A2 true WO2014074889A2 (en) | 2014-05-15 |
| WO2014074889A3 WO2014074889A3 (en) | 2015-01-15 |
Family
ID=49667587
Family Applications (1)
| Application Number | Title | Priority Date | Filing Date |
|---|---|---|---|
| PCT/US2013/069257 Ceased WO2014074889A2 (en) | 2012-11-08 | 2013-11-08 | Method of determining and managing total cardiodiabetes risk |
Country Status (6)
| Country | Link |
|---|---|
| US (1) | US20140324460A1 (en) |
| EP (1) | EP2917737A2 (en) |
| JP (1) | JP2016505811A (en) |
| AU (1) | AU2013342146A1 (en) |
| CA (1) | CA2890921A1 (en) |
| WO (1) | WO2014074889A2 (en) |
Cited By (8)
| Publication number | Priority date | Publication date | Assignee | Title |
|---|---|---|---|---|
| WO2015010042A3 (en) * | 2013-07-18 | 2015-06-11 | Health Diagnostic Laboratory, Inc. | Method of determination of risk of 2 hour blood glucose equal to or greater than 140 mg/di |
| WO2015188114A3 (en) * | 2014-06-05 | 2016-03-10 | The General Hospital Corporation | Predicting morbidity associated with red blood cell volume variance |
| US20160357935A1 (en) * | 2015-06-04 | 2016-12-08 | True Health Diagnostics Llc | Novel set of fasting blood biomarkers to detect patients with impaired glucose tolerance |
| US9938557B2 (en) | 2010-09-16 | 2018-04-10 | The General Hospital Corporation | Red blood cell dynamics for administering treatment for iron-deficiency anemia |
| WO2018197477A1 (en) * | 2017-04-25 | 2018-11-01 | Nestec S.A. | Methods to enable personalized nutrition |
| US10955423B2 (en) | 2015-12-15 | 2021-03-23 | The General Hospital Corporation | Methods of estimating blood glucose and related systems |
| WO2021123830A1 (en) * | 2019-12-20 | 2021-06-24 | Cambridge Enterprise Limited | Method of determining risk of fetal size abnormality |
| US11293852B2 (en) | 2016-04-07 | 2022-04-05 | The General Hospital Corporation | White blood cell population dynamics |
Families Citing this family (18)
| Publication number | Priority date | Publication date | Assignee | Title |
|---|---|---|---|---|
| US9255154B2 (en) | 2012-05-08 | 2016-02-09 | Alderbio Holdings, Llc | Anti-PCSK9 antibodies and use thereof |
| JP5844247B2 (en) * | 2012-11-30 | 2016-01-13 | 富士フイルム株式会社 | Inspection result display device, operating method thereof, and program |
| US10453562B2 (en) * | 2014-05-08 | 2019-10-22 | ProductVisionaries, LLC | Consumer-oriented biometrics data management and analysis system |
| WO2016042202A1 (en) | 2014-09-17 | 2016-03-24 | Wallac Oy | Method for determining the risk of preterm birth |
| WO2016103390A1 (en) * | 2014-12-25 | 2016-06-30 | 株式会社日立製作所 | Device for analyzing insulin secretion ability, system for analyzing insulin secretion ability provided with same, and method for analyzing insulin secretion ability |
| WO2016123163A2 (en) | 2015-01-27 | 2016-08-04 | Kardiatonos, Inc. | Biomarkers of vascular disease |
| US20180110472A1 (en) * | 2016-10-21 | 2018-04-26 | Quattro Folia Oy | Method and system for determining status of prediabetes in an individual |
| EP3704708B1 (en) * | 2017-11-02 | 2025-12-31 | Tigar Health, Inc. | SYSTEMS FOR PROVIDING PROFESSIONAL TREATMENT GUIDELINES FOR DIABETES PATIENTS |
| JP7251722B2 (en) * | 2018-09-27 | 2023-04-04 | 国立大学法人九州大学 | METHOD OF OBTAINING INFORMATION ABOUT DIABETES AND USE THEREOF |
| US11417428B1 (en) * | 2021-04-05 | 2022-08-16 | Lark Technologies, Inc. | Conversational services for artificial intelligence health support |
| US11887713B2 (en) | 2021-06-10 | 2024-01-30 | Elucid Bioimaging Inc. | Non-invasive determination of likely response to anti-diabetic therapies for cardiovascular disease |
| US11887734B2 (en) | 2021-06-10 | 2024-01-30 | Elucid Bioimaging Inc. | Systems and methods for clinical decision support for lipid-lowering therapies for cardiovascular disease |
| US11887701B2 (en) | 2021-06-10 | 2024-01-30 | Elucid Bioimaging Inc. | Non-invasive determination of likely response to anti-inflammatory therapies for cardiovascular disease |
| US11869186B2 (en) * | 2021-06-10 | 2024-01-09 | Elucid Bioimaging Inc. | Non-invasive determination of likely response to combination therapies for cardiovascular disease |
| KR20240025658A (en) * | 2021-06-29 | 2024-02-27 | 산 푼 | Coagulability-based personalized therapy (CPT) system |
| WO2023235573A1 (en) * | 2022-06-02 | 2023-12-07 | University Of Virginia Patent Foundation | System, method, and computer readable medium for cgm-based ogtt replacement diagnosis test |
| EP4602616A1 (en) * | 2022-10-11 | 2025-08-20 | Fundació Eurecat | Method for the selection of diet for a subject |
| WO2025117940A1 (en) * | 2023-11-30 | 2025-06-05 | Rensselaer Polytechnic Institute | Systems and methods for predicting fracture risk using circulating f2-isoprostanes |
Citations (2)
| Publication number | Priority date | Publication date | Assignee | Title |
|---|---|---|---|---|
| US20120122981A1 (en) | 2009-03-31 | 2012-05-17 | Yun Fu Hu | Biomarkers Related to Insulin Resistance and Methods using the Same |
| US8187830B2 (en) | 2007-07-17 | 2012-05-29 | Metabolon, Inc. | Method for determining insulin sensitivity with biomarkers |
Family Cites Families (10)
| Publication number | Priority date | Publication date | Assignee | Title |
|---|---|---|---|---|
| ATE364177T1 (en) * | 2004-07-07 | 2007-06-15 | Hoffmann La Roche | COMBINATIONS OF MARKERS FOR DETECTING TYPE 1 AND 2 DIABETES |
| US8119358B2 (en) * | 2005-10-11 | 2012-02-21 | Tethys Bioscience, Inc. | Diabetes-related biomarkers and methods of use thereof |
| US8871455B2 (en) * | 2006-06-12 | 2014-10-28 | The Henry M. Jackson Foundation For The Advancement Of Military Medicine, Inc. | Biomarker panels for assessing radiation injury and exposure |
| ES2437610T3 (en) * | 2008-07-17 | 2014-01-13 | Ikfe Institut Für Klinische Forschung Und Entwicklung Gmbh | Biomarkers for cardiodiabetes |
| CA2782776A1 (en) * | 2008-12-04 | 2010-06-10 | Ikfe Gmbh | Biomarkers for atherosclerosis |
| US8190832B2 (en) * | 2009-01-29 | 2012-05-29 | International Business Machines Corporation | Data storage performance enhancement through a write activity level metric recorded in high performance block storage metadata |
| US20120095802A1 (en) * | 2010-10-18 | 2012-04-19 | The Coca-Cola Company | System and methods for evaluating political, social, and economic risk associated with a geographic region |
| US20140221284A1 (en) * | 2011-01-21 | 2014-08-07 | Ir2Dx, Inc. | Biomarkers for Rapid Determination of Drug Efficacy |
| WO2013039898A1 (en) * | 2011-09-14 | 2013-03-21 | Metabolon, Inc. | Biomarkers related to insulin resistance and methods using the same |
| CA2921530A1 (en) * | 2013-07-18 | 2015-01-22 | True Health Diagnostics, Llc | Method of determination of risk of 2 hour blood glucose equal to or greater than 140 mg/dl |
-
2013
- 2013-09-26 US US14/038,698 patent/US20140324460A1/en not_active Abandoned
- 2013-11-08 CA CA2890921A patent/CA2890921A1/en not_active Abandoned
- 2013-11-08 EP EP13795932.6A patent/EP2917737A2/en not_active Withdrawn
- 2013-11-08 AU AU2013342146A patent/AU2013342146A1/en not_active Abandoned
- 2013-11-08 WO PCT/US2013/069257 patent/WO2014074889A2/en not_active Ceased
- 2013-11-08 JP JP2015541946A patent/JP2016505811A/en active Pending
Patent Citations (3)
| Publication number | Priority date | Publication date | Assignee | Title |
|---|---|---|---|---|
| US8187830B2 (en) | 2007-07-17 | 2012-05-29 | Metabolon, Inc. | Method for determining insulin sensitivity with biomarkers |
| US20120208215A1 (en) | 2007-07-17 | 2012-08-16 | Metabolon, Inc. | Biomarkers for Pre-Diabetes, Cardiovascular Diseases, and Other Metabolic-Syndrome Related Disorders and Methods Using the Same |
| US20120122981A1 (en) | 2009-03-31 | 2012-05-17 | Yun Fu Hu | Biomarkers Related to Insulin Resistance and Methods using the Same |
Non-Patent Citations (43)
Cited By (13)
| Publication number | Priority date | Publication date | Assignee | Title |
|---|---|---|---|---|
| US9938557B2 (en) | 2010-09-16 | 2018-04-10 | The General Hospital Corporation | Red blood cell dynamics for administering treatment for iron-deficiency anemia |
| US11319571B2 (en) | 2010-09-16 | 2022-05-03 | The General Hospital Corporation | Red blood cell dynamics for gastrointestinal evaluation |
| US10475536B2 (en) | 2013-07-18 | 2019-11-12 | True Health Ip Llc | Method of determination of risk of 2 hour blood glucose equal to or greater than 140 mg/dL |
| WO2015010042A3 (en) * | 2013-07-18 | 2015-06-11 | Health Diagnostic Laboratory, Inc. | Method of determination of risk of 2 hour blood glucose equal to or greater than 140 mg/di |
| US20170108487A1 (en) * | 2014-06-05 | 2017-04-20 | The General Hospital Corporation | Predicting morbidity associated with red blood cell volume variance |
| WO2015188114A3 (en) * | 2014-06-05 | 2016-03-10 | The General Hospital Corporation | Predicting morbidity associated with red blood cell volume variance |
| US20160357935A1 (en) * | 2015-06-04 | 2016-12-08 | True Health Diagnostics Llc | Novel set of fasting blood biomarkers to detect patients with impaired glucose tolerance |
| US10955423B2 (en) | 2015-12-15 | 2021-03-23 | The General Hospital Corporation | Methods of estimating blood glucose and related systems |
| US12517141B2 (en) | 2015-12-15 | 2026-01-06 | The General Hospital Corporation | Methods of estimating blood glucose and related systems |
| US11293852B2 (en) | 2016-04-07 | 2022-04-05 | The General Hospital Corporation | White blood cell population dynamics |
| US11885733B2 (en) | 2016-04-07 | 2024-01-30 | The General Hospital Corporation | White blood cell population dynamics |
| WO2018197477A1 (en) * | 2017-04-25 | 2018-11-01 | Nestec S.A. | Methods to enable personalized nutrition |
| WO2021123830A1 (en) * | 2019-12-20 | 2021-06-24 | Cambridge Enterprise Limited | Method of determining risk of fetal size abnormality |
Also Published As
| Publication number | Publication date |
|---|---|
| US20140324460A1 (en) | 2014-10-30 |
| CA2890921A1 (en) | 2014-05-15 |
| AU2013342146A1 (en) | 2015-06-11 |
| EP2917737A2 (en) | 2015-09-16 |
| JP2016505811A (en) | 2016-02-25 |
| WO2014074889A3 (en) | 2015-01-15 |
Similar Documents
| Publication | Publication Date | Title |
|---|---|---|
| US20140324460A1 (en) | Method for determining and managing total cardiodiabetes risk | |
| Harman-Boehm et al. | Macrophage infiltration into omental versus subcutaneous fat across different populations: effect of regional adiposity and the comorbidities of obesity | |
| EP3343226B1 (en) | Biomarkers associated with pre-diabetes, diabetes and diabetes related conditions | |
| WO2008131224A2 (en) | Diabetes-related biomarkers and methods of use thereof | |
| Utumatwishima et al. | Reversing the tide—diagnosis and prevention of T2DM in populations of African descent | |
| US20160357935A1 (en) | Novel set of fasting blood biomarkers to detect patients with impaired glucose tolerance | |
| Then et al. | Serum uromodulin and decline of kidney function in older participants of the population-based KORA F4/FF4 study | |
| US10475536B2 (en) | Method of determination of risk of 2 hour blood glucose equal to or greater than 140 mg/dL | |
| US20140274891A1 (en) | Method of generating an index score for mbl deficiency to predict cardiodiabetes risk | |
| EP2972325B1 (en) | System and method for assessing quantities or sizes of lipoprotein particles from lipoprotein particle compositions | |
| Bobbert et al. | High molecular weight adiponectin correlates positively with myeloperoxidase in patients with type 2 diabetes mellitus | |
| AlSharabati | Association of GLP-1R Gene Polymorphisms with the risk of Dyslipidemia in Palestinian Patients with Type 2 Diabetes Mellitus | |
| Asiamah | Lysophosphatidic Acid Signalling in Diabetes Mellitus | |
| Nakayama | Awe と意味生成 | |
| HK1256827B (en) | Biomarkers associated with pre-diabetes, diabetes and diabetes related conditions | |
| Wassink et al. | Metabolic syndrome improves cardiovascular risk stratification in patients with manifest atherosclerosis |
Legal Events
| Date | Code | Title | Description |
|---|---|---|---|
| 121 | Ep: the epo has been informed by wipo that ep was designated in this application |
Ref document number: 13795932 Country of ref document: EP Kind code of ref document: A2 |
|
| ENP | Entry into the national phase |
Ref document number: 2890921 Country of ref document: CA Ref document number: 2015541946 Country of ref document: JP Kind code of ref document: A |
|
| WWE | Wipo information: entry into national phase |
Ref document number: 2013795932 Country of ref document: EP |
|
| ENP | Entry into the national phase |
Ref document number: 2013342146 Country of ref document: AU Date of ref document: 20131108 Kind code of ref document: A |
|
| 121 | Ep: the epo has been informed by wipo that ep was designated in this application |
Ref document number: 13795932 Country of ref document: EP Kind code of ref document: A2 |