WO2014080509A1 - 感性評価システム - Google Patents
感性評価システム Download PDFInfo
- Publication number
- WO2014080509A1 WO2014080509A1 PCT/JP2012/080418 JP2012080418W WO2014080509A1 WO 2014080509 A1 WO2014080509 A1 WO 2014080509A1 JP 2012080418 W JP2012080418 W JP 2012080418W WO 2014080509 A1 WO2014080509 A1 WO 2014080509A1
- Authority
- WO
- WIPO (PCT)
- Prior art keywords
- information
- evaluation system
- experiment
- transmits
- sensitivity evaluation
- Prior art date
- Legal status (The legal status is an assumption and is not a legal conclusion. Google has not performed a legal analysis and makes no representation as to the accuracy of the status listed.)
- Ceased
Links
Images





Classifications
-
- G—PHYSICS
- G06—COMPUTING OR CALCULATING; COUNTING
- G06Q—INFORMATION AND COMMUNICATION TECHNOLOGY [ICT] SPECIALLY ADAPTED FOR ADMINISTRATIVE, COMMERCIAL, FINANCIAL, MANAGERIAL OR SUPERVISORY PURPOSES; SYSTEMS OR METHODS SPECIALLY ADAPTED FOR ADMINISTRATIVE, COMMERCIAL, FINANCIAL, MANAGERIAL OR SUPERVISORY PURPOSES, NOT OTHERWISE PROVIDED FOR
- G06Q30/00—Commerce
- G06Q30/02—Marketing; Price estimation or determination; Fundraising
- G06Q30/0201—Market modelling; Market analysis; Collecting market data
- G06Q30/0203—Market surveys; Market polls
-
- G—PHYSICS
- G06—COMPUTING OR CALCULATING; COUNTING
- G06Q—INFORMATION AND COMMUNICATION TECHNOLOGY [ICT] SPECIALLY ADAPTED FOR ADMINISTRATIVE, COMMERCIAL, FINANCIAL, MANAGERIAL OR SUPERVISORY PURPOSES; SYSTEMS OR METHODS SPECIALLY ADAPTED FOR ADMINISTRATIVE, COMMERCIAL, FINANCIAL, MANAGERIAL OR SUPERVISORY PURPOSES, NOT OTHERWISE PROVIDED FOR
- G06Q20/00—Payment architectures, schemes or protocols
- G06Q20/08—Payment architectures
- G06Q20/10—Payment architectures specially adapted for electronic funds transfer [EFT] systems; specially adapted for home banking systems
- G06Q20/102—Bill distribution or payments
-
- G—PHYSICS
- G06—COMPUTING OR CALCULATING; COUNTING
- G06Q—INFORMATION AND COMMUNICATION TECHNOLOGY [ICT] SPECIALLY ADAPTED FOR ADMINISTRATIVE, COMMERCIAL, FINANCIAL, MANAGERIAL OR SUPERVISORY PURPOSES; SYSTEMS OR METHODS SPECIALLY ADAPTED FOR ADMINISTRATIVE, COMMERCIAL, FINANCIAL, MANAGERIAL OR SUPERVISORY PURPOSES, NOT OTHERWISE PROVIDED FOR
- G06Q30/00—Commerce
- G06Q30/02—Marketing; Price estimation or determination; Fundraising
- G06Q30/0241—Advertisements
-
- G—PHYSICS
- G06—COMPUTING OR CALCULATING; COUNTING
- G06Q—INFORMATION AND COMMUNICATION TECHNOLOGY [ICT] SPECIALLY ADAPTED FOR ADMINISTRATIVE, COMMERCIAL, FINANCIAL, MANAGERIAL OR SUPERVISORY PURPOSES; SYSTEMS OR METHODS SPECIALLY ADAPTED FOR ADMINISTRATIVE, COMMERCIAL, FINANCIAL, MANAGERIAL OR SUPERVISORY PURPOSES, NOT OTHERWISE PROVIDED FOR
- G06Q50/00—Information and communication technology [ICT] specially adapted for implementation of business processes of specific business sectors, e.g. utilities or tourism
- G06Q50/10—Services
-
- G—PHYSICS
- G06—COMPUTING OR CALCULATING; COUNTING
- G06V—IMAGE OR VIDEO RECOGNITION OR UNDERSTANDING
- G06V40/00—Recognition of biometric, human-related or animal-related patterns in image or video data
- G06V40/10—Human or animal bodies, e.g. vehicle occupants or pedestrians; Body parts, e.g. hands
- G06V40/16—Human faces, e.g. facial parts, sketches or expressions
- G06V40/172—Classification, e.g. identification
Definitions
- the present invention relates to a sensitivity evaluation system incorporating a biometric index.
- the monitor system is a method in which an experiment participant registers as a monitor and evaluates the product by filling in a questionnaire sent from the experiment requesting institution.
- audience rating is known as a mechanism for evaluating advertisements and programs.
- the audience rating is a method in which a monitoring device is installed in each home and the audience rating is investigated based on the operating rate of the device. With this method, you can tell how many people watch a program during a certain period of time, but it is difficult to investigate what kind of reaction the viewer will react to while watching the program. It is.
- the Kansei marketing method disclosed in Patent Document 1 discloses a method of grasping a Kansei pattern of a target layer by selecting a plurality of contents in association with a certain keyword.
- experiment participants must gather in the laboratory and input answers to the questions displayed on the screen. Therefore, it is impossible to obtain a large number of answers at the same time. In addition, it takes time to analyze the answers, and it cannot cope with the product development life cycle.
- the questionnaire method since the answer depends on the mood and subjective evaluation of the experiment participants, the credibility of the total results is poor.
- the multi-channel measurement device disclosed in Patent Document 2 discloses a method of irradiating a subject with light from a plurality of light transmission points and measuring light transmitted through the subject at a plurality of light receiving points. Yes.
- the experiment participants are restrained in the laboratory and cannot measure brain activity in a natural environment.
- data obtained at one time has many duplications, and a load is applied to the storage device.
- an object of the present invention is to provide a sensitivity evaluation system that simultaneously acquires data of a large number of experiment participants in an environment close to daily life and reports analysis results.
- a client system transmits an evaluation request for video information to an information analysis system, and a receiver for each experimental participant to view the video information viewed by the experimental participant Or the terminal transmits the biological signal measured by the measurement device worn by the experiment participant while the experiment participant views the video information to the network, and the information analysis system includes the information analysis system, The biological signal is analyzed, a report regarding the video information is created based on the analysis result, and the created report is transmitted to the client system.
- the measuring device includes a light source for displaying the mounting position of the measuring device on the terminal.
- a measurement device worn by an experiment participant measures brain activity data, and transmits a plurality of measurement data to an information analysis system via a network. It becomes possible to collect a lot of sensitivity information at the same time. Further, by performing positioning of the measuring device using the mobile terminal, it becomes possible for the experiment participant to wear the measuring device at an accurate position on the body.
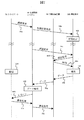
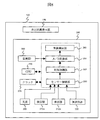
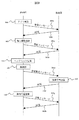
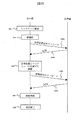
- FIG. 1 is an overall view of a sensitivity evaluation system according to the present invention. It is a hardware block diagram of the information collection device which is this invention. It is a hardware block diagram of the client system which is this invention. It is a hardware block diagram of the information analysis system which is this invention. It is a block diagram of the biological measurement system which is this invention. It is a hardware block diagram of the portable terminal which is this invention. It is a figure which shows the flow between the apparatuses which are this invention. It is a block diagram of the measuring device which is this invention. It is a figure which shows the flow of the portable terminal which is this invention. It is a figure which shows the flow of the portable terminal which is this invention. It is a figure which shows the screen of the portable terminal which is this invention.
- FIG. 1 shows a basic configuration of a sensitivity evaluation system according to the present invention.
- the sensitivity evaluation system consists of a group of experimental participants 5, receivers 10a to 10c, biological signal measurement systems 20a to 20c, base stations 30a to 30c, communication network 40, information collection device 50, transmitter 60, client system 70, information analysis Consists of system 80.
- the biological signal measurement system 20 transmits the acquired data to the base station 30 using wireless or wired communication.
- the base station 30 encrypts the obtained data and transmits it to the information collecting device 50.
- the information collection device 50 is composed of an authentication server 51, a received data storage database 52, and an authentication database 53, the role of which will be described later.
- the information collection device 50 is connected to the information analysis system 80.
- the information analysis system 80 includes an automatic data classification unit 81 that automatically classifies the obtained data, a statistical processing unit 82 that calculates a feature amount from the classified data, and a report generation that summarizes the statistically analyzed data into a report Part 83.
- the client system 70 is composed of a plurality of client ants A, B, and C, and some clients distribute the created advertisements and programs to the receivers 10a to 10c via the transmitter 60.
- Experiment participants belonging to the biological signal measurement system 20 can view advertisements, programs, and the like through the receivers 10a to 10c.
- advertisements, programs, and the like may be distributed to the mobile terminals 160 held by the experiment participants.
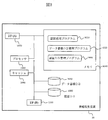
- FIG. 2 is a hardware configuration diagram of the information collecting apparatus 50.
- the information collection device 50 includes an interface 107 that transmits and receives data from the base station 30, an interface 1100 that transmits and receives data to and from the information analysis system 80, a processor 1080, a cache 1090, a memory 1040, and databases 1050 and 1060.
- the authentication processing program 1010 is stored in the memory 1040, and the authentication processing shown in FIG.
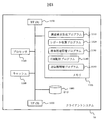
- Fig. 3 shows the hardware configuration of the client system 70.
- the client system 70 includes an interface 1170 that transmits and receives control signals of the transmitter 60, an interface 1200 that exchanges data with the information collection device 50, a processor 1180, a cache 1190, a memory 1155, and a database 1160.
- the report collection program 1140 is stored in the memory 1155, and is executed by the processor 1180 to perform processing for accumulating reports received from the information analysis system 80 in the database 1160.
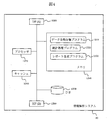
- FIG. 4 is a hardware configuration diagram of the information analysis system 80.
- the information analysis system 80 includes an interface 1260 for transmitting / receiving data to / from the information collecting apparatus 50, an interface 1290 for transmitting / receiving data to / from the client system 70, a processor 1270, a cache 1280, a memory 1240, and a database 1250.
- the automatic data classification program 1210 is stored in the memory 1240, and is executed by the processor 1270 to perform the classification process shown in FIG.
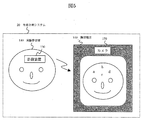
- FIG. 5 shows the configuration of the biological measurement system 20.
- the biological measurement system 20 includes a measurement device 150 worn by the experiment participant 140 and a portable terminal 160 used by the experiment participant 140.
- the experiment participant 140 is selected from an arbitrary volunteer group or a group registered in the client system 70.
- the experiment participant 140 wears a measuring device 150 called a headset on the head.
- This measuring device 150 measures changes in cerebral blood volume and changes in neural activity when the experiment participant 140 views a designated advertisement or program or is given a task that stimulates the five senses.
- the portable terminal 160 has a camera 170 and displays the face of the experiment participant 140 in real time. On the displayed face, marks a, b, c, and d indicating the position where the measuring device 150 is mounted on the head of the experiment participant 140 are displayed. How to decide this mark will be explained later.
- the measuring device 150 transmits the acquired measurement data to the portable terminal 160 wirelessly.
- This measurement data can be displayed on the portable terminal 160 or stored.
- the portable terminal 160 transmits the stored measurement data to the base station 30 during or after the experiment.
- the mobile terminal 160 can also display information such as advertisements and programs sent from the transmitter 60.
- the experiment participant 140 evaluates advertisements and programs while looking at the screen of the mobile terminal 160.
- FIG. 6 shows a hardware configuration of the mobile terminal 160.
- the portable terminal 160 includes a wireless interface 1350 for exchanging data with the measuring device 150, a wireless interface 1380 for transmitting / receiving data to / from the base station 30, a processor 1360, a cache 1370, a memory 1330, and a database 1340 for storing received data.
- the display program 1300 is stored in the memory 1330, and the processing shown in FIG.
- a protocol of the wireless interface 1350 wireless LAN, WiFi, UWB, etc. defined by IEEE are used.
- a protocol of the wireless interface 1380 a 3G line or LTE used in a mobile phone company is used. Assume that the frequency bands of the wireless interface 1350 and the wireless interface 1380 are different.
- FIG. 7 shows a flowchart among the client 70, the information analysis system 80, the information collection device 50, and the portable terminal 160.
- the client 70 transmits an investigation request message 90a to the information analysis system 80.
- the survey request message 90a includes information such as the content of the survey, the size of the survey, the number of participants in the experiment, the desired date of completion of the survey, and the desired budget.
- the contents of the survey are, for example, that you want us to evaluate the ride comfort of your car.
- the information analysis system 80 lends the measurement device 150 to an experiment participant who belongs to the biological measurement system 20 and has the portable terminal 160.
- the information analysis system 80 maintains a list of candidate candidates. The system automatically selects a participant that matches the contents of the survey request message and sends the measurement device to the selected experiment participant. .
- the correspondence between the ID of the participant ID for identifying the experiment participant or the ID of the portable terminal for identifying the portable terminal held by the experiment participant and the ID of the measuring device can be stored for individual statistical analysis. So that The video information ID is also stored in association with each other so that it can be understood which video signal is distributed to which experiment participant.
- the evaluation request message 90c includes, for example, program information and a mounting position of the head set. For example, a message such as “The program starts on channel 1 from 10 am, so please watch it until 11 am. At that time, please put the headset on position a” is included.
- the evaluation request message 90c is generated by the statistical processing program shown in FIG.
- the evaluation request message 90c is transmitted to the participant group that has shipped the measuring device. When there are a plurality of survey requests, the participant group that matches the survey content and the ID of the portable terminal are registered in the database 1250. In response to the survey request A, the evaluation request A is transmitted to the participant group A.
- the mounting position of the measuring device 150 is specified by dividing the participant group 5 into four groups (a, b, c, d) at random.
- the portable terminal 160 Upon receiving the evaluation request message, the portable terminal 160 transmits an authentication request message 90d to the information collection device 50.
- the information collection device 50 executes the authentication processing program stored in the memory 1040 shown in FIG. 2, and determines that the authentication is successful when the terminal ID included in the authentication request message is included in the authentication database 1060.
- Authentication result ACK90e is transmitted to portable terminal 160. After this, experiment 120 is started.
- the client 70 may deliver 110 advertisements and programs. These advertisements or programs are distributed to the receiver 10 or the portable terminal 160.
- the mobile terminal 160 transmits the measurement data 90f to the information collection device 50 via the base station 30, and the information collection device 50 summarizes the measurement data sent from the plurality of base stations 30 as measurement data 90g.
- the measurement data 90g is transmitted to the information analysis system 80.
- the information analysis system 80 performs data analysis 130 and transmits the output report 90h to the client 70.
- the client 70 sends a billing processing message 90i to the information analysis system 80, and the information analysis system 80 continues to send a billing processing message 90j including billing information to the information collecting device 50.
- the billing process message 90i is generated by a billing process management program stored in the memory 1155 of the client system 70 of FIG.
- the billing process management program generates billing information determined from the number of participants in the experiment, the acquired data size, the CPU occupation time of the computer (at least one of the processor 1270 of the information analysis system and the processor 1080 of the information collector), etc. To do.
- the billing information may include information for giving the experiment participant a value for participating in the experiment.
- the billing information may be generated by an information analysis system.
- FIG. 8 shows the configuration of the measuring device 150.
- the measurement device 150 includes a self-position display unit 180 and a measurement circuit unit 190.
- the measurement device includes a near-infrared spectroscopic device that measures transmitted light by illuminating a part of a living body, an electroencephalograph that measures an electrical signal of a part of the living body, or both.
- the self-position display unit 180 is composed of a light source such as a light-emitting diode, and is for allowing the portable terminal 170 to recognize the mounting position when the experiment participant 140 wears the measuring device 150.
- the measurement circuit unit 190 includes a light source 200 that irradiates the scalp, a detector 210 that detects return light, an accelerometer 220, a sensor control unit 230, a gain control unit 240, an A / D conversion unit 250, a wireless communication unit 190, a CPU 270, It consists of a clock 275.
- the clock 275 controls the operation timing of the digital circuit and adds a time stamp to the measurement data.
- the measurement circuit unit 190 stores a device ID 280 unique to the measurement device, and transmits the device ID attached to measurement data. As a result, interference from a plurality of measuring devices 150 is prevented.
- a differential amplification unit, a filter circuit unit, and the like are connected to the CPU 270.
- FIG. 9 shows an initial setting flow when the mobile terminal 160 is used.
- the display unit of the mobile terminal 160 displays the screen of the application registration 29a.
- the experiment participant 140 presses a button displayed on the display unit.
- the display unit transmits a registration message 350a to the processing unit.
- the processing unit transmits an end message ACK 350b to the display unit.
- the display unit displays a screen for personal information registration 300.
- the experiment participant 140 inputs personal information by pressing a button displayed on the display unit.
- the display unit transmits a registration message 350c to the processing unit.
- the processing unit transmits an end message ACK350d to the display unit.
- the display unit displays the screen of the measurement device mounting 310.
- the experiment participant 140 wears the measuring device 150 according to the instructions on the screen.
- the display unit displays a screen of face photographing 320.
- the experiment participant 140 photographs his / her face toward the camera 170 and presses a button on the screen.
- the display unit transmits a calculation request message 350e including the captured image to the processing unit.
- the processing unit executes the mounting position calculation 330.
- the processing of the mounting position calculation 330 will be described in detail in the second to fourth embodiments.
- the processing unit transmits a response confirmation message ACK350f to the display unit.
- the display unit displays a screen for mounting position registration 340.
- the experiment participant 140 confirms the positions of a, b, c, and d displayed on his / her face and presses the button.
- the display unit transmits a registration message 350g to the processing unit.
- the processing unit transmits an end message ACK350h to the display unit.
- FIG. 10 shows a flow at the time of experiment when the mobile terminal 160 is used.
- the display unit displays a screen of the measurement device mounting 360.
- Experiment participant 140 follows the instructions.
- the display unit displays a screen of face photographing 370.
- the experiment participant 140 photographs his / her face toward the camera 170 and presses a button on the screen.
- the display unit transmits a mounting position display message 400a to the processing unit, and the processing unit transmits a confirmation message ACK400b to the display unit.
- the display unit displays the positions a, b, c, and d registered at the initial setting on the photographed face photo.
- the display unit displays the screen of the mounting position and the positional deviation adjustment 380 of the measuring device 150.
- the experiment participant 140 adjusts while looking at the screen of the mobile terminal 160 so that the self-position display unit 180 of the measuring device 150 matches the designated mounting position (a, b, c, or d). .
- the experiment participant 140 presses a button displayed on the display unit.
- the display unit transmits an adjustment success message 400c to the processing unit.
- the processing unit transmits a response message ACK400d to the display unit.
- the experiment participant 140 starts the experiment according to the instruction of the measurement start 390.
- the measurement end button 395 is pressed.
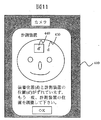
- FIG. 11 and FIG. 12 show examples of application screens 410 and 420 displayed when the headset mounting position and the measuring apparatus 150 mounting position deviation adjustment 380 are performed.
- FIG. 11 shows a case where the mounting position (d) 430 and the position (d ′) 440 of the measuring device 150, that is, the position of the self-position display unit 180 of the measuring device 150 do not match, and the position is displayed at the bottom of the screen. A message indicating a mismatch is displayed. It is also possible to emit a warning sound during a mismatch.
- FIG. 12 shows a case where the mounting position (d) 430 and the position (d ′) 440 of the measuring device 150, that is, the position of the self-position display unit 180 of the measuring device 150 coincide with each other, and the positions overlap on the screen. A message indicating that the match is successful is displayed at the bottom of the screen. It is also possible to sound a buzzer when the mounting position (d) 430 and the position (d ′) 440 of the measuring device 150 match.
- FIGS. Another embodiment of the present invention is shown in FIGS.
- a case will be described in which the mounting position calculation 330 performed by the processing unit of the mobile terminal 160 illustrated in FIG.
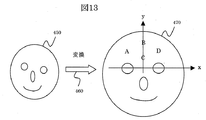
- the 13 is an image of the experiment participant 140 photographed by the camera 170 of the mobile terminal 160.
- the processing unit determines the x coordinate in the direction connecting both eyes of the captured image and the y coordinate in the direction of the perpendicular bisector of both eyes.
- the standard model 470 is a standard face held inside the portable terminal 160, and defines a coordinate system with the X axis as a reference for both eyes, the midpoint of both eyes as the origin, and the top direction as the Y axis.
- the vertex direction of the Y axis is determined by the acceleration sensor of the mobile terminal 160.
- the coordinates of the mounting position are designated in advance as A ( ⁇ 3,3), B (0,5), C (0,2), D (3,3), and the like.
- the application of the portable terminal 160 performs the conversion 460 so that the captured image 450 overlaps the standard model 470.
- the conversion algorithm for example, affine transformation can be applied.
- six parameters of expansion / contraction, rotation, and translation are used for both the x coordinate and the y coordinate. That is, the captured image 450 and the standard model 470 are made to coincide by overlapping the origins of the captured image 450 and the standard model 470 and rotating or expanding / contracting the captured image 450 using six parameters.
- the processing unit performs the inverse coordinate conversion 480 using the six parameters obtained earlier. That is, A (-3,3) to a (-2,2), B (0,5) to b (0,4), C (0,2) to c (0,1), D (3, Calculate d (2,2) etc. from 3). Thereby, the mounting positions a, b, c, and d of the measuring device 150 can be shown on the captured image 490.
- FIG. 15 Another embodiment of the present invention is shown in FIG. 15, FIG. 16, and FIG.
- FIG. 15 Another embodiment of the present invention is shown in FIG. 15, FIG. 16, and FIG.
- FIG. 15 Another embodiment of the present invention is shown in FIG. 15, FIG. 16, and FIG.
- FIG. 15 Another embodiment of the present invention is shown in FIG. 15, FIG. 16, and FIG.
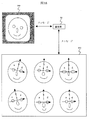
- FIG. 9 a case will be described in which the processing of the wearing position calculation 330 executed by the processing unit of the mobile terminal 160 shown in FIG. 9 is performed based on the face contour.
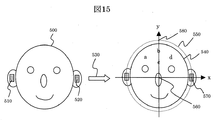
- FIG. 15 shows an example.
- the experiment participant 140 attaches light sources such as light-emitting diodes 510 and 520 to the left and right earlobe.
- the photographed image 500 at this time is the left figure of FIG.
- the processing unit performs coordinate axis superposition 530.
- the processing unit recognizes the positions of the light emitting diodes 510 and 520 from the photographed image 500, connects the positions of the left and right light emitting diodes 510 and 520 to the x axis, and sets the midpoint of the light emitting diode 510 and the light emitting diode 520 as the origin 560 and is perpendicular thereto. Let the direction be the y-axis.
- the position of the light emitting diode 520 is defined as a coordinate (p) 570.
- the coefficient range is 1 to 2
- the result of ellipse approximation 550 is determined so that it is exactly equidistant from the outer periphery of the head of the captured image 540.
- the coordinates (p) 570 and the coordinates (q) 580 are determined, for example, the coordinates of a, b, c, d are a (-p / 3, q / 2), b (0, 4q / 5 ), C (0, 2q / 5), d (p / 3, q / 2), etc.
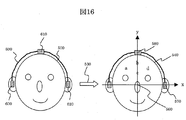
- FIG. 16 shows another example.
- the experiment participant 140 wears a measuring device 590 equipped with light sources such as light-emitting diodes 600, 610, and 620 at the positions of the left and right ears and the top of the head.
- the photographed image 500 at this time is the left figure of FIG.
- the processing unit performs coordinate axis superposition 530.
- the positions of the left and right light emitting diodes 600 and 620 are connected to the x axis
- the middle point of the light emitting diode 600 and the light emitting diode 620 is set to the origin 560
- the direction perpendicular thereto is set to the y axis.
- the position of the light emitting diode 620 is defined as a coordinate (p) 570.
- the position of the light emitting diode 610 is defined as a coordinate (q) 580.
- the coordinates (p) 570 and the coordinates (q) 580 are determined, for example, the coordinates of a, b, c, d are a (-p / 3, q / 2), b (0, 4q / 5 ), C (0, 2q / 5), d (p / 3, q / 2), etc.
- the experiment participant 140 performs the initial setting and the experiment according to the flow of FIG. 9 and FIG.
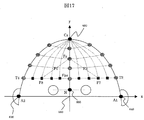
- FIG. 17 shows a method of determining the position of the headset based on the positions of the light emitting diodes 600, 610, and 620 in FIG. This method is based on the international 10-20 method used in electroencephalogram measurements.
- the processing unit first sets the position of the light emitting diode 600 as A2 ( ⁇ p, 0), the position of the light emitting diode 620 as A1 (p, 0), and the position of the light emitting diode 610 as Cz (0, q).
- the midpoint of A1 and A2 is the origin S (0,0). Further, the center of both eyes is, for example, N (0,1).
- a point obtained by dividing N and Cz by 5 is calculated, and a point 1/5 from the N side is Fpz, and a point 3/5 is Fz.
- a point obtained by dividing A1 and Cz into 5 equal parts along the scalp is calculated, and a point 1/5 from A1 is defined as T3.
- the point 1/5 from A2 is T4.
- a point obtained by dividing Fpz and T3 by 5 is calculated, and a point 2/5 from T3 is defined as F7.
- the point 2/5 from T4 is designated as F8.
- the midpoint of Fz and F7 is F3
- the midpoint of Fz and F8 is F4.
- the F4 coordinate is a
- the Fz coordinate is b
- the Fpz coordinate is c
- the F3 coordinate is d.
- the midpoint of Fz and F7 is set to d, but it is of course possible to set the midpoint of Fz and T3 to d.
- FIG. 4 Another embodiment of the present invention is shown in FIG. In this example, a case will be described in which the processing of the mounting position calculation 330, which is performed by the processing unit illustrated in FIG. 9, is performed using face recognition.
- the experiment participant 140 captures a face using the camera 170 of the mobile terminal 160, and the mobile terminal 160 sends the captured image to the base station 30, and the base station 30 transmits the information collection device 50 via the communication network 40. Send to.
- the information collecting apparatus 50 holds a database 670, and a large number of face photographs in which the x-coordinate, y-coordinate, and positions a, b, c, and d are superimposed are registered in the database 670.
- the information collection device 50 calculates the similarity based on the received photographed image and the positions of the eyes and nose of the face photograph registered in the database 670, and sends the image with the highest similarity to the portable terminal 160. As a result, the mounting position can be displayed on the screen of the portable terminal 160.
- a pattern matching method such as template matching or correlation method is applied to the similarity calculation.
- FIGS. Another embodiment of the present invention is shown in FIGS. This example shows the details of the processing process of the information analysis system 80 of FIG.
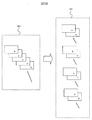
- FIG. 19 shows the processing of the automatic data classification unit 81.
- the automatic data classification unit 81 receives from the information collection device 50 a data group 680 including measurement data acquired by the plurality of measurement devices 150 during the experiment. This measurement data is provided with a label (a or b or c or d) indicating the mounting position, and the measurement data is arranged in the order of acquisition. As shown on the right side of FIG. 19, the automatic data classification unit 81 classifies the measurement data for each label to generate a grouped data group 690.
- FIG. 20 shows the processing of the statistical processing unit 82.
- the statistical processing unit 82 creates a graph by superimposing the measurement data acquired by each measuring device 150 for each mounting position (label), as shown on the left of FIG. At this time, the abnormal value is removed.
- a moving average of the superimposed measurement data is calculated, and a collective pattern 700 characteristic to each mounting position as shown on the right side of FIG. 20 is extracted.
- the diagram in FIG. 20 corresponds to the waveforms of the mounting positions a, b, c, and d in order from the top.
- the upper right diagram in FIG. 20 shows a typical waveform at the mounting position a.
- the cerebral blood volume gradually increases when attention of the advertisement or the program starts, and attention is continued.
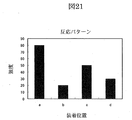
- FIG. 21 shows another process of the statistical processing unit 82.
- the statistical processing unit 82 calculates the intensity for each mounting position from the representative waveform on the right side of FIG. 20, and generates a histogram.
- the intensity is calculated from the area of the waveform, peak value, peak position, and the like. Since the case of reacting to a language or the case of reacting to a non-language corresponds to each mounting position, a reaction pattern 800 when viewing an advertisement can be acquired. In this example, it can be seen that the reaction is strong at the positions a and c shown in the right diagram of FIG.
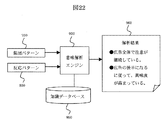
- FIG. 22 shows the processing of the report generation unit 83.
- the report generation unit 83 inputs the collective pattern 700 and the reaction pattern 800 to the semantic analysis engine 900.
- the semantic analysis engine 900 refers to the knowledge database 950 stored in the DB 1250 and outputs an analysis result 960 at the time of advertisement or program viewing from the waveform shape and reaction site information.
- the knowledge database 950 includes a plurality of collective patterns when a measuring device is placed at a position a, a plurality of collective patterns when a measuring device is placed at a position b, and a plurality of collective patterns when a measuring device is placed at a position c. , And a plurality of collective patterns when the measuring device is placed at the position d are accumulated.
- the semantic analysis engine 900 identifies the mounting position of the measuring device from the reaction pattern 800, and among the group patterns accumulated in the mounting position group pattern 700 and the knowledge database 950, data of a plurality of group patterns at the identified mounting position
- the similarity is calculated from the comparison.
- the degree of similarity is compared using, for example, the intensity of reaction or the interval between reactions.
- the report generation unit 83 refers to the knowledge database 950 and measures a plurality of collective patterns of the mounting position a stored in the knowledge database. The similarity with the data is calculated.
- the report generation unit 83 from the calculated similarity, the collective pattern of the mounting position a obtained from the measurement data, among a plurality of collective patterns of the mounting position a stored in the knowledge database, attention is gradually continued, Since it can be seen that the similarity to the group pattern when the degree of interest is high is high, participants in the experiment watched the advertisement gradually while the advertisement was flowing, and the degree of interest Suppose that it is growing.
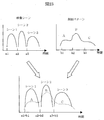
- FIG. 23 shows an example of processing of the semantic analysis engine 900.
- the video pattern is composed of scenes 1, 2, and 3, and time stamps a1, a2, and a3 are assigned to each.
- This time stamp is recorded in a video signal transmitted from the transmitter 60 of FIG. 1 to the receiver 10 or the portable terminal.
- the information analysis system obtains information such as a scene and time stamp of the video signal by some method such as receiving the video signal from the transmitter 60 or obtaining information about the video signal from the client system.
- a characteristic group pattern 700 (group pattern obtained by the analysis of FIG. 20) at a certain mounting position extracted by the statistical processing unit 82 is composed of peaks of A, B, and C, and each includes time stamps b1, b2, and so on. b3 is assigned. This time stamp is given to the measurement data by the clock 275 of the measurement apparatus 150 in FIG.
- the semantic analysis engine 900 when the time stamps of the time stamps a1, a2, a3 of the video signal and the time stamps of the time stamps b1, b2, b3 of the collective pattern of the measurement data of the experiment participants who watched the video signal are different,
- the content of scene 2 of the video signal is, for example, an advertisement in which a specific actress is used, it is determined that the experiment participant is strongly interested in scene 2 of the advertisement in which the specific actress is used. it can.
- the report generator collects such analysis results for each advertisement, and creates a report that evaluates what kind of content the advertisement is collected and created is the most effective for getting the viewers' reaction. And send it to the client system. Then, as shown in FIG. 1 and FIG. 7, the created report is transmitted to the client 70, and a series of sensitivity evaluation processes is completed.
Landscapes
- Business, Economics & Management (AREA)
- Engineering & Computer Science (AREA)
- Accounting & Taxation (AREA)
- Finance (AREA)
- Strategic Management (AREA)
- Development Economics (AREA)
- Physics & Mathematics (AREA)
- Theoretical Computer Science (AREA)
- General Physics & Mathematics (AREA)
- General Business, Economics & Management (AREA)
- Economics (AREA)
- Entrepreneurship & Innovation (AREA)
- Marketing (AREA)
- Game Theory and Decision Science (AREA)
- Data Mining & Analysis (AREA)
- General Health & Medical Sciences (AREA)
- Health & Medical Sciences (AREA)
- Tourism & Hospitality (AREA)
- Oral & Maxillofacial Surgery (AREA)
- Human Computer Interaction (AREA)
- Multimedia (AREA)
- Human Resources & Organizations (AREA)
- Primary Health Care (AREA)
- Measurement Of The Respiration, Hearing Ability, Form, And Blood Characteristics Of Living Organisms (AREA)
- Management, Administration, Business Operations System, And Electronic Commerce (AREA)
Abstract
Description
本発明における感性評価システムの基本構成を図1に示す。感性評価システムは、実験参加者集団5、受信機10a~10c、生体信号計測システム20a~20c、基地局30a~30c、通信網40、情報収集装置50、送信機60、クライアントシステム70、情報解析システム80から構成される。生体信号計測システム20は、取得したデータを無線または有線を利用して基地局30へ送信する。
本発明の他の実施例を図13、図14に示す。本例では、図9に示した携帯端末160の処理部が実行する装着位置計算330の処理を、目を基準にして行なう場合を説明する。
本発明の他の実施例を図15、図16、図17に示す。本例では、図9に示した携帯端末160の処理部で実行される装着位置計算330の処理を、顔の輪郭を基準にして行なう場合を説明する。
本発明の他の実施例を図18に示す。本例では、図9に示した処理部が十s項する装着位置計算330の処理を、顔認識を利用して行なう場合を説明する。実験参加者140は、携帯端末160のカメラ170を利用して顔を撮影し、携帯端末160は、その撮影画像を基地局30に送り、基地局30は通信網40を介して情報収集装置50に送信する。
本発明の他の実施例を図19,20,21,22に示す。本例は、図1の情報解析システム80の処理プロセスの詳細である。
生体計測システム・・・20
基地局・・・30、通信網・・・40
情報収集装置・・・50、送信機・・・60
サーバ・・・51
データベース・・・52,53,1050,1060,1160,1250,1340
クラインアント・・・71,72,73
クライアントシステム・・・80
機能ブロック・・・81,82,83,230,240,250,260
実験参加者・・・140、計測装置・・・150
携帯端末・・・160、カメラ・・・170
メッセージ・・・90,350,400
クロック・・・275
処理ブロック・・・100,110,120,130,290,300,310,320,
330,340,360,370,380,390,395
自己位置表示部・・・180、計測回路部・・・190
デバイス・・・200,210,220,270
装置ID・・・280、アプリケーション画面・・・410,420
撮影画像・・・450,490,500,540
処理・・・460,480,530,550
標準モデル・・・470
座標・・・560,570,580,630,640,650,660
光源・・・510,520,600,610,620,
ヘッドホン・・・590
データベース・・・670,950
データ集団・・・680,690
集団パターン・・・700、反応パターン・・・800
意味解析エンジン・・・900
レポート出力画面・・・960
メモリ・・・1040,1155,1240,1330
プログラム・・・1010,1020,1030,1110,1120,1130,1140,1150,
1210,1220,1230,1300,1310,1320
インタフェースIF・・・1070,1100,1170,1200,1260,1290,1350,1380
プロセッサ・・・1080,1180,1270,1360
キャッシュ・・・1090,1190,1280,1370
Claims (17)
- クライアントシステム、情報解析システム、情報収集装置、計測装置、端末を備えた感性評価システムにおいて、
前記クライアントシステムは、前記情報解析システムに映像情報に関する評価要求を送信し、実験参加者が視聴する前記映像情報を前記各実験参加者が視聴する受信機または前記端末に送信し、
前記端末は、前記実験参加者が前記映像情報を視聴する間に前記実験参加者が装着する前記計測装置で計測した生体信号を、前記情報収集装置を介して前記情報解析システムに送信し、
前記情報解析システムは、前記生体信号を解析し、解析結果に基づいて前記映像情報に関するレポートを作成し、作成したレポートを前記クライアントシステムに送信することを特徴とする感性評価システム。 - 前記端末は、前記実験参加者の顔と、該顔の上に前記計測装置を装着すべき装着位置が重畳された画像を表示することを特徴とする請求項1に記載の感性評価システム。
- 請求項2に記載の感性評価システムにおいて、
前記計測装置は自己位置表示部を備え、
前記端末は、前記実験参加者の顔と、該顔の上に計測装置を装着すべき装着位置が重畳された画像に、さらに、前記自己位置表示部の位置を表示することを特徴とする感性評価システム。 - 請求項3に記載の感性評価システムにおいて、
前記クライアントシステムは、前記受信した解析結果に基づいて、課金情報を前記情報解析システム及び前記情報収集装置に送信することを特徴とする感性評価システム。 - 請求項4に記載の感性評価システムにおいて、
前記課金情報は、前記実験参加者の人数、計測したデータのサイズ、前記情報解析システムのCPU占有時間、前記情報収集装置のCPU占有時間のいづれか1以上に基づいて生成されることを特徴とする感性評価システム。 - 請求項3に記載の感性評価システムにおいて、
前記計測装置は、前記生体信号に該計測装置の装置識別子を付与して該生体信号を前記端末に送信することを特徴とする感性評価システム。 - 請求項3に記載の感性評価システムにおいて、
前記計測装置は、
生体の一部に光を照らして透過光を測定する近赤外分光装置、または、生体の一部の電気信号を測定する脳波計を含むことを特徴とする感性評価システム。 - 請求項3に記載の感性評価システムにおいて、
前記端末は、前記実験参加者の撮影画像を変換して標準モデルと一致させることで変換パラメータを算出し、前記算出した変換パラメータを利用して、前記撮影画像上に前記装着位置の座標を表示することを特徴とする感性評価システム。 - 請求項3に記載の感性評価システムにおいて、
前記端末は、撮影画像上に表示された前記実験参加者に装着された光源の位置を基に、x、y座標軸を設定し、前記座標軸に基づいて装着位置の座標を決定することを特徴とする感性評価システム。 - 請求項3に記載の感性評価システムにおいて、
前記情報解析システムは、座標付きの複数の顔画像を保持するデータベースを備え、
前記端末は、撮影した実験参加者の画像をデータベースに送信し、前記データベースに格納された座標付きの複数の顔画像の中から、最も類似度の高い顔画像に基づいて、前記計測装置の装着位置の座標を決定することを特徴とする感性評価システム。 - 請求項1に記載の感性評価システムにおいて、
前記情報解析システムは、
複数の計測装置で測定された測定データを装着位置ラベルごとに分類し、
分類した装着位置ラベル毎の測定波形データパターンを算出し、
前記測定波形データパターンに基づいて装着位置ラベル毎の強度パターンを算出し、
前記測定波形データパターン及び強度パターンに基づいて前記解析結果を抽出することを特徴とする感性評価システム。 - 請求項11に記載の感性評価システムにおいて、
前記映像信号にはタイムスタンプが付与されており、
前記計測装置は、前記計測データにタイムスタンプを付与し、
前記情報解析システムは、前記映像信号に付与された複数のタイムスタンプと前記計測データに付与された複数のタイムスタンプのタイムスタンプ間の時間軸を調整し、調整結果に基づいて、前記解析結果を得ることを特徴とする感性評価システム。 - 請求項12に記載の感性評価システムにおいて、
前記解析システムは、
前記計測装置の装着位置毎の生体信号の複数の集団パターンを保持し、
前記複数の集団パターンと前記測定波形データパターンの類似度の比較し、前記解析結果を算出することを特徴とする感性評価システム。 - 請求項13に記載の感性評価システムにおいて、
前記計測装置は、
さらに、複数のセンサー、制御回路、CPU,光源、無線通信部を備え、
前記自己位置表示部は前記端末に該計測装置の装着位置を表示するための光源であることを特徴とする感性評価システム。 - 映像信号を視聴する実験参加者の生体信号を計測する計測装置であって、
前記計測装置は、複数のセンサー、制御回路、CPU,光源、無線通信部、自己位置表示部を備え、
前記自己位置表示部は、前記実験参加者が保持する端末に該計測装置の装着位置を表示するための光源であることを特徴とする計測装置。 - 配信される映像情報を評価する感性評価方法において、
クライアントシステムは、情報解析システムに映像情報に関する評価要求を送信し、実験参加者が視聴する前記映像情報を前記各実験参加者が視聴する受信機または端末に送信し、
前記端末は、前記実験参加者が前記映像情報を視聴する間に前記実験参加者が装着する計測装置で計測した生体信号を情報収集装置を介して前記情報解析システムに送信し、
前記情報解析システムは、前記生体信号を解析し、解析結果に基づいて前記映像情報に関するレポートを作成し、作成したレポートを前記クライアントシステムに送信することを特徴とする感性評価方法。 - 請求項16に記載の感性評価方法において、
前記クライアントシステムは、前記受信した解析結果に基づいて、課金情報を前記情報解析システム及び前記情報収集装置に送信することを特徴とする感性評価方法。
Priority Applications (5)
| Application Number | Priority Date | Filing Date | Title |
|---|---|---|---|
| CN201280078164.5A CN104937631B (zh) | 2012-11-26 | 2012-11-26 | 感性评价系统和方法 |
| US14/655,422 US20160005058A1 (en) | 2012-11-26 | 2012-11-26 | Sensitivity evaluation system |
| JP2014548405A JP5997776B2 (ja) | 2012-11-26 | 2012-11-26 | 感性評価システム |
| EP12888803.9A EP2924645A4 (en) | 2012-11-26 | 2012-11-26 | SENSITIVITY ASSESSMENT SYSTEM |
| PCT/JP2012/080418 WO2014080509A1 (ja) | 2012-11-26 | 2012-11-26 | 感性評価システム |
Applications Claiming Priority (1)
| Application Number | Priority Date | Filing Date | Title |
|---|---|---|---|
| PCT/JP2012/080418 WO2014080509A1 (ja) | 2012-11-26 | 2012-11-26 | 感性評価システム |
Publications (1)
| Publication Number | Publication Date |
|---|---|
| WO2014080509A1 true WO2014080509A1 (ja) | 2014-05-30 |
Family
ID=50775714
Family Applications (1)
| Application Number | Title | Priority Date | Filing Date |
|---|---|---|---|
| PCT/JP2012/080418 Ceased WO2014080509A1 (ja) | 2012-11-26 | 2012-11-26 | 感性評価システム |
Country Status (5)
| Country | Link |
|---|---|
| US (1) | US20160005058A1 (ja) |
| EP (1) | EP2924645A4 (ja) |
| JP (1) | JP5997776B2 (ja) |
| CN (1) | CN104937631B (ja) |
| WO (1) | WO2014080509A1 (ja) |
Families Citing this family (3)
| Publication number | Priority date | Publication date | Assignee | Title |
|---|---|---|---|---|
| JP6354264B2 (ja) * | 2014-03-31 | 2018-07-11 | 富士通株式会社 | 認証システム、認証装置、認証方法、及び認証プログラム |
| US10852323B2 (en) * | 2018-12-28 | 2020-12-01 | Rohde & Schwarz Gmbh & Co. Kg | Measurement apparatus and method for analyzing a waveform of a signal |
| JP2021007480A (ja) * | 2019-06-28 | 2021-01-28 | トヨタ自動車株式会社 | 装具データ提供システム |
Citations (3)
| Publication number | Priority date | Publication date | Assignee | Title |
|---|---|---|---|---|
| JP2000156243A (ja) | 1998-11-18 | 2000-06-06 | Sony Corp | 非水電解液電池 |
| JP2012014614A (ja) | 2010-07-05 | 2012-01-19 | Dentsu Inc | 感性マーケティング手法 |
| JP2012120665A (ja) * | 2010-12-08 | 2012-06-28 | Terumo Corp | 電気刺激装置および電極リード |
Family Cites Families (14)
| Publication number | Priority date | Publication date | Assignee | Title |
|---|---|---|---|---|
| JP3543453B2 (ja) * | 1995-12-01 | 2004-07-14 | 株式会社日立製作所 | 光生体計測法を用いた生体入力装置 |
| JP4399666B2 (ja) * | 2003-09-19 | 2010-01-20 | 株式会社日立メディコ | 生体信号処理装置 |
| JP4655821B2 (ja) * | 2005-08-23 | 2011-03-23 | 株式会社日立製作所 | 脳機能計測用刺激呈示装置 |
| WO2008032234A1 (en) * | 2006-09-11 | 2008-03-20 | Philips Intellectual Property & Standards Gmbh | System and method for positioning electrodes on a patient body |
| US20090253996A1 (en) * | 2007-03-02 | 2009-10-08 | Lee Michael J | Integrated Sensor Headset |
| JP2007323659A (ja) * | 2007-06-18 | 2007-12-13 | Ricoh Co Ltd | 画像データ管理システム、画像データ管理システム動作プログラム |
| JP4991431B2 (ja) * | 2007-07-31 | 2012-08-01 | 株式会社日立製作所 | 脳機能計測による外部環境制御装置 |
| US8327395B2 (en) * | 2007-10-02 | 2012-12-04 | The Nielsen Company (Us), Llc | System providing actionable insights based on physiological responses from viewers of media |
| US20110066020A1 (en) * | 2008-03-13 | 2011-03-17 | Alexander Svojanovsky | Multi-channel eeg electrode system |
| JP5210733B2 (ja) * | 2008-07-07 | 2013-06-12 | 株式会社日立メディコ | 刺激呈示機能を有する生体光計測装置及び刺激課題呈示方法 |
| CN102203813B (zh) * | 2008-11-04 | 2014-04-09 | 株式会社日立制作所 | 信息处理系统 |
| JP2011065504A (ja) * | 2009-09-18 | 2011-03-31 | Tokyo Univ Of Science | ユーザの選好関係についての予測モデルを生成する選好予測サーバ及びその方法 |
| JP5386594B2 (ja) * | 2009-11-27 | 2014-01-15 | 株式会社日立製作所 | 生体光計測装置 |
| JP5470231B2 (ja) * | 2010-12-08 | 2014-04-16 | 株式会社日立製作所 | 生体光計測システム、生体光計測装置及び計測位置検出方法 |
-
2012
- 2012-11-26 WO PCT/JP2012/080418 patent/WO2014080509A1/ja not_active Ceased
- 2012-11-26 US US14/655,422 patent/US20160005058A1/en not_active Abandoned
- 2012-11-26 EP EP12888803.9A patent/EP2924645A4/en not_active Ceased
- 2012-11-26 CN CN201280078164.5A patent/CN104937631B/zh not_active Expired - Fee Related
- 2012-11-26 JP JP2014548405A patent/JP5997776B2/ja not_active Expired - Fee Related
Patent Citations (3)
| Publication number | Priority date | Publication date | Assignee | Title |
|---|---|---|---|---|
| JP2000156243A (ja) | 1998-11-18 | 2000-06-06 | Sony Corp | 非水電解液電池 |
| JP2012014614A (ja) | 2010-07-05 | 2012-01-19 | Dentsu Inc | 感性マーケティング手法 |
| JP2012120665A (ja) * | 2010-12-08 | 2012-06-28 | Terumo Corp | 電気刺激装置および電極リード |
Non-Patent Citations (3)
| Title |
|---|
| HITACHI, LTD.: "Intage to Hitachi ga Neuro Marketing Bun'ya de Kyogyo Hikari Topography Gijutsu o Katsuyo shita Research Service o Intage yori Teikyo Kaishi", 18 October 2012 (2012-10-18), XP008179307, Retrieved from the Internet <URL:http://WWW.hitachi.co.jp/New/cnews/month/2012/10/1018b.pdf> [retrieved on 20121227] * |
| HITACHI, LTD.: "Wearable Hikari Topography WOT-200 WOT-100 Fukusunin no No o Doji Keisoku", September 2012 (2012-09-01), XP008180080, Retrieved from the Internet <URL:http://www.hitachi.co.jp/products/ot/images/catalog/WOT-220100121002.pdf> [retrieved on 20121227] * |
| See also references of EP2924645A4 |
Also Published As
| Publication number | Publication date |
|---|---|
| JPWO2014080509A1 (ja) | 2017-01-05 |
| JP5997776B2 (ja) | 2016-09-28 |
| EP2924645A4 (en) | 2016-10-05 |
| US20160005058A1 (en) | 2016-01-07 |
| EP2924645A1 (en) | 2015-09-30 |
| CN104937631A (zh) | 2015-09-23 |
| CN104937631B (zh) | 2018-07-03 |
Similar Documents
| Publication | Publication Date | Title |
|---|---|---|
| Speth et al. | Deception detection and remote physiological monitoring: A dataset and baseline experimental results | |
| Jiang et al. | Memento: An emotion-driven lifelogging system with wearables | |
| US11151610B2 (en) | Autonomous vehicle control using heart rate collection based on video imagery | |
| US20200294670A1 (en) | System and method for real-time estimation of emotional state of user | |
| Hernandez et al. | Using electrodermal activity to recognize ease of engagement in children during social interactions | |
| JP2012524458A (ja) | 対話的活動に関するユーザ体験を測定するための方法及びシステム | |
| RU2708807C2 (ru) | Алгоритм комплексного дистанционного бесконтактного мультиканального анализа психоэмоционального и физиологического состояния объекта по аудио- и видеоконтенту | |
| US20250107734A1 (en) | System and method for deep analytics and strategic monetization of biomedical sensor data | |
| CN110013261B (zh) | 情绪监测的方法、装置、电子设备及存储介质 | |
| US20220383896A1 (en) | System and method for collecting behavioural data to assist interpersonal interaction | |
| KR20090031772A (ko) | 휴대용 사용자 기구의 사용을 모니터링하는 방법, 모니터링시스템, 데이터 수집 방법, 데이터 수집 시스템 | |
| CN101589358A (zh) | 脑波识别方法的调整装置、方法及计算机程序 | |
| CN109949935A (zh) | 一种基于人工智能的个性化终端服务校园健康平台 | |
| JP5997776B2 (ja) | 感性評価システム | |
| CN107609334A (zh) | 一种现场观众反应分析系统及方法 | |
| CN112232861A (zh) | 一种基于神经相似性分析的平面广告测评方法及系统 | |
| CN115758097A (zh) | 多模态人因智能状态识别模型创建及实时状态监测方法、系统及存储介质 | |
| CN120549485A (zh) | 基于多模态数据融合的情感指标反馈监测方法、装置、设备及存储介质 | |
| Rafique et al. | Towards estimation of emotions from eye pupillometry with low-cost devices | |
| US20240324964A1 (en) | Edge-intelligent Iot-based Wearable Device For Detection of Cravings in Individuals | |
| CN121533737B (zh) | 基于中医数据的ai心理健康监控方法、装置及电子设备 | |
| CN111079692A (zh) | 用于k12教育阶段基于人脸识别的校园行为分析方法 | |
| US20250316396A1 (en) | Portable computer devices having eye-tracking capability for patient data and network-connected computing systems for clustering multi-faceted data of patients | |
| CN120280075A (zh) | 一种儿童行为特征识别的护理方案推荐方法 | |
| KR20230030185A (ko) | 실시간 온라인 코칭 시스템 |
Legal Events
| Date | Code | Title | Description |
|---|---|---|---|
| 121 | Ep: the epo has been informed by wipo that ep was designated in this application |
Ref document number: 12888803 Country of ref document: EP Kind code of ref document: A1 |
|
| NENP | Non-entry into the national phase |
Ref country code: DE |
|
| ENP | Entry into the national phase |
Ref document number: 2014548405 Country of ref document: JP Kind code of ref document: A |
|
| WWE | Wipo information: entry into national phase |
Ref document number: 14655422 Country of ref document: US |
|
| WWE | Wipo information: entry into national phase |
Ref document number: 2012888803 Country of ref document: EP |