WO2014163037A1 - 分析装置及び自動分析装置 - Google Patents
分析装置及び自動分析装置 Download PDFInfo
- Publication number
- WO2014163037A1 WO2014163037A1 PCT/JP2014/059434 JP2014059434W WO2014163037A1 WO 2014163037 A1 WO2014163037 A1 WO 2014163037A1 JP 2014059434 W JP2014059434 W JP 2014059434W WO 2014163037 A1 WO2014163037 A1 WO 2014163037A1
- Authority
- WO
- WIPO (PCT)
- Prior art keywords
- light
- wavelength
- reagent
- cell
- sample
- Prior art date
- Legal status (The legal status is an assumption and is not a legal conclusion. Google has not performed a legal analysis and makes no representation as to the accuracy of the status listed.)
- Ceased
Links
Images


Classifications
-
- G—PHYSICS
- G01—MEASURING; TESTING
- G01N—INVESTIGATING OR ANALYSING MATERIALS BY DETERMINING THEIR CHEMICAL OR PHYSICAL PROPERTIES
- G01N35/00—Automatic analysis not limited to methods or materials provided for in any single one of groups G01N1/00 - G01N33/00; Handling materials therefor
- G01N35/02—Automatic analysis not limited to methods or materials provided for in any single one of groups G01N1/00 - G01N33/00; Handling materials therefor using a plurality of sample containers moved by a conveyor system past one or more treatment or analysis stations
- G01N35/025—Automatic analysis not limited to methods or materials provided for in any single one of groups G01N1/00 - G01N33/00; Handling materials therefor using a plurality of sample containers moved by a conveyor system past one or more treatment or analysis stations having a carousel or turntable for reaction cells or cuvettes
-
- G—PHYSICS
- G01—MEASURING; TESTING
- G01N—INVESTIGATING OR ANALYSING MATERIALS BY DETERMINING THEIR CHEMICAL OR PHYSICAL PROPERTIES
- G01N21/00—Investigating or analysing materials by the use of optical means, i.e. using sub-millimetre waves, infrared, visible or ultraviolet light
- G01N21/17—Systems in which incident light is modified in accordance with the properties of the material investigated
- G01N21/25—Colour; Spectral properties, i.e. comparison of effect of material on the light at two or more different wavelengths or wavelength bands
- G01N21/251—Colorimeters; Construction thereof
- G01N21/253—Colorimeters; Construction thereof for batch operation, i.e. multisample apparatus
-
- G—PHYSICS
- G01—MEASURING; TESTING
- G01N—INVESTIGATING OR ANALYSING MATERIALS BY DETERMINING THEIR CHEMICAL OR PHYSICAL PROPERTIES
- G01N21/00—Investigating or analysing materials by the use of optical means, i.e. using sub-millimetre waves, infrared, visible or ultraviolet light
- G01N21/17—Systems in which incident light is modified in accordance with the properties of the material investigated
- G01N21/47—Scattering, i.e. diffuse reflection
- G01N21/49—Scattering, i.e. diffuse reflection within a body or fluid
- G01N21/51—Scattering, i.e. diffuse reflection within a body or fluid inside a container, e.g. in an ampoule
-
- G—PHYSICS
- G01—MEASURING; TESTING
- G01N—INVESTIGATING OR ANALYSING MATERIALS BY DETERMINING THEIR CHEMICAL OR PHYSICAL PROPERTIES
- G01N21/00—Investigating or analysing materials by the use of optical means, i.e. using sub-millimetre waves, infrared, visible or ultraviolet light
- G01N21/75—Systems in which material is subjected to a chemical reaction, the progress or the result of the reaction being investigated
- G01N21/77—Systems in which material is subjected to a chemical reaction, the progress or the result of the reaction being investigated by observing the effect on a chemical indicator
- G01N21/82—Systems in which material is subjected to a chemical reaction, the progress or the result of the reaction being investigated by observing the effect on a chemical indicator producing a precipitate or turbidity
-
- G—PHYSICS
- G01—MEASURING; TESTING
- G01N—INVESTIGATING OR ANALYSING MATERIALS BY DETERMINING THEIR CHEMICAL OR PHYSICAL PROPERTIES
- G01N35/00—Automatic analysis not limited to methods or materials provided for in any single one of groups G01N1/00 - G01N33/00; Handling materials therefor
- G01N35/10—Devices for transferring samples or any liquids to, in, or from, the analysis apparatus, e.g. suction devices, injection devices
- G01N35/1002—Reagent dispensers
-
- G—PHYSICS
- G01—MEASURING; TESTING
- G01N—INVESTIGATING OR ANALYSING MATERIALS BY DETERMINING THEIR CHEMICAL OR PHYSICAL PROPERTIES
- G01N21/00—Investigating or analysing materials by the use of optical means, i.e. using sub-millimetre waves, infrared, visible or ultraviolet light
- G01N21/75—Systems in which material is subjected to a chemical reaction, the progress or the result of the reaction being investigated
- G01N21/77—Systems in which material is subjected to a chemical reaction, the progress or the result of the reaction being investigated by observing the effect on a chemical indicator
- G01N21/82—Systems in which material is subjected to a chemical reaction, the progress or the result of the reaction being investigated by observing the effect on a chemical indicator producing a precipitate or turbidity
- G01N2021/825—Agglutination
-
- G—PHYSICS
- G01—MEASURING; TESTING
- G01N—INVESTIGATING OR ANALYSING MATERIALS BY DETERMINING THEIR CHEMICAL OR PHYSICAL PROPERTIES
- G01N35/00—Automatic analysis not limited to methods or materials provided for in any single one of groups G01N1/00 - G01N33/00; Handling materials therefor
- G01N35/02—Automatic analysis not limited to methods or materials provided for in any single one of groups G01N1/00 - G01N33/00; Handling materials therefor using a plurality of sample containers moved by a conveyor system past one or more treatment or analysis stations
- G01N35/04—Details of the conveyor system
- G01N2035/0439—Rotary sample carriers, i.e. carousels
-
- G—PHYSICS
- G01—MEASURING; TESTING
- G01N—INVESTIGATING OR ANALYSING MATERIALS BY DETERMINING THEIR CHEMICAL OR PHYSICAL PROPERTIES
- G01N2201/00—Features of devices classified in G01N21/00
- G01N2201/06—Illumination; Optics
- G01N2201/061—Sources
-
- G—PHYSICS
- G01—MEASURING; TESTING
- G01N—INVESTIGATING OR ANALYSING MATERIALS BY DETERMINING THEIR CHEMICAL OR PHYSICAL PROPERTIES
- G01N2201/00—Features of devices classified in G01N21/00
- G01N2201/12—Circuits of general importance; Signal processing
Definitions
- the present invention relates to a method and apparatus for measuring scattered light of a fine particle aggregation reaction using an antigen-antibody reaction, and more particularly to a method for measuring scattered light on an automatic analyzer.
- test items include LDH (lactate dehydrogenase), ALP (alkaline phosphatase), AST (aspartate oxoglutarate aminoton rafenase) and the like.
- Analysis using the latter reaction is called immunoassay, and test items include CRP (C-reactive protein), IgG (immunoglobulin), and RF (rheumatoid factor).
- CRP C-reactive protein
- IgG immunoglobulin
- RF rheumatoid factor
- Latex immunoassay using latex particles as a sensitizer is used.
- antigens to be measured contained in a sample are recognized and bound by the antibody on the surface of latex particles contained in the reagent.
- latex particles aggregate through the antigens to form latex particle aggregates.
- a conventional automatic analyzer light is irradiated to the reaction solution in which the aggregates are dispersed, and the amount of transmitted light transmitted without being scattered by the aggregates of latex particles is measured.
- concentration of the antigen can be quantified from the amount of light measured as reaction process data.
- Patent Document 1 discloses a system that separates transmitted light and scattered light using a diaphragm and simultaneously measures the transmitted light and scattered light.
- Patent Document 2 discloses a system that automatically calculates a difference between detected light intensities of two wavelengths in an automatic analyzer and calculates an analysis result.
- Patent Document 3 discloses a system for measuring exogenous macromolecules in blood by taking a difference between detection signals including transmitted light and scattered light at wavelengths of 670 nm and 940 nm.
- JP 2001-141654 A Japanese Patent Laid-Open No. 03-065654 Japanese Unexamined Patent Publication No. 06-038947
- Patent Document 2 Although noise can be reduced in absorbance by calculating data of a plurality of wavelengths, a method of calculating scattered light data is not disclosed.
- Patent Document 3 is an exogenous macromolecule to be measured, and is not a method capable of acquiring reaction process data in latex immunoassay.
- latex particles contained in reagents for latex immunoassay vary in density in the reaction solution depending on the type of reagent, and the influence of noise due to disturbance substances such as bubbles and dust varies depending on the reagent. Therefore, there is a demand for a noise canceling method that is less affected by the type of reagent using the same optical system.
- the light having the first wavelength and the light having the second wavelength longer than the first wavelength are irradiated to the cell containing the reaction liquid in which the sample and the reagent are mixed in the same optical path, and the scattered light having the respective wavelengths is irradiated. Is received. Then, a signal obtained by subtracting a signal obtained by multiplying the change amount of the scattered light of the second wavelength by the reagent coefficient depending on the reagent from the signal indicating the change amount of the scattered light of the first wavelength changed by the aggregation reaction in the reaction solution is obtained. Determine the amount of the component in the sample based on the signal.
- the reagent includes latex particles having an antibody bound to a surface with a diameter of 50 nm to 500 nm, and uses light in the range of 0.65 ⁇ m to 0.75 ⁇ m as the first wavelength.
- the reagent coefficient the intensity ratio of the first wavelength light and the second wavelength light transmitted through the cell can be used, but the reagent coefficient for each reagent is stored in advance in the storage unit, and is read as appropriate. You may make it use.
- the schematic diagram explaining the time passage of the scattered light measured in the antigen antibody reaction Schematic which shows the example of whole structure of one Example of an automatic analyzer. Schematic of a scattered light measurement part. Schematic of a light source unit. Schematic of a scattered light receiving part. The figure which shows the influence of the noise by a bubble, and a calculation result.
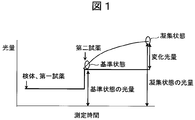
- FIG. 1 is a schematic diagram illustrating the time course of scattered light measured in an antigen-antibody reaction.
- a sample added with the first reagent is mixed with a second reagent in which latex particles having a diameter of 50 nm to 500 nm are dispersed (reference state), and after a certain period of time (aggregation) The amount of change in the scattered light or transmitted light in the state) is detected.
- calibration data obtained by measuring the amount of change using an antigen with a known concentration is prepared, and the concentration of the antigen in the sample is calculated by comparing with the data.
- calibration data is prepared from signals of the first wavelength and the second wavelength of scattered light using signals after calculation described later.
- the amount of change light is also proportional to the intensity of irradiation light
- adjustment is performed in advance so that the difference in light source intensity between the first wavelength and the second wavelength is within 20%.
- a light source intensity ratio between the first wavelength and the second wavelength is measured, and the scattered light intensity is divided by using the ratio, thereby suppressing variations in scattered light intensity due to variations in light source intensity.
- pure water is put into the cell, and the transmitted light intensity ratio between the first wavelength and the second wavelength transmitted through the cell is measured, and the scattered light intensity is divided by using the ratio to divide the scattered light intensity. You may correct the dispersion
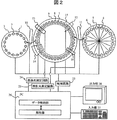
- FIG. 2 is a schematic diagram showing an example of the overall configuration of an embodiment of an automatic analyzer.
- the automatic analyzer of this embodiment can measure scattered light simultaneously with transmitted light.
- the automatic analyzer according to this embodiment includes three types of disks, a sample disk 3, a reagent disk 6 and a cell disk 9, a dispensing mechanism for moving samples and reagents between these disks, a control circuit 23 for controlling these, A transmitted light measurement circuit 24, a scattered light measurement circuit 25, a data processing unit 26 such as a PC (computer) that processes the measured data, an input unit 27 that is an interface for inputting / outputting data to / from the data processing unit 26, and an output unit 28
- the data processing unit 26 includes an analysis unit that analyzes data, and a data storage unit that stores control data, measurement data, data used for analysis, analysis result data, and the like.
- a plurality of sample cups 2 containing samples 1 are arranged on the circumference of the sample disk 3.
- a plurality of reagent bottles 5 containing the reagents 4 are arranged on the reagent disk 6.
- the sample dispensing mechanism 10 moves the sample 1 from the sample cup 2 to the cell 8 by a certain amount.
- the reagent dispensing mechanism 11 moves the reagent 4 from the reagent bottle 5 to the cell 8 by a certain amount.
- the stirring unit 12 stirs and mixes the sample 1 and the reagent 4 in the cell 8.
- the cleaning unit 14 discharges the reaction solution 7 from the cell 8 after the analysis and cleans it.
- the next sample 1 is again dispensed from the sample dispensing mechanism 10 into the washed cell 8, and a new reagent 4 is dispensed from the reagent dispensing mechanism 11 and used for another reaction.
- the cell 8 is immersed in a constant temperature fluid 15 in a constant temperature bath whose temperature and flow rate are controlled, and the cell 8 and the reaction liquid 7 in the cell 8 are moved while being maintained at a constant temperature.
- a constant temperature fluid 15 for example, water is used as the constant temperature fluid 15, and the constant temperature fluid temperature is adjusted to 37 ⁇ 0.1 ° C. by the control circuit 23.
- a transmitted light measuring unit 13 and a scattered light measuring unit 16 are provided on a part of the circumference of the cell disk.
- the transmitted light measurement unit 13 may be configured to irradiate light from a halogen lamp light source to the cell 8, disperse the transmitted light with a diffraction grating, and then receive the light with a photodiode array.
- the wavelengths received are, for example, 340 nm, 405 nm, 450 nm, 480 nm, 505 nm, 546 nm, 570 nm, 600 nm, 660 nm, 700 nm, 750 nm, and 800 nm.
- the transmitted light amount data received by the photodiode array is sent to the data storage unit in the PC through the transmitted light measurement circuit 24.
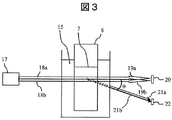
- FIG. 3 is a schematic diagram of the scattered light measurement unit 16.
- the light source for example, an LED light source or the like can be used.
- Irradiated light 18a, 18b from the LED light source unit 17 is irradiated to the moving cell 8, and the transmitted light 19a, 19b is received by the transmitted light receiving unit 20 and scattered.
- Lights 21 a and 21 b are received by the scattered light receiver 22.
- Irradiation light 18a, 18b, transmitted light 19a, 19b, and scattered light 21a, 21b are light of different wavelengths and pass through the same spatial region.
- the wavelength for measuring scattered light may be a wavelength included in 650 nm to 750 nm and a longer wavelength, preferably 900 nm or more.
- FIG. 4 is a schematic view of the LED light source unit 17.
- the light emitted from the LED light source unit 17 has light of at least two wavelengths. For example, light having a wavelength of 700 nm from the LED 31a and light having a wavelength of 950 nm from the LED 31b are combined by the half mirror 32 as shown in FIG. After being adjusted to the same optical axis, it is emitted as irradiation light 18.
- single-wavelength LEDs 31a and 31b are used as light sources, but white LEDs, lasers, xenon lamps, and halogen lamps may be used.
- a halogen lamp that emits white light is used as the light source
- the light quantity at the wavelength of 700 nm and the light quantity at the wavelength of 950 nm may be measured by performing spectroscopy in the light receiving unit.
- the scattered light receiving unit 22 measures scattered light 21a and 21b in a direction away from the optical axis by an angle ⁇ in the air.
- the scattered light receiving unit 22 is disposed in a plane substantially perpendicular to the moving direction of the cell 8 due to the rotation of the cell disk 9.
- the reference position of the angle ⁇ is the starting point at the center of the length that allows light to pass through the cell 8.
- FIG. 5 is a schematic diagram of the scattered light receiving unit 22.
- the scattered light receiving unit 22 has a function of splitting light. For example, using a dichroic mirror 34, the scattered light is separated into light having a first wavelength of 700 nm and light having a second wavelength of 950 nm. Receive light at.
- the scattered light receiving unit 22 separates the light into two wavelengths.
- white light such as a halogen lamp is used as the irradiation light
- the scattered light receiving unit 22 is a spectroscopic unit incorporating a diffraction grating or the like. Also good.
- Quantitative determination of the substance to be measured in sample 1 is performed according to the following procedure. First, a certain amount of sample 1 in the sample cup 2 is dispensed into the cell 8 by the sample dispensing mechanism 10. Next, a predetermined amount of the reagent 4 in the reagent bottle 5 is dispensed into the cell 8 by the reagent dispensing mechanism 11. At the time of dispensing, the sample disk 3, the reagent disk 6, and the cell disk 9 are rotationally driven by the respective drive units under the control of the control circuit 23, so that the sample cup 2, the reagent bottle 5, and the cell 8 are dispensed. , 11 in accordance with the dispensing timing.
- reaction solution 7 The transmitted light and scattered light from the reaction liquid 7 are measured each time the cell disk 9 rotates and passes through the measurement positions of the transmitted light measurement unit 13 and the scattered light measurement unit 16, and the transmitted light measurement circuit 24, scattered light is measured.
- Reaction process data is sequentially accumulated from the measurement circuit 25 to the data storage unit of the data processing unit 26. After measurement for a certain time, for example, about 10 minutes, the inside of the cell 8 is cleaned by the cleaning unit 14 and the next inspection item is analyzed.
- reaction process data of the reaction solution 7 having a constant time interval is stored in the data storage unit.
- the analysis unit obtains a change in the amount of light due to the reaction for a certain period of time, and based on the calibration curve data stored in the data storage unit in advance, the quantitative result is calculated, from the output unit Is displayed.
- Data necessary for control / analysis of each unit is input from the input unit 27 to the data storage unit of the data processing unit 26.
- Data, results, and alarms in various storage units are output on the display or the like by the output unit 28.
- At least two wavelengths of light are irradiated onto the reaction solution in the same optical path, scattered light emitted from the reaction solution is received, and a scattered light signal between the two wavelengths is used using a reagent coefficient determined for each reagent.
- the amount of change (noise) due to disturbance substances is reduced.
- noise is reduced by subtracting a value obtained by multiplying the scattered light signal by the light on the long wavelength side of the two wavelengths light by the reagent coefficient from the scattered light signal by the light on the short wavelength side.
- the reagent coefficient k is a method of obtaining from the transmitted light intensity from the reaction solution immediately after the start of the reaction, it may be set before measurement for each reagent used.
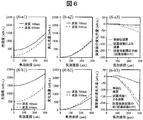
- FIG. 6 is a diagram showing the influence of noise caused by bubbles and the calculation results.
- FIGS. 6-a1 and 6-b1 are simulations of scattered light intensities at a first wavelength of 700 nm and a second wavelength of 950 nm when bubbles as disturbance substances adhere to the cell wall and grow. is there.
- the position of the bubble is assumed to be the cell wall on the light receiving unit side, but the same result is obtained even when the bubble adheres to the cell wall on the irradiation light side. That is, when bubbles adhere to the cell wall of the light receiving unit, the irradiated light that has passed through the reaction solution and attenuated is scattered by the bubbles, and when bubbles adhere to the irradiated light side cell wall, the irradiated light is scattered by the bubbles. After that, it permeates through the reaction solution and attenuates.
- the rate at which the light impinging on the bubbles is scattered and the rate of attenuation due to the permeation of the reaction liquid do not depend on the wall to which the bubble adheres. Regardless, it becomes almost equal.
- Bubbles and dust in the reaction solution are sufficiently large with respect to the wavelength used for measurement, and a large proportion is included in the bubble diameter range shown in FIG.
- the diagrams (6-a1) and (6-b1) are equivalent to absorbances 0.08 (abs) and 0.30 (abs) at a wavelength of 700 nm (absorbance at a wavelength of 950 nm is 0.03 (abs), It is the data in the reaction liquid containing latex particles with a diameter of 300 nm of 0.13 (abs)).
- FIGS. 6-a2 and 6-b2 show the scattered light generated from the bubbles having the respective diameters when the bubbles grow and the diameter increases. It is a figure of the change light quantity shown on the basis of the scattered light intensity when there is nothing.
- the transmitted light intensity I t of the reaction solution immediately after the start of the reaction (700 nm), obtaining the reagent coefficient k from the ratio of I t (950 nm).
- the irradiation light intensity I 0 for each wavelength is adjusted to be the same, in the case of FIG. 6-a1 (0.08 (abs) at a wavelength of 700 nm), the optical path length is 5 mm. And the reagent coefficient k is It is. Similarly, in the case of FIG. 6-b1 (0.30 (abs) at a wavelength of 700 nm), the reagent coefficient k is 0.82.
- the transmitted light intensity from the reaction solution immediately after the start of the reaction to be used the value measured by the transmitted light measurement unit may be used.
- the reagent coefficient may be set for each reagent before measurement, stored in the data storage unit, and extracted and used.
- the difference in the amount of change in the scattered light due to the bubbles increases as the light having a wavelength of 950 nm is larger than the wavelength of 700 nm and the absorbance of the reagent is higher.
- the reagent particle diameter is generally in the range of 50 nm to 500 nm, the absorbance of the reagent is different between the short wavelength and the long wavelength, and the transmitted light irradiated to disturbance substances such as bubbles and dust is smaller as the wavelength is shorter. This is because the amount of change due to the disturbance substance becomes smaller as the wavelength becomes shorter.
- the subtraction width between the two wavelengths may increase depending on the reagent, but the reagent reflects the transmitted light intensity from the reaction solution immediately after the start of the reaction.
- the coefficient it is possible to suppress the amount of change due to the disturbance substance to 1 ⁇ 4 or less compared to simple subtraction (see FIGS. 6-a3 and 6-b3).
- the amount of change due to the reaction is larger at shorter wavelengths in the wavelength range of visible light or more. Therefore, by using the above subtraction result, it is possible to suppress the influence of the disturbance substance and capture the amount of change due to the reaction.
- the reagent coefficient k is calculated based on the amount of change I s (700 nm) and I s (950 nm) of the scattered light at the wavelengths of 700 nm and 950 nm.
- Is used to calculate ⁇ I s-cal I s (700 nm) ⁇ k ⁇ I s (950 nm) ⁇ , and the operation result I s-cal is collated with the calibration curve data held in the data storage unit. Quantify the amount of components in it. Thereby, the influence of the bubble and dust adhering to a cell wall can be reduced, and a highly accurate quantitative analysis can be performed.
- this invention is not limited to the above-mentioned Example, Various modifications are included.
- the above-described embodiments have been described in detail for easy understanding of the present invention, and are not necessarily limited to those having all the configurations described.
- a part of the configuration of one embodiment can be replaced with the configuration of another embodiment, and the configuration of another embodiment can be added to the configuration of one embodiment.
- the drawings show what is considered necessary for explanation, and do not necessarily show all the components and functions on the product.
- Scattered light 22 ... Scattered light receiving part, 23 ... Control circuit, 24 ... Transmitted light measuring circuit, 25 ... Scattered light measuring circuit, 26 ... Data processing part 27 ... Input unit, 28 ... Output unit, 31a, 31b ... LED, 32 ... Half mirror, 33a, 33b ... Photodiode, 34 ... Dichroic mirror
Landscapes
- Physics & Mathematics (AREA)
- Chemical & Material Sciences (AREA)
- General Physics & Mathematics (AREA)
- Immunology (AREA)
- Health & Medical Sciences (AREA)
- Analytical Chemistry (AREA)
- Biochemistry (AREA)
- General Health & Medical Sciences (AREA)
- Pathology (AREA)
- Life Sciences & Earth Sciences (AREA)
- Chemical Kinetics & Catalysis (AREA)
- Spectroscopy & Molecular Physics (AREA)
- Engineering & Computer Science (AREA)
- Plasma & Fusion (AREA)
- Investigating Or Analysing Materials By Optical Means (AREA)
- Automatic Analysis And Handling Materials Therefor (AREA)
Abstract
自動分析装置上での散乱光測定における気泡・ゴミの影響を低減する。光源より短波長側の第1波長18a、長波長側の第2波長18bを照射し、透過光19a,19b及び散乱光21a,21bを受光する。第1波長、第2波長の透過光強度比ならびに第2波長の散乱光の変化光量よりノイズを推定し、第1波長の散乱光の変化光量から減算することにより気泡・ゴミによるノイズを低減する。
Description
本発明は、抗原抗体反応を用いた微粒子凝集反応を散乱光測定する方法及び装置に関し、特に自動分析装置上の散乱光測定法に関する。
光源からの光を、サンプルと試薬とが混合した反応液に照射し、特定波長の透過光量の変化から吸光度を算出し、ランベルト・ベールの法則に従いサンプル中の被測定物質の濃度を定量する自動分析装置が広く用いられている。これらの装置においては、回転と停止を繰り返すセルディスクの円周上に反応液を保持する多数のセルを並べ、セルディスク回転中に所定位置の透過光測定部により15秒程度の間隔で約10分間、セル内の反応液を透過した光量の時間系列データを反応過程データとして測定し、光量の変化から吸光度を算出し、被測定物質の濃度を定量する。
自動分析装置で測定される反応には主に基質と酵素との呈色反応と、抗原と抗体との免疫反応の2種類がある。前者の反応を用いた分析は生化学分析と呼ばれ、検査項目としてLDH(乳酸脱水素酵素)、ALP(アルカリホスファターゼ)、AST(アスパラギン酸オキソグルタル酸アミノトンラフェナーゼ)などがある。後者の反応を用いた分析は免疫分析と呼ばれ、検査項目としてCRP(C反応性蛋白)、IgG(免疫グロブリン)、RF(リウマトイド因子)などがある。後者で測定される被測定物質の中には、血中濃度が低い低濃度領域において定量が要求される検査項目が存在し、そのような項目では、表面に抗体を感作(結合)させたラテックス粒子を増感剤として用いたラテックス免疫分析が用いられる。ラテックス免疫分析では、サンプルに含まれる被測定物質である抗原を、試薬に含まれるラテックス粒子表面の抗体が認識し結合した結果、ラテックス粒子が抗原を介して凝集し、ラテックス粒子の凝集体が形成される。従来の自動分析装置では、この凝集体の分散した反応液に光を照射し、ラテックス粒子の凝集体に散乱されずに透過した透過光量を測定する。抗原の濃度が高いほど一定時間後の凝集体の大きさは大きくなり、より多くの光が散乱されるため透過光量が減少する。そのため、反応過程データとして測定した光量から抗原の濃度を定量できる。
近年ラテックス免疫分析のさらなる高感度化が望まれており、透過光を測定するのではなく、散乱光を測定することが試みられてきた。例えば、特許文献1にはダイアフラムを用いて透過光と散乱光を分離し、透過光と散乱光を同時に測定するシステムが開示されている。特許文献2には、自動分析装置において2波長の検出光強度の差を自動算出し分析結果を算出するシステムが開示されている。また、自動分析装置以外において、特許文献3には、透過光と散乱光を含む検出信号を波長670nmと940nmで差をとり血中の外因性巨大分子を計測するシステムが開示されている。
散乱光を用いた自動分析装置において、複数波長の反応過程データから演算を行い、高感度化を図った方法はこれまでになかった。特許文献1には、透過光測定と同時に散乱光測定を行うことより高感度にする構成が示されているが、自動分析装置に適した構成として考慮されたものではない。特許文献2では、複数波長のデータを演算することで吸光度においてはノイズの低減が図れるものの、散乱光のデータの演算方法については開示されていない。特許文献3は、計測の対象としているものが外因性巨大分子であり、ラテックス免疫分析における反応過程データを取得できる方法ではない。
ラテックス免疫分析を高感度化するために散乱光を測定した場合、気泡やゴミなどの外乱物質によるノイズを低減することが必要となる。特に、反応過程データを用いて測定を行うため、気泡やゴミが反応過程中に成長もしくは増加するなどの原因によって信号が変動することが問題となる。
また、ラテックス免疫分析の試薬に含まれるラテックス粒子は試薬の種類によって反応液中の密度に幅があり、気泡やゴミなどの外乱物質によるノイズの影響も試薬によって異なる。そこで、同一の光学系を用いて、試薬の種類に影響を受けにくいノイズキャンセルの方法が望まれている。
本発明では、第1波長の光と第1波長よりも長波長の第2波長の光を同一光路にてサンプルと試薬を混合した反応液の入ったセルに照射し、それぞれの波長の散乱光を受光する。そして、反応液中の凝集反応によって変化した第1波長の散乱光の変化光量を表す信号から、第2波長の散乱光の変化光量に試薬に依存する試薬係数を乗算した信号を減算した信号を求め、当該信号をもとにサンプル中の成分量を定量する。
典型的には、試薬は直径50nm~500nmの表面に抗体を結合させたラテックス粒子を含み、第1波長として0.65μm~0.75μmの範囲の光を用いる。試薬係数としてセルを透過した第1の波長の光と第2の波長の光の強度比を用いることができるが、試薬毎の試薬係数を予め記憶部に記憶させておき、それを適宜読み出して用いるようにしてもよい。
本発明に依れば、ラテックス免疫分析において、外乱物質によって生じるノイズをキャンセルすることが可能となる。
上記した以外の課題、構成及び効果は、以下の実施形態の説明により明らかにされる。
以下、図面を参照して本発明の実施の形態を説明する。
図1は、抗原抗体反応において測定された散乱光の時間経過を説明する概略図である。散乱光測定部をもつ自動分析装置上では、まず、第一試薬を添加したサンプルに直径50nm~500nmのラテックス粒子が分散した第二試薬を混合し(基準状態)、一定時間経った後(凝集状態)の散乱光又は透過光の変化光量を検出する。別途、既知濃度の抗原を用いて変化光量を測定したキャリブレーションデータを用意し、そのデータと比較することで、サンプル中の抗原の濃度を算出する。本発明では、散乱光の第1波長、第2波長それぞれの信号から、後述する演算後の信号を用いてキャリブレーションデータを用意する。変化光量は照射光の強度にも比例するため、予め第1波長と第2波長の光源強度差が20%以内に収まるように調整を行う。もしくは第1波長と第2波長の光源強度比を測定しておき、その比を用いて散乱光強度を除算し、光源強度のばらつきによる散乱光強度のばらつきを抑える。もしくはセル内に純水を入れ、セルを透過した第1波長と第2波長の透過光強度比を測定し、その比を用いて散乱光強度を除算することで光源強度のばらつきによる散乱光強度のばらつきを補正してもよい。
図2は、自動分析装置の一実施例の全体構成例を示す概略図である。本実施例の自動分析装置は透過光と同時に散乱光を測定できる。本実施例の自動分析装置は、サンプルディスク3、試薬ディスク6、セルディスク9の3種類のディスクと、これらのディスク間でサンプルや試薬を移動させる分注機構、これらを制御する制御回路23、透過光測定回路24、散乱光測定回路25、測定したデータを処理するPC(コンピュータ)等のデータ処理部26、データ処理部26に対しデータを入出力するインターフェースである入力部27、出力部28を有する。データ処理部26は、データを解析する解析部、及び制御データ、測定データ、解析に用いるデータや解析結果データ等を格納するデータ格納部を備える。
サンプルディスク3の円周上には、サンプル1を収めたサンプルカップ2が複数配置されている。試薬ディスク6には、試薬4を収めた試薬ボトル5が複数配置されている。セルディスク9の円周上には、内部でサンプル1と試薬4を混合して反応液7とするセル8が複数配置されている。サンプル分注機構10は、サンプルカップ2からセル8にサンプル1を一定量移動させる。試薬分注機構11は、試薬ボトル5からセル8に試薬4を一定量移動させる。攪拌部12は、セル8内で、サンプル1と試薬4を攪拌し混合させる。洗浄部14は、分析の終了したセル8から反応液7を排出し洗浄する。洗浄されたセル8には再びサンプル分注機構10から次のサンプル1が分注され、試薬分注機構11から新しい試薬4が分注され、別の反応に使用される。セル8は温度・流量が制御された恒温槽内の恒温流体15に浸漬されており、セル8及びその中の反応液7が一定温度に保たれた状態で移動される。恒温流体15には例えば水を用い、恒温流体温度は制御回路23により37±0.1℃に温調される。セルディスク円周上の一部に、透過光測定部13と散乱光測定部16が設けられている。
透過光測定部13は、例えば、ハロゲンランプ光源からの光をセル8に照射し、透過光を回折格子で分光した後、フォトダイオードアレイで受光する構成とすることができる。受光する波長は、例えば340nm,405nm,450nm,480nm,505nm,546nm,570nm,600nm,660nm,700nm,750nm,800nmである。フォトダイオードアレイで受光した透過光量データは、透過光測定回路24を通じてPC内のデータ格納部に送られる。
図3は、散乱光測定部16の概略図である。光源としては例えばLED光源等を用いることができ、LED光源ユニット17からの照射光18a,18bを移動中のセル8に照射し、透過光19a,19bを透過光受光部20で受光し、散乱光21a,21bを散乱光受光部22で受光する。照射光18a,18b、透過光19a,19b、散乱光21a,21bはそれぞれ異なる波長の光で、かつ同一の空間領域を通過する。散乱光測定用の波長は、650nm~750nmに含まれる波長と、それよりも長波長、望ましくは900nm以上であればよい。
図4は、LED光源ユニット17の概略図である。LED光源ユニット17から照射される光は少なくとも2波長の光を有しており、例えばLED31aからの波長700nmの光とLED31bからの波長950nmの光を、図4のようにハーフミラー32にて合波し同一の光軸に調整した後、照射光18として出射する。本実施例では光源として単一波長のLED31a,31bを用いたが、白色LEDやレーザ、キセノンランプ、ハロゲンランプでも良い。蛍光物質を用いて、一つのLED光源から第1波長と、さらに第1波長によって蛍光物質を通じて第2波長を出射する光源を用いても良い。例えば白色光を発生するハロゲンランプを光源として用いた場合には、受光部において分光して波長700nmの光量と波長950nmの光量を測定してもよい。
散乱光受光部22は、光軸に対して空気中において角度θだけ離れた方向の散乱光21a,21bを測定する。角度θは15~35゜の範囲の角度であればよいが、本実施例ではθ=20゜とした。この散乱光受光部22は、セルディスク9の回転によるセル8の移動方向に対して概ね垂直な面内に配置される。ここでは、角度θの基準位置として、セル8内を光が通過する長さの中央部を起点とした。
図5は、散乱光受光部22の概略図である。散乱光受光部22は、光を分光する機能を有し、例えばダイクロイックミラー34を用いて散乱光を第1波長の700nmと第2波長の950nmの光に分離し、それぞれをフォトダイオード33a,33bにて受光する。
本実施例では、散乱光受光部22にて2波長に光を分離したが、照射光としてハロゲンランプなどの白色光を用い、散乱光受光部22として回折格子等を組み込んだ分光ユニットを用いてもよい。
サンプル1中の被測定物質の濃度定量は、次の手順で行われる。まず、サンプル分注機構10によりサンプルカップ2内のサンプル1をセル8内に一定量分注する。次に、試薬分注機構11により試薬ボトル5内の試薬4をセル8内に一定量分注する。これら分注の際は、サンプルディスク3、試薬ディスク6、セルディスク9は制御回路23の制御下にそれぞれの駆動部によって回転駆動され、サンプルカップ2、試薬ボトル5、セル8を分注機構10,11の分注タイミングに合わせて移動する。続いて、セル8内に分注されたサンプル1と試薬4を攪拌部12により攪拌し、反応液7とする。反応液7からの透過光及び散乱光は、セルディスク9の回転中に、透過光測定部13及び散乱光測定部16の測定位置を通過するたびに測定され、透過光測定回路24、散乱光測定回路25からデータ処理部26のデータ格納部に、反応過程データとして順次蓄積される。一定時間、例えば約10分間測定後、洗浄部14によりセル8内を洗浄し、次の検査項目の分析を行う。その間、必要であれば別の試薬4を試薬分注機構11によりセル8内に追加して分注し、攪拌部12により攪拌し、さらに一定時間測定する。これにより一定の時間間隔を持った反応液7の反応過程データがデータ格納部に格納される。
格納された散乱光測定部の反応過程データから、解析部において一定時間の反応による光量の変化を求め、予めデータ格納部に保持された検量線データに基づき、定量結果が算出され、出力部より表示される。各部の制御・分析に必要なデータは、入力部27からデータ処理部26のデータ格納部に入力される。各種格納部のデータや結果、及びアラームは出力部28により表示等にて出力される。
本実施例では、少なくとも2波長の光を同一光路で反応液に照射し、反応液から発せられる散乱光を受光し、2波長間の散乱光信号を試薬ごとに決定される試薬係数を用いて演算することにより、外乱物質による変化光量(ノイズ)を低減する。特に2波長の光のうち長波長側の光による散乱光信号に試薬係数を乗算した値を、短波長側の光による散乱光信号から減算することでノイズを低減する。
以下、より具体的に説明を行う。第1波長と第2波長それぞれのセルへの照射光強度が等しくなるよう調整する。その上で、反応開始直後の反応液からの第1波長、第2波長それぞれの透過光強度It1,It2から試薬係数kを次のように決定する。
k=It1/It2
k=It1/It2
続いて、第1波長、第2波長それぞれの、反応によって変化した散乱光の光量Is1(t),Is2(t)と試薬係数kを用いて、演算後の反応過程データ
Is-cal(t)=Is1(t)-k×Is2(t)
を得、この演算後の反応過程データを用いてサンプル中の成分量を定量する。
Is-cal(t)=Is1(t)-k×Is2(t)
を得、この演算後の反応過程データを用いてサンプル中の成分量を定量する。
ここで、試薬係数kは反応開始直後の反応液からの透過光強度から求める方法を示したが、用いる試薬ごとに測定前に設定してもよい。
図6は、気泡によるノイズの影響と演算結果を示す図である。図(6-a1),(6-b1)は、外乱物質である気泡がセル壁に付着し、それが成長した際の第1波長700nm,第2波長950nmにおける散乱光強度をシミュレーションしたものである。シミュレーションは、反応液を含んだ光路長5mmのセルの内壁上、照射光軸中心に気泡を配置し、照射光からのθ=20°方向の散乱光を計算した。
このシミュレーションでは気泡の位置は受光部側のセル壁を想定したが、照射光側のセル壁に気泡が付着した場合でも同様の結果となる。すなわち、受光部側セル壁に気泡が付着した場合には反応液を透過し減衰した照射光が気泡によって散乱され、照射光側セル壁に気泡が付着した場合には照射光が気泡によって散乱されたのち反応液を透過し減衰する。ここで、気泡に当たる光が散乱される割合と反応液透過による減衰割合は気泡の付着する壁によらないため、結果として受光部に入る気泡による散乱光の強度は、気泡が付着するセル壁に依らずほぼ等しくなる。
反応液中の気泡やゴミは、計測に用いられる波長に対して十分大きく、図6に示した気泡直径の範囲に含まれる割合が多い。ここで、図(6-a1)及び(6-b1)は、それぞれ波長700nmにおいて吸光度0.08(abs),0.30(abs)相当(950nm波長での吸光度は0.03(abs),0.13(abs))の直径300nmのラテックス粒子が含まれる反応液におけるデータである。また、図(6-a2)及び(6-b2)は、気泡が成長して直径が大きくなってゆく時、それぞれの直径の気泡から発生する散乱光を、気泡直径0μmのとき、すなわち気泡が無いときの散乱光強度を基準に示した変化光量の図である。
以下、反応開始直後の反応液からの透過光強度It(700nm),It(950nm)の比から試薬係数kを求める。各波長の照射光強度I0が同一に調整されているとき、図(6-a1)(波長700nmで0.08(abs))の場合には、光路長5mmにおいて
 であり、試薬係数kは
 である。同様に、図(6-b1)(波長700nmで0.30(abs))の場合には、試薬係数kは0.82である。
用いる反応開始直後の反応液からの透過光強度は、透過光測定部で測定された値を用いてもよい。また、試薬係数は測定前に試薬ごとに設定し、データ格納部に記憶しておき、それを取り出して用いても構わない。
波長700nm,950nmそれぞれの散乱光の変化光量Is(700nm),Is(950nm)と試薬係数kを用いた減算結果{Is-cal=Is(700nm)-k×Is(950nm)}、単純な減算結果{Is(700nm)-Is(950nm)}、試薬係数k=0.97に固定した減算結果の例を図(6-a3)(6-b3)に示す。
図(6-a2)(6-b2)より、気泡による散乱光の変化光量は、波長700nmよりも波長950nmの光が大きく、かつ試薬の吸光度が高いほど、その差も大きくなる。これは試薬の粒子直径が一般的に50nm~500nmの範囲にあるために、短波長と長波長で試薬の吸光度が異なり、気泡やゴミなどの外乱物質に照射される透過光が短波長ほど小さくなることで、外乱物質による変化光量が短波長ほど小さくなることによる。
そのため、2波長間の単純な減算や、試薬係数を固定した減算では、2波長間の減算幅が試薬によっては大きくなってしまうが、反応開始直後の反応液からの透過光強度を反映した試薬係数を用いることで、単純な減算と比較して外乱物質による変化光量を1/4以下に抑えることが可能となった(図(6-a3)(6-b3)参照)。
一方で、外乱物質に対する波長依存性とは逆に、反応による変化光量は可視光以上の波長範囲では、短波長の方が大きくなる。そのため上記の減算結果を用いることで、外乱物質による影響を抑え、反応による変化光量をとらえることが可能となる。
本実施例の自動分析装置では、データ処理部26において、上述のように、波長700nmと波長950nmにおける散乱光の変化光量Is(700nm),Is(950nm)をもとに、試薬係数kを用いて演算{Is-cal=Is(700nm)-k×Is(950nm)}を行い、演算結果Is-calをデータ格納部に保持されている検量線データと照合してサンプル中の成分量を定量する。これにより、セル壁に付着した気泡やゴミの影響を低減して高精度な定量分析を行うことができる。
なお、本発明は上記した実施例に限定されるものではなく、様々な変形例が含まれる。例えば、上記した実施例は本発明を分かりやすく説明するために詳細に説明したものであり、必ずしも説明した全ての構成を備えるものに限定されるものではない。また、ある実施例の構成の一部を他の実施例の構成に置き換えることが可能であり、また、ある実施例の構成に他の実施例の構成を加えることも可能である。また、各実施例の構成の一部について、他の構成の追加・削除・置換をすることが可能である。また、図面は説明上必要と考えられるものを示しており、製品上必ずしも全ての構成部や機能を示しているわけではない。
1…サンプル、2…サンプルカップ、3…サンプルディスク、4…試薬、5…試薬ボトル、6…試薬ディスク、7…反応液、8…セル、9…セルディスク、10…サンプル分注機構、11…試薬分注機構、12…攪拌部、13…透過光測定部、14…洗浄部、15…恒温流体、16…散乱光測定部、17…LED光源ユニット、18a,18b…照射光、19a,19b…透過光、20…透過光受光部、21a,21b…散乱光、22…散乱光受光部、23…制御回路、24…透過光測定回路、25…散乱光測定回路、26…データ処理部、27…入力部、28…出力部、31a,31b…LED、32…ハーフミラー、33a,33b…フォトダイオード、34…ダイクロイックミラー
Claims (14)
- サンプルと試薬を混合した反応液が入ったセルと、
前記セルに第1波長の光と前記第1波長よりも長波長の第2波長の光を同一光路にて照射する光源部と、
前記セル内の反応液と相互作用した前記第1波長の散乱光と前記第2波長の散乱光を受光する光受光部と、
データ処理部とを有し、
前記データ処理部は、前記反応液中の凝集反応によって変化した前記第1波長の散乱光の変化光量を表す信号から、前記第2波長の散乱光の変化光量に前記試薬に依存する試薬係数を乗算した信号を減算した信号を求め、当該信号をもとに前記サンプル中の成分量を定量することを特徴とする分析装置。 - 請求項1記載の分析装置において、前記試薬は直径50nm~500nmの粒子を含み、前記第1波長として0.65μm~0.75μmの範囲の光を用いることを特徴とする分析装置。
- 請求項1記載の分析装置において、前記セルに照射される前記第1波長の光と前記第2波長の光の強度比が所定の誤差範囲内に調整されていることを特徴とする分析装置。
- 請求項1記載の分析装置において、前記試薬係数として前記セルを透過した前記第1の波長の光と前記第2の波長の光の強度比を用いることを特徴とする分析装置。
- 請求項1記載の分析装置において、前記試薬係数を試薬ごとに記憶する記憶部を有し、前記データ処理部は前記記憶部に記憶された試薬係数を読み出して用いることを特徴とする分析装置。
- 請求項1記載の分析装置において、前記セル内に純水が含まれる場合の透過光強度を用いて前記第1波長の光と前記第2波長の光の強度を正規化することを特徴とする分析装置。
- 請求項1記載の分析装置において、前記反応開始後の反応液からの透過光強度を用いて前記試薬係数を決定することを特徴とする分析装置。
- サンプルの入ったサンプルカップが複数配置され回転駆動されるサンプルディスクと、
試薬の入った試薬ボトルが複数配置され回転駆動される試薬ディスクと、
反応液を収容するセルが複数配置され回転駆動されるセルディスクと、
前記サンプルディスクのサンプルカップから前記セルディスクのセルにサンプルを分注するサンプル分注機構と、
前記試薬ディスクの試薬ボトルから前記セルディスクのセルに試薬を分注する試薬分注機構と、
回転駆動されている前記セルディスクのサンプルと試薬を混合した反応液が入ったセルに対して光学的な測定を行う測定部と、
前記測定部で測定されたデータを処理するデータ処理部とを有し、
前記測定部は、第1波長の光と前記第1波長よりも長波長の第2波長の光を同一光路にて前記セルに照射する光源部と、前記セル内の反応液と相互作用した前記第1波長の散乱光と前記第2波長の散乱光を受光する光受光部を備え、
前記データ処理部は、前記反応液中の凝集反応によって変化した前記第1波長の散乱光の変化光量を表す信号から、前記第2波長の散乱光の変化光量に前記試薬に依存する試薬係数を乗算した信号を減算した信号を求め、当該信号をもとに前記サンプル中の成分量を定量することを特徴とする自動分析装置。 - 請求項8記載の自動分析装置において、前記試薬は直径50nm~500nmの粒子を含み、前記第1波長として0.65μm~0.75μmの範囲の光を用いることを特徴とする自動分析装置。
- 請求項8記載の自動分析装置において、前記セルに照射される前記第1波長の光と前記第2波長の光の強度比が所定の誤差範囲内に調整されていることを特徴とする自動分析装置。
- 請求項8記載の自動分析装置において、前記試薬係数として前記セルを透過した前記第1の波長の光と前記第2の波長の光の強度比を用いることを特徴とする自動分析装置。
- 請求項8記載の自動分析装置において、前記試薬係数を試薬ごとに記憶する記憶部を有し、前記データ処理部は前記記憶部に記憶された試薬係数を読み出して用いることを特徴とする自動分析装置。
- 請求項8記載の自動分析装置において、前記セル内に純水が含まれる場合の透過光強度を用いて前記第1波長の光と前記第2波長の光の強度を正規化することを特徴とする自動分析装置。
- 請求項8記載の自動分析装置において、前記反応開始後の反応液からの透過光強度を用いて前記試薬係数を決定することを特徴とする自動分析装置。
Priority Applications (3)
| Application Number | Priority Date | Filing Date | Title |
|---|---|---|---|
| US14/775,544 US9459271B2 (en) | 2013-04-02 | 2014-03-31 | Analyzer and automatic analyzer |
| CN201480010556.7A CN105008899B (zh) | 2013-04-02 | 2014-03-31 | 分析装置及自动分析装置 |
| EP14779279.0A EP2988111B1 (en) | 2013-04-02 | 2014-03-31 | Analyzer and automatic analyzer |
Applications Claiming Priority (2)
| Application Number | Priority Date | Filing Date | Title |
|---|---|---|---|
| JP2013076932A JP6110710B2 (ja) | 2013-04-02 | 2013-04-02 | 分析装置及び自動分析装置 |
| JP2013-076932 | 2013-04-02 |
Publications (1)
| Publication Number | Publication Date |
|---|---|
| WO2014163037A1 true WO2014163037A1 (ja) | 2014-10-09 |
Family
ID=51658333
Family Applications (1)
| Application Number | Title | Priority Date | Filing Date |
|---|---|---|---|
| PCT/JP2014/059434 Ceased WO2014163037A1 (ja) | 2013-04-02 | 2014-03-31 | 分析装置及び自動分析装置 |
Country Status (5)
| Country | Link |
|---|---|
| US (1) | US9459271B2 (ja) |
| EP (1) | EP2988111B1 (ja) |
| JP (1) | JP6110710B2 (ja) |
| CN (1) | CN105008899B (ja) |
| WO (1) | WO2014163037A1 (ja) |
Families Citing this family (9)
| Publication number | Priority date | Publication date | Assignee | Title |
|---|---|---|---|---|
| WO2016130964A1 (en) | 2015-02-13 | 2016-08-18 | Abbott Laboratories | Decapping and capping apparatus, systems and methods for use in diagnostic analyzers |
| ES3038129T3 (en) | 2015-06-26 | 2025-10-09 | Abbott Lab | Rotating device in a diagnostic analyzer |
| JP6576843B2 (ja) | 2016-01-22 | 2019-09-18 | 株式会社日立ハイテクノロジーズ | 自動分析装置及びその散乱光測定光学系評価用標準液 |
| JP6657016B2 (ja) * | 2016-05-27 | 2020-03-04 | 株式会社日立ハイテクノロジーズ | 自動分析装置 |
| CN108693142B (zh) * | 2018-06-11 | 2020-10-30 | 重庆大学 | 一种基于光学散射原理的pm2.5检测方法 |
| JP7217677B2 (ja) * | 2019-07-16 | 2023-02-03 | 株式会社日立製作所 | サンプル測定装置、及びサンプル測定方法 |
| CN114174800B (zh) * | 2019-08-05 | 2024-10-15 | 株式会社日立高新技术 | 自动分析装置 |
| CN112816724B (zh) * | 2021-03-01 | 2025-03-18 | 深圳市特康生物工程有限公司 | 一种全自动特定蛋白分析装置 |
| WO2025064425A1 (en) * | 2023-09-18 | 2025-03-27 | Siemens Healthcare Diagnostics Inc. | A system for analyzing bio-samples |
Citations (7)
| Publication number | Priority date | Publication date | Assignee | Title |
|---|---|---|---|---|
| JPH0365654A (ja) | 1989-08-02 | 1991-03-20 | Hitachi Ltd | 液体試料の分析装置および分析方法 |
| JPH0638947A (ja) | 1992-03-31 | 1994-02-15 | Univ Manitoba | 血液の分光測光分析法及び該装置 |
| JP2001141654A (ja) | 1999-10-08 | 2001-05-25 | Dade Behring Marburg Gmbh | 分光光度・比濁検出ユニット |
| JP2003080253A (ja) * | 2001-09-07 | 2003-03-18 | Shimadzu Corp | 電解水製造装置 |
| JP2009085708A (ja) * | 2007-09-28 | 2009-04-23 | Dkk Toa Corp | 試料液中の有機物濃度測定方法および紫外線吸光度計測器 |
| JP2011237191A (ja) * | 2010-05-06 | 2011-11-24 | Sharp Corp | 濁度検知器 |
| JP2012007921A (ja) * | 2010-06-23 | 2012-01-12 | Hitachi High-Technologies Corp | 自動分析装置および自動分析方法 |
Family Cites Families (2)
| Publication number | Priority date | Publication date | Assignee | Title |
|---|---|---|---|---|
| CN102216784B (zh) * | 2008-11-17 | 2014-07-09 | 株式会社日立高新技术 | 自动分析装置 |
| EP2389447B1 (en) * | 2009-01-23 | 2014-11-05 | University of Maryland, Baltimore County | Chlorophyll and turbidity sensor system |
-
2013
- 2013-04-02 JP JP2013076932A patent/JP6110710B2/ja active Active
-
2014
- 2014-03-31 EP EP14779279.0A patent/EP2988111B1/en active Active
- 2014-03-31 US US14/775,544 patent/US9459271B2/en active Active
- 2014-03-31 CN CN201480010556.7A patent/CN105008899B/zh active Active
- 2014-03-31 WO PCT/JP2014/059434 patent/WO2014163037A1/ja not_active Ceased
Patent Citations (7)
| Publication number | Priority date | Publication date | Assignee | Title |
|---|---|---|---|---|
| JPH0365654A (ja) | 1989-08-02 | 1991-03-20 | Hitachi Ltd | 液体試料の分析装置および分析方法 |
| JPH0638947A (ja) | 1992-03-31 | 1994-02-15 | Univ Manitoba | 血液の分光測光分析法及び該装置 |
| JP2001141654A (ja) | 1999-10-08 | 2001-05-25 | Dade Behring Marburg Gmbh | 分光光度・比濁検出ユニット |
| JP2003080253A (ja) * | 2001-09-07 | 2003-03-18 | Shimadzu Corp | 電解水製造装置 |
| JP2009085708A (ja) * | 2007-09-28 | 2009-04-23 | Dkk Toa Corp | 試料液中の有機物濃度測定方法および紫外線吸光度計測器 |
| JP2011237191A (ja) * | 2010-05-06 | 2011-11-24 | Sharp Corp | 濁度検知器 |
| JP2012007921A (ja) * | 2010-06-23 | 2012-01-12 | Hitachi High-Technologies Corp | 自動分析装置および自動分析方法 |
Non-Patent Citations (1)
| Title |
|---|
| See also references of EP2988111A4 |
Also Published As
| Publication number | Publication date |
|---|---|
| US20160025758A1 (en) | 2016-01-28 |
| JP6110710B2 (ja) | 2017-04-05 |
| CN105008899B (zh) | 2017-08-18 |
| EP2988111A4 (en) | 2016-11-02 |
| EP2988111A1 (en) | 2016-02-24 |
| US9459271B2 (en) | 2016-10-04 |
| EP2988111B1 (en) | 2021-11-03 |
| CN105008899A (zh) | 2015-10-28 |
| JP2014202523A (ja) | 2014-10-27 |
Similar Documents
| Publication | Publication Date | Title |
|---|---|---|
| JP6110710B2 (ja) | 分析装置及び自動分析装置 | |
| CN103765198B (zh) | 自动分析装置及分析方法 | |
| JP5613298B2 (ja) | 自動分析装置 | |
| JP5948173B2 (ja) | 自動分析装置及び自動分析方法 | |
| JP5379044B2 (ja) | 自動分析装置 | |
| JP6134210B2 (ja) | 自動分析装置及び自動分析方法 | |
| JP5822534B2 (ja) | 自動分析装置 | |
| JP6576843B2 (ja) | 自動分析装置及びその散乱光測定光学系評価用標準液 | |
| JP6437390B2 (ja) | 自動分析装置 | |
| JP6031552B2 (ja) | 自動分析装置及び分析方法 | |
| JP6138564B2 (ja) | 自動分析装置 | |
| JP6657016B2 (ja) | 自動分析装置 | |
| WO2016129029A1 (ja) | 自動分析装置 |
Legal Events
| Date | Code | Title | Description |
|---|---|---|---|
| 121 | Ep: the epo has been informed by wipo that ep was designated in this application |
Ref document number: 14779279 Country of ref document: EP Kind code of ref document: A1 |
|
| WWE | Wipo information: entry into national phase |
Ref document number: 2014779279 Country of ref document: EP |
|
| WWE | Wipo information: entry into national phase |
Ref document number: 14775544 Country of ref document: US |
|
| NENP | Non-entry into the national phase |
Ref country code: DE |