WO2015111569A1 - 線形予測分析装置、方法、プログラム及び記録媒体 - Google Patents
線形予測分析装置、方法、プログラム及び記録媒体 Download PDFInfo
- Publication number
- WO2015111569A1 WO2015111569A1 PCT/JP2015/051352 JP2015051352W WO2015111569A1 WO 2015111569 A1 WO2015111569 A1 WO 2015111569A1 JP 2015051352 W JP2015051352 W JP 2015051352W WO 2015111569 A1 WO2015111569 A1 WO 2015111569A1
- Authority
- WO
- WIPO (PCT)
- Prior art keywords
- coefficient
- value
- max
- pitch gain
- fundamental frequency
- Prior art date
- Legal status (The legal status is an assumption and is not a legal conclusion. Google has not performed a legal analysis and makes no representation as to the accuracy of the status listed.)
- Ceased
Links
Images





Classifications
-
- G—PHYSICS
- G10—MUSICAL INSTRUMENTS; ACOUSTICS
- G10L—SPEECH ANALYSIS TECHNIQUES OR SPEECH SYNTHESIS; SPEECH RECOGNITION; SPEECH OR VOICE PROCESSING TECHNIQUES; SPEECH OR AUDIO CODING OR DECODING
- G10L25/00—Speech or voice analysis techniques not restricted to a single one of groups G10L15/00 - G10L21/00
- G10L25/03—Speech or voice analysis techniques not restricted to a single one of groups G10L15/00 - G10L21/00 characterised by the type of extracted parameters
- G10L25/12—Speech or voice analysis techniques not restricted to a single one of groups G10L15/00 - G10L21/00 characterised by the type of extracted parameters the extracted parameters being prediction coefficients
-
- G—PHYSICS
- G10—MUSICAL INSTRUMENTS; ACOUSTICS
- G10L—SPEECH ANALYSIS TECHNIQUES OR SPEECH SYNTHESIS; SPEECH RECOGNITION; SPEECH OR VOICE PROCESSING TECHNIQUES; SPEECH OR AUDIO CODING OR DECODING
- G10L19/00—Speech or audio signals analysis-synthesis techniques for redundancy reduction, e.g. in vocoders; Coding or decoding of speech or audio signals, using source filter models or psychoacoustic analysis
- G10L19/04—Speech or audio signals analysis-synthesis techniques for redundancy reduction, e.g. in vocoders; Coding or decoding of speech or audio signals, using source filter models or psychoacoustic analysis using predictive techniques
- G10L19/06—Determination or coding of the spectral characteristics, e.g. of the short-term prediction coefficients
-
- G—PHYSICS
- G10—MUSICAL INSTRUMENTS; ACOUSTICS
- G10L—SPEECH ANALYSIS TECHNIQUES OR SPEECH SYNTHESIS; SPEECH RECOGNITION; SPEECH OR VOICE PROCESSING TECHNIQUES; SPEECH OR AUDIO CODING OR DECODING
- G10L25/00—Speech or voice analysis techniques not restricted to a single one of groups G10L15/00 - G10L21/00
- G10L25/03—Speech or voice analysis techniques not restricted to a single one of groups G10L15/00 - G10L21/00 characterised by the type of extracted parameters
- G10L25/06—Speech or voice analysis techniques not restricted to a single one of groups G10L15/00 - G10L21/00 characterised by the type of extracted parameters the extracted parameters being correlation coefficients
-
- G—PHYSICS
- G10—MUSICAL INSTRUMENTS; ACOUSTICS
- G10L—SPEECH ANALYSIS TECHNIQUES OR SPEECH SYNTHESIS; SPEECH RECOGNITION; SPEECH OR VOICE PROCESSING TECHNIQUES; SPEECH OR AUDIO CODING OR DECODING
- G10L25/00—Speech or voice analysis techniques not restricted to a single one of groups G10L15/00 - G10L21/00
- G10L25/90—Pitch determination of speech signals
-
- G—PHYSICS
- G10—MUSICAL INSTRUMENTS; ACOUSTICS
- G10L—SPEECH ANALYSIS TECHNIQUES OR SPEECH SYNTHESIS; SPEECH RECOGNITION; SPEECH OR VOICE PROCESSING TECHNIQUES; SPEECH OR AUDIO CODING OR DECODING
- G10L25/00—Speech or voice analysis techniques not restricted to a single one of groups G10L15/00 - G10L21/00
- G10L25/03—Speech or voice analysis techniques not restricted to a single one of groups G10L15/00 - G10L21/00 characterised by the type of extracted parameters
- G10L25/21—Speech or voice analysis techniques not restricted to a single one of groups G10L15/00 - G10L21/00 characterised by the type of extracted parameters the extracted parameters being power information
Definitions
- the present invention relates to a technique for analyzing a digital time series signal such as a voice signal, an acoustic signal, an electrocardiogram, an electroencephalogram, a magnetoencephalogram, and a seismic wave.
- a digital time series signal such as a voice signal, an acoustic signal, an electrocardiogram, an electroencephalogram, a magnetoencephalogram, and a seismic wave.
- Non-Patent Documents 1 and 2). reference. a method of encoding based on a prediction coefficient obtained by linear predictive analysis of an input audio signal or acoustic signal is widely used (for example, Non-Patent Documents 1 and 2). reference.).
- Non-Patent Documents 1 to 3 the prediction coefficient is calculated by the linear prediction analyzer illustrated in FIG.
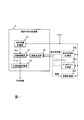
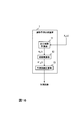
- the linear prediction analysis apparatus 1 includes an autocorrelation calculation unit 11, a coefficient multiplication unit 12, and a prediction coefficient calculation unit 13.
- the input signal which is a digital audio signal or digital audio signal in the time domain, is processed every N sample frames.
- n represents the sample number of each sample in the input signal, and N is a predetermined positive integer.
- P max is a predetermined positive integer less than N.
- the modified autocorrelation R ′ O (i) is obtained by multiplying every time. In other words, the modified autocorrelation R ′ O (i) is obtained by the equation (12).
- the prediction coefficient calculation unit 13 uses the modified autocorrelation R ′ O (i) output from the coefficient multiplication unit 12, for example, the P max order which is a predetermined prediction order from the first order by the Levinson-Durbin method or the like.
- the coefficient which can be converted into the linear prediction coefficient up to is obtained.
- Coefficients that can be converted into linear prediction coefficients include PARCOR coefficients K O (1), K O (2), ..., K O (P max ) and linear prediction coefficients a O (1), a O (2), ... , a O (P max ), etc.
- the bandwidth of 60 Hz obtained in advance as the coefficient w O (i) A fixed coefficient is used.
- f s is the sampling frequency.
- Non-Patent Document 3 describes an example in which a coefficient based on a function other than the above-described exponential function is used.
- the function used here is a function based on a sampling period ⁇ (corresponding to a period corresponding to f s ) and a predetermined constant a, and a fixed coefficient is also used.
- a modified autocorrelation R ′ O obtained by multiplying the autocorrelation function R O (i) by a fixed coefficient w O (i). Coefficients that can be converted into linear prediction coefficients were obtained using (i). Therefore, it is not necessary to modify the autocorrelation R O (i) by the multiplication of the coefficient w O (i), that is, the autocorrelation R O (i) itself is not the modified autocorrelation R ′ O (i).
- the input signal is such that the peak of the spectrum does not become too large in the spectral envelope corresponding to the coefficient that can be converted to the linear prediction coefficient.
- the spectral envelope corresponding to the coefficient that can be converted into the linear prediction coefficient obtained by the modified autocorrelation R ′ O (i) is expressed by the input signal X O (n ) May be reduced in accuracy, that is, the accuracy of linear prediction analysis may be reduced.
- An object of the present invention is to provide a linear predictive analysis method, apparatus, program, and recording medium with higher analysis accuracy than in the past.
- a prediction coefficient calculation step for obtaining coefficients that can be converted into linear prediction coefficient
- the coefficient table corresponding to each order i in the second coefficient table is more than the coefficient corresponding to each order i in the first coefficient table for at least a part of each order i. large.
- the coefficient determined when the value is small is larger than the coefficient determined when the value having a positive correlation with the pitch gain is large, and the value having a positive correlation with the pitch gain is included.
- the quantized value of the period or period or the coefficient determined when the value negatively correlated with the fundamental frequency is large is the quantized value of the period or period
- the coefficient table is used in the coefficient determination step. If the coefficient is acquired from t0, (9) if the period is long and the pitch gain is small, the coefficient is determined from the coefficient table t2 in the coefficient determination step, and (2) if the period is short and the pitch gain is medium (3) If the period is short and the pitch gain is small, (4) If the period is medium and the pitch gain is large, (5) If the period is medium and the pitch gain is medium, (6) the period is If the pitch gain is medium, the pitch gain is small, (7) the period is long and the pitch gain is large, and (8) the period is long and the pitch gain is medium, the coefficient table t0, t1, t2 If a coefficient is acquired from any coefficient table, a coefficient determination step is required in the case of at least one of (2), (3), (4), (5), (6), (7), (8) In the case of (k), the coefficient is acquired in the coefficient determination step, assuming that the coefficient is acquired from the coefficient table t1.
- the coefficient table tj k number as j k that is j 1 ⁇ j 2 ⁇ j 3 , a j 4 ⁇ j 5 ⁇ j 6 , a j 7 ⁇ j 8 ⁇ j 9 , j 1 ⁇ j 4 ⁇ j 7 , j 2 ⁇ j 5 ⁇ j 8 , j 3 ⁇ j 6 ⁇ j 9 .
- a prediction coefficient calculation step for obtaining coefficients that can be converted into linear prediction coefficients from the first order to
- a prediction coefficient calculation step for obtaining a coefficient that can be converted into a prediction coefficient and w t0 (i) ⁇ w t1 (i) ⁇ w t2 (i) for at least some i, at least a portion of each i for w t0 (i) ⁇ w t1 (i) ⁇ w t2 (i) a and, for each of the remaining i w t0 (i) ⁇ w t1 (i) ⁇ w t2 (i)
- the coefficient determination step is determined when a value having a positive correlation with the pitch gain is small in at least two of the three ranges constituting a range that can have a value having a positive correlation with the fundamental frequency.
- a prediction coefficient calculation step for obtaining a coefficient that can be converted into a prediction coefficient and w t0 (i) ⁇ w t1 (i) ⁇ w t2 (i) for at least some i, at least a portion of each i for w t0 (i) ⁇ w t1 (i) ⁇ w t2 (i) a and, for each of the remaining i w t0 (i) ⁇ w t1 (i) ⁇ w t2 (i) Depending on the value that is positively correlated with the fundamental frequency and the value that is positively correlated with the pitch gain, (1) if the fundamental frequency is high and the pitch gain is large, from the coefficient table t0 in the coefficient determination step (9) The fundamental frequency is If the pitch gain is low and the coefficient is obtained from the coefficient table t2 in the coefficient determination step, (2) if the fundamental frequency is high and the pitch gain is medium, (3) if the fundamental frequency is high and the pitch gain is small (4) When the fundamental frequency is medium and the
- the flowchart for demonstrating the example of a linear prediction analysis method The flowchart for demonstrating the example of the linear prediction analysis method of 2nd embodiment.
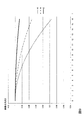
- the flowchart for demonstrating the example of the linear prediction analysis method of 2nd embodiment The figure which shows the example of the relationship between a fundamental frequency and pitch gain, and a coefficient.
- the flowchart for demonstrating the example of the linear prediction analysis method of 3rd embodiment The figure for demonstrating the specific example of 3rd embodiment.
- the block diagram for demonstrating a modification The block diagram for demonstrating a modification.
- the flowchart for demonstrating a modification The block diagram for demonstrating the example of the linear prediction analyzer of 4th embodiment.
- the block diagram for demonstrating the example of the linear prediction analyzer of the modification of 4th embodiment The block diagram for demonstrating the example of the conventional linear prediction apparatus.
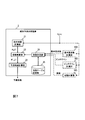
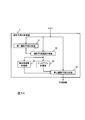
- the linear prediction analysis apparatus 2 includes, for example, an autocorrelation calculation unit 21, a coefficient determination unit 24, a coefficient multiplication unit 22, and a prediction coefficient calculation unit 23.
- the operations of the autocorrelation calculation unit 21, the coefficient multiplication unit 22, and the prediction coefficient calculation unit 23 are the same as the operations in the autocorrelation calculation unit 11, the coefficient multiplication unit 12, and the prediction coefficient calculation unit 13 of the conventional linear prediction analysis apparatus 1, respectively. is there.
- An input signal X O (n) that is a digital signal such as a digital speech signal, a digital acoustic signal, an electrocardiogram, an electroencephalogram, a magnetoencephalogram, or a seismic wave in a time domain for each frame that is a predetermined time interval is input to the linear predictive analyzer 2. Is done.
- the input signal is an input time series signal.
- the input signal of the current frame X O (n) (n 0,1, ..., N-1) to. n represents the sample number of each sample in the input signal, and N is a predetermined positive integer.
- Is X O (n) (n N, N + 1,..., 2N ⁇ 1).
- the linear prediction analysis apparatus 2 receives information about the fundamental frequency of the digital audio signal and digital acoustic signal for each frame and information about the pitch gain.
- Information about the fundamental frequency is obtained by the fundamental frequency calculation unit 930 outside the linear prediction analyzer 2.
- Information about the pitch gain is obtained by a pitch gain calculation unit 950 outside the linear prediction analyzer 2.
- Pitch gain is the strength of the periodicity of the input signal for each frame.
- the pitch gain is, for example, a normalized correlation between signals having a time difference corresponding to the pitch period of the input signal and its linear prediction residual signal.
- the fundamental frequency P is obtained, and information that can identify the fundamental frequency P is output as information about the fundamental frequency. There are various known methods for obtaining the fundamental frequency, and any known method may be used.
- the obtained fundamental frequency P may be encoded to obtain a fundamental frequency code, and the fundamental frequency code may be output as information about the fundamental frequency. Further, the fundamental frequency quantization value ⁇ P corresponding to the fundamental frequency code may be obtained, and the fundamental frequency quantization value ⁇ P may be output as information about the fundamental frequency.
- the fundamental frequency calculation unit 930 a specific example of the fundamental frequency calculation unit 930 will be described.
- Fundamental frequency calculation unit 930, P s1 is a fundamental frequency of the M sub-frames constituting the current frame, ..., a maximum value max (P s1, ..., P sM) of the P sM information capable of identifying the Output as information about the fundamental frequency.
- Nn is a predetermined positive integer that satisfies the relationship Nn ⁇ N
- the fundamental frequency calculation unit 930 also obtains the fundamental frequency P next obtained for the signal interval of the previous frame and stored in the fundamental frequency calculation unit 930, that is, the current frame of the signal interval of the immediately previous frame.
- the fundamental frequency for each of a plurality of subframes may be obtained.
- this is an example where the fundamental frequency calculation unit 930 is operated after the linear prediction analysis apparatus 2 for the same frame.
- the pitch gain G is obtained, and information that can specify the pitch gain G is output as information about the pitch gain. Since there are various known methods for obtaining the pitch gain, any known method may be used.
- the obtained pitch gain G may be encoded to obtain a pitch gain code, and the pitch gain code may be output as information about the pitch gain. Further, the pitch gain quantization value ⁇ G corresponding to the pitch gain code may be obtained, and the pitch gain quantization value ⁇ G may be output as information about the pitch gain.
- the pitch gain calculation unit 950 a specific example of the pitch gain calculation unit 950 will be described.
- Pitch gain calculator 950, G s1 is the pitch gain of the M sub-frames constituting the current frame, ..., a maximum value max (G s1, ..., G sM) of the G sM information capable of identifying the Output as information about pitch gain.
- the pitch gain calculation unit 950 obtains the signal interval of the previous frame and stores the pitch gain G next stored in the pitch gain calculation unit 950, that is, the current frame in the signal interval of the previous frame.
- the pitch gain for each of a plurality of subframes may be obtained for the current frame.
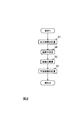
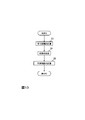
- FIG. 2 is a flowchart of a linear prediction analysis method performed by the linear prediction analysis apparatus 2.
- the input signal X O (n) (n -Np, -Np + 1, ..., -1, 0,1, ..., N-1, N, ..., N-1 + Nn
- the autocorrelation R O (i) may be calculated using part of the input signals of the previous and subsequent frames.
- Np and Nn are predetermined positive integers that satisfy the relationship of Np ⁇ N and Nn ⁇ N, respectively.
- the autocorrelation may be obtained from the approximated power spectrum by using the MDCT sequence as an approximation of the power spectrum. As described above, any known technique used in the world may be used as the autocorrelation calculation method.
- the coefficient w O (i) is a coefficient for transforming the autocorrelation R O (i).
- the coefficient w O (i) is also called a lag window w O (i) or a lag window coefficient w O (i) in the field of signal processing. Since the coefficient w O (i) is a positive value, the coefficient w O (i) is larger / smaller than the predetermined value, and the coefficient w O (i) is larger / smaller than the predetermined value. Sometimes expressed. Further, the size of w O (i), shall mean the value of the w O (i).
- the information about the fundamental frequency input to the coefficient determination unit 24 is information that specifies the fundamental frequency obtained from all or part of the input signal of the current frame and / or the input signal of a frame near the current frame. That is, the fundamental frequency used for determining the coefficient w O (i) is a fundamental frequency obtained from all or part of the input signal of the current frame and / or the input signal of a frame near the current frame.
- the information about the pitch gain input to the coefficient determination unit 24 is information for specifying the pitch gain obtained from all or part of the input signal of the current frame and / or the input signal of the frame near the current frame. That is, the pitch gain used for determining the coefficient w O (i) is a pitch gain obtained from all or part of the input signal of the current frame and / or the input signal of a frame near the current frame.
- the fundamental frequency corresponding to the information about the fundamental frequency and the pitch gain corresponding to the information about the pitch gain may be calculated from input signals in the same frame, or may be calculated from input signals in different frames. It may be.
- the coefficient determination unit 24 for all or some orders from the 0th order to the P max order, all or a possible range of the pitch gain corresponding to the information about the fundamental frequency and the pitch gain corresponding to the information about the fundamental frequency or
- the coefficient w O (0), w O is a value that may be smaller as the fundamental frequency corresponding to the information about the fundamental frequency is larger, and may be smaller as the pitch gain corresponding to the information about the pitch gain is larger. (1),..., determined as w O (P max ).
- the coefficient determination unit 24 uses a value that is positively correlated with the fundamental frequency instead of the fundamental frequency, and / or uses a value that is positively correlated with the pitch gain instead of the pitch gain, Such coefficients w O (0), w O (1),..., W O (P max ) may be determined.
- the coefficient determination unit 24 uses the monotonous non-increasing function for the weighted sum of the fundamental frequency and the pitch gain corresponding to the input fundamental frequency and the input pitch gain, respectively, to calculate the coefficient w O (i ).
- the coefficient w O (i) is determined by the following equation (1).
- f (G) is a function for obtaining a frequency that is positively correlated with the pitch gain G
- the weighting factors ⁇ and ⁇ are positive numbers. That is, H means a weighted sum of the fundamental frequency and the pitch gain.
- the coefficient w O (i) may be determined by the following equation (2) using ⁇ which is a predetermined value larger than 0.
- ⁇ is a value for adjusting the width of the lag window when the coefficient w O (i) is regarded as the lag window, in other words, the strength of the lag window.
- the predetermined ⁇ is obtained by encoding and decoding a speech signal or an acoustic signal with a coding device including the linear prediction analysis device 2 and a decoding device corresponding to the coding device for a plurality of candidate values of ⁇ , What is necessary is just to determine by selecting as a candidate value with favorable subjective quality and objective quality of a signal and a decoding acoustic signal as (alpha).
- the coefficient w O (i) may be determined by the following equation (2A) using a predetermined function f (P, G) for both the fundamental frequency P and the pitch gain G.
- the function f (P, G) is a function having a positive correlation with the fundamental frequency P and a positive correlation with the pitch gain G.
- the function f (P, G) is a function that is monotonously non-decreasing with respect to the fundamental frequency P and monotonically non-decreasing with respect to the pitch gain G.
- the equation for determining the coefficient w O (i) using the fundamental frequency P and the pitch gain G is not limited to the above equations (1), (2), (2A), and has a positive correlation with the fundamental frequency.
- Other expressions may be used as long as they can describe a monotonous non-increasing relationship with an increase in a certain value and a monotonous non-increasing relationship with an increase in a value positively correlated with pitch gain.
- the coefficient w O (i) may be determined by any one of the following formulas (3) to (6).
- a is a real number determined depending on the weighted sum of the fundamental frequency and pitch gain
- m is a natural number determined depending on the weighted sum of the fundamental frequency and pitch gain.
- a is a value that is negatively correlated with the weighted sum of the fundamental frequency and pitch gain
- m is a value that is negatively correlated with the weighted sum of the fundamental frequency and pitch gain.
- ⁇ is a sampling period.
- Equation (3) is a window function of the form called Bartlett window
- Equation (4) is a window function of the form called Binomial window defined by binomial coefficients
- Equation (5) is Triangular in frequency domain window
- (6) is a window function of the form called Rectangular in frequency domain window.
- the value of the coefficient w o (i) when the weighted sum H of the fundamental frequency and pitch gain is small is the coefficient w o (i ) Is larger than
- the coefficient w O (i) decreases monotonously with increasing values that are positively correlated with the fundamental frequency or pitch gain only for at least some orders i, not for each i of 0 ⁇ i ⁇ P max. And may decrease monotonically as the value increases in a positive correlation.
- the magnitude of the coefficient w O (i) may not monotonously decrease with an increase in the value that is positively correlated with the fundamental frequency, and may be a value that is positively correlated with the pitch gain. It does not have to monotonously decrease with the increase.
- the value of the coefficient w O (0) may be determined using any one of the above formulas (1) to (6), or in ITU-T G.718 etc.
- a fixed value may be used. That is, for each i of 1 ⁇ i ⁇ P max , the coefficient w O (i) takes a smaller value as the value having a positive correlation with the fundamental frequency or the value having a positive correlation with the pitch gain increases.
- the weighted sum of the fundamental frequency and the pitch gain may be used.
- a value having a positive correlation with both the fundamental frequency and the pitch gain such as a value obtained by multiplying the fundamental frequency and the pitch gain.
- the coefficient such that one of the at least one more pitch gain is greater coefficient w O (i) is less w O (i) may be used.
- the prediction coefficient calculation unit 23 obtains a coefficient that can be converted into a linear prediction coefficient using the modified autocorrelation R ′ O (i) output from the coefficient multiplication unit 22 (step S3).
- the prediction coefficient calculation unit 23 uses the modified autocorrelation R ′ O (i) and the PARCOR coefficient K O (1) from the first order to the P max order that is a predetermined prediction order by the Levinson-Durbin method or the like. ), K O (2), ..., K O (P max) and the linear prediction coefficients a O (1), a O (2), ..., and calculates and outputs a O (P max).
- the magnitude of O (i) is monotonically decreasing with increasing value that is positively correlated with the fundamental frequency of the signal interval including all or part of the input signal X O (n) of the current frame; Multiplying the autocorrelation by the coefficient w O (i), which includes the case of a monotonically decreasing relationship with an increase in the value that is positively correlated with the pitch gain, and transforming it into a linear prediction coefficient
- the quality is higher than the quality of the decoded speech signal and the decoded acoustic signal obtained by encoding and decoding the speech signal and the acoustic signal with the encoding device including the conventional linear prediction analysis device and the decoding device corresponding to the encoding device. ,good.
- the coefficient determination unit 24 is not a value having a positive correlation with the fundamental frequency and the pitch gain, but a value having a negative correlation with the fundamental frequency and a positive correlation with the pitch gain.
- the coefficient w O (i) is determined based on the related values.
- the value having a negative correlation with the fundamental frequency is, for example, a period, an estimated value of the period, or a quantized value of the period.
- the coefficient w O (i) is determined based on a value having a negative correlation with the fundamental frequency and a value having a positive correlation with the pitch gain will be described as a modification of the first embodiment.
- the functional configuration of the linear prediction analysis apparatus 2 according to the modification of the first embodiment and the flowchart of the linear prediction analysis method performed by the linear prediction analysis apparatus 2 are the same as those in the first embodiment shown in FIGS.
- the linear prediction analysis apparatus 2 of the modified example of the first embodiment is the same as the linear prediction analysis apparatus 2 of the first embodiment, except for the part where the processing of the coefficient determination unit 24 is different.
- the linear prediction analyzer 2 also receives information about the period of the digital audio signal and digital acoustic signal for each frame. Information about the period is obtained by the period calculation unit 940 outside the linear prediction analyzer 2.
- the period calculation unit 940 obtains the period T from all or part of the input signal X O of the current frame and / or the input signals of the frames near the current frame. For example, the period calculation unit 940 obtains the period T of the digital audio signal or digital acoustic signal in the signal section including all or part of the input signal X O (n) of the current frame, and the information that can identify the period T is determined as the period. Is output as information about. There are various known methods for obtaining the period, and any known method may be used. Alternatively, the obtained period T may be encoded to obtain a period code, and the period code may be output as information about the period. Furthermore, the quantization value ⁇ T of the period corresponding to the period code may be obtained, and the period quantization value ⁇ T may be output as information about the period. Hereinafter, a specific example of the period calculation unit 940 will be described.
- Period calculating section 940, T s1 is the period of M sub-frames constituting the current frame, ..., the minimum value min (T s1, ..., T sM) of the T sM for cycle specific information capable Is output as information.
- Nn a predetermined positive integer that satisfies the relationship Nn ⁇ N
- the period calculation unit 940 obtains the signal section of the previous frame and stores the period T next stored in the period calculation unit 940, that is, a part of the current frame in the signal section of the previous frame.
- input signal X O (n) (n 0, 1, ..., Nn-1) of the output cycle determined for the identifiable information as information about the period.
- the period for each of a plurality of subframes may be obtained.
- the linear prediction analyzer 2 also receives information about pitch gain.
- the information about the pitch gain is obtained by the pitch gain calculation unit 950 outside the linear prediction analyzer 2 as in the first embodiment.
- the information about the period input to the coefficient determination unit 24 is information that specifies the period obtained from all or part of the input signal of the current frame and / or the input signal of a frame near the current frame. That is, the period used for determining the coefficient w O (i) is a period obtained from all or part of the input signal of the current frame and / or the input signal of the frame near the current frame.
- the information about the pitch gain input to the coefficient determination unit 24 is information for specifying the pitch gain obtained from all or part of the input signal of the current frame and / or the input signal of the frame near the current frame. That is, the pitch gain used for determining the coefficient w O (i) is a pitch gain obtained from all or part of the input signal of the current frame and / or the input signal of a frame near the current frame.
- the period corresponding to the information about the period and the pitch gain corresponding to the information about the pitch gain may be calculated from the input signals in the same frame, or calculated from the input signals in different frames. It may be.
- the coefficient determination unit 24 may include all or part of a possible range of pitch gain corresponding to information about the period and pitch gain corresponding to information about the period and all or part of orders from the 0th order to the P max order.
- the coefficient w O (0), w O (1) the value may be larger as the period corresponding to the information about the period is larger, and may be smaller as the pitch gain corresponding to the information about the pitch gain is larger. ..., Determined as w O (P max ).
- the coefficient determination unit 24 uses a value that is positively correlated with the period instead of the period and / or uses a value that is positively correlated with the pitch gain instead of the pitch gain.
- the coefficients may be determined as w O (0), w O (1),..., W O (P max ).
- the coefficient determination unit 24 determines the coefficient w O (i) based on these expressions in which H in the above expressions (1) and (2) is replaced with the following H ′.
- H ⁇ ⁇ ⁇ f s / T + ⁇ ⁇ F (G)
- ⁇ and ⁇ are weighting factors and are positive numbers. That is, as T is larger, the value of H ′ is smaller, and as F (G) is larger, the value of H ′ is larger.
- the coefficient w O (i) may be determined by the following equation (2B) using a predetermined function f (T, G) for both the period T and the pitch gain G.
- the function f (T, G) is a function having a negative correlation with the period T and a positive correlation with the pitch gain G.
- the function f (T, G) is a function that is monotonically non-increasing with respect to the period T and monotonically non-decreasing with respect to the pitch gain G.
- the coefficient w O (i) increases monotonously with increasing values that are negatively correlated with the fundamental frequency or pitch gain only for at least some orders i, not for each i of 0 ⁇ i ⁇ P max. And may decrease monotonically as the value increases in a positive correlation. In other words, depending on the order i, the magnitude of the coefficient w O (i) may not increase monotonically with an increase in the value that is negatively correlated with the fundamental frequency. It does not have to monotonously decrease with the increase.
- a fixed value obtained empirically may be used. That is, for each i of 1 ⁇ i ⁇ P max , the coefficient w O (i) takes a larger value as the value having a negative correlation with the fundamental frequency is larger, and the value having a positive correlation with the pitch gain is larger. The larger the value, the smaller the value.
- the coefficient such that one of the at least one coefficient as pitch gain is large w O (i) is smaller w O (i) may be used.
- At least some prediction orders i are set according to a value that is negatively correlated with the fundamental frequency and a value that is positively correlated with the pitch gain.
- the value of the coefficient w O (i) corresponding to the order i is negatively correlated with the fundamental frequency of the signal section including all or part of the input signal X O (n) of the current frame.
- the autocorrelation function is multiplied by the coefficient w O (i), which includes the case of monotonically increasing with increasing and the case of monotonically decreasing with increasing value of the pitch gain in the same signal interval.
- the decoded speech signal and decoding obtained by encoding and decoding the speech signal and the acoustic signal with the encoding device including the linear prediction analysis device 2 of the modification of the first embodiment and the decoding device corresponding to the encoding device.
- the quality of the acoustic signal is determined based on the decoded speech signal and the decoded acoustic signal obtained by encoding and decoding the speech signal and the acoustic signal with the encoding device including the conventional linear prediction analysis device and the decoding device corresponding to the encoding device. Better than quality.
- a value that is positively or negatively correlated with the fundamental frequency of the input signal in the current or past frame is compared with a predetermined threshold value, and a value that is positively correlated with the pitch gain is compared with a predetermined value.
- a coefficient w O (i) is determined according to the comparison result.
- the second embodiment is different from the first embodiment only in the method of determining the coefficient w O (i) in the coefficient determination unit 24, and is the same as the first embodiment in other points. The following description will focus on the parts that are different from the first embodiment, and redundant description of the same parts as in the first embodiment will be omitted.
- a value that is positively correlated with the fundamental frequency is compared with a predetermined threshold value, and then a value that is positively correlated with the pitch gain is compared with a predetermined threshold value.
- An example of determining the coefficient w O (i) will be described, and a value having a negative correlation with the fundamental frequency is compared with a predetermined threshold, and then a value having a positive correlation with the pitch gain and the predetermined threshold are compared.
- An example of comparing and determining the coefficient w O (i) according to the comparison result will be described in the first modification of the second embodiment.
- the functional configuration of the linear prediction analysis apparatus 2 according to the second embodiment and the flowchart of the linear prediction analysis method performed by the linear prediction analysis apparatus 2 are the same as those in the first embodiment shown in FIGS.
- the linear prediction analysis apparatus 2 according to the second embodiment is the same as the linear prediction analysis apparatus 2 according to the first embodiment except for a portion where the processing of the coefficient determination unit 24 is different.
- FIG. 1 An example of the processing flow of the coefficient determination unit 24 of the second embodiment is shown in FIG.
- the coefficient determination unit 24 of the second embodiment performs, for example, the processing of each step S41A, step S42, step S43, step S44, and step S45 in FIG.
- the coefficient determination unit 24 compares a value that is positively correlated with the fundamental frequency corresponding to the information about the input fundamental frequency with a predetermined first threshold value (step S41A), and for the input pitch gain. A value having a positive correlation with the pitch gain corresponding to the information is compared with a predetermined second threshold (step S42).
- the value having a positive correlation with the fundamental frequency corresponding to the information about the input fundamental frequency is, for example, the fundamental frequency itself corresponding to the information about the input fundamental frequency.
- the value having a positive correlation with the pitch gain corresponding to the information about the input pitch gain is, for example, the pitch gain itself corresponding to the information about the input pitch gain.
- the coefficient determination unit 24 determines that the fundamental frequency is high when the value having a positive correlation with the fundamental frequency is equal to or greater than the predetermined first threshold, and otherwise determines that the fundamental frequency is low.
- the coefficient determination unit 24 determines that the pitch gain is large when the value positively correlated with the pitch gain is equal to or greater than the predetermined second threshold value, and otherwise determines that the pitch gain is small. .
- w h (i), w m (i), and w l (i) satisfy the relationship w h (i) ⁇ w m (i) ⁇ w l (i) for at least a part of each i.
- decide as follows.
- at least a part of each i is, for example, i other than 0 (that is, 1 ⁇ i ⁇ P max ).
- w h (i), w m (i), and w l (i) are w h (i) ⁇ w m (i) ⁇ w l (i) at least for each i, and other i W h (i) ⁇ w m (i) ⁇ w l (i) for at least a part of each i, w h (i) ⁇ w m (i) ⁇ w l for at least a part of each i Decide to satisfy the relationship (i).
- H1 ⁇ ⁇ P1 + ⁇ ⁇ f (G1)
- H2 ⁇ ⁇ P2 + ⁇ ⁇ f (G2)
- H2 ⁇ ⁇ P2 + ⁇ ⁇ f (G2)
- w h (i), w m (i), and w l (i) obtained in advance by any of these rules are stored in a table, and a value that is positively correlated with the fundamental frequency and a predetermined value are stored.
- the coefficient w m (i) between them may be determined using w h (i) and w l (i).
- ⁇ ′ is 0 ⁇ ⁇ ′ ⁇ 1, and the larger the fundamental frequency P and the pitch gain G, the larger the value of ⁇ ′.
- the smaller the fundamental frequency P and the pitch gain G, the more ⁇ This is a value obtained from the fundamental frequency P and the pitch gain G by the function ⁇ ′ c (P, G) that also decreases the value of “′”.
- the fundamental frequency and pitch gain of the input signal can be converted into a linear prediction coefficient that suppresses the occurrence of a spectrum peak due to the pitch component. Coefficients can be obtained, and coefficients that can be converted into linear prediction coefficients that can represent the spectral envelope even when the fundamental frequency and pitch gain of the input signal are small, and the analysis accuracy is higher than before. High linear prediction can be realized.
- w h (i), w m (i), and w l (i) there are three types of coefficients w h (i), w m (i), and w l (i), but two types of coefficients may be used.
- w h (i) and w l (i) may be used.
- w m (i) may be equal to w h (i) or w l (i).
- the first modified example of the second embodiment is not a value that is positively correlated with the fundamental frequency, but a value that is negatively correlated with the fundamental frequency is compared with a predetermined threshold value, and the pitch gain and positive value are compared.
- the correlation value is compared with a predetermined threshold value, and the coefficient w O (i) is determined according to the comparison result.
- the predetermined threshold that is compared with the value that is negatively correlated with the fundamental frequency in the first modification of the second embodiment is the predetermined threshold that is compared with the value that is positively correlated with the fundamental frequency in the second embodiment. It is different from the threshold.
- the functional configuration and flowchart of the linear prediction analysis apparatus 2 of the first modification of the second embodiment are the same as FIGS. 1 and 2 as the modification of the first embodiment.
- the linear prediction analysis apparatus 2 of the first modification example of the second embodiment is the same as the linear prediction analysis apparatus 2 of the modification example of the first embodiment, except that the processing of the coefficient determination unit 24 is different.
- FIG. 4 shows an example of the processing flow of the coefficient determination unit 24 of the first modification of the second embodiment.
- the coefficient determination unit 24 according to the first modification of the second embodiment performs, for example, the processes of steps S41B, S42, S43, S44, and S45 in FIG.
- the coefficient determination unit 24 compares a value that is negatively correlated with the fundamental frequency corresponding to the information about the input cycle with a predetermined third threshold value (step S41B), and for the input pitch gain. A value having a positive correlation with the pitch gain corresponding to the information is compared with a predetermined fourth threshold value (step S42).
- the value having a negative correlation with the fundamental frequency corresponding to the information about the input cycle is, for example, the cycle itself corresponding to the information about the input cycle.
- the value having a positive correlation with the pitch gain corresponding to the information about the input pitch gain is, for example, the pitch gain itself corresponding to the information about the input pitch gain.
- the coefficient determination unit 24 determines that the cycle is short when the value that is negatively correlated with the fundamental frequency is equal to or less than the predetermined third threshold, and otherwise determines that the cycle is long.
- the coefficient determination unit 24 determines that the pitch gain is large when the pitch gain is equal to or greater than a predetermined fourth threshold value, and determines that the pitch gain is small otherwise.
- w h (i), w m (i), and w l (i) satisfy the relationship w h (i) ⁇ w m (i) ⁇ w l (i) for at least a part of each i.
- decide as follows.
- at least a part of each i is, for example, i other than 0 (that is, 1 ⁇ i ⁇ P max ).
- w h (i), w m (i), and w l (i) are w h (i) ⁇ w m (i) ⁇ w l (i) at least for each i, and other i W h (i) ⁇ w m (i) ⁇ w l (i) for at least a part of each i, w h (i) ⁇ w m (i) ⁇ w l for at least a part of each i Decide to satisfy the relationship (i).
- w O (i) is obtained as w h (i)
- the period is T2 (where T1 ⁇ T2) and the pitch gain is G2 (where G1> G2)
- H3 ′ ⁇ ⁇ f s / T3 + ⁇ ⁇ f (G3)
- w h (i), w m (i), and w l (i) obtained in advance by any of these rules are stored in a table, and a value that is negatively correlated with the fundamental frequency and a predetermined value are stored.
- the coefficient w m (i) between them may be determined using w h (i) and w l (i).
- w h (i), w m (i), and w l (i) are used, but two types of coefficients may be used.
- w h (i) and w l (i) may be used.
- w m (i) may be equal to w h (i) or w l (i).
- Other processes are the same as described above.
- the coefficient having a positive correlation with the fundamental frequency is compared with one threshold, and the coefficient having a positive correlation with the pitch gain is compared with one threshold.
- the second modification of the second embodiment determines the coefficient w O (i) by comparing each of these values with two or more threshold values.
- the coefficient is calculated by comparing the value positively correlated with the fundamental frequency with the two threshold values fth1 'and fth2' and comparing the value positively correlated with the pitch gain with the two threshold values gth1 and gth2.
- a method for determining w O (i) will be described as an example.
- Threshold values fth1 'and fth2' satisfy the relationship 0 ⁇ fth1 ' ⁇ fth2', and threshold values gth1 and gth2 satisfy the relationship 0 ⁇ gth1 ⁇ gth2.
- the coefficient determination unit 24 compares a value having a positive correlation with the fundamental frequency corresponding to the information on the input fundamental frequency and the threshold values fth1 ′ and fth2 ′, and also provides information on the input pitch gain.
- the value having a positive correlation with the corresponding pitch gain is compared with the threshold values gth1 and gth2.
- the value having a positive correlation with the fundamental frequency corresponding to the information about the input fundamental frequency is, for example, the fundamental frequency itself corresponding to the information about the input fundamental frequency.
- the value having a positive correlation with the pitch gain corresponding to the information about the input pitch gain is, for example, the pitch gain itself corresponding to the information about the input pitch gain.
- the coefficient determining unit 24 determines that the fundamental frequency is high when the value that is positively correlated with the fundamental frequency is greater than the threshold value fth2 ′, and the value that is positively correlated with the fundamental frequency is greater than the threshold value fth1 ′. If the threshold frequency is fth2 ′ or less, it is determined that the fundamental frequency is medium, and if the value having a positive correlation with the fundamental frequency is equal to or less than the threshold fth1 ′, it is determined that the fundamental frequency is low.
- the coefficient determination unit 24 determines that the pitch gain is large when the value that is positively correlated with the pitch gain is larger than the threshold value gth2, and the value that is positively correlated with the pitch gain is greater than the threshold value gth1. If the value is greater than or equal to the threshold value gth2, the pitch gain is determined to be medium. If the value having a positive correlation with the pitch gain is equal to or less than the threshold value gth1, it is determined that the pitch gain is small.
- w h (i), w m (i), and w l (i) satisfy the relationship w h (i) ⁇ w m (i) ⁇ w l (i) for at least a part of each i.
- decide as follows.
- at least a part of each i is, for example, i other than 0 (that is, 1 ⁇ i ⁇ P max ).
- w h (i), w m (i), and w l (i) are w h (i) ⁇ w m (i) ⁇ w l (i) at least for each i, and other i W h (i) ⁇ w m (i) ⁇ w l (i) for at least a part of each i, w h (i) ⁇ w m (i) ⁇ w l for at least a part of each i Decide to satisfy the relationship (i).
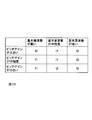
- Figure 5 summarizes the above relationships.
- the fundamental frequency when the fundamental frequency is low, the same coefficient is selected regardless of the size of the pitch gain.
- the present invention is not limited to this, and when the fundamental frequency is low, the smaller the pitch gain, the smaller the coefficient.
- the coefficient may be determined so as to increase.
- the coefficient determined when the fundamental frequency is low is high.
- the coefficient determined when the pitch gain is small is included in at least two of the three ranges constituting the range of values that can be taken by the fundamental frequency. The case where the coefficient is larger than the coefficient determined when is large is included.
- w h (i), w m (i), and w l (i) obtained in advance by any of these rules are stored in a table, and a value that is positively correlated with the fundamental frequency and a predetermined value are stored.
- the coefficient w m (i) between them may be determined using w h (i) and w l (i).
- ⁇ ′ is 0 ⁇ ⁇ ′ ⁇ 1, and the larger the fundamental frequency P and the pitch gain G, the larger the value of ⁇ ′.
- the smaller the fundamental frequency P and the pitch gain G, the more ⁇ This is a value obtained from the fundamental frequency P and the pitch gain G by the function ⁇ ′ c (P, G) that also decreases the value of “′”.
- linear prediction that suppresses the occurrence of spectral peaks due to pitch components even when the fundamental frequency and pitch gain of the input signal are high.
- a coefficient that can be converted into a coefficient can be obtained, and a coefficient that can be converted into a linear prediction coefficient that can represent a spectral envelope even when the fundamental frequency and pitch gain of the input signal are low, can be obtained. It is possible to realize linear prediction with higher analysis accuracy.
- the functional configuration and flowchart of the linear predictive analyzer 2 of the third modification of the second embodiment are the same as FIGS. 1 and 2 as in the first modification of the second embodiment.
- the linear prediction analysis apparatus 2 of the third modification example of the second embodiment is the same as the linear prediction analysis apparatus 2 of the first modification example of the second embodiment, except for the part where the processing of the coefficient determination unit 24 is different.
- Threshold values fth1 and fth2 satisfy the relationship 0 ⁇ fth1 ⁇ fth2, and threshold values gth1 and gth2 satisfy the relationship 0 ⁇ gth1 ⁇ gth2.
- the coefficient determination unit 24 compares a value having a negative correlation with the fundamental frequency corresponding to the information about the input period and the threshold values fth1 and fth2, and corresponds to the information about the input pitch gain. A value positively correlated with the pitch gain is compared with the threshold values gth1 and gth2.
- the value having a negative correlation with the fundamental frequency corresponding to the information about the input cycle is, for example, the cycle itself corresponding to the information about the input cycle.
- the value having a positive correlation with the pitch gain corresponding to the information about the input pitch gain is, for example, the pitch gain itself corresponding to the information about the input pitch gain.
- the coefficient determining unit 24 determines that the period is short when the value that is negatively correlated with the fundamental frequency is less than the threshold fth1, the value that is negatively correlated with the fundamental frequency is greater than or equal to the threshold fth1, and the threshold If it is less than fth2, the length of the cycle is determined to be medium, and if the value having a negative correlation with the fundamental frequency is greater than or equal to the threshold fth2, it is determined that the cycle is long.
- the coefficient determining unit 24 determines that the pitch gain is large, and the value that is positively correlated with the pitch gain is greater than the threshold value gth1.
- the value is large or less than the threshold value gth2, it is determined that the pitch gain is medium.
- the value having a positive correlation with the pitch gain is equal to or less than the threshold value gth1, it is determined that the pitch gain is small.
- w h (i), w m (i), and w l (i) satisfy the relationship w h (i) ⁇ w m (i) ⁇ w l (i) for at least a part of each i.
- decide as follows.
- at least a part of each i is, for example, i other than 0 (that is, 1 ⁇ i ⁇ P max ).
- w h (i), w m (i), and w l (i) are w h (i) ⁇ w m (i) ⁇ w l (i) at least for each i, and other i W h (i) ⁇ w m (i) ⁇ w l (i) for at least a part of each i, w h (i) ⁇ w m (i) ⁇ w l for at least a part of each i Decide to satisfy the relationship (i).
- w h (i), w m (i), and w l (i) obtained in advance by any of these rules are stored in a table, and a value that is negatively correlated with the fundamental frequency and a predetermined value are stored.
- the coefficient w m (i) between them may be determined using w h (i) and w l (i).
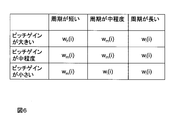
- Figure 6 summarizes the above relationships.
- the same coefficient is selected regardless of the magnitude of the pitch gain.
- the present invention is not limited to this, and when the period is long, the coefficient increases as the pitch gain decreases.
- the coefficient may be determined so that In short, for at least two of the three ranges constituting the range of values that the pitch gain can take, the coefficient determined when the period is long is determined for at least a part of each i when the period is short.
- the coefficient determined when the pitch gain is small is included in the range of at least two periods of the three ranges constituting the range of values that the period can take. This includes cases where the coefficient is larger than the coefficient determined when it is large.
- the occurrence of a spectrum peak due to the pitch component occurs even when the fundamental frequency and pitch gain of the input signal are high.
- a coefficient that can be converted to a linear prediction coefficient that suppresses noise and that can be converted to a linear prediction coefficient that can represent the spectral envelope even when the fundamental frequency and pitch gain of the input signal are low is obtained. Therefore, it is possible to realize linear prediction with higher analysis accuracy than in the past.
- the coefficient w O (i) is determined using a plurality of coefficient tables.
- the third embodiment is different from the first embodiment only in the method of determining the coefficient w O (i) in the coefficient determination unit 24, and is the same as the first embodiment in other points.
- the following description will focus on the parts that are different from the first embodiment, and redundant description of the same parts as in the first embodiment will be omitted.
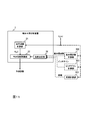
- the linear prediction analysis apparatus 2 of the third embodiment is different in the processing of the coefficient determination unit 24 and, as illustrated in FIG. 7, further includes a coefficient table storage unit 25, as shown in FIG. Same as device 2.
- the coefficient table storage unit 25 stores two or more coefficient tables.
- three or more coefficient tables are stored in the coefficient table storage unit 25 will be described first.
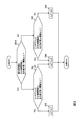
- FIG. 8 shows an example of the processing flow of the coefficient determination unit 24 of the third embodiment.
- the coefficient determination unit 24 according to the third embodiment performs, for example, the processes of steps S46 and S47 in FIG.
- the coefficient determination unit 24 has a positive correlation with a value that is positively correlated with the fundamental frequency corresponding to the information about the input fundamental frequency and a pitch gain corresponding to the information about the input pitch gain. From the three or more coefficient tables stored in the coefficient table storage unit 25 using the value, 1 corresponding to a value having a positive correlation with the fundamental frequency and a value having a positive correlation with the pitch gain.
- the coefficient tables t are selected (step S46). For example, a value having a positive correlation with the fundamental frequency corresponding to the information about the fundamental frequency is a fundamental frequency corresponding to the information about the fundamental frequency, and a positive correlation with the pitch gain corresponding to the information about the pitch gain.
- the value at is a pitch gain corresponding to information about the pitch gain.
- the coefficient determination unit 24 has a value that is positively correlated with the fundamental frequency equal to or greater than a predetermined first threshold value, and a value that is positively correlated with the pitch gain is equal to or greater than a predetermined second threshold value.
- the coefficient table t0 is selected as the coefficient table t, and the value positively correlated with the fundamental frequency is smaller than the predetermined first threshold and the value positively correlated with the pitch gain is equal to or greater than the predetermined second threshold.
- a value that is positively correlated with the fundamental frequency is greater than or equal to a predetermined first threshold and a value that is positively correlated with the pitch gain is less than a predetermined second threshold.
- table t1 When table t1 is selected as coefficient table t, the value positively correlated with the fundamental frequency is smaller than the predetermined first threshold, and the value positively correlated with the pitch gain is smaller than the predetermined second threshold Is related to coefficient table t2. It is selected as a table t.
- the coefficient table t0 having the smallest coefficient is selected as the coefficient table t, and the value that is positively correlated with the fundamental frequency is greater than the predetermined first threshold value. If the value that is small and has a positive correlation with the pitch gain is smaller than the predetermined second threshold value, that is, if it is determined that the fundamental frequency is low and the pitch gain is small, the coefficient for each i is the largest.
- the coefficient table t2 is selected as the coefficient table t.
- a value that is positively correlated with the fundamental frequency in the three coefficient tables stored in the coefficient table storage unit 25 is the first value, and is positively correlated with the pitch gain.
- the coefficient table t0 selected by the coefficient determination unit 24 when the value is the third value is defined as a first coefficient table t0, and the basic frequency in the three coefficient tables stored in the coefficient table storage unit 25 is The coefficient determining unit 24 when the value having a positive correlation is a second value smaller than the first value and the value having a positive correlation with the pitch gain is a fourth value smaller than the third value.
- the coefficient table t2 selected by the second coefficient table t2 is used as the second coefficient table t2, and the magnitude of the coefficient corresponding to each order i in the second coefficient table t2 is at least a part of each order i in the first coefficient table t0. Corresponding to each order i Larger than the size of the coefficient.
- the third coefficient table t1 is a coefficient table t1 that is a coefficient table selected when the first coefficient table t0 and the second coefficient table t2 are not selected.
- the coefficient corresponding to each order i in the table t1 is larger than the coefficient corresponding to each order i in the first coefficient table t0 and smaller than the coefficient corresponding to each order i in the second coefficient table t2.
- the coefficient determining unit 24, selected to get the size of the coefficients w t (i) corresponding to each order i from the coefficient table t, the coefficient w t of size corresponding to each order i obtained Let (i) be w O (i).
- the coefficient w O (i) based on an expression that is positively correlated with the fundamental frequency and the pitch gain. It is possible to perform with a small amount of calculation processing.
- the number of coefficient tables stored in the coefficient table storage unit 25 may be two.
- the coefficient determination unit 24 determines the coefficient w O (i) based on these two coefficient tables t0 and t2 as follows.
- the coefficient determining unit 24 has a positive correlation value with the fundamental frequency equal to or greater than a predetermined first threshold value, and the positive correlation value with the pitch gain is equal to or greater than a predetermined second threshold value. That is, if it is determined that the fundamental frequency is high and the pitch gain is large, the coefficient table t0 is selected as the coefficient table t. In other cases, the coefficient table t2 is selected as the coefficient table t.
- the coefficient determining unit 24 determines that the value having a positive correlation with the fundamental frequency is smaller than the predetermined first threshold and the value having a positive correlation with the pitch gain is smaller than the predetermined second threshold, that is, the basic When it is determined that the frequency is low and the pitch gain is small, the coefficient table t2 may be selected as the coefficient table t. In other cases, the coefficient table t0 may be selected as the coefficient table t.
- a value that is positively correlated with the fundamental frequency is the first value, and a positive correlation with the pitch gain.
- a certain value is the third value, it is more positively correlated with the fundamental frequency than the magnitude of the coefficient corresponding to each order i in the first coefficient table t0, which is the coefficient table t0 selected by the coefficient determining unit 24.
- a coefficient table selected by the coefficient determination unit 24 when the value is a second value smaller than the first value and the value positively correlated with the pitch gain is a fourth value smaller than the third value. It can be said that the magnitude of the coefficient corresponding to each degree i in the second coefficient table t2 which is t2 is large.
- second value ⁇ predetermined first threshold ⁇ first value and fourth value ⁇ predetermined second threshold ⁇ third value.
- the coefficient determination unit 24 uses a value that has a negative correlation with the input fundamental frequency and a value that has a positive correlation with the pitch gain, and uses the coefficient table storage unit 25. Selecting one coefficient table t corresponding to a value having a negative correlation with the input fundamental frequency and a value having a positive correlation with the pitch gain from the two or more coefficient tables stored in It is.
- the functional configuration and flowchart of the linear prediction analysis apparatus 2 of the first modification of the third embodiment are the same as those in the third embodiment shown in FIGS.
- the linear prediction analysis apparatus 2 according to the first modification of the third embodiment is the same as the linear prediction analysis apparatus 2 according to the third embodiment except for a portion where the processing of the coefficient determination unit 24 is different.
- the coefficient determination unit 24 has a negative correlation value with the fundamental frequency corresponding to the information about the input period and a positive correlation value with the pitch gain corresponding to the information about the input pitch gain. From the three coefficient tables stored in the coefficient table storage unit 25, one value corresponding to a value having a negative correlation with the fundamental frequency and a value having a positive correlation with the pitch gain is used. A coefficient table t is selected (step S46). In this case, the coefficient determination unit 24 has a value that is negatively correlated with the fundamental frequency equal to or greater than a predetermined third threshold value, and a value that is positively correlated with the pitch gain is less than a predetermined fourth threshold value.
- the coefficient table t2 is selected as the coefficient table t, the negative correlation value with the fundamental frequency is smaller than the predetermined third threshold value, and the positive correlation value with the pitch gain is less than the predetermined fourth threshold value. Or a value that is negatively correlated with the fundamental frequency is greater than or equal to a predetermined third threshold and a value that is positively correlated with the pitch gain is greater than or equal to a predetermined fourth threshold.
- the table t1 is selected as the coefficient table t, the value that is negatively correlated with the fundamental frequency is smaller than a predetermined third threshold value, and the value that is positively correlated with the pitch gain is greater than or equal to a predetermined fourth threshold value. If the coefficient table t0 is It is selected as the Bull t.
- the coefficient table t0 having the smallest coefficient for each i is selected as the coefficient table t, and the value that is negatively correlated with the fundamental frequency is equal to or greater than a predetermined third threshold value.
- the coefficient table t2 having the largest coefficient for each i Is selected as the coefficient table t.
- a value that is negatively correlated with the fundamental frequency in the three coefficient tables stored in the coefficient table storage unit 25 is the first value, and is positively correlated with the pitch gain.
- the coefficient table t0 selected by the coefficient determination unit 24 when the value is the third value is defined as a first coefficient table t0, and the basic frequency in the three coefficient tables stored in the coefficient table storage unit 25 is The coefficient determination unit 24 when the value having a negative correlation is a second value larger than the first value and the value having a positive correlation with the pitch gain is a fourth value smaller than the third value.
- the coefficient table t2 selected by the second coefficient table t2 is used as the second coefficient table t2, and the magnitude of the coefficient corresponding to each order i in the second coefficient table t2 is at least a part of each order i in the first coefficient table t0. Corresponding to each order i Larger than the size of the coefficient.
- a coefficient table t1 which is a coefficient table selected when the first coefficient table t0 and the second coefficient table t2 are not selected, is used as a third coefficient table, and at least a part of the third coefficient table for each order i.
- the coefficient corresponding to each order i in t1 is larger than the coefficient corresponding to each order i in the first coefficient table t0 and smaller than the coefficient corresponding to each order i in the second coefficient table t2.
- the first modified example of the third embodiment is different from the modified example of the first embodiment and the first modified example of the second embodiment, and has a negative correlation with the fundamental frequency, and has a positive correlation with the pitch gain. Since it is not necessary to calculate the coefficient w O (i) based on a certain formula, it is possible to perform with a smaller amount of calculation processing.
- the number of coefficient tables stored in the coefficient table storage unit 25 may be two.
- the coefficient determination unit 24 determines the coefficient w O (i) based on these two coefficient tables t0 and t2 as follows.
- the coefficient table t0 is selected as the coefficient table t.
- the coefficient table t2 is selected as the coefficient table t.
- the coefficient determination unit 24 when the value that is negatively correlated with the fundamental frequency is equal to or greater than a predetermined third threshold value and the value that is positively correlated with the pitch gain is smaller than a predetermined fourth threshold value, When it is determined that the cycle is long and the pitch gain is small, the coefficient table t2 may be selected as the coefficient table t, and in other cases, the coefficient table t0 may be selected as the coefficient table t.
- the value that is negatively correlated with the fundamental frequency is the first value and the pitch gain and the positive correlation
- a certain value is the third value, it is more negatively correlated with the fundamental frequency than the magnitude of the coefficient corresponding to each order i in the first coefficient table t0, which is the coefficient table t0 selected by the coefficient determining unit 24.
- a coefficient table selected by the coefficient determination unit 24 when the value is a second value larger than the first value and the value positively correlated with the pitch gain is a fourth value smaller than the third value. It can be said that the magnitude of the coefficient corresponding to each degree i in the second coefficient table t2 which is t2 is large.
- the first value ⁇ the predetermined third threshold ⁇ the second value
- the fourth value ⁇ the predetermined fourth threshold ⁇ the third value.
- the coefficient table is compared by comparing a value that is positively correlated with the fundamental frequency with one threshold value, and by comparing a value that is positively correlated with the pitch gain with one threshold value.
- each of these values is compared with two or more threshold values, and the coefficient w O (i) is determined according to the comparison result.
- the functional configuration and flowchart of the linear prediction analysis apparatus 2 of the second modification of the third embodiment are the same as those in the third embodiment, as shown in FIGS.
- the linear prediction analysis apparatus 2 according to the second modification of the third embodiment is the same as the linear prediction analysis apparatus 2 according to the third embodiment except for a portion where the processing of the coefficient determination unit 24 is different.
- the coefficient table storage unit 25 stores coefficient tables t0, t1, and t2. In the three coefficient tables t0, t1, t2, w t0 (i) ⁇ w t1 (i) ⁇ w t2 (i) for at least some i, and at least some of other i It is determined that w t0 (i) ⁇ w t1 (i) ⁇ w t2 (i) for each i and w t0 (i) ⁇ w t1 (i) ⁇ w t2 (i) for each remaining i.
- threshold values fth1 ′ and fth2 ′ satisfying the relationship 0 ⁇ fth1 ′ ⁇ fth2 ′ and threshold values gth1 and gth2 satisfying the relationship 0 ⁇ gth1 ⁇ gth2 are defined.
- the coefficient determination unit 24 is determined when a value having a positive correlation with the pitch gain is small in at least two of the three ranges that can be a range having a value having a positive correlation with the fundamental frequency.
- For at least two ranges of include the case where the coefficient determined when the value positively correlated with the fundamental frequency is smaller than the coefficient determined when the value positively correlated with the fundamental frequency is large
- the coefficient table stored in the coefficient table storage unit 25 is selected, and the coefficient stored in the selected coefficient table is obtained as the coefficient w O (i).
- the three ranges constituting the range in which a value having a positive correlation with the fundamental frequency can be taken are, for example, a range of a value> fth2 ′ having a positive correlation with the fundamental frequency (that is, a positive correlation with the fundamental frequency) ), Fth1 ' ⁇ value that is positively correlated with the fundamental frequency ⁇ fth2' range (that is, a medium value that is positively correlated with the fundamental frequency), fth1 ' ⁇ basic
- the three ranges constituting the range in which a value having a positive correlation with the pitch gain can take, for example, a range of a value having a positive correlation with the pitch gain ⁇ gth1 (that is, a positive correlation with the pitch gain). Range with a small value), gth1 ⁇ a value positively correlated with pitch gain ⁇ a range with gth2 (that is, a medium range with a positive correlation with pitch gain), and gth2 ⁇ pitch gain. These are the three ranges of a value having a positive correlation (that is, a range having a large value having a positive correlation with the pitch gain).
- the coefficient determination unit 24 is, for example, (1) When the value that is positively correlated with the fundamental frequency is greater than the threshold fth2 ′ and the value that is positively correlated with the pitch gain is greater than the threshold gth2, that is, when the fundamental frequency is high and the pitch gain is large.
- each coefficient w t0 (i) in the coefficient table t0 is selected as the coefficient w O (i), (2) When the value positively correlated with the fundamental frequency is greater than the threshold fth2 ′ and the value positively correlated with the pitch gain is greater than the threshold gth1 and less than or equal to the threshold gth2, that is, the fundamental frequency is When it is determined that the pitch gain is high and medium, each coefficient in one of the coefficient tables t0, t1, and t2 is selected as the coefficient w O (i), (3) When the value that is positively correlated with the fundamental frequency is greater than the threshold fth2 ′ and the value that is positively correlated with the pitch gain is less than or equal to the threshold gth1, that is, when the fundamental frequency is high and the pitch gain is small.
- each coefficient in the coefficient table t0, t1, t2 is selected as the coefficient w O (i), (4)
- the value positively correlated with the fundamental frequency is greater than the threshold fth1 ′ and less than or equal to the threshold fth2 ′, and the value positively correlated with the pitch gain is greater than the threshold gth2, that is, the fundamental frequency Is determined to be medium and the pitch gain is large
- each coefficient in one of the coefficient tables t0, t1, and t2 is selected as the coefficient w O (i)
- a value positively correlated with the fundamental frequency is greater than the threshold fth1 ′ and less than or equal to the threshold fth2 ′, and a value positively correlated with the pitch gain is greater than the threshold gth1 and less than or equal to the threshold gth2.
- each coefficient in one of the coefficient tables t0, t1, and t2 is selected as the coefficient w O (i).
- the value positively correlated with the fundamental frequency is greater than the threshold fth1 ′ and less than or equal to the threshold fth2 ′, and the value positively correlated with the pitch gain is less than or equal to the threshold gth1, that is,
- each coefficient in one of the coefficient tables t0, t1, and t2 is selected as the coefficient w O (i)
- the value positively correlated with the fundamental frequency is less than or equal to the threshold fth1 ′ and the value positively correlated with the pitch gain is greater than the threshold gth2, that is, the fundamental frequency is low and the pitch gain is large.
- each coefficient in the coefficient table t0, t1, t2 is selected as the coefficient w O (i), (8)
- the value positively correlated with the fundamental frequency is less than or equal to the threshold fth1 'and the value positively correlated with the pitch gain is greater than the threshold gth1 and less than or equal to the threshold gth2, that is, the fundamental frequency Is low and the pitch gain is determined to be medium
- each coefficient in one of the coefficient tables t0, t1, t2 is selected as the coefficient w O (i), (9)
- the value that is positively correlated with the fundamental frequency is less than or equal to the threshold fth1 ′ and the value that is positively correlated with the pitch gain is less than or equal to the threshold gth1, that is, the fundamental frequency is low and the pitch gain is small. If it is determined that, as the coefficients w t2 of the coefficient table t2 (i) is selected as the coefficient w O (i), the coefficient from the coefficient table stored in the coefficient table storage unit 25 w
- the coefficient is acquired from the coefficient table t0 by the coefficient determination unit 24, and in the case of (9), the coefficient is acquired from the coefficient table t2 by the coefficient determination unit 24, and (2), ( In the case of 3), (4), (5), (6), (7), (8), the coefficient is obtained from the coefficient table t0, t1, t2 by the coefficient determination unit 24. .
- the coefficient is acquired from the coefficient table t1 by the coefficient determination unit 24. .
- j 1, 2,..., 9 and j k is the number of the coefficient table tj k from which the coefficient is obtained in the coefficient determination step in the case of (k), j 1 ⁇ j 2 ⁇ j 3 , J 4 ⁇ j 5 ⁇ j 6 , j 7 ⁇ j 8 ⁇ j 9 , j 1 ⁇ j 4 ⁇ j 7 , j 2 ⁇ j 5 ⁇ j 8 , j 3 ⁇ j 6 a ⁇ j 9.
- the pitch gain G obtained by the pitch gain calculation unit 950 is input.
- the coefficient table storage unit 25 stores a coefficient table t0, a coefficient table t1, and a coefficient table t2.
- w t0 (i) [1.0001, 0.999566371, 0.998266613, 0.996104103, 0.993084457, 0.989215493, 0.984507263, 0.978971839, 0.972623467, 0.96547842, 0.957554817, 0.948872864, 0.939454317, 0.929322779, 0.918503404, 0.907022834, 0.894909143]
- w t1 (i) [1.0001, 0.999807253, 0.99922923, 0.99826661, 0.99692050, 0.99519245, 0.99308446, 0.99059895, 0.98773878, 0.98450724, 0.98090803, 0.97694527, 0.97262346, 0.96794752, 0.96292276, 0.95755484, 0.95184981]
- w t2 (i) [1.0001, 0.99995181, 0.99980725, 0.99956637, 0.99922923, 0.99879594, 0.99826661, 0.99764141, 0.99692050, 0.99610410, 0.99519245, 0.99418581, 0.99308446, 0.99188872, 0.99059895, 0.98921550, 0.98773878]
- FIG. 9 is a graph showing the magnitudes of the coefficients w t0 (i), w t1 (i), and w t2 (i) of the coefficient table t0, t1, t2.
- the dotted line in the graph of FIG. 9 represents the magnitude of the coefficient w t0 (i) of the coefficient table t0
- the alternate long and short dash line in the graph of FIG. 9 represents the magnitude of the coefficient w t1 (i) of the coefficient table t1.
- the solid line in the graph represents the magnitude of the coefficient w t2 (i) in the coefficient table t2.
- the horizontal axis of the graph of FIG. 9 represents the degree i
- the vertical axis of the graph of FIG. 9 represents the magnitude of the coefficient.
- the coefficient size monotonously decreases as the value of i increases in each coefficient table.
- the relationship of w t0 (i) ⁇ w t1 (i) ⁇ w t2 (i) is satisfied for i ⁇ 1. Yes.
- the plurality of coefficient tables stored in the coefficient table storage unit 25 are not limited to the above example as long as they have such a relationship.
- i 0, it is not necessary to satisfy the relationship of w t0 (i) ⁇ w t1 (i) ⁇ w t2 (i), and w t0 (0), w t1 (0), w t2 (0) does not necessarily have the same value.
- w t0 (0) 1.0001
- w t1 (0) 1.0
- w t2 (0) 1.0 as in
- w t0 (0) only for i 0, w t1 (0 )
- w t2 (0 ) May not satisfy the relationship of w t0 (i) ⁇ w t1 (i) ⁇ w t2 (i).
- the threshold fth1 ′ is 80
- the threshold fth2 ′ is 160
- the threshold gth1 is 0.3
- the threshold gth2 is 0.6.
- the basic frequency P and the pitch gain G are input to the coefficient determination unit 24.
- the coefficient table t2 is selected as the coefficient table t.
- the coefficient table t1 is selected as the coefficient table t.
- the coefficient table t1 is selected as the coefficient table t.
- t0 is selected as the coefficient table t.
- Fig. 10 shows the relationship between the fundamental frequency and pitch gain and the selected table.
- the coefficient determination unit 24 obtains the modified autocorrelation R ′ O (i) by multiplying the autocorrelation R O (i) by the coefficient w O (i) in the same manner as in the first embodiment.
- ⁇ Third Modification of Third Embodiment> a value that is negatively correlated with the fundamental frequency is compared with one threshold value, and a value that is positively correlated with the pitch gain is compared with one threshold value.
- the coefficient table is thus determined, but in the third modification of the third embodiment, each of these values is compared with two or more threshold values, and the coefficient w O (i) is determined according to these comparison results. Is.
- the functional configuration and flowchart of the linear predictive analyzer 2 of the third modified example of the third embodiment are the same as those in the third embodiment shown in FIGS.
- the linear prediction analysis apparatus 2 of the third modified example of the third embodiment is the same as the linear prediction analysis apparatus 2 of the third embodiment except for a portion where the processing of the coefficient determination unit 24 is different.
- the coefficient table storage unit 25 stores coefficient tables t0, t1, and t2. In the three coefficient tables t0, t1, t2, w t0 (i) ⁇ w t1 (i) ⁇ w t2 (i) for at least some i, and at least some of other i It is determined that w t0 (i) ⁇ w t1 (i) ⁇ w t2 (i) for each i and w t0 (i) ⁇ w t1 (i) ⁇ w t2 (i) for each remaining i.
- threshold values fth1 and fth2 satisfying the relationship 0 ⁇ fth1 ⁇ fth2 and threshold values gth1 and gth2 satisfying the relationship 0 ⁇ gth1 ⁇ gth2 are defined.
- the coefficient determination unit 24 has a positive correlation with the pitch gain in at least two of the three ranges that constitute a range that can take a period or a quantized value of the period or a value that has a negative correlation with the fundamental frequency. This includes cases where the coefficient determined when the value is small is larger than the coefficient determined when the value having a positive correlation with the pitch gain is large, and the value having a positive correlation with the pitch gain is taken.
- the period or period quantization value or the coefficient determined when the value negatively correlated with the fundamental frequency is large is the period or period quantization value or Select the coefficient table stored in the coefficient table storage unit 25 so as to include a case where the value that is negatively correlated with the fundamental frequency is larger than the coefficient determined when the value is small, Obtaining the coefficients stored in the-option coefficient table as coefficients w O (i).
- the three ranges constituting the period or a range that can be negatively correlated with the quantized value of the period or the fundamental frequency are, for example, a range of a value ⁇ fth1 that is negatively correlated with the fundamental frequency. (That is, the range or the value that is negatively correlated with the fundamental frequency or the quantized value of the period or the period) Value range that is negatively correlated with the quantized value or fundamental frequency), fth2 ⁇ range of values that are negatively correlated with the fundamental frequency (ie, the period or the quantized value of the period or the negative value of the fundamental frequency) The range having a large value in the correlation).
- the three ranges constituting the range in which a value having a positive correlation with the pitch gain can take, for example, a range of a value having a positive correlation with the pitch gain ⁇ gth1 (that is, a positive correlation with the pitch gain). Range with a small value), gth1 ⁇ a value positively correlated with pitch gain ⁇ a range with gth2 (that is, a medium range with a positive correlation with pitch gain), and gth2 ⁇ pitch gain. These are the three ranges of a value having a positive correlation (that is, a range having a large value having a positive correlation with the pitch gain).
- the coefficient determination unit 24 is, for example, (1) When the value that is negatively correlated with the fundamental frequency is smaller than the threshold fth1 and the value that is positively correlated with the pitch gain is larger than the threshold gth2, that is, when the cycle is short and the pitch gain is large. , Each coefficient w t0 (i) in the coefficient table t0 is selected as the coefficient w O (i), (2) When the value negatively correlated with the fundamental frequency is smaller than the threshold fth1 and the value positively correlated with the pitch gain is larger than the threshold gth1 and smaller than or equal to the threshold gth2, that is, the cycle is short.
- each coefficient in one of the coefficient tables t0, t1, and t2 is selected as the coefficient w O (i), (3)
- the value that is negatively correlated with the fundamental frequency is smaller than the threshold fth1 and the value that is positively correlated with the pitch gain is less than or equal to the threshold gth1, that is, when the cycle is short and the pitch gain is small .
- Each coefficient in one of the coefficient tables t0, t1, t2 is selected as the coefficient w O (i)
- a value that is negatively correlated with the fundamental frequency is greater than or equal to the threshold fth1 and smaller than the threshold fth2, and a value that is positively correlated with the pitch gain is greater than the threshold gth2, that is, the period is medium.
- each coefficient in the coefficient table t0, t1, t2 is selected as the coefficient w O (i), (5) A value that is negatively correlated with the fundamental frequency is greater than or equal to the threshold fth1 and smaller than the threshold fth2, and a value that is positively correlated with the pitch gain is greater than the threshold gth1 and less than or equal to the threshold gth2, that is, When the period is medium and the pitch gain is medium, each coefficient in one of the coefficient tables t0, t1, t2 is selected as the coefficient w O (i), (6) A value that is negatively correlated with the fundamental frequency is greater than or equal to the threshold fth1 and smaller than the threshold fth2, and a value that is positively correlated with the pitch gain is less than or equal to the threshold gth1, that is, the period is medium.
- each coefficient in the coefficient table t0, t1, t2 is selected as the coefficient w O (i), (7)
- the value that is negatively correlated with the fundamental frequency is greater than or equal to the threshold fth2
- the value that is positively correlated with the pitch gain is greater than the threshold gth2, that is, when the period is long and the pitch gain is large.
- Each coefficient of the coefficient table of coefficient table t0, t1, t2 is selected as coefficient w O (i), (8) A value that is negatively correlated with the fundamental frequency is greater than or equal to the threshold fth2 and a value that is positively correlated with the pitch gain is greater than the threshold gth1 and less than or equal to the threshold gth2, that is, the cycle is long When the pitch gain is medium, each coefficient in one of the coefficient tables t0, t1, t2 is selected as the coefficient w O (i), (9) When the value that is negatively correlated with the fundamental frequency is greater than or equal to the threshold fth2 and the value that is positively correlated with the pitch gain is less than or equal to the threshold gth1, that is, when the period is long and the pitch gain is small. Selects the coefficient w O (i) from the coefficient table stored in the coefficient table storage unit 25 so that each coefficient w t2 (i) of the coefficient table t2 is selected as the coefficient w O (i).
- the coefficient is acquired from the coefficient table t0 by the coefficient determination unit 24, and in the case of (9), the coefficient is acquired from the coefficient table t2 by the coefficient determination unit 24, and (2), ( In the case of 3), (4), (5), (6), (7), (8), the coefficient is obtained from the coefficient table t0, t1, t2 by the coefficient determination unit 24. .
- the coefficient is acquired from the coefficient table t1 by the coefficient determination unit 24. .
- j 1, 2,..., 9 and j k is the number of the coefficient table tj k from which the coefficient is obtained in the coefficient determination step in the case of (k), j 1 ⁇ j 2 ⁇ j 3 , J 4 ⁇ j 5 ⁇ j 6 , j 7 ⁇ j 8 ⁇ j 9 , j 1 ⁇ j 4 ⁇ j 7 , j 2 ⁇ j 5 ⁇ j 8 , j 3 ⁇ j 6 a ⁇ j 9.
- the pitch gain G obtained by the pitch gain calculation unit 950 is input.
- the threshold fth1 is 80
- the threshold fth2 is 160
- the threshold gth1 is 0.3
- the threshold gth2 is 0.6.
- the period T and the pitch gain G are input to the coefficient determination unit 24.
- the coefficient determination unit 24 calculates the coefficient table t0 as a coefficient. Select as table t.
- the coefficient table t1 is selected as the coefficient table t.
- the coefficient table t2 is selected as the coefficient table t.
- the coefficient stored in any one of the plurality of coefficient tables is determined as the coefficient w O (i).
- the fourth modified example of the third embodiment includes a plurality of coefficients. The case where the coefficient w O (i) is determined by the arithmetic processing based on the coefficient stored in the coefficient table is included.
- the functional configuration and flowchart of the linear prediction analysis apparatus 2 according to the fourth modification of the third embodiment are the same as those in the third embodiment shown in FIGS.
- the linear prediction analysis apparatus 2 of the fourth modified example of the third embodiment is different from the processing of the coefficient determination unit 24 except that the coefficient table stored in the coefficient table storage unit 25 is different from that of the third embodiment. This is the same as the prediction analysis apparatus 2.
- threshold values fth1 ′ and fth2 ′ satisfying the relationship 0 ⁇ fth1 ′ ⁇ fth2 ′ and threshold values gth1 and gth2 satisfying the relationship 0 ⁇ gth1 ⁇ gth2 are defined.
- the coefficient determination unit 24 is, for example, (1) When the value that is positively correlated with the fundamental frequency is greater than the threshold fth2 ′ and the value that is positively correlated with the pitch gain is greater than the threshold gth2, that is, when the fundamental frequency is high and the pitch gain is large.
- each coefficient w t0 (i) in the coefficient table t0 is selected as the coefficient w O (i), (2) When the value positively correlated with the fundamental frequency is greater than the threshold fth2 ′ and the value positively correlated with the pitch gain is greater than the threshold gth1 and less than or equal to the threshold gth2, that is, the fundamental frequency is When it is determined that the pitch gain is high and medium, each coefficient in the coefficient table t0 or t2 is selected as the coefficient w O (i) or from the coefficients in the coefficient tables t0 and t2.
- the coefficient to be calculated is the coefficient w O (i) (3)
- the value that is positively correlated with the fundamental frequency is greater than the threshold fth2 ′ and the value that is positively correlated with the pitch gain is less than or equal to the threshold gth1, that is, when the fundamental frequency is high and the pitch gain is small.
- each coefficient in one of the coefficient tables t0 and t2 is selected as the coefficient w O (i), or a coefficient obtained from each coefficient in the coefficient tables t0 and t2 is the coefficient w O ( i) and (4)
- the value positively correlated with the fundamental frequency is greater than the threshold fth1 ′ and less than or equal to the threshold fth2 ′, and the value positively correlated with the pitch gain is greater than the threshold gth2, that is, the fundamental frequency Is determined to be medium and the pitch gain is large
- each coefficient in one of the coefficient tables t0 and t2 is selected as the coefficient w O (i), or the coefficient tables t0 and t2
- the coefficient obtained from each coefficient is the coefficient w O (i), (5)
- a value positively correlated with the fundamental frequency is greater than the threshold fth1 ′ and less than or equal to the threshold fth2 ′, and a value positively correlated with the pitch gain is greater than the threshold gth1 and less than or equal to the
- each coefficient in one of the coefficient tables t0 and t2 selected as the coefficient w O (i)?
- a coefficient obtained from each coefficient in the coefficient tables t0 and t2 is a coefficient w O (i), (6)
- each coefficient in one of the coefficient tables t0 and t2 is selected as the coefficient w O (i), or the coefficient tables t0 and t2
- the coefficient obtained from each coefficient is the coefficient w O (i), (7)
- the value positively correlated with the fundamental frequency is less than or equal to the threshold fth1 ′ and the value positively correlated with the pitch gain is greater than the threshold gth2, that is
- each coefficient in the coefficient table t0, t2 is selected as the coefficient w O (i), or each coefficient in the coefficient tables t0 and t2 Is the coefficient w O (i), (9)
- the value that is positively correlated with the fundamental frequency is less than or equal to the threshold fth1 ′ and the value that is positively correlated with the pitch gain is less than or equal to the threshold gth1, that is, the fundamental frequency is low and the pitch gain is small.
- the coefficient is acquired from the coefficient table t0 by the coefficient determination unit 24, and in the case of (9), the coefficient is acquired from the coefficient table t2 by the coefficient determination unit 24, and (2), ( In the case of 3), (4), (5), (6), (7), (8), whether the coefficient is acquired from the coefficient table t0 or t2 by the coefficient determination unit 24, A coefficient is obtained from each coefficient obtained from coefficient tables t0 and t2, and at least one of (2), (3), (4), (5), (6), (7), (8) The coefficient is determined from the coefficients acquired from the coefficient tables t0 and t2 by the coefficient determination unit 24.
- j 1, 2,..., 9 and j k is the number of the coefficient table tj k from which the coefficient is obtained in the coefficient determination step in the case of (k), j 1 ⁇ j 2 ⁇ j 3 , J 4 ⁇ j 5 ⁇ j 6 , j 7 ⁇ j 8 ⁇ j 9 , j 1 ⁇ j 4 ⁇ j 7 , j 2 ⁇ j 5 ⁇ j 8 , j 3 ⁇ j 6 a ⁇ j 9.
- ⁇ ′ 0 ⁇ ⁇ ′ ⁇ 1
- the value of ⁇ ′ increases as the fundamental frequency P is high and the pitch gain G is large
- the value of ⁇ ′ increases as the fundamental frequency P is small and the pitch gain G is small.
- the gain G is large, a coefficient close to w h (i) can be obtained, and conversely, when the basic frequency P is low and the pitch gain G is small from among the coefficients obtained from the coefficients obtained from the coefficient tables t0 and t2, A coefficient close to w l (i) can be obtained.
- the coefficient stored in any one of the plurality of coefficient tables is determined as the coefficient w O (i).
- the fifth modified example of the third embodiment includes a plurality of coefficients. The case where the coefficient w O (i) is determined by the arithmetic processing based on the coefficient stored in the coefficient table is included.
- the functional configuration and flowchart of the linear predictive analyzer 2 of the fifth modified example of the third embodiment are the same as those in the third embodiment shown in FIGS.
- the linear prediction analysis apparatus 2 of the fifth modified example of the third embodiment is different from the processing of the coefficient determination unit 24 except that the coefficient table stored in the coefficient table storage unit 25 is different. This is the same as the prediction analysis apparatus 2.
- threshold values fth1 and fth2 satisfying the relationship 0 ⁇ fth1 ⁇ fth2 and threshold values gth1 and gth2 satisfying the relationship 0 ⁇ gth1 ⁇ gth2 are defined.
- the coefficient determination unit 24 is, for example, (1) When the value that is negatively correlated with the fundamental frequency is smaller than the threshold fth1 and the value that is positively correlated with the pitch gain is larger than the threshold gth2, that is, when the cycle is short and the pitch gain is large. , Each coefficient w t0 (i) in the coefficient table t0 is selected as the coefficient w O (i), (2) When the value negatively correlated with the fundamental frequency is smaller than the threshold fth1 and the value positively correlated with the pitch gain is larger than the threshold gth1 and smaller than or equal to the threshold gth2, that is, the cycle is short.
- each coefficient in the coefficient table t0 or t2 is selected as the coefficient w O (i), or the coefficient obtained from each coefficient in the coefficient tables t0 and t2 is the coefficient w O (i) (3)
- the value that is negatively correlated with the fundamental frequency is smaller than the threshold fth1 and the value that is positively correlated with the pitch gain is less than or equal to the threshold gth1, that is, when the cycle is short and the pitch gain is small
- Each coefficient in the coefficient table t0, t2 is selected as a coefficient w O (i), or a coefficient obtained from each coefficient in the coefficient tables t0 and t2 is a coefficient w O (i)
- a value that is negatively correlated with the fundamental frequency is greater than or equal to the threshold fth1 and smaller than the threshold fth2, and a value that is positively correlated with the pitch gain is greater than the threshold gth2, that is, the period is medium.
- each coefficient in the coefficient table t0 or t2 is selected as the coefficient w O (i), or the coefficient obtained from each coefficient in the coefficient tables t0 and t2 is the coefficient w O (i) (5)
- a value that is negatively correlated with the fundamental frequency is greater than or equal to the threshold fth1 and smaller than the threshold fth2, and a value that is positively correlated with the pitch gain is greater than the threshold gth1 and less than or equal to the threshold gth2, that is,
- each coefficient in the coefficient table t0 or t2 is selected as the coefficient w O (i) or the coefficient tables t0 and t2
- the coefficient obtained from each coefficient is the coefficient w O (i)
- a value that is negatively correlated with the fundamental frequency is greater than or equal to the threshold fth1 and smaller than the threshold fth2, and a value that is positively correlated with the pitch gain is less than or equal to the threshold gth1, that is, the period
- each coefficient in the coefficient table t0 or t2 is selected as the coefficient w O (i), or the coefficient obtained from each coefficient in the coefficient tables t0 and t2 is the coefficient w O (i) (7)
- the value that is negatively correlated with the fundamental frequency is greater than or equal to the threshold fth2
- the value that is positively correlated with the pitch gain is greater than the threshold gth2, that is, when the period is long and the pitch gain is large.
- Each coefficient in the coefficient table t0, t2 is selected as a coefficient w O (i), or a coefficient obtained from each coefficient in the coefficient tables t0 and t2 is a coefficient w O (i), (8) A value that is negatively correlated with the fundamental frequency is greater than or equal to the threshold fth2 and a value that is positively correlated with the pitch gain is greater than the threshold gth1 and less than or equal to the threshold gth2, that is, the cycle is long
- each coefficient in one of the coefficient tables t0 and t2 is selected as the coefficient w O (i), or the coefficient obtained from each coefficient in the coefficient tables t0 and t2 is The coefficient w O (i) (9)
- the value that is negatively correlated with the fundamental frequency is greater than or equal to the threshold fth2 and the value that is positively correlated with the pitch gain is less than or equal to the threshold gth1, that is, when the period is long and the pitch gain is small.
- the coefficient is acquired from the coefficient table t0 by the coefficient determination unit 24, and in the case of (9), the coefficient is acquired from the coefficient table t2 by the coefficient determination unit 24, and (2), ( In the case of 3), (4), (5), (6), (7), (8), whether the coefficient is acquired from one of the coefficient tables t0, t2 by the coefficient determining unit 24, A coefficient is obtained from each coefficient obtained from the coefficient tables t0 and t2, In the case of at least one of (2), (3), (4), (5), (6), (7), and (8), the coefficient determination unit 24 acquires each of the coefficient tables t0 and t2. A coefficient is obtained from the coefficient.
- j 1, 2,..., 9 and j k is the number of the coefficient table tj k from which the coefficient is obtained in the coefficient determination step in the case of (k), j 1 ⁇ j 2 ⁇ j 3 , J 4 ⁇ j 5 ⁇ j 6 , j 7 ⁇ j 8 ⁇ j 9 , j 1 ⁇ j 4 ⁇ j 7 , j 2 ⁇ j 5 ⁇ j 8 , j 3 ⁇ j 6 a ⁇ j 9.
- ⁇ 0 ⁇ ⁇ ⁇ 1
- ⁇ b
- FIGS. 11 and 12 are configuration examples of the linear prediction analysis apparatus 2 corresponding to FIGS. 1 and 7, respectively.
- the prediction coefficient calculation unit 23 calculates the modified autocorrelation R ′ O (i), which is a product of the coefficient w O (i) and the autocorrelation R O (i). Instead, linear prediction analysis is performed by directly using the coefficient w O (i) and the autocorrelation R O (i) (step S5).
- linear prediction analysis is performed on the input signal X O (n) using a conventional linear prediction analysis apparatus, and the fundamental frequency calculation unit and the pitch gain calculation unit use the results of the linear prediction analysis.
- the fundamental frequency and pitch gain are obtained, respectively, and the coefficient w O (i) based on the obtained fundamental frequency and pitch gain is used to obtain a coefficient that can be converted into a linear prediction coefficient by the linear prediction analysis apparatus of the present invention. .
- the linear prediction analysis apparatus 3 of the fourth embodiment includes a first linear prediction analysis unit 31, a linear prediction residual calculation unit 32, a fundamental frequency calculation unit 33, a pitch gain calculation unit 36, and a second linear
- a prediction analysis unit 34 is provided.
- Linear prediction residual calculation unit 32 performs filtering equivalent to or similar to linear prediction based on coefficients that can be converted into linear prediction coefficients from the first order to the P max order with respect to the input signal X O (n). Processing is performed to obtain a linear prediction residual signal X R (n). Since the filtering process can also be called a weighting process, the linear prediction residual signal X R (n) can also be said to be a weighted input signal.
- the fundamental frequency calculator 33 obtains the fundamental frequency P of the linear prediction residual signal X R (n) and outputs information about the fundamental frequency.
- P s1 is a fundamental frequency of the M sub-frames constituting the current frame, ..., a maximum value max (P s1, ..., P sM) of the P sM can identify Is output as information about the fundamental frequency.
- the pitch gain calculation unit 36 can specify the maximum value max (G s1 ,..., GP sM ) of G s1 ,..., G sM that is the pitch gain of the M subframes constituting the current frame. Is output as information about pitch gain.
- the second linear prediction analysis unit 34 includes a linear prediction analysis device 2 according to the first embodiment of the present invention, a linear prediction analysis device 2 according to the second embodiment, a linear prediction analysis device 2 according to a second modification of the second embodiment, The linear prediction analysis device 2 of the third embodiment, the linear prediction analysis device 2 of the second modification of the third embodiment, the linear prediction analysis device 2 of the fourth modification of the third embodiment, the first to third The same operation as that of any one of the linear prediction analysis apparatuses 2 of the modification common to the embodiment is performed.
- linear prediction analysis is performed on the input signal X O (n) using a conventional linear prediction analysis apparatus, and a period calculation unit and pitch gain calculation are performed using the result of the linear prediction analysis.
- a period calculation unit and pitch gain calculation are performed using the result of the linear prediction analysis.
- Each obtains a period and a pitch gain, and uses the coefficient w O (i) based on the obtained period and pitch gain to obtain a coefficient that can be converted into a linear prediction coefficient by the linear prediction analysis apparatus of the present invention.
- the linear prediction analysis device 3 includes a first linear prediction analysis unit 31, a linear prediction residual calculation unit 32, a period calculation unit 35, a pitch gain calculation unit 36, For example, a bilinear prediction analysis unit 34 is provided.
- the first linear prediction analysis unit 31 and the linear prediction residual calculation unit 32 of the linear prediction analysis device 3 of the modification of the fourth embodiment are the same as the linear prediction analysis device 3 of the fourth embodiment, respectively.
- a description will be given centering on differences from the fourth embodiment.
- T s1 is the period of M sub-frames constituting the current frame, ..., the minimum value min (T s1 ..., T sM ) can identify the information in the T sM Output as information about the period.
- the second linear prediction analysis unit 34 of the modification of the fourth embodiment includes the linear prediction analysis apparatus 2 of the modification of the first embodiment of the present invention, the linear prediction analysis apparatus 2 of the first modification of the second embodiment, The linear prediction analysis apparatus 2 of the third modification of the second embodiment, the linear prediction analysis apparatus 2 of the first modification of the third embodiment, the linear prediction analysis apparatus 2 of the third modification of the third embodiment, the third The same operation as that of any one of the linear prediction analysis apparatus 2 of the fifth modification of the embodiment and the linear prediction analysis apparatus 2 of the modification common to the first to third embodiments is performed.
- ⁇ Values that are positively correlated with the fundamental frequency> As described in the second specific example of the fundamental frequency calculation unit 930 in the first embodiment, a sample part that is pre-read and used as a look-ahead in the signal processing of the previous frame as a value having a positive correlation with the fundamental frequency. Of these, the fundamental frequency of the portion corresponding to the sample of the current frame may be used.
- an estimated value of the fundamental frequency may be used as a value that has a positive correlation with the fundamental frequency.
- the estimated value of the fundamental frequency for the current frame predicted from the fundamental frequency of the past multiple frames, and the average, minimum, or maximum value of the fundamental frequency for the past multiple frames are used as the estimated fundamental frequency. It may be used. Further, an average value, a minimum value, or a maximum value of the fundamental frequency for a plurality of subframes may be used as the estimated value of the fundamental frequency.
- the quantized value of the fundamental frequency may be used as a value that has a positive correlation with the fundamental frequency. That is, the fundamental frequency before quantization may be used, or the fundamental frequency after quantization may be used.
- the fundamental frequency for any analyzed channel may be used.
- ⁇ Values that are negatively correlated with the fundamental frequency> As described as specific example 2 of the period calculation unit 940 in the first embodiment, as a value having a negative correlation with the fundamental frequency, a sample part that is pre-read and used in the signal processing of the previous frame is also used. Of these, the period T of the portion corresponding to the sample of the current frame may be used.
- an estimated value of the period T may be used as a value that is negatively correlated with the fundamental frequency.
- the estimated value of the period T for the current frame predicted from the fundamental frequency of the past multiple frames, and the average value, minimum value, or maximum value of the period T for the past multiple frames are used as the estimated value of the period T. It may be used.
- an average value, minimum value, or maximum value of the period T for a plurality of subframes may be used as an estimated value of the fundamental frequency.
- a quantized value of period T may be used as a value that is negatively correlated with the fundamental frequency. That is, the period T before quantization may be used, or the period T after quantization may be used.
- the period T for any analyzed channel may be used.
- ⁇ Values that have a positive correlation with pitch gain> As described as the specific example 2 of the pitch gain calculation unit 950 in the first embodiment, a sample part that is pre-read and used as a look-ahead in the signal processing of the previous frame as a value having a positive correlation with the pitch gain. Of these, the pitch gain of the portion corresponding to the sample of the current frame may be used.
- the threshold value In the comparison between the threshold value and the value that is positively correlated with the fundamental frequency, the value that is negatively correlated with the fundamental frequency, and the value that is positively correlated with the pitch gain in each of the above embodiments and modifications. Is adjacent to the threshold when the value that is positively correlated with the fundamental frequency, the value that is negatively correlated with the fundamental frequency, or the value that is positively correlated with the pitch gain is the same value as the threshold. What is necessary is just to set so that it may be divided into any one of two cases.
- a case where the threshold value is greater than or equal to a certain threshold value may be a case where the threshold value is greater than the threshold value, and a case where the value is smaller than the threshold value may be the case where the threshold value is equal to or less than the threshold value.
- a case where the value is greater than a certain threshold value may be a case where the value is equal to or greater than the threshold value, and a case where the value is equal to or less than the threshold value may be defined as a case where the value is smaller than the threshold value.
- each step in the linear prediction analysis method is realized by a computer, the processing contents of the functions that the linear prediction analysis method should have are described by a program. And each step is implement
- the program describing the processing contents can be recorded on a computer-readable recording medium.
- a computer-readable recording medium any recording medium such as a magnetic recording device, an optical disk, a magneto-optical recording medium, and a semiconductor memory may be used.
- each processing means may be configured by executing a predetermined program on a computer, or at least a part of these processing contents may be realized by hardware.
Landscapes
- Engineering & Computer Science (AREA)
- Physics & Mathematics (AREA)
- Health & Medical Sciences (AREA)
- Signal Processing (AREA)
- Audiology, Speech & Language Pathology (AREA)
- Human Computer Interaction (AREA)
- Computational Linguistics (AREA)
- Acoustics & Sound (AREA)
- Multimedia (AREA)
- Spectroscopy & Molecular Physics (AREA)
- Compression, Expansion, Code Conversion, And Decoders (AREA)
- Measurement Of Length, Angles, Or The Like Using Electric Or Magnetic Means (AREA)
- Complex Calculations (AREA)
- Measurement And Recording Of Electrical Phenomena And Electrical Characteristics Of The Living Body (AREA)
- Auxiliary Devices For Music (AREA)
Abstract
Description
線形予測分析装置1の自己相関計算部11は、入力信号XO(n)から自己相関RO(i) (i=0,1,…,Pmax,Pmaxは予測次数)を式(11)により求めて出力する。Pmaxは、N未満の所定の正の整数である。

次に、係数乗算部12が、自己相関計算部11から出力された自己相関RO(i)に予め定めた係数wO(i) (i=0,1,…,Pmax)を同じiごとに乗じることにより、変形自己相関R' O(i)を求める。すなわち、変形自己相関R' O(i)を式(12)により求める。

そして、予測係数計算部13が、係数乗算部12から出力された変形自己相関R'O(i)を用いて例えばLevinson-Durbin法などにより、1次から予め定めた予測次数であるPmax次までの線形予測係数に変換可能な係数を求める。線形予測係数に変換可能な係数とは、PARCOR係数KO(1),KO(2),…,KO(Pmax)や線形予測係数aO(1),aO(2),…,aO(Pmax)等である。

第一実施形態の線形予測分析装置2は、図1に示すように、自己相関計算部21、係数決定部24、係数乗算部22及び予測係数計算部23を例えば備えている。自己相関計算部21、係数乗算部22及び予測係数計算部23の動作は、従来の線形予測分析装置1の自己相関計算部11、係数乗算部12及び予測係数計算部13における動作とそれぞれ同じである。
基本周波数計算部930は、現フレームの入力信号XO(n) (n=0, 1, …, N-1)および/または現フレームの近傍のフレームの入力信号の全部または一部から基本周波数Pを求める。基本周波数計算部930は、例えば、現フレームの入力信号XO(n) (n=0, 1, …, N-1)の全部または一部を含む信号区間のディジタル音声信号やディジタル音響信号の基本周波数Pを求め、基本周波数Pを特定可能な情報を基本周波数についての情報として出力する。基本周波数を求める方法としては、様々な公知の方法が存在するので、公知の何れの方法を用いてもよい。また、求めた基本周波数Pを符号化して基本周波数符号を得る構成とし、基本周波数符号を基本周波数についての情報として出力してもよい。さらに基本周波数符号に対応する基本周波数の量子化値^Pを得る構成とし、基本周波数の量子化値^Pを基本周波数についての情報として出力してもよい。以下、基本周波数計算部930の具体例について説明する。
基本周波数計算部930の具体例1は、現フレームの入力信号XO(n) (n=0, 1, …, N-1)が複数個のサブフレームで構成されている場合、かつ、同一のフレームについては線形予測分析装置2よりも先に基本周波数計算部930が動作される場合、の例である。基本周波数計算部930は、まず、2以上の整数であるM個のサブフレームであるXOs1(n) (n=0, 1, …, N/M-1), …, XOsM(n)(n= (M-1)N/M, (M-1)N/M+1, …, N-1)のそれぞれの基本周波数であるPs1, …, PsMを求める。NはMで割り切れるとする。基本周波数計算部930は、現フレームを構成するM個のサブフレームの基本周波数であるPs1, …, PsMのうちの最大値max(Ps1, …, PsM)を特定可能な情報を基本周波数についての情報として出力する。
基本周波数計算部930の具体例2は、現フレームの入力信号XO(n) (n=0, 1, …, N-1)と1つ後のフレームの一部の入力信号XO(n) (n=N, N+1, …, N+Nn-1) (ただし、Nnは、Nn<Nという関係を満たす所定の正の整数。)とで、先読み部分を含む信号区間が現フレームの信号区間として構成されている場合であり、かつ、同一のフレームについては線形予測分析装置2よりも後に基本周波数計算部930が動作される場合、の例である。基本周波数計算部930は、現フレームの信号区間について、現フレームの入力信号XO(n) (n=0, 1, …, N-1)と1つ後のフレームの一部の入力信号XO(n) (n=N, N+1, …, N+Nn-1)のそれぞれの基本周波数であるPnow, Pnextを求め、基本周波数Pnextを基本周波数計算部930に記憶する。基本周波数計算部930は、また、1つ前のフレームの信号区間について求めて基本周波数計算部930に記憶されていた基本周波数Pnext、すなわち、1つ前のフレームの信号区間のうちの現フレームの一部の入力信号XO(n) (n=0, 1, …, Nn-1)について求めた基本周波数、を特定可能な情報を基本周波数についての情報として出力する。なお、具体例1と同様に、現フレームについては複数のサブフレームごとの基本周波数を求めてもよい。
基本周波数計算部930の具体例3は、現フレームの入力信号XO(n) (n=0, 1, …, N-1)そのものが現フレームの信号区間として構成されている場合であり、かつ、同一のフレームについては線形予測分析装置2よりも後に基本周波数計算部930が動作される場合、の例である。基本周波数計算部930は、現フレームの信号区間である現フレームの入力信号XO(n) (n=0, 1, …, N-1)の基本周波数Pを求め、基本周波数Pを基本周波数計算部930に記憶する。基本周波数計算部930は、また、1つ前のフレームの信号区間、すなわち、1つ前のフレームの入力信号XO(n) (n=-N, -N+1, …, -1)について求めて基本周波数計算部930に記憶されていた基本周波数Pを特定可能な情報を基本周波数についての情報として出力する。
ピッチゲイン計算部950は、現フレームの入力信号XO(n) (n=0, 1, …, N-1)および/または現フレームの近傍のフレームの入力信号の全部または一部からピッチゲインGを求める。ピッチゲイン計算部950は、例えば、現フレームの入力信号XO(n) (n=0, 1, …, N-1)の全部または一部を含む信号区間のディジタル音声信号やディジタル音響信号のピッチゲインGを求め、ピッチゲインGを特定可能な情報をピッチゲインについての情報として出力する。ピッチゲインを求める方法としては、様々な公知の方法が存在するので、公知の何れの方法を用いてもよい。また、求めたピッチゲインGを符号化してピッチゲイン符号を得る構成とし、ピッチゲイン符号をピッチゲインについての情報として出力してもよい。さらにピッチゲイン符号に対応するピッチゲインの量子化値^Gを得る構成とし、ピッチゲインの量子化値^Gをピッチゲインについての情報として出力してもよい。以下、ピッチゲイン計算部950の具体例について説明する。
ピッチゲイン計算部950の具体例1は、現フレームの入力信号XO(n) (n=0, 1, …, N-1)が複数個のサブフレームで構成されている場合、かつ、同一のフレームについては線形予測分析装置2よりも先にピッチゲイン計算部950が動作される場合、の例である。ピッチゲイン計算部950は、まず、2以上の整数であるM個のサブフレームであるXOs1(n) (n=0, 1, …, N/M-1), …, XOsM(n)(n= (M-1)N/M, (M-1)N/M+1, …, N-1)のそれぞれのピッチゲインであるGs1,…,GsMを求める。NはMで割り切れるとする。ピッチゲイン計算部950は、現フレームを構成するM個のサブフレームのピッチゲインであるGs1,…, GsMのうちの最大値max(Gs1,…,GsM)を特定可能な情報をピッチゲインについての情報として出力する。
ピッチゲイン計算部950の具体例2は、現フレームの入力信号XO(n) (n=0, 1, …, N-1)と1つ後のフレームの一部の入力信号XO(n) (n=N, N+1, …, N+Nn-1)とで、先読み部分を含む信号区間が現フレームの信号区間として構成されている場合であり、かつ、同一のフレームについては線形予測分析装置2よりも後にピッチゲイン計算部950が動作される場合、の例である。ピッチゲイン計算部950は、現フレームの信号区間について、現フレームの入力信号XO(n) (n=0, 1, …, N-1)と1つ後のフレームの一部の入力信号XO(n) (n=N, N+1, …, N+Nn-1)のそれぞれのピッチゲインであるGnow, Gnextを求め、ピッチゲインGnextをピッチゲイン計算部950に記憶する。ピッチゲイン計算部950は、また、1つ前のフレームの信号区間について求めてピッチゲイン計算部950に記憶されていたピッチゲインGnext、すなわち、1つ前のフレームの信号区間のうちの現フレームの一部の入力信号XO(n) (n=0, 1, …, Nn-1)について求めたピッチゲイン、を特定可能な情報をピッチゲインについての情報として出力する。なお、具体例1と同様に、現フレームについては複数のサブフレームごとのピッチゲインを求めてもよい。
ピッチゲイン計算部950の具体例3は、現フレームの入力信号XO(n) (n=0, 1, …, N-1)そのものが現フレームの信号区間として構成されている場合であり、かつ、線形予測分析装置2よりも後にピッチゲイン計算部950が動作される場合、の例である。ピッチゲイン計算部950は、現フレームの信号区間である現フレームの入力信号XO(n) (n=0, 1, …, N-1)のピッチゲインGを求め、ピッチゲインGをピッチゲイン計算部950に記憶する。ピッチゲイン計算部950は、また、1つ前のフレームの信号区間、すなわち、1つ前のフレームの入力信号XO(n) (n=-N, -N+1, …, -1)について求めてピッチゲイン計算部950に記憶されていたピッチゲインGを特定可能な情報をピッチゲインについての情報として出力する。
自己相関計算部21は、入力されたNサンプルのフレーム毎の時間領域のディジタル音声信号やディジタル音響信号である入力信号XO(n)(n=0,1,…,N-1)から自己相関RO(i) (i=0,1,…,Pmax)を計算する(ステップS1)。Pmaxは、予測係数計算部23が求める線形予測係数に変換可能な係数の最大次数であり、N未満の所定の正の整数である。計算された自己相関RO(i) (i=0,1,…,Pmax)は、係数乗算部22に提供される。


係数決定部24は、入力された基本周波数についての情報及び入力されたピッチゲインについての情報を用いて、係数wO(i) (i=0,1,…,Pmax)を決定する(ステップS4)。係数wO(i)は、自己相関RO(i)を変形するための係数である。係数wO(i)は、信号処理の分野においては、ラグ窓wO(i)又はラグ窓係数wO(i)とも呼ばれているものである。係数wO(i)は正の値であるので、係数wO(i)が所定の値よりも大きい/小さいことを、係数wO(i)の大きさが所定の値よりも大きい/小さいと表現することがある。また、wO(i)の大きさとは、そのwO(i)の値を意味するものとする。



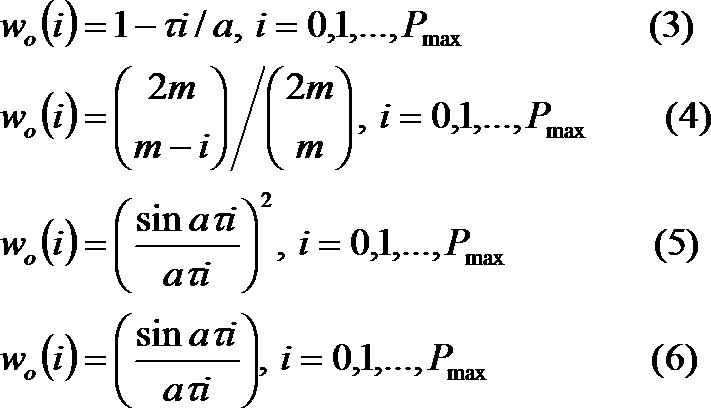
係数乗算部22は、係数決定部24で決定した係数wO(i) (i=0,1,…,Pmax)と、自己相関計算部21で求めた自己相関RO(i) (i=0,1,…,Pmax)とを同じiごとに乗じることにより、変形自己相関R'O(i) (i=0,1,…,Pmax)を求める(ステップS2)。すなわち、係数乗算部22は、以下の式(7)により自己相関R'O(i)を計算する。計算された自己相関R'O(i)は、予測係数計算部23に提供される。

予測係数計算部23は、係数乗算部22から出力された変形自己相関R'O(i)を用いて線形予測係数に変換可能な係数を求める(ステップS3)。
第一実施形態の変形例は、係数決定部24が、基本周波数及びピッチゲインと正の相関関係にある値ではなく、基本周波数と負の相関関係にある値、及び、ピッチゲインと正の相関関係にある値に基づいて係数wO(i)を決定するものである。
周期計算部940は、現フレームの入力信号XOおよび/または現フレームの近傍のフレームの入力信号の全部または一部から周期Tを求める。周期計算部940は、例えば、現フレームの入力信号XO(n)の全部または一部を含む信号区間のディジタル音声信号やディジタル音響信号の周期Tを求め、周期Tを特定可能な情報を周期についての情報として出力する。周期を求める方法としては、様々な公知の方法が存在するので、公知の何れの方法を用いてもよい。また、求めた周期Tを符号化して周期符号を得る構成とし、周期符号を周期についての情報として出力してもよい。さらに周期符号に対応する周期の量子化値^Tを得る構成とし、周期の量子化値^Tを周期についての情報として出力してもよい。以下、周期計算部940の具体例について説明する。
周期計算部940の具体例1は、現フレームの入力信号XO(n) (n=0, 1, …, N-1)が複数個のサブフレームで構成されている場合、かつ、同一のフレームについては線形予測分析装置2よりも先に周期計算部940が動作される場合、の例である。周期計算部940は、まず、2以上の整数であるM個のサブフレームであるXOs1(n) (n=0, 1, …, N/M-1), …, XOsM(n)(n= (M-1)N/M, (M-1)N/M+1, …, N-1)のそれぞれの周期であるTs1, …, TsMを求める。NはMで割り切れるとする。周期計算部940は、現フレームを構成するM個のサブフレームの周期であるTs1, …, TsMのうちの最小値min(Ts1, …, TsM)を特定可能な情報を周期についての情報として出力する。
周期計算部940の具体例2は、現フレームの入力信号XO(n) (n=0, 1, …, N-1)と1つ後のフレームの一部の入力信号XO(n) (n=N, N+1, …, N+Nn-1)(ただし、Nnは、Nn<Nという関係を満たす所定の正の整数。)とで、先読み部分を含む信号区間が現フレームの信号区間として構成されている場合であり、かつ、同一のフレームについては線形予測分析装置2よりも後に周期計算部940が動作される場合、の例である。周期計算部940は、現フレームの信号区間について、現フレームの入力信号XO(n) (n=0, 1, …, N-1)と1つ後のフレームの一部の入力信号XO(n) (n=N, N+1, …, N+Nn-1)のそれぞれの周期であるTnow, Tnextを求め、周期Tnextを周期計算部940に記憶する。周期計算部940は、また、1つ前のフレームの信号区間について求めて周期計算部940に記憶されていた周期Tnext、すなわち、1つ前のフレームの信号区間のうちの現フレームの一部の入力信号XO(n) (n=0, 1, …, Nn-1)について求めた周期、を特定可能な情報を周期についての情報として出力する。なお、具体例1と同様に、現フレームについては複数のサブフレームごとの周期を求めてもよい。
周期計算部940の具体例3は、現フレームの入力信号XO(n) (n=0, 1, …, N-1)そのものが現フレームの信号区間として構成されている場合であり、かつ、同一のフレームについては線形予測分析装置2よりも後に周期計算部940が動作される場合、の例である。周期計算部940は、現フレームの信号区間である現フレームの入力信号XO(n) (n=0, 1, …, N-1)の周期Tを求め、周期Tを周期計算部940に記憶する。周期計算部940は、また、1つ前のフレームの信号区間、すなわち、1つ前のフレームの入力信号XO(n) (n=-N, -N+1, …, -1)について求めて周期計算部940に記憶されていた周期Tを特定可能な情報を周期についての情報として出力する。
第一実施形態の変形例の線形予測分析装置2の係数決定部24は、入力された周期についての情報及び入力されたピッチゲインについての情報を用いて、係数wO(i) (i=0,1,…,Pmax)を決定する(ステップS4)。
ここで、ζ及びεは、重み係数であり、正の数とする。つまり、Tが大きいほどH´の値は小さく、F(G)が大きいほどH´の値は大きくなる。

第二実施形態は、現在又は過去のフレームにおける入力信号の基本周波数と正又は負の相関関係にある値と所定の閾値とを比較し、かつ、ピッチゲインと正の相関関係にある値と所定の閾値とを比較し、それらの比較結果に応じて係数wO(i)を決定するものである。第二実施形態は、係数決定部24における係数wO(i)の決定方法のみが第一実施形態と異なり、他の点については第一実施形態と同様である。以下、第一実施形態と異なる部分を中心に説明し、第一実施形態と同様の部分については重複説明を省略する。
第二実施形態の第一変形例は、基本周波数と正の相関関係にある値ではなく、基本周波数と負の相関関係にある値と所定の閾値とを比較し、かつ、ピッチゲインと正の相関関係にある値と所定の閾値とを比較し、それらの比較結果に応じて係数wO(i)を決定するものである。第二実施形態の第一変形例において基本周波数と負の相関関係にある値と比較される所定の閾値は、第二実施形態において基本周波数と正の相関関係にある値と比較される所定の閾値とは異なる。
上述の第二実施形態では、基本周波数と正の相関関係にある値を1個の閾値と比較し、また、ピッチゲインと正の相関関係にある値を1個の閾値と比較することにより係数wO(i)を決定したが、第二実施形態の第二変形例は、これらの値のそれぞれを2個以上の閾値と比較することにより係数wO(i)を決定するものである。以下、基本周波数と正の相関関係にある値を2個の閾値fth1',fth2'と比較し、ピッチゲインと正の相関関係にある値を2個の閾値gth1,gth2と比較することにより係数wO(i)を決定する方法を例に挙げて説明する。
上述の第二実施形態の第一変形例では、基本周波数と負の相関関係にある値を1個の閾値と比較し、また、ピッチゲインと正の相関関係にある値を1個の閾値と比較することにより係数wO(i)を決定したが、第二実施形態の第三変形例はこれらの値のそれぞれを2個以上の閾値を用いて係数wO(i)を決定するものである。以下、これらの値のそれぞれを2個の閾値fth1,fth2,gth1,gth2を用いて係数を決定する方法を例に挙げて説明する。
第三実施形態は、複数個の係数テーブルを用いて係数wO(i)を決定するものである。第三実施形態は、係数決定部24における係数wO(i)の決定方法のみが第一実施形態と異なり、他の点については第一実施形態と同様である。以下、第一実施形態と異なる部分を中心に説明し、第一実施形態と同様の部分については重複説明を省略する。
第三実施形態の第一変形例は、係数決定部24は、入力された基本周波数と負の相関関係にある値及びピッチゲインと正の相関関係にある値を用いて、係数テーブル記憶部25に記憶された2個以上の係数テーブルから、その入力された基本周波数と負の相関関係にある値及びピッチゲインと正の相関関係にある値に応じた1個の係数テーブルtを選択するものである。
第三実施形態では、基本周波数と正の相関関係にある値を1個の閾値と比較し、また、ピッチゲインと正の相関関係にある値を1個の閾値と比較することにより係数テーブルを決定したが、第三実施形態の第二変形例はこれらの値のそれぞれを2個以上の閾値と比較し、これらの比較結果に応じて係数wO(i)を決定するものである。
(1) 基本周波数と正の相関関係にある値が閾値fth2'より大きく、かつ、ピッチゲインと正の相関関係にある値が閾値gth2より大きい場合、すなわち、基本周波数が高くピッチゲインが大きいと判断された場合には、係数テーブルt0の各係数wt0(i)が係数wO(i)として選択され、
(2) 基本周波数と正の相関関係にある値が閾値fth2'より大きく、かつ、ピッチゲインと正の相関関係にある値が閾値gth1よりも大きく閾値gth2以下である場合、すなわち、基本周波数が高くピッチゲインが中程度と判断された場合には、係数テーブルt0,t1,t2の何れかの係数テーブルの各係数が係数wO(i)として選択され、
(3) 基本周波数と正の相関関係にある値が閾値fth2'より大きく、かつ、ピッチゲインと正の相関関係にある値が閾値gth1以下の場合、すなわち、基本周波数が高くピッチゲインが小さいと判断された場合には、係数テーブルt0,t1,t2の何れかの係数テーブルの各係数が係数wO(i)として選択され、
(4) 基本周波数と正の相関関係にある値が閾値fth1'よりも大きく閾値fth2'以下であり、かつ、ピッチゲインと正の相関関係にある値が閾値gth2より大きい場合、すなわち、基本周波数が中程度でありピッチゲインが大きいと判断された場合には、係数テーブルt0,t1,t2の何れかの係数テーブルの各係数が係数wO(i)として選択され、
(5) 基本周波数と正の相関関係にある値が閾値fth1'よりも大きく閾値fth2'以下であり、かつ、ピッチゲインと正の相関関係にある値が閾値gth1よりも大きく閾値gth2以下である場合、すなわち、基本周波数が中程度でありピッチゲインが中程度と判断された場合には、係数テーブルt0,t1,t2の何れかの係数テーブルの各係数が係数wO(i)として選択され、
(6) 基本周波数と正の相関関係にある値が閾値fth1'よりも大きく閾値fth2'以下であり、かつ、かつ、ピッチゲインと正の相関関係にある値が閾値gth1以下の場合、すなわち、基本周波数が中程度でありピッチゲインが小さいと判断された場合には、係数テーブルt0,t1,t2の何れかの係数テーブルの各係数が係数wO(i)として選択され、
(7) 基本周波数と正の相関関係にある値が閾値fth1'以下であり、かつ、ピッチゲインと正の相関関係にある値が閾値gth2より大きい場合、すなわち、基本周波数が低くピッチゲインが大きいと判断された場合には、係数テーブルt0,t1,t2の何れかの係数テーブルの各係数が係数wO(i)として選択され、
(8) 基本周波数と正の相関関係にある値が閾値fth1'以下であり、かつ、ピッチゲインと正の相関関係にある値が閾値gth1よりも大きく閾値gth2以下である場合、すなわち、基本周波数が低くピッチゲインが中程度と判断された場合には、係数テーブルt0,t1,t2の何れかの係数テーブルの各係数が係数wO(i)として選択され、
(9) 基本周波数と正の相関関係にある値が閾値fth1'以下であり、かつ、ピッチゲインと正の相関関係にある値が閾値gth1以下の場合、すなわち、基本周波数が低くピッチゲインが小さいと判断された場合には、係数テーブルt2の各係数wt2(i)が係数wO(i)として選択されるように、係数テーブル記憶部25に記憶された係数テーブルから係数wO(i)を選択する。
以下、第三実施形態の第二変形例の具体例について説明する。

係数テーブルt1には、式(13)の従来法のf0=40Hzのテーブルであり、各次数の係数wt1(i)が次のように定められている。
係数テーブルt2には、式(13)の従来法のf0=20Hzのテーブルであり、各次数の係数wt2(i)が次のように定められている。
ここで、上述のwtO(i), wt1(i), wt2(i)のリストは、Pmax=16として、i=0,1,2,…,16の順に左からiに対応する係数の大きさを並べたものである。すなわち上述の例では、例えばwt0(0)=1.001であり、wt0(3)=0.996104103である。
第三実施形態の第一変形例では、基本周波数と負の相関関係にある値を1個の閾値と比較し、また、ピッチゲインと正の相関関係にある値を1個の閾値と比較することにより係数テーブルを決定したが、第三実施形態の第三変形例はこれらの値のそれぞれを2個以上の閾値と比較し、これらの比較結果に応じて係数wO(i)を決定するものである。
(1) 基本周波数と負の相関関係にある値が閾値fth1より小さく、かつ、ピッチゲインと正の相関関係にある値が閾値gth2より大きい場合、すなわち、周期が短くピッチゲインが大きい場合には、係数テーブルt0の各係数wt0(i)が係数wO(i)として選択され、
(2) 基本周波数と負の相関関係にある値が閾値fth1より小さく、かつ、ピッチゲインと正の相関関係にある値が閾値gth1よりも大きく閾値gth2以下である場合、すなわち、周期が短くピッチゲインが中程度である場合には、係数テーブルt0,t1,t2の何れかの係数テーブルの各係数が係数wO(i)として選択され、
(3) 基本周波数と負の相関関係にある値が閾値fth1より小さく、かつ、ピッチゲインと正の相関関係にある値が閾値gth1以下の場合、すなわち、周期が短くピッチゲインが小さい場合には、係数テーブルt0,t1,t2の何れかの係数テーブルの各係数が係数wO(i)として選択され、
(4) 基本周波数と負の相関関係にある値が閾値fth1以上であり閾値fth2より小さく、かつ、ピッチゲインと正の相関関係にある値が閾値gth2より大きい場合、すなわち、周期が中程度でありピッチゲインが大きい場合には、係数テーブルt0,t1,t2の何れかの係数テーブルの各係数が係数wO(i)として選択され、
(5) 基本周波数と負の相関関係にある値が閾値fth1以上であり閾値fth2より小さく、かつ、ピッチゲインと正の相関関係にある値が閾値gth1よりも大きく閾値gth2以下である場合、すなわち、周期が中程度でありピッチゲインが中程度である場合には、係数テーブルt0,t1,t2の何れかの係数テーブルの各係数が係数wO(i)として選択され、
(6) 基本周波数と負の相関関係にある値が閾値fth1以上であり閾値fth2より小さく、かつ、ピッチゲインと正の相関関係にある値が閾値gth1以下の場合、すなわち、周期が中程度でありピッチゲインが小さい場合には、係数テーブルt0,t1,t2の何れかの係数テーブルの各係数が係数wO(i)として選択され、
(7) 基本周波数と負の相関関係にある値が閾値fth2以上であり、かつ、ピッチゲインと正の相関関係にある値が閾値gth2より大きい場合、すなわち、周期が長くピッチゲインが大きい場合には、係数テーブルt0,t1,t2の何れかの係数テーブルの各係数が係数wO(i)として選択され、
(8) 基本周波数と負の相関関係にある値が閾値fth2以上であり、かつ、ピッチゲインと正の相関関係にある値が閾値gth1よりも大きく閾値gth2以下である場合、すなわち、周期が長くピッチゲインが中程度である場合には、係数テーブルt0,t1,t2の何れかの係数テーブルの各係数が係数wO(i)として選択され、
(9) 基本周波数と負の相関関係にある値が閾値fth2以上であり、かつ、ピッチゲインと正の相関関係にある値が閾値gth1以下の場合、すなわち、周期が長くピッチゲインが小さい場合には、係数テーブルt2の各係数wt2(i)が係数wO(i)として選択されるように、係数テーブル記憶部25に記憶された係数テーブルから係数wO(i)を選択する。
以下、第三実施形態の第三変形例の具体例について説明する。ここでは、第三実施形
態の第二変形例の具体例と異なる部分を中心に説明する。
第三実施形態では複数個の係数テーブルのうち何れか1つのテーブルに記憶された係数を係数wO(i)として決定したが、第三実施形態の第四変形例はこれに加えて複数個の係数テーブルに記憶された係数に基づく演算処理により係数wO(i)を決定する場合を含む。
(1) 基本周波数と正の相関関係にある値が閾値fth2'より大きく、かつ、ピッチゲインと正の相関関係にある値が閾値gth2より大きい場合、すなわち、基本周波数が高くピッチゲインが大きいと判断された場合には、係数テーブルt0の各係数wt0(i)が係数wO(i)として選択され、
(2) 基本周波数と正の相関関係にある値が閾値fth2'より大きく、かつ、ピッチゲインと正の相関関係にある値が閾値gth1よりも大きく閾値gth2以下である場合、すなわち、基本周波数が高くピッチゲインが中程度と判断された場合には、係数テーブルt0,t2の何れかの係数テーブルの各係数が係数wO(i)として選択されるか、係数テーブルt0とt2の各係数から求まる係数が係数wO(i)とされ、
(3) 基本周波数と正の相関関係にある値が閾値fth2'より大きく、かつ、ピッチゲインと正の相関関係にある値が閾値gth1以下の場合、すなわち、基本周波数が高くピッチゲインが小さいと判断された場合には、係数テーブルt0,t2の何れかの係数テーブルの各係数が係数wO(i)として選択されるか、係数テーブルt0とt2の各係数から求まる係数が係数wO(i)とされ、
(4) 基本周波数と正の相関関係にある値が閾値fth1'よりも大きく閾値fth2'以下であり、かつ、ピッチゲインと正の相関関係にある値が閾値gth2より大きい場合、すなわち、基本周波数が中程度でありピッチゲインが大きいと判断された場合には、係数テーブルt0,t2の何れかの係数テーブルの各係数が係数wO(i)として選択されるか、係数テーブルt0とt2の各係数から求まる係数が係数wO(i)とされ、
(5) 基本周波数と正の相関関係にある値が閾値fth1'よりも大きく閾値fth2'以下であり、かつ、ピッチゲインと正の相関関係にある値が閾値gth1よりも大きく閾値gth2以下である場合、すなわち、基本周波数が中程度でありピッチゲインが中程度と判断された場合には、係数テーブルt0,t2の何れかの係数テーブルの各係数が係数wO(i)として選択されるか、係数テーブルt0とt2の各係数から求まる係数が係数wO(i)とされ、
(6) 基本周波数と正の相関関係にある値が閾値fth1'よりも大きく閾値fth2'以下であり、かつ、ピッチゲインと正の相関関係にある値が閾値gth1以下の場合、すなわち、基本周波数が中程度でありピッチゲインが小さいと判断された場合には、係数テーブルt0,t2の何れかの係数テーブルの各係数が係数wO(i)として選択されるか、係数テーブルt0とt2の各係数から求まる係数が係数wO(i)とされ、
(7) 基本周波数と正の相関関係にある値が閾値fth1'以下であり、かつ、ピッチゲインと正の相関関係にある値が閾値gth2より大きい場合、すなわち、基本周波数が低くピッチゲインが大きいと判断された場合には、係数テーブルt0,t2の何れかの係数テーブルの各係数が係数wO(i)として選択されるか、係数テーブルt0とt2の各係数から求まる係数が係数wO(i)とされ、
(8) 基本周波数と正の相関関係にある値が閾値fth1'以下であり、かつ、ピッチゲインと正の相関関係にある値が閾値gth1よりも大きく閾値gth2以下である場合、すなわち、基本周波数が低くピッチゲインが中程度と判断された場合には、係数テーブルt0,t2の何れかの係数テーブルの各係数が係数wO(i)として選択されるか、係数テーブルt0とt2の各係数から求まる係数が係数wO(i)とされ、
(9) 基本周波数と正の相関関係にある値が閾値fth1'以下であり、かつ、ピッチゲインと正の相関関係にある値が閾値gth1以下の場合、すなわち、基本周波数が低くピッチゲインが小さいと判断された場合には、係数テーブルt2の各係数wt2(i)が係数wO(i)として選択されるように、係数テーブル記憶部25に記憶された係数テーブルから係数wO(i)を選択し、または、求める。
第三実施形態では複数個の係数テーブルのうち何れか1つのテーブルに記憶された係数を係数wO(i)として決定したが、第三実施形態の第五変形例はこれに加えて複数個の係数テーブルに記憶された係数に基づく演算処理により係数wO(i)を決定する場合を含む。
(1) 基本周波数と負の相関関係にある値が閾値fth1より小さく、かつ、ピッチゲインと正の相関関係にある値が閾値gth2より大きい場合、すなわち、周期が短くピッチゲインが大きい場合には、係数テーブルt0の各係数wt0(i)が係数wO(i)として選択され、
(2) 基本周波数と負の相関関係にある値が閾値fth1より小さく、かつ、ピッチゲインと正の相関関係にある値が閾値gth1よりも大きく閾値gth2以下である場合、すなわち、周期が短くピッチゲインが中程度である場合には、係数テーブルt0, t2の何れかの係数テーブルの各係数が係数wO(i)として選択されるか、係数テーブルt0とt2の各係数から求まる係数が係数wO(i)とされ、
(3) 基本周波数と負の相関関係にある値が閾値fth1より小さく、かつ、ピッチゲインと正の相関関係にある値が閾値gth1以下の場合、すなわち、周期が短くピッチゲインが小さい場合には、係数テーブルt0, t2の何れかの係数テーブルの各係数が係数wO(i)として選択されるか、係数テーブルt0とt2の各係数から求まる係数が係数wO(i)とされ、
(4) 基本周波数と負の相関関係にある値が閾値fth1以上であり閾値fth2より小さく、かつ、ピッチゲインと正の相関関係にある値が閾値gth2より大きい場合、すなわち、周期が中程度でありピッチゲインが大きい場合には、係数テーブルt0, t2の何れかの係数テーブルの各係数が係数wO(i)として選択されるか、係数テーブルt0とt2の各係数から求まる係数が係数wO(i)とされ、
(5) 基本周波数と負の相関関係にある値が閾値fth1以上であり閾値fth2より小さく、かつ、ピッチゲインと正の相関関係にある値が閾値gth1よりも大きく閾値gth2以下である場合、すなわち、周期が中程度でありピッチゲインが中程度である場合には、係数テーブルt0, t2の何れかの係数テーブルの各係数が係数wO(i)として選択されるか、係数テーブルt0とt2の各係数から求まる係数が係数wO(i)とされ、
(6) 基本周波数と負の相関関係にある値が閾値fth1以上であり閾値fth2より小さく、かつ、ピッチゲインと正の相関関係にある値が閾値gth1以下の場合、すなわち、周期が中程度でありピッチゲインが小さい場合には、係数テーブルt0, t2の何れかの係数テーブルの各係数が係数wO(i)として選択されるか、係数テーブルt0とt2の各係数から求まる係数が係数wO(i)とされ、
(7) 基本周波数と負の相関関係にある値が閾値fth2以上であり、かつ、ピッチゲインと正の相関関係にある値が閾値gth2より大きい場合、すなわち、周期が長くピッチゲインが大きい場合には、係数テーブルt0, t2の何れかの係数テーブルの各係数が係数wO(i)として選択されるか、係数テーブルt0とt2の各係数から求まる係数が係数wO(i)とされ、
(8) 基本周波数と負の相関関係にある値が閾値fth2以上であり、かつ、ピッチゲインと正の相関関係にある値が閾値gth1よりも大きく閾値gth2以下である場合、すなわち、周期が長くピッチゲインが中程度である場合には、係数テーブルt0, t2の何れかの係数テーブルの各係数が係数wO(i)として選択されるか、係数テーブルt0とt2の各係数から求まる係数が係数wO(i)とされ、
(9) 基本周波数と負の相関関係にある値が閾値fth2以上であり、かつ、ピッチゲインと正の相関関係にある値が閾値gth1以下の場合、すなわち、周期が長くピッチゲインが小さい場合には、係数テーブルt2の各係数wt2(i)が係数wO(i)として選択されるように、係数テーブル記憶部25に記憶された係数テーブルから係数wO(i)を選択し、または、求める。
また、(2),(3),(4),(5),(6),(7),(8)の少なくとも1つの場合には係数決定部24により係数テーブルt0とt2から取得した各係数から係数が求められる。
図11及び図12に示すように、上述の全ての実施形態及び変形例において、係数乗算部22を含まず、予測係数計算部23において係数wO(i)と自己相関RO(i)とを用いて線形予測分析を行ってもよい。図11と図12は、それぞれ図1と図7に対応する線形予測分析装置2の構成例である。この場合は、予測係数計算部23は、図13に示すように、係数wO(i)と自己相関RO(i)とが乗算されたものである変形自己相関R'O(i)ではなく、係数wO(i)と自己相関RO(i)とを直接用いて線形予測分析を行う(ステップS5)。
第四実施形態は、入力信号XO(n)に対して従来の線形予測分析装置を用いて線形予測分析を行い、その線形予測分析の結果を用いて基本周波数計算部及びピッチゲイン計算部でそれぞれ基本周波数及びピッチゲインを得て、得られた基本周波数及びピッチゲインに基づく係数wO(i)を用いて本発明の線形予測分析装置により線形予測係数に変換可能な係数を求めるものである。
第一線形予測分析部31は、従来の線形予測分析装置1と同じ動作をする。すなわち、第一線形予測分析部31は、入力信号XO(n)から自己相関RO(i) (i=0,1,…,Pmax)を求め、自己相関RO(i) (i=0,1,…,Pmax)と予め定めた係数wO(i) (i=0,1,…,Pmax)とを同じiごとに乗じることにより変形自己相関R' O(i) (i=0,1,…,Pmax)を求め、変形自己相関R' O(i) (i=0,1,…,Pmax)から1次から予め定めた最大次数であるPmax次までの線形予測係数に変換可能な係数を求める。
線形予測残差計算部32は、入力信号XO(n)に対して、1次からPmax次までの線形予測係数に変換可能な係数に基づく線形予測や線形予測と等価なまたは類似したフィルタリング処理を行って線形予測残差信号XR(n)を求める。フィルタリング処理は重み付け処理とも言えるので、線形予測残差信号XR(n)は重み付け入力信号であるともいえる。
基本周波数計算部33は、線形予測残差信号XR(n)の基本周波数Pを求め、基本周波数についての情報を出力する。基本周波数を求める方法としては、様々な公知の方法が存在するので、公知の何れの方法を用いてもよい。基本周波数計算部33は、例えば、現フレームの線形予測残差信号XR (n) (n=0, 1, …, N-1)を構成する複数個のサブフレームのそれぞれについて基本周波数を求める。すなわち、2以上の整数であるM個のサブフレームであるXRs1(n) (n=0, 1, …, N/M-1), …, XRsM(n) (n= (M-1)N/M, (M-1)N/M+1, …, N-1)のそれぞれの基本周波数であるPs1, …, PsMを求める。NはMで割り切れるとする。基本周波数計算部33は、次に、現フレームを構成するM個のサブフレームの基本周波数であるPs1, …, PsMのうちの最大値max(Ps1, …, PsM)を特定可能な情報を基本周波数についての情報として出力する。
ピッチゲイン計算部36は、線形予測残差信号XR(n)のピッチゲインGを求め、ピッチゲインについての情報を出力する。ピッチゲインを求める方法としては、様々な公知の方法が存在するので、公知の何れの方法を用いてもよい。ピッチゲイン計算部36は、例えば、現フレームの線形予測残差信号XR (n) (n=0, 1, …, N-1)を構成する複数個のサブフレームのそれぞれについてピッチゲインを求める。すなわち、2以上の整数であるM個のサブフレームであるXRs1(n) (n=0, 1, …, N/M-1), …, XRsM(n) (n= (M-1)N/M, (M-1)N/M+1, …, N-1)のそれぞれのピッチゲインであるGs1, …, GsMを求める。NはMで割り切れるとする。ピッチゲイン計算部36は、次に、現フレームを構成するM個のサブフレームのピッチゲインであるGs1, …, GsMのうちの最大値max(Gs1, …, GPsM)を特定可能な情報をピッチゲインについての情報として出力する。
第二線形予測分析部34は、本発明の第一実施形態の線形予測分析装置2、第二実施形態の線形予測分析装置2、第二実施形態の第二変形例の線形予測分析装置2、第三実施形態の線形予測分析装置2、第三実施形態の第二変形例の線形予測分析装置2、第三実施形態の第四変形例の線形予測分析装置2、第一実施形態から第三実施形態に共通の変形例の線形予測分析装置2、の何れかと同じ動作をする。すなわち、第二線形予測分析部34は、入力信号XO(n)から自己相関RO(i) (i=0,1,…,Pmax)を求め、基本周波数計算部33が出力した基本周波数についての情報及びピッチゲイン計算部36が出力したピッチゲインについての情報に基づいて係数wO(i) (i=0,1,…,Pmax)を決定し、自己相関RO(i) (i=0,1,…,Pmax)と決定した係数wO(i) (i=0,1,…,Pmax)とを用いて1次から予め定めた最大次数であるPmax次までの線形予測係数に変換可能な係数を求める。
第四実施形態の変形例は、入力信号XO(n)に対して従来の線形予測分析装置を用いて線形予測分析を行い、その線形予測分析の結果を用いて周期計算部及びピッチゲイン計算部でそれぞれ周期及びピッチゲインを得て、得られた周期及びピッチゲインに基づく係数wO(i)を用いて本発明の線形予測分析装置により線形予測係数に変換可能な係数を求めるものである。
周期計算部35は、線形予測残差信号XR(n)の周期Tを求め、周期についての情報を出力する。周期を求める方法としては、様々な公知の方法が存在するので、公知の何れの方法を用いてもよい。周期計算部35は、例えば、現フレームの線形予測残差信号XR (n) (n=0, 1, …, N-1)を構成する複数個のサブフレームのそれぞれについて周期を求める。すなわち、2以上の整数であるM個のサブフレームであるXRs1(n) (n=0, 1, …, N/M-1), …, XRsM(n)(n= (M-1)N/M, (M-1)N/M+1, …, N-1)のそれぞれの周期であるTs1, …, TsMを求める。NはMで割り切れるとする。周期計算部35は、次に、現フレームを構成するM個のサブフレームの周期であるTs1, …, TsMのうちの最小値min(Ts1 …, TsM)を特定可能な情報を周期についての情報として出力する。
第四実施形態の変形例の第二線形予測分析部34は、本発明の第一実施形態の変形例の線形予測分析装置2、第二実施形態の第一変形例の線形予測分析装置2、第二実施形態の第三変形例の線形予測分析装置2、第三実施形態の第一変形例の線形予測分析装置2、第三実施形態の第三変形例の線形予測分析装置2、第三実施形態の第五変形例の線形予測分析装置2、第一実施形態から第三実施形態に共通の変形例の線形予測分析装置2、の何れかと同じ動作をする。すなわち、第二線形予測分析部34は、入力信号XO(n)から自己相関RO(i) (i=0,1,…,Pmax)を求め、周期計算部35が出力した周期についての情報及びピッチゲイン計算部36が出力したピッチゲインについての情報に基づいて係数wO(i) (i=0,1,…,Pmax)を決定し、自己相関RO(i) (i=0,1,…,Pmax)と決定した係数wO(i) (i=0,1,…,Pmax)とを用いて1次から予め定めた最大次数であるPmax次までの線形予測係数に変換可能な係数を求める。
第一実施形態において基本周波数計算部930の具体例2として説明した通り、基本周波数と正の相関関係にある値として、前のフレームの信号処理においてLook-aheadとも呼ばれる先読みして利用するサンプル部分のうち現フレームのサンプルに対応する部分の基本周波数を用いてもよい。
第一実施形態において周期計算部940の具体例2として説明した通り、基本周波数と負の相関関係にある値として、前のフレームの信号処理においてLook-aheadとも呼ばれる先読みして利用するサンプル部分のうち現フレームのサンプルに対応する部分の周期Tを用いてもよい。
第一実施形態においてピッチゲイン計算部950の具体例2として説明した通り、ピッチゲインと正の相関関係にある値として、前のフレームの信号処理においてLook-aheadとも呼ばれる先読みして利用するサンプル部分のうち現フレームのサンプルに対応する部分のピッチゲインを用いてもよい。
Claims (18)
- 入力時系列信号に対応する線形予測係数に変換可能な係数を、所定時間区間であるフレームごとに求める、線形予測分析方法であって、
少なくともi=0,1,…,Pmaxのそれぞれについて、現在のフレームの入力時系列信号XO(n)とiサンプルだけ過去の入力時系列信号XO(n-i)またはiサンプルだけ未来の入力時系列信号XO(n+i)との自己相関RO(i) (i=0, 1, …, Pmax)を計算する自己相関計算ステップと、
係数wO(i) (i=0, 1, …, Pmax)と前記自己相関RO(i) (i=0, 1, …, Pmax)とが対応するiごとに乗算されたものである変形自己相関R' (i)を用いて1次からPmax次までの線形予測係数に変換可能な係数を求める予測係数計算ステップと、を含み、
少なくとも一部の各次数iに対して、前記各次数iに対応する係数wO(i)が、現在又は過去のフレームにおける入力時系列信号に基づく周期、周期の量子化値又は基本周波数と負の相関関係にある値の増加とともに単調増加する場合と、現在又は過去のフレームにおける入力時系列信号の周期性の強さ又はピッチゲインと正の相関関係にある値の増加とともに単調減少する関係にある場合とが含まれている、
線形予測分析方法。 - 入力時系列信号に対応する線形予測係数に変換可能な係数を、所定時間区間であるフレームごとに求める、線形予測分析方法であって、
少なくともi=0,1,…,Pmaxのそれぞれについて、現在のフレームの入力時系列信号XO(n)とiサンプルだけ過去の入力時系列信号XO(n-i)またはiサンプルだけ未来の入力時系列信号XO(n+i)との自己相関RO(i) (i=0, 1, …, Pmax)を計算する自己相関計算ステップと、
2個以上の係数テーブルのそれぞれにはi=0, 1, …, Pmaxの各次数iと前記各次数iに対応する係数wO(i)とが対応付けて記憶されているとして、現在又は過去のフレームにおける入力時系列信号に基づく周期、周期の量子化値又は基本周波数と負の相関関係にある値と、現在又は過去のフレームにおける入力時系列信号の周期性の強さ又はピッチゲインと正の相関関係にある値とを用いて前記2個以上の係数テーブルの中の1個の係数テーブルから係数wO(i) (i=0, 1, …, Pmax)を取得する係数決定ステップと、
取得された前記各次数iに対応する係数wO(i) (i=0, 1, …, Pmax)と前記自己相関RO(i) (i=0, 1, …, Pmax)とが対応するiごとに乗算されたものである変形自己相関R'O(i) (i=0, 1, …, Pmax)を用いて、1次からPmax次までの線形予測係数に変換可能な係数を求める予測係数計算ステップと、を含み、
前記2個以上の係数テーブルの中の、前記周期、周期の量子化値又は基本周波数と負の相関関係にある値が第一値であり、かつ、前記周期性の強さ又はピッチゲインと正の相関関係にある値が第三値である場合に前記係数決定ステップで係数wO(i) (i=0, 1, …, Pmax)が取得される係数テーブルを第一係数テーブルとし、
前記2個以上の係数テーブルの中の、前記周期、周期の量子化値又は基本周波数と負の相関関係にある値が前記第一値よりも大きい第二値であり、かつ、前記周期性の強さ又はピッチゲインと正の相関関係にある値が前記第三値よりも小さい第四値である場合に前記係数決定ステップで係数wO(i) (i=0, 1, …, Pmax)が取得される係数テーブルを第二係数テーブルとして、
少なくとも一部の各次数iに対して、前記第二係数テーブルにおける前記各次数iに対応する係数は、前記第一係数テーブルにおける前記各次数iに対応する係数よりも大きい、
線形予測分析方法。 - 入力時系列信号に対応する線形予測係数に変換可能な係数を、所定時間区間であるフレームごとに求める、線形予測分析方法であって、
少なくともi=0,1,…,Pmaxのそれぞれについて、現在のフレームの入力時系列信号XO(n) とiサンプルだけ過去の入力時系列信号XO(n-i)またはiサンプルだけ未来の入力時系列信号XO(n+i)との自己相関RO(i) (i=0, 1, …, Pmax)を計算する自己相関計算ステップと、
係数テーブルt0には係数wt0(i) (i=0,1,…,Pmax)が格納されており、係数テーブルt1には係数wt1(i) (i=0,1,…,Pmax)、係数テーブルt2には係数wt2(i) (i=0,1,…,Pmax)が格納されているとして、現在又は過去のフレームにおける入力時系列信号に基づく周期、周期の量子化値又は基本周波数と負の相関関係にある値及びピッチゲインと正の相関関係にある値を用いて前記係数テーブルt0,t1,t2の中の1個の係数テーブルから係数を取得する係数決定ステップと、
前記取得した係数と前記自己相関RO(i) (i=0, 1, …, Pmax)とが対応するiごとに乗算されたものである変形自己相関R' O(i) (i=0, 1, …, Pmax)を用いて、1次からPmax次までの線形予測係数に変換可能な係数を求める予測係数計算ステップと、を含み、
少なくとも一部のiについてwt0(i)<wt1(i)≦wt2(i)であり、それ以外のiのうちの少なくとも一部の各iについてwt0(i)≦wt1(i)<wt2(i)であり、残りの各iについてwt0(i)≦wt1(i)≦wt2(i)であり、
前記係数決定ステップは、周期又は周期の量子化値又は基本周波数と負の相関関係にある値が取り得る範囲を構成する3つの範囲の少なくとも2つの範囲について、ピッチゲインと正の相関関係にある値が小さいときに決定される係数がピッチゲインと正の相関関係にある値が大きいときに決定される係数よりも大きい場合が含まれ、かつ、ピッチゲインと正の相関関係にある値が取り得る範囲を構成する3つの範囲の少なくとも2つの範囲について、周期又は周期の量子化値又は基本周波数と負の相関関係にある値が大きいときに決定される係数が周期又は周期の量子化値又は基本周波数と負の相関関係にある値が小さいときに決定される係数よりも大きい場合が含まれるように、係数テーブルを選択して、選択された係数テーブルに格納されている係数を取得する、
線形予測分析方法。 - 入力時系列信号に対応する線形予測係数に変換可能な係数を、所定時間区間であるフレームごとに求める、線形予測分析方法であって、
少なくともi=0,1,…,Pmaxのそれぞれについて、現在のフレームの入力時系列信号XO(n) とiサンプルだけ過去の入力時系列信号XO(n-i)またはiサンプルだけ未来の入力時系列信号XO(n+i)との自己相関RO(i) (i=0, 1, …, Pmax)を計算する自己相関計算ステップと、
係数テーブルt0には係数wt0(i) (i=0,1,…,Pmax)が格納されており、係数テーブルt1には係数wt1(i) (i=0,1,…,Pmax)、係数テーブルt2には係数wt2(i) (i=0,1,…,Pmax)が格納されているとして、現在又は過去のフレームにおける入力時系列信号に基づく周期、周期の量子化値又は基本周波数と負の相関関係にある値及びピッチゲインと正の相関関係にある値を用いて前記係数テーブルt0,t1,t2の中の1個の係数テーブルから係数を取得する係数決定ステップと、
前記取得した係数と前記自己相関RO(i) (i=0, 1, …, Pmax)とが対応するiごとに乗算されたものである変形自己相関R' O(i) (i=0, 1, …, Pmax)を用いて、1次からPmax次までの線形予測係数に変換可能な係数を求める予測係数計算ステップと、を含み、
少なくとも一部のiについてwt0(i)<wt1(i)≦wt2(i)であり、それ以外のiのうちの少なくとも一部の各iについてwt0(i)≦wt1(i)<wt2(i)であり、残りの各iについてwt0(i)≦wt1(i)≦wt2(i)であり、
前記周期、周期の量子化値又は基本周波数と負の相関関係にある値及びピッチゲインと正の相関関係にある値に応じて、(1)周期が短くピッチゲインが大きい場合には前記係数決定ステップで係数テーブルt0から係数が取得されるとし、(9)周期が長くピッチゲインが小さい場合には前記係数決定ステップで係数テーブルt2から係数が取得されるとし、(2)周期が短くピッチゲインが中程度の場合、(3)周期が短くピッチゲインが小さい場合、(4)周期が中程度でありピッチゲインが大きい場合、(5)周期が中程度でありピッチゲインが中程度の場合、(6)周期が中程度でありピッチゲインが小さい場合、(7)周期が長くピッチゲインが大きい場合、(8)周期が長くピッチゲインが中程度の場合、には前記係数決定ステップで係数テーブルt0,t1,t2の何れかの係数テーブルから係数が取得されるとし、
(2),(3),(4),(5),(6),(7),(8)の少なくとも1つの場合には前記係数決定ステップで係数テーブルt1から係数が取得されるとし、
k=1,2,…,9として、(k)の場合に前記係数決定ステップで係数が取得される係数テーブルtjkの番号をjkとして、j1≦j2≦j3であり、j4≦j5≦j6であり、j7≦j8≦j9であり、j1≦j4≦j7であり、j2≦j5≦j8であり、j3≦j6≦j9である、
線形予測分析方法。 - 入力時系列信号に対応する線形予測係数に変換可能な係数を、所定時間区間であるフレームごとに求める、線形予測分析方法であって、
少なくともi=0,1,…,Pmaxのそれぞれについて、現在のフレームの入力時系列信号XO(n) とiサンプルだけ過去の入力時系列信号XO(n-i)またはiサンプルだけ未来の入力時系列信号XO(n+i)との自己相関RO(i) (i=0, 1, …, Pmax)を計算する自己相関計算ステップと、
係数wO(i) (i=0, 1, …, Pmax)と前記自己相関RO(i) (i=0, 1, …, Pmax)とが対応するiごとに乗算されたものである変形自己相関R'O(i)を用いて、1次からPmax次までの線形予測係数に変換可能な係数を求める予測係数計算ステップと、を含み、
少なくとも一部の各次数iに対して、前記各次数iに対応する係数wO(i)が、現在又は過去のフレームにおける入力時系列信号に基づく基本周波数と正の相関関係にある値の増加とともに単調減少する関係にある場合及びピッチゲインと正の相関関係にある値の増加とともに単調減少する関係にある場合が含まれている、
線形予測分析方法。 - 入力時系列信号に対応する線形予測係数に変換可能な係数を、所定時間区間であるフレームごとに求める、線形予測分析方法であって、
少なくともi=0,1,…,Pmaxのそれぞれについて、現在のフレームの入力時系列信号XO(n) とiサンプルだけ過去の入力時系列信号XO(n-i)またはiサンプルだけ未来の入力時系列信号XO(n+i)との自己相関RO(i) (i=0, 1, …, Pmax)を計算する自己相関計算ステップと、
2個以上の係数テーブルのそれぞれにはi=0, 1, …, Pmaxの各次数iと前記各次数iに対応する係数wO(i)とが対応付けて記憶されているとして、現在又は過去のフレームにおける入力時系列信号に基づく基本周波数と正の相関関係にある値と、現在又は過去のフレームにおける入力信号のピッチゲインと正の相関関係にある値とを用いて前記2個以上の係数テーブルの中の1個の係数テーブルから係数wO(i) (i=0, 1, …, Pmax)を取得する係数決定ステップと、
取得された前記各次数iに対応する係数wO(i) (i=0, 1, …, Pmax)と前記自己相関RO(i) (i=0, 1, …, Pmax)とが対応するiごとに乗算されたものである変形自己相関R' O(i) (i=0, 1, …, Pmax)を用いて、1次からPmax次までの線形予測係数に変換可能な係数を求める予測係数計算ステップと、を含み、
前記2個以上の係数テーブルの中の、前記基本周波数と正の相関関係にある値が第一値であり、かつ、前記ピッチゲインと正の相関関係にある値が第三値である場合に前記係数決定ステップで係数wO(i) (i=0, 1, …, Pmax)が取得される係数テーブルを第一係数テーブルとし、
前記2個以上の係数テーブルの中の、前記基本周波数と正の相関関係にある値が前記第一値よりも小さい第二値であり、かつ、前記ピッチゲインと正の相関関係にある値が前記第三値よりも小さい第四値である場合に前記係数決定ステップで係数wO(i) (i=0, 1, …, Pmax)が取得される係数テーブルを第二係数テーブルとして、
少なくとも一部の各次数iに対して、前記第二係数テーブルにおける前記各次数iに対応する係数は、前記第一係数テーブルにおける前記各次数iに対応する係数よりも大きい、
線形予測分析方法。 - 入力時系列信号に対応する線形予測係数に変換可能な係数を、所定時間区間であるフレームごとに求める、線形予測分析方法であって、
少なくともi=0,1,…,Pmaxのそれぞれについて、現在のフレームの入力時系列信号XO(n) とiサンプルだけ過去の入力時系列信号XO(n-i)またはiサンプルだけ未来の入力時系列信号XO(n+i)との自己相関RO(i) (i=0, 1, …, Pmax)を計算する自己相関計算ステップと、
係数テーブルt0には係数wt0(i) (i=0,1,…,Pmax)が格納されており、係数テーブルt1には係数wt1(i) (i=0,1,…,Pmax)、係数テーブルt2には係数wt2(i) (i=0,1,…,Pmax)が格納されているとして、現在又は過去のフレームにおける入力時系列信号に基づく基本周波数と正の相関関係にある値及びピッチゲインと正の相関関係にある値を用いて前記係数テーブルt0,t1,t2の中の1個の係数テーブルから係数を取得する係数決定ステップと、
前記取得した係数と前記自己相関RO(i) (i=0, 1, …, Pmax)とが対応するiごとに乗算されたものである変形自己相関R' O(i) (i=0, 1, …, Pmax)を用いて、1次からPmax次までの線形予測係数に変換可能な係数を求める予測係数計算ステップと、を含み、
少なくとも一部のiについてwt0(i)<wt1(i)≦wt2(i)であり、それ以外のiのうちの少なくとも一部の各iについてwt0(i)≦wt1(i)<wt2(i)であり、残りの各iについてwt0(i)≦wt1(i)≦wt2(i)であり、
前記係数決定ステップは、基本周波数と正の相関関係にある値が取り得る範囲を構成する3つの範囲の少なくとも2つの範囲について、ピッチゲインと正の相関関係にある値が小さいときに決定される係数がピッチゲインと正の相関関係にある値が大きいときに決定される係数よりも大きい場合が含まれ、かつ、ピッチゲインと正の相関関係にある値が取り得る範囲を構成する3つの範囲の少なくとも2つの範囲について、基本周波数と正の相関関係にある値が小さいときに決定される係数が基本周波数と正の相関関係にある値が大きいときに決定される係数よりも大きい場合が含まれるように、係数テーブルを選択して、選択された係数テーブルに格納されている係数を取得する、
線形予測分析方法。 - 入力時系列信号に対応する線形予測係数に変換可能な係数を、所定時間区間であるフレームごとに求める、線形予測分析方法であって、
少なくともi=0,1,…,Pmaxのそれぞれについて、現在のフレームの入力時系列信号XO(n)とiサンプルだけ過去の入力時系列信号XO(n-i)またはiサンプルだけ未来の入力時系列信号XO(n+i)との自己相関RO(i) (i=0, 1, …, Pmax)を計算する自己相関計算ステップと、
係数テーブルt0には係数wt0(i) (i=0,1,…,Pmax)が格納されており、係数テーブルt1には係数wt1(i) (i=0,1,…,Pmax)、係数テーブルt2には係数wt2(i) (i=0,1,…,Pmax)が格納されているとして、現在又は過去のフレームにおける入力時系列信号に基づく基本周波数と正の相関関係にある値及びピッチゲインと正の相関関係にある値を用いて前記係数テーブルt0,t1,t2の中の1個の係数テーブルから係数を取得する係数決定ステップと、
前記取得した係数と前記自己相関RO(i) (i=0, 1, …, Pmax)とが対応するiごとに乗算されたものである変形自己相関R' O(i) (i=0, 1, …, Pmax)を用いて、1次からPmax次までの線形予測係数に変換可能な係数を求める予測係数計算ステップと、を含み、
少なくとも一部のiについてwt0(i)<wt1(i)≦wt2(i)であり、それ以外のiのうちの少なくとも一部の各iについてwt0(i)≦wt1(i)<wt2(i)であり、残りの各iについてwt0(i)≦wt1(i)≦wt2(i)であり、
前記基本周波数と正の相関関係にある値及びピッチゲインと正の相関関係にある値に応じて、(1)基本周波数が高くピッチゲインが大きい場合には前記係数決定ステップで係数テーブルt0から係数が取得されるとし、(9)基本周波数が低くピッチゲインが小さい場合には前記係数決定ステップで係数テーブルt2から係数が取得されるとし、(2)基本周波数が高くピッチゲインが中程度の場合、(3)基本周波数が高くピッチゲインが小さい場合、(4)基本周波数が中程度でありピッチゲインが大きい場合、(5)基本周波数が中程度でありピッチゲインが中程度の場合、(6)基本周波数が中程度でありピッチゲインが小さい場合、(7)基本周波数が低くピッチゲインが大きい場合、(8)基本周波数が低くピッチゲインが中程度の場合、には前記係数決定ステップで係数テーブルt0,t1,t2の何れかの係数テーブルから係数が取得されるとし、
(2),(3),(4),(5),(6),(7),(8)の少なくとも1つの場合には前記係数決定ステップで係数テーブルt1から係数が取得されるとし、
k=1,2,…,9として、(k)の場合に前記係数決定ステップで係数が取得される係数テーブルtjkの番号をjkとして、j1≦j2≦j3であり、j4≦j5≦j6であり、j7≦j8≦j9であり、j1≦j4≦j7であり、j2≦j5≦j8であり、j3≦j6≦j9である、
線形予測分析方法。 - 入力時系列信号に対応する線形予測係数に変換可能な係数を、所定時間区間であるフレームごとに求める、線形予測分析装置であって、
少なくともi=0,1,…,Pmaxのそれぞれについて、現在のフレームの入力時系列信号XO(n)とiサンプルだけ過去の入力時系列信号XO(n-i)またはiサンプルだけ未来の入力時系列信号XO(n+i)との自己相関RO(i) (i=0, 1, …, Pmax)を計算する自己相関計算部と、
係数wO(i) (i=0, 1, …, Pmax)と前記自己相関RO(i) (i=0, 1, …, Pmax)とが対応するiごとに乗算されたものである変形自己相関R' (i)を用いて1次からPmax次までの線形予測係数に変換可能な係数を求める予測係数計算部と、を含み、
少なくとも一部の各次数iに対して、前記各次数iに対応する係数wO(i)が、現在又は過去のフレームにおける入力時系列信号に基づく周期、周期の量子化値又は基本周波数と負の相関関係にある値の増加とともに単調増加する場合と、現在又は過去のフレームにおける入力時系列信号の周期性の強さ又はピッチゲインと正の相関関係にある値の増加とともに単調減少する関係にある場合とが含まれている、
線形予測分析装置。 - 入力時系列信号に対応する線形予測係数に変換可能な係数を、所定時間区間であるフレームごとに求める、線形予測分析装置であって、
少なくともi=0,1,…,Pmaxのそれぞれについて、現在のフレームの入力時系列信号XO(n)とiサンプルだけ過去の入力時系列信号XO(n-i)またはiサンプルだけ未来の入力時系列信号XO(n+i)との自己相関RO(i) (i=0, 1, …, Pmax)を計算する自己相関計算部と、
2個以上の係数テーブルのそれぞれにはi=0, 1, …, Pmaxの各次数iと前記各次数iに対応する係数wO(i)とが対応付けて記憶されているとして、現在又は過去のフレームにおける入力時系列信号に基づく周期、周期の量子化値又は基本周波数と負の相関関係にある値と、現在又は過去のフレームにおける入力時系列信号の周期性の強さ又はピッチゲインと正の相関関係にある値とを用いて前記2個以上の係数テーブルの中の1個の係数テーブルから係数wO(i) (i=0, 1, …, Pmax)を取得する係数決定部と、
取得された前記各次数iに対応する係数wO(i) (i=0, 1, …, Pmax)と前記自己相関RO(i) (i=0, 1, …, Pmax)とが対応するiごとに乗算されたものである変形自己相関R'O(i) (i=0, 1, …, Pmax)を用いて、1次からPmax次までの線形予測係数に変換可能な係数を求める予測係数計算部と、を含み、
前記2個以上の係数テーブルの中の、前記周期、周期の量子化値又は基本周波数と負の相関関係にある値が第一値であり、かつ、前記周期性の強さ又はピッチゲインと正の相関関係にある値が第三値である場合に前記係数決定部で係数wO(i) (i=0, 1, …, Pmax)が取得される係数テーブルを第一係数テーブルとし、
前記2個以上の係数テーブルの中の、前記周期、周期の量子化値又は基本周波数と負の相関関係にある値が前記第一値よりも大きい第二値であり、かつ、前記周期性の強さ又はピッチゲインと正の相関関係にある値が前記第三値よりも小さい第四値である場合に前記係数決定部で係数wO(i) (i=0, 1, …, Pmax)が取得される係数テーブルを第二係数テーブルとして、
少なくとも一部の各次数iに対して、前記第二係数テーブルにおける前記各次数iに対応する係数は、前記第一係数テーブルにおける前記各次数iに対応する係数よりも大きい、
線形予測分析装置。 - 入力時系列信号に対応する線形予測係数に変換可能な係数を、所定時間区間であるフレームごとに求める、線形予測分析装置であって、
少なくともi=0,1,…,Pmaxのそれぞれについて、現在のフレームの入力時系列信号XO(n) とiサンプルだけ過去の入力時系列信号XO(n-i)またはiサンプルだけ未来の入力時系列信号XO(n+i)との自己相関RO(i) (i=0, 1, …, Pmax)を計算する自己相関計算部と、
係数テーブルt0には係数wt0(i) (i=0,1,…,Pmax)が格納されており、係数テーブルt1には係数wt1(i) (i=0,1,…,Pmax)、係数テーブルt2には係数wt2(i) (i=0,1,…,Pmax)が格納されているとして、現在又は過去のフレームにおける入力時系列信号に基づく周期、周期の量子化値又は基本周波数と負の相関関係にある値及びピッチゲインと正の相関関係にある値を用いて前記係数テーブルt0,t1,t2の中の1個の係数テーブルから係数を取得する係数決定部と、
前記取得した係数と前記自己相関RO(i) (i=0, 1, …, Pmax)とが対応するiごとに乗算されたものである変形自己相関R' O(i) (i=0, 1, …, Pmax)を用いて、1次からPmax次までの線形予測係数に変換可能な係数を求める予測係数計算部と、を含み、
少なくとも一部のiについてwt0(i)<wt1(i)≦wt2(i)であり、それ以外のiのうちの少なくとも一部の各iについてwt0(i)≦wt1(i)<wt2(i)であり、残りの各iについてwt0(i)≦wt1(i)≦wt2(i)であり、
前記係数決定部は、周期又は周期の量子化値又は基本周波数と負の相関関係にある値が取り得る範囲を構成する3つの範囲の少なくとも2つの範囲について、ピッチゲインと正の相関関係にある値が小さいときに決定される係数がピッチゲインと正の相関関係にある値が大きいときに決定される係数よりも大きい場合が含まれ、かつ、ピッチゲインと正の相関関係にある値が取り得る範囲を構成する3つの範囲の少なくとも2つの範囲について、周期又は周期の量子化値又は基本周波数と負の相関関係にある値が大きいときに決定される係数が周期又は周期の量子化値又は基本周波数と負の相関関係にある値が小さいときに決定される係数よりも大きい場合が含まれるように、係数テーブルを選択して、選択された係数テーブルに格納されている係数を取得する、
線形予測分析装置。 - 入力時系列信号に対応する線形予測係数に変換可能な係数を、所定時間区間であるフレームごとに求める、線形予測分析装置であって、
少なくともi=0,1,…,Pmaxのそれぞれについて、現在のフレームの入力時系列信号XO(n) とiサンプルだけ過去の入力時系列信号XO(n-i)またはiサンプルだけ未来の入力時系列信号XO(n+i)との自己相関RO(i) (i=0, 1, …, Pmax)を計算する自己相関計算部と、
係数テーブルt0には係数wt0(i) (i=0,1,…,Pmax)が格納されており、係数テーブルt1には係数wt1(i) (i=0,1,…,Pmax)、係数テーブルt2には係数wt2(i) (i=0,1,…,Pmax)が格納されているとして、現在又は過去のフレームにおける入力時系列信号に基づく周期、周期の量子化値又は基本周波数と負の相関関係にある値及びピッチゲインと正の相関関係にある値を用いて前記係数テーブルt0,t1,t2の中の1個の係数テーブルから係数を取得する係数決定部と、
前記取得した係数と前記自己相関RO(i) (i=0, 1, …, Pmax)とが対応するiごとに乗算されたものである変形自己相関R' O(i) (i=0, 1, …, Pmax)を用いて、1次からPmax次までの線形予測係数に変換可能な係数を求める予測係数計算部と、を含み、
少なくとも一部のiについてwt0(i)<wt1(i)≦wt2(i)であり、それ以外のiのうちの少なくとも一部の各iについてwt0(i)≦wt1(i)<wt2(i)であり、残りの各iについてwt0(i)≦wt1(i)≦wt2(i)であり、
前記周期、周期の量子化値又は基本周波数と負の相関関係にある値及びピッチゲインと正の相関関係にある値に応じて、(1)周期が短くピッチゲインが大きい場合には前記係数決定部で係数テーブルt0から係数が取得されるとし、(9)周期が長くピッチゲインが小さい場合には前記係数決定部で係数テーブルt2から係数が取得されるとし、(2)周期が短くピッチゲインが中程度の場合、(3)周期が短くピッチゲインが小さい場合、(4)周期が中程度でありピッチゲインが大きい場合、(5)周期が中程度でありピッチゲインが中程度の場合、(6)周期が中程度でありピッチゲインが小さい場合、(7)周期が長くピッチゲインが大きい場合、(8)周期が長くピッチゲインが中程度の場合、には前記係数決定部で係数テーブルt0,t1,t2の何れかの係数テーブルから係数が取得されるとし、
(2),(3),(4),(5),(6),(7),(8)の少なくとも1つの場合には前記係数決定部で係数テーブルt1から係数が取得されるとし、
k=1,2,…,9として、(k)の場合に前記係数決定部で係数が取得される係数テーブルtjkの番号をjkとして、j1≦j2≦j3であり、j4≦j5≦j6であり、j7≦j8≦j9であり、j1≦j4≦j7であり、j2≦j5≦j8であり、j3≦j6≦j9である、
線形予測分析装置。 - 入力時系列信号に対応する線形予測係数に変換可能な係数を、所定時間区間であるフレームごとに求める、線形予測分析装置であって、
少なくともi=0,1,…,Pmaxのそれぞれについて、現在のフレームの入力時系列信号XO(n) とiサンプルだけ過去の入力時系列信号XO(n-i)またはiサンプルだけ未来の入力時系列信号XO(n+i)との自己相関RO(i) (i=0, 1, …, Pmax)を計算する自己相関計算部と、
係数wO(i) (i=0, 1, …, Pmax)と前記自己相関RO(i) (i=0, 1, …, Pmax)とが対応するiごとに乗算されたものである変形自己相関R'O(i)を用いて、1次からPmax次までの線形予測係数に変換可能な係数を求める予測係数計算部と、を含み、
少なくとも一部の各次数iに対して、前記各次数iに対応する係数wO(i)が、現在又は過去のフレームにおける入力時系列信号に基づく基本周波数と正の相関関係にある値の増加とともに単調減少する関係にある場合及びピッチゲインと正の相関関係にある値の増加とともに単調減少する関係にある場合が含まれている、
線形予測分析装置。 - 入力時系列信号に対応する線形予測係数に変換可能な係数を、所定時間区間であるフレームごとに求める、線形予測分析装置であって、
少なくともi=0,1,…,Pmaxのそれぞれについて、現在のフレームの入力時系列信号XO(n) とiサンプルだけ過去の入力時系列信号XO(n-i)またはiサンプルだけ未来の入力時系列信号XO(n+i)との自己相関RO(i) (i=0, 1, …, Pmax)を計算する自己相関計算部と、
2個以上の係数テーブルのそれぞれにはi=0, 1, …, Pmaxの各次数iと前記各次数iに対応する係数wO(i)とが対応付けて記憶されているとして、現在又は過去のフレームにおける入力時系列信号に基づく基本周波数と正の相関関係にある値と、現在又は過去のフレームにおける入力信号のピッチゲインと正の相関関係にある値とを用いて前記2個以上の係数テーブルの中の1個の係数テーブルから係数wO(i) (i=0, 1, …, Pmax)を取得する係数決定部と、
取得された前記各次数iに対応する係数wO(i) (i=0, 1, …, Pmax)と前記自己相関RO(i) (i=0, 1, …, Pmax)とが対応するiごとに乗算されたものである変形自己相関R' O(i) (i=0, 1, …, Pmax)を用いて、1次からPmax次までの線形予測係数に変換可能な係数を求める予測係数計算部と、を含み、
前記2個以上の係数テーブルの中の、前記基本周波数と正の相関関係にある値が第一値であり、かつ、前記ピッチゲインと正の相関関係にある値が第三値である場合に前記係数決定部で係数wO(i) (i=0, 1, …, Pmax)が取得される係数テーブルを第一係数テーブルとし、
前記2個以上の係数テーブルの中の、前記基本周波数と正の相関関係にある値が前記第一値よりも小さい第二値であり、かつ、前記ピッチゲインと正の相関関係にある値が前記第三値よりも小さい第四値である場合に前記係数決定部で係数wO(i) (i=0, 1, …, Pmax)が取得される係数テーブルを第二係数テーブルとして、
少なくとも一部の各次数iに対して、前記第二係数テーブルにおける前記各次数iに対応する係数は、前記第一係数テーブルにおける前記各次数iに対応する係数よりも大きい、
線形予測分析装置。 - 入力時系列信号に対応する線形予測係数に変換可能な係数を、所定時間区間であるフレームごとに求める、線形予測分析装置であって、
少なくともi=0,1,…,Pmaxのそれぞれについて、現在のフレームの入力時系列信号XO(n) とiサンプルだけ過去の入力時系列信号XO(n-i)またはiサンプルだけ未来の入力時系列信号XO(n+i)との自己相関RO(i) (i=0, 1, …, Pmax)を計算する自己相関計算部と、
係数テーブルt0には係数wt0(i) (i=0,1,…,Pmax)が格納されており、係数テーブルt1には係数wt1(i) (i=0,1,…,Pmax)、係数テーブルt2には係数wt2(i) (i=0,1,…,Pmax)が格納されているとして、現在又は過去のフレームにおける入力時系列信号に基づく基本周波数と正の相関関係にある値及びピッチゲインと正の相関関係にある値を用いて前記係数テーブルt0,t1,t2の中の1個の係数テーブルから係数を取得する係数決定部と、
前記取得した係数と前記自己相関RO(i) (i=0, 1, …, Pmax)とが対応するiごとに乗算されたものである変形自己相関R' O(i) (i=0, 1, …, Pmax)を用いて、1次からPmax次までの線形予測係数に変換可能な係数を求める予測係数計算部と、を含み、
少なくとも一部のiについてwt0(i)<wt1(i)≦wt2(i)であり、それ以外のiのうちの少なくとも一部の各iについてwt0(i)≦wt1(i)<wt2(i)であり、残りの各iについてwt0(i)≦wt1(i)≦wt2(i)であり、
前記係数決定部は、基本周波数と正の相関関係にある値が取り得る範囲を構成する3つの範囲の少なくとも2つの範囲について、ピッチゲインと正の相関関係にある値が小さいときに決定される係数がピッチゲインと正の相関関係にある値が大きいときに決定される係数よりも大きい場合が含まれ、かつ、ピッチゲインと正の相関関係にある値が取り得る範囲を構成する3つの範囲の少なくとも2つの範囲について、基本周波数と正の相関関係にある値が小さいときに決定される係数が基本周波数と正の相関関係にある値が大きいときに決定される係数よりも大きい場合が含まれるように、係数テーブルを選択して、選択された係数テーブルに格納されている係数を取得する、
線形予測分析装置。 - 入力時系列信号に対応する線形予測係数に変換可能な係数を、所定時間区間であるフレームごとに求める、線形予測分析装置であって、
少なくともi=0,1,…,Pmaxのそれぞれについて、現在のフレームの入力時系列信号XO(n)とiサンプルだけ過去の入力時系列信号XO(n-i)またはiサンプルだけ未来の入力時系列信号XO(n+i)との自己相関RO(i) (i=0, 1, …, Pmax)を計算する自己相関計算部と、
係数テーブルt0には係数wt0(i) (i=0,1,…,Pmax)が格納されており、係数テーブルt1には係数wt1(i) (i=0,1,…,Pmax)、係数テーブルt2には係数wt2(i) (i=0,1,…,Pmax)が格納されているとして、現在又は過去のフレームにおける入力時系列信号に基づく基本周波数と正の相関関係にある値及びピッチゲインと正の相関関係にある値を用いて前記係数テーブルt0,t1,t2の中の1個の係数テーブルから係数を取得する係数決定部と、
前記取得した係数と前記自己相関RO(i) (i=0, 1, …, Pmax)とが対応するiごとに乗算されたものである変形自己相関R' O(i) (i=0, 1, …, Pmax)を用いて、1次からPmax次までの線形予測係数に変換可能な係数を求める予測係数計算部と、を含み、
少なくとも一部のiについてwt0(i)<wt1(i)≦wt2(i)であり、それ以外のiのうちの少なくとも一部の各iについてwt0(i)≦wt1(i)<wt2(i)であり、残りの各iについてwt0(i)≦wt1(i)≦wt2(i)であり、
前記基本周波数と正の相関関係にある値及びピッチゲインと正の相関関係にある値に応じて、(1)基本周波数が高くピッチゲインが大きい場合には前記係数決定部で係数テーブルt0から係数が取得されるとし、(9)基本周波数が低くピッチゲインが小さい場合には前記係数決定部で係数テーブルt2から係数が取得されるとし、(2)基本周波数が高くピッチゲインが中程度の場合、(3)基本周波数が高くピッチゲインが小さい場合、(4)基本周波数が中程度でありピッチゲインが大きい場合、(5)基本周波数が中程度でありピッチゲインが中程度の場合、(6)基本周波数が中程度でありピッチゲインが小さい場合、(7)基本周波数が低くピッチゲインが大きい場合、(8)基本周波数が低くピッチゲインが中程度の場合、には前記係数決定部で係数テーブルt0,t1,t2の何れかの係数テーブルから係数が取得されるとし、
(2),(3),(4),(5),(6),(7),(8)の少なくとも1つの場合には前記係数決定部で係数テーブルt1から係数が取得されるとし、
k=1,2,…,9として、(k)の場合に前記係数決定部で係数が取得される係数テーブルtjkの番号をjkとして、j1≦j2≦j3であり、j4≦j5≦j6であり、j7≦j8≦j9であり、j1≦j4≦j7であり、j2≦j5≦j8であり、j3≦j6≦j9である、
線形予測分析装置。 - 請求項1から8の何れかの線形予測分析方法の各ステップをコンピュータに実行させるためのプログラム。
- 請求項1から8の何れかの線形予測分析方法の各ステップをコンピュータに実行させるためのプログラムが記録されたコンピュータ読み取り可能な記録媒体。
Priority Applications (18)
| Application Number | Priority Date | Filing Date | Title |
|---|---|---|---|
| KR1020187004953A KR101850529B1 (ko) | 2014-01-24 | 2015-01-20 | 선형 예측 분석 장치, 방법, 프로그램 및 기록 매체 |
| CN201580005184.3A CN105960676B (zh) | 2014-01-24 | 2015-01-20 | 线性预测分析装置、方法以及记录介质 |
| CN201910603209.XA CN110349590B (zh) | 2014-01-24 | 2015-01-20 | 线性预测分析装置、方法以及记录介质 |
| EP18200698.1A EP3462448B1 (en) | 2014-01-24 | 2015-01-20 | Linear predictive analysis apparatus, method, program and recording medium |
| PL18200716T PL3462449T3 (pl) | 2014-01-24 | 2015-01-20 | Urządzenie, sposób i program do analizy liniowo-predykcyjnej oraz nośnik zapisu |
| PL15740985T PL3098813T3 (pl) | 2014-01-24 | 2015-01-20 | Urządzenie, sposób i program do analizy liniowo-predykcyjnej oraz nośnik zapisu |
| KR1020167019614A KR101832368B1 (ko) | 2014-01-24 | 2015-01-20 | 선형 예측 분석 장치, 방법, 프로그램 및 기록 매체 |
| EP15740985.5A EP3098813B1 (en) | 2014-01-24 | 2015-01-20 | Linear predictive analysis apparatus, method, program and recording medium |
| PL18200698T PL3462448T3 (pl) | 2014-01-24 | 2015-01-20 | Urządzenie, sposób i program do analizy liniowo-predykcyjnej oraz nośnik zapisu |
| CN201910603208.5A CN110299146B (zh) | 2014-01-24 | 2015-01-20 | 线性预测分析装置、方法以及记录介质 |
| ES15740985T ES2713027T3 (es) | 2014-01-24 | 2015-01-20 | Aparato, método, programa y soporte de registro de análisis predictivo lineal |
| JP2015558850A JP6250073B2 (ja) | 2014-01-24 | 2015-01-20 | 線形予測分析装置、方法、プログラム及び記録媒体 |
| US15/112,318 US9928850B2 (en) | 2014-01-24 | 2015-01-20 | Linear predictive analysis apparatus, method, program and recording medium |
| EP18200716.1A EP3462449B1 (en) | 2014-01-24 | 2015-01-20 | Linear predictive analysis apparatus, method, program and recording medium |
| KR1020187004957A KR101883800B1 (ko) | 2014-01-24 | 2015-01-20 | 선형 예측 분석 장치, 방법, 프로그램 및 기록 매체 |
| US15/889,775 US10134420B2 (en) | 2014-01-24 | 2018-02-06 | Linear predictive analysis apparatus, method, program and recording medium |
| US15/889,684 US10134419B2 (en) | 2014-01-24 | 2018-02-06 | Linear predictive analysis apparatus, method, program and recording medium |
| US15/889,748 US10115413B2 (en) | 2014-01-24 | 2018-02-06 | Linear predictive analysis apparatus, method, program and recording medium |
Applications Claiming Priority (4)
| Application Number | Priority Date | Filing Date | Title |
|---|---|---|---|
| JP2014-011318 | 2014-01-24 | ||
| JP2014011318 | 2014-01-24 | ||
| JP2014152525 | 2014-07-28 | ||
| JP2014-152525 | 2014-07-28 |
Related Child Applications (4)
| Application Number | Title | Priority Date | Filing Date |
|---|---|---|---|
| US15/112,318 A-371-Of-International US9928850B2 (en) | 2014-01-24 | 2015-01-20 | Linear predictive analysis apparatus, method, program and recording medium |
| US15/889,775 Continuation US10134420B2 (en) | 2014-01-24 | 2018-02-06 | Linear predictive analysis apparatus, method, program and recording medium |
| US15/889,748 Continuation US10115413B2 (en) | 2014-01-24 | 2018-02-06 | Linear predictive analysis apparatus, method, program and recording medium |
| US15/889,684 Continuation US10134419B2 (en) | 2014-01-24 | 2018-02-06 | Linear predictive analysis apparatus, method, program and recording medium |
Publications (1)
| Publication Number | Publication Date |
|---|---|
| WO2015111569A1 true WO2015111569A1 (ja) | 2015-07-30 |
Family
ID=53681372
Family Applications (1)
| Application Number | Title | Priority Date | Filing Date |
|---|---|---|---|
| PCT/JP2015/051352 Ceased WO2015111569A1 (ja) | 2014-01-24 | 2015-01-20 | 線形予測分析装置、方法、プログラム及び記録媒体 |
Country Status (8)
| Country | Link |
|---|---|
| US (4) | US9928850B2 (ja) |
| EP (3) | EP3462449B1 (ja) |
| JP (3) | JP6250073B2 (ja) |
| KR (3) | KR101832368B1 (ja) |
| CN (3) | CN110349590B (ja) |
| ES (3) | ES2863554T3 (ja) |
| PL (3) | PL3098813T3 (ja) |
| WO (1) | WO2015111569A1 (ja) |
Cited By (1)
| Publication number | Priority date | Publication date | Assignee | Title |
|---|---|---|---|---|
| CN107980151A (zh) * | 2017-02-22 | 2018-05-01 | 清华大学深圳研究生院 | 一种基于心电认证的门禁系统及其认证方法 |
Families Citing this family (6)
| Publication number | Priority date | Publication date | Assignee | Title |
|---|---|---|---|---|
| KR101883767B1 (ko) * | 2013-07-18 | 2018-07-31 | 니폰 덴신 덴와 가부시끼가이샤 | 선형 예측 분석 장치, 방법, 프로그램 및 기록 매체 |
| CN110349590B (zh) * | 2014-01-24 | 2023-03-24 | 日本电信电话株式会社 | 线性预测分析装置、方法以及记录介质 |
| JP6250072B2 (ja) * | 2014-01-24 | 2017-12-20 | 日本電信電話株式会社 | 線形予測分析装置、方法、プログラム及び記録媒体 |
| JP6904198B2 (ja) * | 2017-09-25 | 2021-07-14 | 富士通株式会社 | 音声処理プログラム、音声処理方法および音声処理装置 |
| EP3737115A1 (en) * | 2019-05-06 | 2020-11-11 | GN Hearing A/S | A hearing apparatus with bone conduction sensor |
| KR102773518B1 (ko) * | 2022-11-30 | 2025-02-27 | 주식회사 아큐리스 | 점유용량을 감소하기 위한 음성인식 시스템 및 방법 |
Citations (6)
| Publication number | Priority date | Publication date | Assignee | Title |
|---|---|---|---|---|
| JP2007279393A (ja) * | 2006-04-06 | 2007-10-25 | Nippon Telegr & Teleph Corp <Ntt> | Parcor係数算出装置、parcor係数算出方法、そのプログラムおよびその記録媒体 |
| JP2007286200A (ja) * | 2006-04-13 | 2007-11-01 | Nippon Telegr & Teleph Corp <Ntt> | 適応ブロック長符号化装置、その方法、プログラム及び記録媒体 |
| JP2008185701A (ja) * | 2007-01-29 | 2008-08-14 | Nippon Telegr & Teleph Corp <Ntt> | Parcor係数算出方法、及びその装置とそのプログラムと、その記憶媒体 |
| JP2009500681A (ja) * | 2005-07-11 | 2009-01-08 | エルジー エレクトロニクス インコーポレイティド | オーディオ信号のエンコーディング及びデコーディング装置及び方法 |
| WO2010073977A1 (ja) * | 2008-12-22 | 2010-07-01 | 日本電信電話株式会社 | 符号化方法、復号方法、それらの装置、プログラム及び記録媒体 |
| WO2010084951A1 (ja) * | 2009-01-23 | 2010-07-29 | 日本電信電話株式会社 | パラメータ選択方法、パラメータ選択装置、プログラム及び記録媒体 |
Family Cites Families (20)
| Publication number | Priority date | Publication date | Assignee | Title |
|---|---|---|---|---|
| FR2654542B1 (fr) * | 1989-11-14 | 1992-01-17 | Thomson Csf | Procede et dispositif de codage de filtres predicteurs de vocodeurs tres bas debit. |
| JP3237089B2 (ja) * | 1994-07-28 | 2001-12-10 | 株式会社日立製作所 | 音響信号符号化復号方法 |
| US5781880A (en) * | 1994-11-21 | 1998-07-14 | Rockwell International Corporation | Pitch lag estimation using frequency-domain lowpass filtering of the linear predictive coding (LPC) residual |
| FR2742568B1 (fr) * | 1995-12-15 | 1998-02-13 | Catherine Quinquis | Procede d'analyse par prediction lineaire d'un signal audiofrequence, et procedes de codage et de decodage d'un signal audiofrequence en comportant application |
| WO1998030027A1 (fr) * | 1996-12-26 | 1998-07-09 | Sony Corporation | Dispositif de codage de signaux d'image, procede de codage de signaux d'image, dispositif de decodage de signaux d'image, procede de decodage de signaux d'image et support d'enregistrement |
| US7529661B2 (en) * | 2002-02-06 | 2009-05-05 | Broadcom Corporation | Pitch extraction methods and systems for speech coding using quadratically-interpolated and filtered peaks for multiple time lag extraction |
| US20040002856A1 (en) * | 2002-03-08 | 2004-01-01 | Udaya Bhaskar | Multi-rate frequency domain interpolative speech CODEC system |
| ATE336781T1 (de) * | 2002-05-30 | 2006-09-15 | Koninkl Philips Electronics Nv | Codierung von audiosignalen |
| US7379866B2 (en) * | 2003-03-15 | 2008-05-27 | Mindspeed Technologies, Inc. | Simple noise suppression model |
| JP2009539132A (ja) * | 2006-05-30 | 2009-11-12 | コーニンクレッカ フィリップス エレクトロニクス エヌ ヴィ | オーディオ信号の線形予測符号化 |
| JP2009185701A (ja) * | 2008-02-06 | 2009-08-20 | Aisan Ind Co Ltd | 燃料ポンプ |
| CN101609678B (zh) | 2008-12-30 | 2011-07-27 | 华为技术有限公司 | 信号压缩方法及其压缩装置 |
| CN101599272B (zh) * | 2008-12-30 | 2011-06-08 | 华为技术有限公司 | 基音搜索方法及装置 |
| WO2010102446A1 (zh) * | 2009-03-11 | 2010-09-16 | 华为技术有限公司 | 一种线性预测分析方法、装置及系统 |
| CN102930871B (zh) * | 2009-03-11 | 2014-07-16 | 华为技术有限公司 | 一种线性预测分析方法、装置及系统 |
| KR101698439B1 (ko) * | 2010-04-09 | 2017-01-20 | 돌비 인터네셔널 에이비 | Mdct-기반의 복소수 예측 스테레오 코딩 |
| KR20130111611A (ko) * | 2011-01-25 | 2013-10-10 | 니뽄 덴신 덴와 가부시키가이샤 | 부호화 방법, 부호화 장치, 주기성 특징량 결정 방법, 주기성 특징량 결정 장치, 프로그램, 기록 매체 |
| CN102783034B (zh) * | 2011-02-01 | 2014-12-17 | 华为技术有限公司 | 用于提供信号处理系数的方法和设备 |
| CN110349590B (zh) * | 2014-01-24 | 2023-03-24 | 日本电信电话株式会社 | 线性预测分析装置、方法以及记录介质 |
| JP6250072B2 (ja) * | 2014-01-24 | 2017-12-20 | 日本電信電話株式会社 | 線形予測分析装置、方法、プログラム及び記録媒体 |
-
2015
- 2015-01-20 CN CN201910603209.XA patent/CN110349590B/zh active Active
- 2015-01-20 EP EP18200716.1A patent/EP3462449B1/en active Active
- 2015-01-20 EP EP18200698.1A patent/EP3462448B1/en active Active
- 2015-01-20 PL PL15740985T patent/PL3098813T3/pl unknown
- 2015-01-20 ES ES18200716T patent/ES2863554T3/es active Active
- 2015-01-20 US US15/112,318 patent/US9928850B2/en active Active
- 2015-01-20 PL PL18200716T patent/PL3462449T3/pl unknown
- 2015-01-20 KR KR1020167019614A patent/KR101832368B1/ko active Active
- 2015-01-20 WO PCT/JP2015/051352 patent/WO2015111569A1/ja not_active Ceased
- 2015-01-20 CN CN201580005184.3A patent/CN105960676B/zh active Active
- 2015-01-20 EP EP15740985.5A patent/EP3098813B1/en active Active
- 2015-01-20 CN CN201910603208.5A patent/CN110299146B/zh active Active
- 2015-01-20 KR KR1020187004953A patent/KR101850529B1/ko active Active
- 2015-01-20 JP JP2015558850A patent/JP6250073B2/ja active Active
- 2015-01-20 PL PL18200698T patent/PL3462448T3/pl unknown
- 2015-01-20 KR KR1020187004957A patent/KR101883800B1/ko active Active
- 2015-01-20 ES ES18200698T patent/ES2798139T3/es active Active
- 2015-01-20 ES ES15740985T patent/ES2713027T3/es active Active
-
2017
- 2017-11-21 JP JP2017223809A patent/JP6449969B2/ja active Active
- 2017-11-21 JP JP2017223810A patent/JP6423065B2/ja active Active
-
2018
- 2018-02-06 US US15/889,684 patent/US10134419B2/en active Active
- 2018-02-06 US US15/889,748 patent/US10115413B2/en active Active
- 2018-02-06 US US15/889,775 patent/US10134420B2/en active Active
Patent Citations (6)
| Publication number | Priority date | Publication date | Assignee | Title |
|---|---|---|---|---|
| JP2009500681A (ja) * | 2005-07-11 | 2009-01-08 | エルジー エレクトロニクス インコーポレイティド | オーディオ信号のエンコーディング及びデコーディング装置及び方法 |
| JP2007279393A (ja) * | 2006-04-06 | 2007-10-25 | Nippon Telegr & Teleph Corp <Ntt> | Parcor係数算出装置、parcor係数算出方法、そのプログラムおよびその記録媒体 |
| JP2007286200A (ja) * | 2006-04-13 | 2007-11-01 | Nippon Telegr & Teleph Corp <Ntt> | 適応ブロック長符号化装置、その方法、プログラム及び記録媒体 |
| JP2008185701A (ja) * | 2007-01-29 | 2008-08-14 | Nippon Telegr & Teleph Corp <Ntt> | Parcor係数算出方法、及びその装置とそのプログラムと、その記憶媒体 |
| WO2010073977A1 (ja) * | 2008-12-22 | 2010-07-01 | 日本電信電話株式会社 | 符号化方法、復号方法、それらの装置、プログラム及び記録媒体 |
| WO2010084951A1 (ja) * | 2009-01-23 | 2010-07-29 | 日本電信電話株式会社 | パラメータ選択方法、パラメータ選択装置、プログラム及び記録媒体 |
Non-Patent Citations (5)
| Title |
|---|
| ITU-T RECOMMENDATION G.718, ITU, 2008 |
| ITU-T RECOMMENDATION G.729, ITU, 1996 |
| See also references of EP3098813A4 |
| YOH'ICHI TOHKURA ET AL.: "Spectral Smoothing Technique in PARCOR Speech Analysis-Synthesis", IEEE TRANSACTIONS ON ACOUSTICS, SPEECH AND SIGNAL PROCESSING, vol. 26, no. 6, December 1978 (1978-12-01), pages 587 - 596, XP002032606 * |
| YOH'ICHI TOHKURA; FUMITADA ITAKURA; SHIN'ICHIRO HASHIMOTO: "Spectral Smoothing Technique in PARCOR Speech Analysis-Synthesis", IEEE TRANS. ON ACOUSTICS, SPEECH, AND SIGNAL PROCESSING, vol. ASSP-26, no. 6, 1978, XP002032606, DOI: doi:10.1109/TASSP.1978.1163165 |
Cited By (2)
| Publication number | Priority date | Publication date | Assignee | Title |
|---|---|---|---|---|
| CN107980151A (zh) * | 2017-02-22 | 2018-05-01 | 清华大学深圳研究生院 | 一种基于心电认证的门禁系统及其认证方法 |
| CN107980151B (zh) * | 2017-02-22 | 2020-03-17 | 清华大学深圳研究生院 | 一种基于心电认证的门禁系统及其认证方法 |
Also Published As
Similar Documents
| Publication | Publication Date | Title |
|---|---|---|
| JP6423065B2 (ja) | 線形予測分析装置、方法、プログラム及び記録媒体 | |
| JP6117359B2 (ja) | 線形予測分析装置、方法、プログラム及び記録媒体 | |
| JP6416363B2 (ja) | 線形予測分析装置、方法、プログラム及び記録媒体 |
Legal Events
| Date | Code | Title | Description |
|---|---|---|---|
| 121 | Ep: the epo has been informed by wipo that ep was designated in this application |
Ref document number: 15740985 Country of ref document: EP Kind code of ref document: A1 |
|
| ENP | Entry into the national phase |
Ref document number: 2015558850 Country of ref document: JP Kind code of ref document: A |
|
| REEP | Request for entry into the european phase |
Ref document number: 2015740985 Country of ref document: EP |
|
| WWE | Wipo information: entry into national phase |
Ref document number: 15112318 Country of ref document: US Ref document number: 2015740985 Country of ref document: EP |
|
| ENP | Entry into the national phase |
Ref document number: 20167019614 Country of ref document: KR Kind code of ref document: A |
|
| NENP | Non-entry into the national phase |
Ref country code: DE |