WO2015151508A1 - 生体計測装置および生体計測方法 - Google Patents
生体計測装置および生体計測方法 Download PDFInfo
- Publication number
- WO2015151508A1 WO2015151508A1 PCT/JP2015/001849 JP2015001849W WO2015151508A1 WO 2015151508 A1 WO2015151508 A1 WO 2015151508A1 JP 2015001849 W JP2015001849 W JP 2015001849W WO 2015151508 A1 WO2015151508 A1 WO 2015151508A1
- Authority
- WO
- WIPO (PCT)
- Prior art keywords
- infrared sensor
- force
- unit
- sensor
- infrared
- Prior art date
- Legal status (The legal status is an assumption and is not a legal conclusion. Google has not performed a legal analysis and makes no representation as to the accuracy of the status listed.)
- Ceased
Links
Images


Classifications
-
- A—HUMAN NECESSITIES
- A61—MEDICAL OR VETERINARY SCIENCE; HYGIENE
- A61B—DIAGNOSIS; SURGERY; IDENTIFICATION
- A61B5/00—Measuring for diagnostic purposes; Identification of persons
- A61B5/0059—Measuring for diagnostic purposes; Identification of persons using light, e.g. diagnosis by transillumination, diascopy, fluorescence
- A61B5/0075—Measuring for diagnostic purposes; Identification of persons using light, e.g. diagnosis by transillumination, diascopy, fluorescence by spectroscopy, i.e. measuring spectra, e.g. Raman spectroscopy, infrared absorption spectroscopy
-
- A—HUMAN NECESSITIES
- A61—MEDICAL OR VETERINARY SCIENCE; HYGIENE
- A61B—DIAGNOSIS; SURGERY; IDENTIFICATION
- A61B5/00—Measuring for diagnostic purposes; Identification of persons
- A61B5/02—Detecting, measuring or recording for evaluating the cardiovascular system, e.g. pulse, heart rate, blood pressure or blood flow
- A61B5/024—Measuring pulse rate or heart rate
- A61B5/02416—Measuring pulse rate or heart rate using photoplethysmograph signals, e.g. generated by infrared radiation
-
- A—HUMAN NECESSITIES
- A61—MEDICAL OR VETERINARY SCIENCE; HYGIENE
- A61B—DIAGNOSIS; SURGERY; IDENTIFICATION
- A61B5/00—Measuring for diagnostic purposes; Identification of persons
- A61B5/145—Measuring characteristics of blood in vivo, e.g. gas concentration or pH-value ; Measuring characteristics of body fluids or tissues, e.g. interstitial fluid or cerebral tissue
- A61B5/14532—Measuring characteristics of blood in vivo, e.g. gas concentration or pH-value ; Measuring characteristics of body fluids or tissues, e.g. interstitial fluid or cerebral tissue for measuring glucose, e.g. by tissue impedance measurement
-
- A—HUMAN NECESSITIES
- A61—MEDICAL OR VETERINARY SCIENCE; HYGIENE
- A61B—DIAGNOSIS; SURGERY; IDENTIFICATION
- A61B5/00—Measuring for diagnostic purposes; Identification of persons
- A61B5/145—Measuring characteristics of blood in vivo, e.g. gas concentration or pH-value ; Measuring characteristics of body fluids or tissues, e.g. interstitial fluid or cerebral tissue
- A61B5/1455—Measuring characteristics of blood in vivo, e.g. gas concentration or pH-value ; Measuring characteristics of body fluids or tissues, e.g. interstitial fluid or cerebral tissue using optical sensors, e.g. spectral photometrical oximeters
-
- A—HUMAN NECESSITIES
- A61—MEDICAL OR VETERINARY SCIENCE; HYGIENE
- A61B—DIAGNOSIS; SURGERY; IDENTIFICATION
- A61B5/00—Measuring for diagnostic purposes; Identification of persons
- A61B5/68—Arrangements of detecting, measuring or recording means, e.g. sensors, in relation to patient
- A61B5/6801—Arrangements of detecting, measuring or recording means, e.g. sensors, in relation to patient specially adapted to be attached to or worn on the body surface
- A61B5/6802—Sensor mounted on worn items
- A61B5/681—Wristwatch-type devices
-
- A—HUMAN NECESSITIES
- A61—MEDICAL OR VETERINARY SCIENCE; HYGIENE
- A61B—DIAGNOSIS; SURGERY; IDENTIFICATION
- A61B5/00—Measuring for diagnostic purposes; Identification of persons
- A61B5/68—Arrangements of detecting, measuring or recording means, e.g. sensors, in relation to patient
- A61B5/6801—Arrangements of detecting, measuring or recording means, e.g. sensors, in relation to patient specially adapted to be attached to or worn on the body surface
- A61B5/6843—Monitoring or controlling sensor contact pressure
-
- A—HUMAN NECESSITIES
- A61—MEDICAL OR VETERINARY SCIENCE; HYGIENE
- A61B—DIAGNOSIS; SURGERY; IDENTIFICATION
- A61B5/00—Measuring for diagnostic purposes; Identification of persons
- A61B5/72—Signal processing specially adapted for physiological signals or for diagnostic purposes
- A61B5/7221—Determining signal validity, reliability or quality
-
- A—HUMAN NECESSITIES
- A61—MEDICAL OR VETERINARY SCIENCE; HYGIENE
- A61B—DIAGNOSIS; SURGERY; IDENTIFICATION
- A61B2562/00—Details of sensors; Constructional details of sensor housings or probes; Accessories for sensors
- A61B2562/02—Details of sensors specially adapted for in-vivo measurements
- A61B2562/0247—Pressure sensors
-
- A—HUMAN NECESSITIES
- A61—MEDICAL OR VETERINARY SCIENCE; HYGIENE
- A61B—DIAGNOSIS; SURGERY; IDENTIFICATION
- A61B2562/00—Details of sensors; Constructional details of sensor housings or probes; Accessories for sensors
- A61B2562/02—Details of sensors specially adapted for in-vivo measurements
- A61B2562/0257—Proximity sensors
Definitions
- the present invention relates to a biological measurement apparatus and a biological measurement method.
- Patent Document 1 discloses a blood glucose level measuring apparatus using an ATR method (Attenuated Total Reflection). According to this, a glass plate having a reflective film on one side is prepared. And the surface which does not have a reflecting film in a glass plate is made to contact
- ATR method Attenuated Total Reflection
- Spectra data is obtained by spectroscopic analysis of the detected infrared light.
- capillaries in the skin of a living body, and a part of infrared light irradiated on the surface of the skin is absorbed by the capillaries.
- infrared light absorbed at a specific wavelength There is a correlation between infrared light absorbed at a specific wavelength and blood components. Therefore, there is a correlation between the detected light intensity at a specific wavelength and the blood component concentration of the test subject.
- blood glucose concentration can be detected using the ATR method.
- Patent Document 2 discloses a measuring device in which an optical sensor is installed on a belt wound around an arm. According to this, a belt is installed on the measuring device main body. Secure the measuring device by winding the belt around the human arm. An optical sensor is installed on the arm side surface of the belt. The measuring device is used by adjusting the length of the belt wound around the arm and bringing the optical sensor into close contact with the skin.
- the present invention has been made to solve the above-described problems, and can be realized as the following forms or application examples.
- a biological measurement apparatus wherein an infrared sensor unit that irradiates a living body with infrared light, receives the infrared light reflected or scattered by the living body, and outputs light intensity data; and the infrared sensor A plurality of detection units including a contact force sensor unit that detects a contact force between the sensor unit and the living body; and a holding unit that holds the detection unit so that the infrared sensor unit contacts the living body.
- a determination unit that compares the contact force with a determination value to determine whether the contact force is within a predetermined range; and the determination unit that determines that the contact force is within a predetermined range.
- a component concentration calculator that calculates the component concentration of the living body using light intensity data.
- the biological measurement apparatus includes a plurality of detection units, a holding unit, and a determination unit.
- the detection unit includes an infrared sensor unit and a contact force sensor unit.
- the holding unit holds the detection unit so that the infrared sensor unit contacts the living body.
- the infrared sensor unit irradiates the living body with infrared light.
- the infrared sensor unit receives infrared light reflected or scattered by the living body and outputs light intensity data.
- the contact force sensor unit detects a contact force between the infrared sensor unit and the living body. Then, the determination unit compares the contact force with a determination value to determine whether the contact force is within a predetermined range.
- the infrared sensor unit When the infrared sensor part is separated from the living body, the infrared light is not absorbed by the living body. Therefore, the infrared sensor unit cannot receive infrared light reflecting biological information with high accuracy. Further, when the infrared sensor part presses the living body too much, the blood vessels of the living body are pressed and blood flow near the surface is inhibited. Accordingly, since the living body is not suitable for measurement, the light intensity data received by the infrared sensor unit is data that does not correctly reflect the state of the living body.
- the determination unit determines the state in which the infrared sensor unit presses the living body.
- the component concentration calculation unit uses data when the light intensity data output from the infrared sensor unit reflects the state of the living body, and uses data when the light intensity data does not reflect the state of the living body. Without calculating the component concentration of the living body. Therefore, the living body measurement apparatus can accurately measure the concentration of the living body component by using only the light intensity data that reflects the state of the living body among the light intensity data output from the plurality of infrared sensor units. .
- the biological measurement apparatus includes an average value calculation unit that calculates an average value of the component concentrations calculated from the light intensity data output from the plurality of infrared sensor units.
- a plurality of infrared sensor units are installed in the biological measurement apparatus, and each infrared sensor unit outputs light intensity data. And since an average value calculating part calculates the average of the light intensity data which a some infrared sensor part outputs, the influence of a disturbance can be suppressed and a reliable component density
- concentration can be measured.
- the infrared sensor units are driven sequentially. Thereby, the peak value of the electric power consumed by drive can be lowered compared with the case where a plurality of infrared sensor units are driven simultaneously. Accordingly, the capacity of supplying power can be reduced, and the capacity of the power supply can be reduced.
- the detection unit includes a plurality of the contact force sensor units.
- the detection unit includes an infrared sensor unit and a plurality of contact force sensor units.
- the determination part compares the contact force which a some contact force sensor part outputs with a determination value.
- the infrared sensor unit is inclined with respect to the living body, a difference occurs in the contact force received by the plurality of contact force sensor units from the arm.
- the state in which the infrared sensor unit is inclined with respect to the living body can also be detected.
- the light intensity data which an infrared sensor part outputs in the state in which an infrared sensor part inclines with respect to a biological body is not used. Therefore, it is possible to use the light intensity data of the reflected light detected by the infrared sensor unit when the infrared sensor unit is in a correct posture without being inclined with respect to the living body. As a result, biological information can be detected with high accuracy.
- a biological measurement apparatus wherein an infrared sensor unit that irradiates a living body with infrared light, receives the infrared light reflected or scattered by the living body, and outputs light intensity data; and the infrared sensor A plurality of detection units including a contact force sensor unit that detects a contact force between the sensor unit and the living body; and a holding unit that holds the detection unit so that the infrared sensor unit contacts the living body.
- a determination unit for comparing the contact force with a determination value to determine whether the contact force is within a predetermined range; and driving the infrared sensor unit when the contact force is within the predetermined range.
- An infrared sensor control unit that performs control, and a component concentration calculation unit that calculates a component concentration of the living body using the light intensity data.
- the determination unit determines the state in which the infrared sensor unit presses the living body.
- the infrared sensor control unit drives the infrared sensor unit when the contact force with which the infrared sensor unit presses the living body is within a predetermined range. Therefore, the infrared sensor control unit drives the infrared sensor unit only when the infrared sensor unit can output appropriate light intensity data. Therefore, the living body measurement apparatus can accurately measure the concentration of the living body component by using only the light intensity data that reflects the state of the living body among the light intensity data output from the plurality of infrared sensor units. . Furthermore, since the power for driving the infrared sensor unit is not wasted, the infrared sensor unit can be driven with resource saving.
- a biological measurement method wherein a plurality of infrared sensor units are pressed against a living body, a contact force between the infrared sensor unit and the living body is detected, and the contact force is within a predetermined range.
- the infrared sensor unit is driven, the infrared sensor unit irradiates the living body with infrared light, receives the infrared light reflected or scattered by the living body, outputs light intensity data, and outputs the light intensity data.
- the component concentration of the living body is calculated from the intensity data.
- a plurality of infrared sensor units are pressed against the living body.
- Each infrared sensor unit irradiates the living body with infrared light, receives infrared light reflected or scattered by the living body, and outputs light intensity data. Then, the component concentration of the living body is calculated using the light intensity data.
- the contact force between each infrared sensor unit and the living body is detected, and the infrared sensor unit is driven when the contact force is within a predetermined range. Therefore, the infrared sensor unit detects the light intensity data of the reflected light of the infrared light only when the infrared sensor unit can detect the light intensity data with high accuracy. As a result, the light intensity of the infrared light reflected from the living body can be detected with high accuracy.
- FIG. (A) is a principal part model enlarged side view which shows the main-body part of a biological measurement apparatus
- (b) is a principal part schematic diagram which shows the structure of an infrared sensor
- (c) is a principal part which shows the structure of a force sensor.
- the electric control block diagram of a biological measurement apparatus. The flowchart of the biometric method. The figure for demonstrating the biological measurement method. The figure for demonstrating the biological measurement method. The figure for demonstrating the biological measurement method. The figure for demonstrating the biological measurement method.
- the principal part model enlarged view which shows the structure of the force sensor in connection with 2nd Embodiment.
- (a) is a schematic enlarged view of the main part showing the structure of the main body part
- (b) is a schematic enlarged view of the main part showing the structure of the belt part.
- (A)-(c) is a schematic diagram for demonstrating the biological measurement method.
- the time chart which shows the drive timing of the infrared sensor in connection with 4th Embodiment.
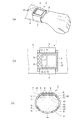
- FIG. 1A is a schematic perspective view showing the configuration of the biological measurement device
- FIG. 1B is a schematic front view showing the configuration of the biological measurement device
- FIG. 1C is a schematic side view showing the configuration of the biological measurement apparatus
- Fig.2 (a) is a principal part model expanded side view which shows the main-body part of a bioinstrumentation apparatus.
- the living body measuring device 1 includes a main body 2 as a holding portion and a belt portion 3 as a holding portion installed in the main body 2.
- the main body 2 and the belt 3 form a cylindrical shape.
- the arm 4 as a living body of a human body is inserted in the cylindrical place. That is, the biological measuring device 1 is used by being installed on the arm 4 like a wristwatch.
- a display device 5 and an input device 6 are installed on the surface opposite to the arm 4.
- the display device 5 is a part that displays information such as the measured blood glucose level.
- a liquid crystal display device, an organic EL (Electro Luminescence) device, or the like can be used as the display device 5.
- the input device 6 is composed of a plurality of switches and the like, and an operator can perform various settings by operating the input device 6.
- a first detection unit 7 as a detection unit and a second detection unit 8 as a detection unit are installed on the surface of the main body unit 2 facing the arm 4. Furthermore, a third detection unit 9 as a detection unit and a fourth detection unit 10 as a detection unit are installed on the surface of the belt unit 3 facing the arm 4.
- the first detection unit 7 is provided with a first infrared sensor 11 as an infrared sensor unit and a first force sensor 12 as a contact force sensor unit
- the second detection unit 8 has a second sensor as an infrared sensor unit.
- An infrared sensor 13 and a second force sensor 14 as a contact force sensor unit are installed.
- the third detection unit 9 is provided with a third infrared sensor 15 as an infrared sensor unit and a third force sensor 16 as a contact force sensor unit
- the fourth detection unit 10 includes a fourth infrared sensor unit as a fourth infrared sensor unit.
- An infrared sensor 17 and a fourth force sensor 18 as a contact force sensor unit are installed.
- a control unit 21 is installed inside the main body unit 2. The control unit 21 controls the display device 5, the input device 6, and the first detection unit 7 to the fourth detection unit 10.
- the main body 2 includes a battery and a buzzer (not shown).
- the belt unit 3 is provided with an adjusting unit 3a.
- the adjusting portion 3a can adjust the length of the belt portion 3.
- the operator operates the adjustment unit 3a after wearing the biometric device 1 on the arm 4. Then, the operator adjusts the length of the belt unit 3 so that the first detection unit 7 to the fourth detection unit 10 come into contact with the arm 4.
- the belt portion 3 is made of metal and has a structure in which a plurality of leaf springs are connected. Thereby, the belt part 3 expands and contracts.
- a holding part 22 is constituted by the main body part 2 and the belt part 3.
- the first infrared sensor 11 to the fourth infrared sensor 17 and the first force sensor 12 to the fourth force sensor 18 are held by the holding portion 22 so as to contact the arm 4.
- FIG. 2 (b) is a schematic diagram of the main part showing the structure of the infrared sensor.
- the first infrared sensor 11 includes a plate-like prism 23.
- the prism 23 has a pair of opposing side surfaces as slopes.
- the first light emitting device 24 is installed on one slope, and the first light receiving device 25 is installed on the other slope.
- the material of the prism 23 may be any material that transmits infrared light. For example, ZnSe, Ge, Si, or the like can be used.
- the first light emitting device 24 includes an LED (Light Emitting Diode) or the like, and the first light emitting device 24 irradiates infrared light 26 toward the inside of the prism 23.
- the first light receiving device 25 includes a spectroscope and a photodiode.
- the first light receiving device 25 splits the infrared light 26 into a predetermined wavelength and converts the light intensity of each wavelength into an electric signal.
- the spectroscope is configured by combining a diffraction grating, a concave mirror, and a slit. The spectroscope rotates the mirror and separates the light having a predetermined wavelength so as to pass through the slit.
- the infrared light 26 that has passed through the slit is converted into an electrical signal by a photodiode.
- a surface that contacts the arm 4 is a first surface 23a, and a surface that faces the first surface 23a is a second surface 23b.
- the first surface 23a and the second surface 23b are arranged in parallel.
- a reflective film 29 is provided on the second surface 23b.
- the reflective film 29 is preferably made of a highly reflective metal such as silver.
- the infrared light 26 irradiated by the first light emitting device 24 travels toward the first surface 23a.
- the infrared light 26 irradiates the surface of the arm 4 with the first surface 23 a and is reflected by the surface of the arm 4.
- the reflected infrared light 26 travels toward the reflection film 29 and is reflected by the reflection film 29.
- the infrared light 26 is repeatedly reflected between the surface of the arm 4 on the first surface 23 a and the second surface 23 b and travels toward the first light receiving device 25.
- the infrared light 26 Every time the infrared light 26 is reflected by the first surface 23 a, a part of the infrared light 26 having a predetermined wavelength is absorbed by the capillaries in the arm 4. As a result, the light intensity of the infrared light 26 at a predetermined wavelength is reduced.
- the infrared light 26 that has reached the first light receiving device 25 is split and converted into an electrical signal.
- the electrical signal is a signal corresponding to the light intensity data.
- the first infrared sensor 11 irradiates the arm 4 with the infrared light 26 and receives the infrared light 26 reflected by the arm 4 and outputs light intensity data.
- the second infrared sensor 13 to the fourth infrared sensor 17 have the same structure as the first infrared sensor 11 and have the same functions.
- the holding unit 22 holds the first infrared sensor 11 to the fourth infrared sensor 17 so that the first surface 23 a is in contact with the arm 4.
- FIG. 2 (c) is a schematic enlarged view of the main part showing the structure of the force sensor.
- the first force sensor 12 includes a sensor main body 12b and a pressing protrusion 12a as a protrusion.
- a piezoelectric element is built in the sensor body 12b, and the piezoelectric element is sandwiched between the sensor body 12b and the pressing protrusion 12a.
- the piezoelectric element generates and outputs a voltage corresponding to the differential value of the force. Therefore, the pressure applied to the first force sensor 12 can be detected using the voltage output from the piezoelectric element.
- the first infrared sensor 11 and the first force sensor 12 are held by the holding unit 22 and come into contact with the arm 4. Since the first infrared sensor 11 and the first force sensor 12 are installed in a close place, the pressure applied by the arm 4 to the first infrared sensor 11 and the pressure applied by the arm 4 to the first force sensor 12 are approximately. The pressure is the same.
- the pressing force applied to the first infrared sensor 11 can be detected by detecting the pressing force applied to the first force sensor 12. Therefore, the first force sensor 12 can detect the force of pressing between the first infrared sensor 11 and the arm 4.
- the pressing protrusion 12a protrudes from the contact surface 22a of the holding portion 22 toward the arm 4 side.
- the contact surface 22 a is substantially the same surface as the first surface 23 a of the prism 23. Accordingly, the pressing protrusion 12 a protrudes from the first infrared sensor 11 toward the arm 4 side. Thereby, even when the first infrared sensor 11 and the arm 4 are separated from each other, the pressing protrusion 12 a can be in contact with the arm 4. Therefore, the first force sensor 12 can reliably detect whether or not the first infrared sensor 11 and the arm 4 are in contact.
- the second force sensor 14 to the fourth force sensor 18 have the same structure and the same function as the first force sensor 12.
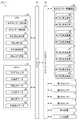
- FIG. 3 is an electric control block diagram of the living body measuring apparatus.
- the control unit 21 of the biological measurement apparatus 1 includes a CPU 30 (arithmetic processing apparatus) that performs various arithmetic processes as a processor and a memory 31 that stores various types of information.
- the infrared sensor driving device 32, the first force sensor 12 to the fourth force sensor 18, the display device 5 and the input device 6 are connected to the CPU 30 via the input / output interface 33 and the data bus 34.
- the infrared sensor driving device 32 is a device that drives the first light emitting device 24 and the first light receiving device 25 of the first infrared sensor 11.
- the infrared sensor driving device 32 drives the second light emitting device 35 and the second light receiving device 36 of the second infrared sensor 13.
- the infrared sensor driving device 32 drives the third light emitting device 37 and the third light receiving device 38 of the third infrared sensor 15.
- the infrared sensor driving device 32 drives the fourth light emitting device 41 and the fourth light receiving device 42 of the fourth infrared sensor 17.
- the infrared sensor driving device 32 inputs an instruction signal from the CPU 30 and turns on the first light emitting device 24 to the fourth light emitting device 41.
- the infrared sensor driving device 32 drives the first light receiving device 25 to the fourth light receiving device 42 and inputs the light intensity at each wavelength output from the first light receiving device 25 to the fourth light receiving device 42.
- the infrared sensor driving device 32 outputs light intensity data including the measured spectrum to the CPU 30.
- the input device 6 includes an interface for inputting various setting information from an external device in addition to a plurality of switches.
- the biological measuring device 1 can input data and the like used when extracting biological components from an external device via the input device 6.
- the memory 31 is a concept including a semiconductor memory such as a RAM and a ROM, and an external storage device such as an external hard disk and a CD-ROM. Functionally, a storage area for storing program software 43 in which a control procedure of operation in the biological measurement apparatus 1 is described is set. Further, a storage area for storing light intensity data 44 that is spectrum data output from the first infrared sensor 11 to the fourth infrared sensor 17 is also set. In addition, the pressing force data 45 that is data of the pressing force between the first infrared sensor 11 to the fourth infrared sensor 17 and the arm 4 detected by the first force sensor 12 to the fourth force sensor 18. A storage area for storing is set.
- a storage area for storing force determination data 46 that is data when the CPU 30 determines the pressing force using the pressing force data 45 is set.
- a storage area for storing correction table data 47 that is data used when the CPU 30 corrects the light intensity data 44 using the pressing force data 45 is set.
- the correction table data 47 is data indicating the relationship between the correction amount of the light intensity data 44 and the pressing force with which the arm 4 presses the first infrared sensor 11 to the fourth infrared sensor 17.
- a storage area for storing data used when the CPU 30 calculates a blood component concentration and biological component data 48 that is measured component concentration data is set.
- a storage area that functions as a work area for the CPU 30, a temporary file, and the like, and other various storage areas are set.
- the CPU 30 performs control for detecting blood components using data output from the first infrared sensor 11 to the fourth infrared sensor 17 in accordance with the program software 43 stored in the memory 31.
- the CPU 30 includes an infrared sensor control unit 49 that instructs the infrared sensor driving device 32 to drive the first infrared sensor 11 to the fourth infrared sensor 17.
- the first force sensor 12 to the fourth force sensor 18 have a force sensor control unit 50 that gives an instruction to detect the pressing force between the first infrared sensor 11 to the fourth infrared sensor 17 and the arm 4.
- a component concentration calculation unit 51 is provided that calculates the blood component concentration using the light intensity data 44 detected by the first infrared sensor 11 to the fourth infrared sensor 17.
- the CPU 30 has a correction calculation unit 52 as a correction unit that performs calculation for correcting the light intensity data 44 using the pressing force data 45. Furthermore, the CPU 30 includes an average value calculation unit 53 that calculates the average value of the biological component data 48 and the blood component concentration. Further, the CPU 30 includes a pressing force determination unit 54 as a determination unit that determines whether to use the light intensity data 44 using the pressing force data 45 and the force determination data 46.
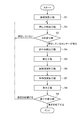
- FIG. 4 is a flowchart of the biological measurement method
- FIGS. 5 to 7 are diagrams for explaining the biological measurement method.
- step S ⁇ b> 1 corresponds to an apparatus installation process, and is a process of installing the biological measurement apparatus 1 on the arm 4.
- the biological measurement apparatus 1 is installed so that the first detection unit 7 to the fourth detection unit 10 press the arm 4.
- the holding unit 22 brings the first infrared sensor 11 to the fourth infrared sensor 17 into contact with the arm 4.
- step S2 corresponds to a pressing force detection step.
- the first force sensor 12 to the fourth force sensor 18 detect a pressing force that is a force pressed between the first infrared sensor 11 to the fourth infrared sensor 17 and the arm 4. .
- the process proceeds to step S3.
- Step S3 corresponds to a force determination step, and is a step of determining whether or not the detected pressing force is within the determination value.
- the process proceeds to step S4.
- the process proceeds to step S2.
- Step S4 corresponds to an infrared light detection step.
- the infrared sensor driving device 32 drives the infrared sensor that presses against the arm 4 among the first infrared sensor 11 to the fourth infrared sensor 17.
- the driven infrared sensor irradiates the arm 4 with infrared light 26.
- the first infrared sensor 11 to the fourth infrared sensor 17 receive the infrared light 26 reflected by the arm 4 and output light intensity data 44 that is a spectrum of the reflected light.
- step S5 corresponds to a correction process.
- This step is a step of correcting the light intensity data 44 using the pressing force data 45 and the correction table data 47.
- the process proceeds to step S6.
- Step S6 corresponds to a blood glucose level calculation step. This step is a step of calculating a blood glucose level from the corrected light intensity data 44.
- the process proceeds to step S7.
- Step S7 corresponds to an average value calculation process. This step is a step of calculating an average value of the blood glucose level.
- Step S8 corresponds to a display process. This step is a step of displaying the average value of the calculated blood glucose level on the display device 5.
- step S9 corresponds to an end determination step and is a step of determining whether to end or continue the measurement. When the measurement is continued, the process proceeds to step S2. When the measurement is finished, the process of measuring the living body is finished.
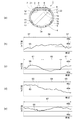
- FIG. 5A is a diagram corresponding to the apparatus installation process of step S1.
- the operator wears the biometric device 1 on the arm 4.
- an operator operates the adjustment part 3a and adjusts the length of the belt part 3.
- the operator presses the first detection unit 7 to the fourth detection unit 10 against the arm 4 to bring them into close contact with each other.
- the first infrared sensor 11 to the fourth infrared sensor 17 are brought into contact with the arm 4 by the holding unit 22.
- the operator adjusts the length of the belt portion 3 so that the blood flow in the blood vessel of the arm 4 flows smoothly without the belt portion 3 tightening the arm 4.
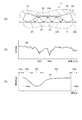
- 5 (b) to 5 (e) are diagrams corresponding to the pressing force detection process in step S2 and the force determination process in step S3.
- the vertical axis indicates the pressing force detected by the force sensor, and the upper side in the figure is a larger force than the lower side.
- the horizontal axis shows the passage of time, and the time changes from left to right in the figure.
- the force sensor control unit 50 outputs an instruction to detect the pressing force to the first force sensor 12 to the fourth force sensor 18.
- the first force sensor 12 to the fourth force sensor 18 store the pressing force received from the arm 4 in the memory 31 as the pressing force data 45.
- a first force transition line 55 shown in FIG. 5B indicates the transition of the pressing force detected by the first force sensor 12.
- force judgment data 46 is stored.
- the force determination data 46 includes a lower determination value 46a and an upper determination value 46b.
- the pressing force determination unit 54 compares the pressing force with the lower determination value 46a. When the pressing force is smaller than the lower determination value 46a, it is determined that the pressing force is insufficient. Further, the pressing force determination unit 54 compares the pressing force with the upper determination value 46b. When the pressing force is larger than the upper determination value 46b, it is determined that the pressing force is excessive.
- the pressing force determination unit 54 determines that the pressing force is appropriate.
- a time when the pressing force is appropriate in the first force transition line 55 is defined as a first appropriate section 56.
- the first inappropriate section 57 is set.
- the second force transition line 58 shown in FIG. 5 (c) shows the transition of the pressing force detected by the second force sensor 14.
- the pressing force determination unit 54 compares the pressing force with the lower determination value 46a and the upper determination value 46b.
- a time when the pressing force is appropriate in the second force transition line 58 is defined as a second appropriate section 61.
- the second inappropriate section 62 is set.
- the third force transition line 63 shown in FIG. 5 (d) indicates the transition of the pressing force detected by the third force sensor 16.
- the pressing force determination unit 54 compares the pressing force with the lower determination value 46a and the upper determination value 46b.
- a time when the pressing force is appropriate in the third force transition line 63 is defined as a third appropriate section 64.
- the third inappropriate section 65 is set.
- the fourth force transition line 66 shown in FIG. 5 (e) indicates the transition of the pressing force detected by the fourth force sensor 18.
- the pressing force determination unit 54 compares the pressing force with the lower determination value 46a and the upper determination value 46b. A time when the pressing force is appropriate in the fourth force transition line 66 is defined as a fourth appropriate section 67. Then, when the pressing force is insufficient or excessive in the fourth force transition line 66, the fourth inappropriate section is set. In the figure, the fourth force transition line 66 is not displayed because there is no section corresponding to the fourth inappropriate section.
- the display device 5 may indicate that the detection unit is “detection failure”. Furthermore, a sound may be emitted from the buzzer to prompt the operator to make adjustments.
- step S2 and step S3 are repeated.
- step S3 the process proceeds to step S4.
- step S 4 the infrared sensor control unit 49 outputs an instruction signal for driving the first infrared sensor 11 to the fourth infrared sensor 17 to the infrared sensor driving device 32.
- the infrared sensor control unit 49 drives an infrared sensor corresponding to a force sensor whose detected pressure is appropriate. That is, when the pressing force detected by the first force sensor 12 is appropriate, the first infrared sensor 11 is driven, and when the pressing force detected by the second force sensor 14 is appropriate, the second infrared sensor 13 is driven. To do.
- the third infrared sensor 15 is driven, and when the pressing force detected by the fourth force sensor 18 is appropriate, the fourth infrared sensor 17 is driven. That is, the corresponding infrared sensor is driven only when each force sensor is in an appropriate section.
- the infrared sensor driving device 32 turns on the first light emitting device 24, and the first light emitting device 24 irradiates the prism 23 with the infrared light 26.
- the infrared light 26 is repeatedly reflected between the surface of the arm 4 in close contact with the first surface 23 a and the second surface 23 b and travels to the first light receiving device 25.
- the infrared light 26 irradiates the surface of the arm 4 on the first surface 23a. Infrared light 26 having some wavelengths is absorbed by blood in the capillaries of the arm 4.
- the first light receiving device 25 detects the light intensity for each wavelength.
- the spectrum of the infrared light 26 is output as shown in FIG.
- the vertical axis indicates the light intensity, and the upper side in the figure is stronger than the lower side.
- the horizontal axis indicates the wavelength, and the right side in the figure is longer than the left side.
- a light intensity distribution line 68 indicates the light intensity of the infrared light 26 at each wavelength. In the light intensity distribution line 68, the light intensity is small at the places where the wavelengths are 920 nm and 988 nm. At this wavelength, infrared light 26 is absorbed by blood in the capillaries. And the infrared light 26 is absorbed, so that the glucose level in blood is high.
- the second infrared sensor 13 is driven and the spectrum of the infrared light 26 is output.
- the third infrared sensor 15 is driven and the spectrum of the infrared light 26 is output.
- the fourth appropriate section 67 the fourth infrared sensor 17 is driven and the spectrum of the infrared light 26 is output.
- FIG. 6C is a diagram corresponding to the correction process in step S5.
- the correction calculation unit 52 corrects the light intensity distribution line 68.
- the memory 31 stores correction table data 47.
- a correction curve 69 shown in FIG. 6C is a curve showing a table of the correction table data 47.
- the correction table data 47 shows the relationship between the pressing force detected by the first force sensor 12 to the fourth force sensor 18 and the correction amount for correcting the spectrum detected by the first infrared sensor 11 to the fourth infrared sensor 17. Yes.
- the correction curve 69 is a curve set based on the relationship between the pressing force and the light intensity detected by the first infrared sensor 11.
- the vertical axis in the figure represents the correction coefficient, and the upper side in the figure is larger than the lower side.
- the horizontal axis indicates the pressing force, and the pressing force on the right side in the figure is larger than that on the left side. The larger the correction coefficient, the larger the correction amount.
- the correction curve 69 will be described by dividing it into a first section 70a, a second section 70b, a third section 70c, a fourth section 70d, and a fifth section 70e.
- the first section 70a is a section where the pressing force is smaller than the lower determination value 46a, and the contact between the first surface 23a of the prism 23 and the arm 4 is unstable. Therefore, since the infrared light detection process of step S4 is not performed, the correction curve 69 is not set.
- the first infrared sensor 11 can detect the absorption of the infrared light 26 by the blood of the capillary blood vessels, but the pressing force with which the first infrared sensor 11 and the arm 4 are pressed is applied.
- the second section 70b is a section in which the absorption of the infrared light 26 by the blood of the capillary blood vessels increases as the pressing force increases. In this section, the correction coefficient is increased as the pressing force decreases.
- the third section 70c is a section in which the pressing force is appropriate and the first infrared sensor 11 can appropriately detect the absorption of the infrared light 26 by the blood of the capillary blood vessels. In this section, the correction of the light intensity distribution line 68 is reduced.
- the fourth section 70d is a section in which the first infrared sensor 11 can detect the absorption of the infrared light 26 by the blood of the capillary blood vessels, but the blood is reduced by pressing the capillary blood vessels. As the first infrared sensor 11 is pressed against the arm 4, blood is reduced and absorption of the infrared light 26 is reduced. Accordingly, in this section, the correction coefficient is increased as the pressing force increases.
- the correction curve 69 is not set.
- step S5 the correction calculation unit 52 calculates a correction coefficient from the pressing force and the correction curve 69 and integrates the correction coefficient on the light intensity distribution line 68.
- the correction calculation unit 52 corrects the light intensity distribution line 68 using the pressing force and the correction curve 69. Therefore, the light intensity distribution line 68 with high accuracy can be obtained even when the pressing force varies.
- the correction calculation unit 52 similarly calculates a correction coefficient from the pressing force and the correction curve 69 and integrates it to the light intensity distribution line. .
- the component concentration calculation unit 51 calculates the blood glucose level using the value obtained by correcting the light intensity distribution line 68.
- a light intensity versus blood sugar level correlation table showing the relationship between light intensity and blood sugar level at a predetermined wavelength is stored in the biological component data 48.
- the component concentration calculation unit 51 calculates the blood glucose level using the light intensity versus blood glucose level correlation table and the light intensity distribution line 68.
- the blood glucose level at this time indicates the amount of glucose in the blood.
- the blood glucose level may be calculated with higher accuracy by applying a PLS regression analysis method (Partial Last Squares Regression).
- the calculation result of the blood glucose level is stored in the memory 31 as the biological component data 48. Then, after the measurement is completed, blood glucose level data can be transmitted from the biological measurement apparatus 1 to an external device such as a personal computer. Therefore, the transition of blood glucose level can be analyzed by a program installed in the personal computer.
- FIG. 7 (a) and 7 (b) are diagrams corresponding to the average value calculation step in step S7.
- shaft shows the measured blood glucose level, and the blood glucose level is higher in the upper side than the lower side in the figure.
- the horizontal axis shows the transition of measurement time, and the time in the figure changes from the left side to the right side.
- the plots marked with ⁇ show examples of blood glucose levels calculated using the spectrum detected by the first infrared sensor 11.
- the plots marked with ⁇ show examples of blood glucose levels measured using the spectrum detected by the second infrared sensor 13.
- the plots marked with ⁇ show examples of blood glucose levels measured using the spectrum detected by the third infrared sensor 15.
- the plot of ⁇ mark shows an example of the measured value of the blood glucose level calculated using the spectrum detected by the fourth infrared sensor 17.
- the average value calculation unit 53 performs simple average calculation using only the blood glucose level data when measurement is possible, without using the data when measurement is not possible.
- the average of the four measured values is calculated. For example, when the first infrared sensor 11 and the fourth infrared sensor 17 detect the spectrum and the second infrared sensor 13 and the third infrared sensor 15 are not driven, the average of the two measured values is calculated. Then, the average value calculation unit 53 calculates a blood sugar level transition line 71.
- FIG. 7B is a histogram showing the distribution of blood glucose levels.
- the vertical axis is frequency.
- the horizontal axis indicates the blood sugar level, and the right side in the figure is higher than the left side.
- the blood glucose level data is a blood glucose level measured using the spectrum detected by the first infrared sensor 11 to the fourth infrared sensor 17.
- the average value calculator 53 calculates a simple moving average.
- the number of data is not particularly limited, but in the present embodiment, for example, the maximum number of data is 50. When the number of data is less than the maximum number of data, the average value of the measured data is calculated. When the number of data is 50 or more, an average value 72 of 50 data whose measured time is close to the current time is calculated. Therefore, the average value 72 is updated when new data is measured.
- FIG. 7C is a diagram corresponding to the display process in step S8. As shown in FIG. 7C, the measurement result is displayed on the display device 5 in step S8. The display device 5 displays a calculated blood glucose level plot and a blood glucose level transition line 71. Further, an average value close to the current time is displayed.
- step S9 it is determined whether the operator continues or ends the blood glucose level measurement.
- the input device 6 is pressed to instruct to end.
- CPU30 stops the program which inputs and measures the signal of the input device 6.
- FIG. The biological measurement process is completed through the above steps.
- the first force sensor 12 to the fourth force sensor 18 detect the pressing force between the first infrared sensor 11 to the fourth infrared sensor 17 and the arm 4. Then, the pressing force determination unit 54 compares the force with the lower determination value 46a and the upper determination value 46b to determine whether or not the force is within a predetermined range.
- the infrared sensor 11 to the fourth infrared sensor 17 When the first infrared sensor 11 to the fourth infrared sensor 17 are separated from the arm 4, the infrared light 26 is not absorbed by the arm 4. Accordingly, the first infrared sensor 11 to the fourth infrared sensor 17 cannot receive the infrared light 26 reflecting the blood glucose level information with high accuracy. Further, when the first infrared sensor 11 to the fourth infrared sensor 17 press the arm 4 too much, the blood vessels in the arm 4 are pressed and blood flow near the surface is inhibited. As a result, the arm 4 becomes unsuitable for measurement, and the light intensity data received by the first infrared sensor 11 to the fourth infrared sensor 17 is data that does not correctly reflect the blood state of the arm 4.
- the pressing force determination unit 54 determines a state in which each of the first infrared sensor 11 to the fourth infrared sensor 17 presses the arm 4.
- the component concentration calculation unit 51 utilizes the light intensity data to Calculate the value.
- the component concentration calculation unit 51 does not use the light intensity data. Therefore, the biological measurement apparatus 1 uses only the light intensity data when the blood state of the arm 4 is reflected among the light intensity data output from the first infrared sensor 11 to the fourth infrared sensor 17. The blood glucose level can be accurately measured.
- the living body measuring apparatus 1 is provided with the first infrared sensor 11 to the fourth infrared sensor 17, and each infrared sensor outputs light intensity data. Since the average value calculation unit 53 calculates the average of the light intensity data output from the first infrared sensor 11 to the fourth infrared sensor 17, the influence of disturbance is suppressed and a highly reliable blood glucose level is measured. be able to.
- the pressing force determination unit 54 determines the state in which the first infrared sensor 11 to the fourth infrared sensor 17 press the arm 4.
- the infrared sensor control part 49 drives the infrared sensor in which the force which presses a biological body exists in a predetermined range. Therefore, the infrared sensor control unit 49 drives only the infrared sensor that can output appropriate light intensity data. Therefore, the living body measurement apparatus 1 can accurately measure the concentration of the living body component by using only the light intensity data that reflects the state of the living body among the light intensity data output from the plurality of infrared sensors. . Furthermore, since the power for driving the infrared sensor is not wasted, the infrared sensor can be driven with resource saving.
- the force sensor 74 has a sensor main body 74b, and a pressing protrusion 74a is provided on the arm 4 side of the sensor main body 74b.
- a piezoelectric element is built in the sensor main body 74b, and the piezoelectric element is sandwiched between the sensor main body 74b and the pressing protrusion 74a.
- a protrusion tip 74c as an elastic body is provided on the arm 4 side of the pressing protrusion 74a. The pressing force with which the arm 4 presses the force sensor 74 presses the force sensor 74 via the protrusion tip 74c.
- the material of the projection tip 74c is an elastic body and has elasticity.
- the material of the projection tip 74c is not particularly limited as long as it is an elastic body. Silicon rubber, synthetic rubber, natural rubber, and other metal coil springs can be used. In the present embodiment, for example, silicon rubber is adopted as the material of the protrusion tip 74c.
- the protrusion tip portion 74c has an elastic body. Therefore, it is possible to prevent the arm 4 from being sensitive to the touch that the protrusion tip 74c touches.
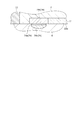
- FIG. 9A is a main part schematic enlarged view showing the structure of the main body.
- FIG. 9B is a schematic enlarged view of an essential part showing the structure of the belt part.
- FIG. 10A to FIG. 10C are schematic diagrams for explaining the biological measurement method. This embodiment is different from the first embodiment in that a plurality of force sensors are installed in the detection unit. Note that description of the same points as in the first embodiment is omitted.
- the living body measuring device 78 includes a main body portion 79, and the first detection portion 80 and the second detection portion 81 are installed on the arm 4 side of the main body portion 79. ing.
- the first detection unit 80 the first force sensor 12 and the first auxiliary force sensor 82 as a contact force sensor unit are arranged along with the first infrared sensor 11.
- the first force sensor 12 and the first auxiliary force sensor 82 are arranged apart from each other in the longitudinal direction of the first infrared sensor 11.
- the second detection unit 81 the second force sensor 14 and the second auxiliary force sensor 83 as a contact force sensor unit are arranged along with the second infrared sensor 13.
- the second force sensor 14 and the second auxiliary force sensor 83 are arranged apart from each other in the longitudinal direction of the second infrared sensor 13.
- the pressing force detected by the first force sensor 12 and the first auxiliary force sensor 82 decreases.
- the pressing force detected by one of the first force sensor 12 and the first auxiliary force sensor 82 is reduced.
- the first infrared sensor 11 may be separated from the arm 4. Therefore, it is possible to reliably detect whether or not the first infrared sensor 11 is in contact with the arm 4 using the outputs of the first force sensor 12 and the first auxiliary force sensor 82.
- the second detection unit 81 has the same structure as the first detection unit 80. Therefore, it is possible to reliably detect whether the second infrared sensor 13 is in contact with the arm 4 using the outputs of the second force sensor 14 and the second auxiliary force sensor 83.
- the third detection unit 84 and the fourth detection unit 85 are installed on the arm 4 side of the belt unit 3.
- the third force sensor 16 and the third auxiliary force sensor 86 as a contact force sensor unit are arranged along with the third infrared sensor 15.
- the third force sensor 16 and the third auxiliary force sensor 86 are arranged apart from each other in the longitudinal direction of the third infrared sensor 15.
- the fourth force sensor 18 and the fourth auxiliary force sensor 87 as the contact force sensor unit are arranged along with the fourth infrared sensor 17.
- the fourth force sensor 18 and the fourth auxiliary force sensor 87 are arranged apart from each other in the longitudinal direction of the fourth infrared sensor 17.
- the third detection unit 84 and the fourth detection unit 85 have the same structure as the first detection unit 80. Therefore, it is possible to reliably detect whether the third infrared sensor 15 is in contact with the arm 4 using the outputs of the third force sensor 16 and the third auxiliary force sensor 86. Furthermore, it is possible to reliably detect whether the fourth infrared sensor 17 is in contact with the arm 4 using the outputs of the fourth force sensor 18 and the fourth auxiliary force sensor 87.
- FIG. 10A and FIG. 10B are diagrams corresponding to the pressing force detection process in step S2 and the force determination process in step S3.
- the vertical axis indicates the pressing force detected by the first force sensor 12, and the upper side in the figure is a larger force than the lower side.
- the horizontal axis shows the passage of time, and the time changes from left to right in the figure.
- the first main force transition line 88 shows an example of the transition of the pressing force detected by the first force sensor 12.
- the pressing force determination unit 54 compares the pressing force detected by the first force sensor 12 with the lower determination value 46a. Further, the pressing force determination unit 54 compares the pressing force detected by the first force sensor 12 with the upper determination value 46b. When the pressing force is appropriate on the first main force transition line 88, the first main appropriate section 89 is set. When the pressing force is insufficient or excessive in the first main force transition line 88, the first main inappropriate section 90 is set.
- the vertical axis indicates the pressing force detected by the first auxiliary force sensor 82
- the upper side in the figure is a larger force than the lower side.
- the horizontal axis is the same as that in FIG.
- the first sub force transition line 91 shows an example of the transition of the pressing force detected by the first sub force sensor 82.
- the pressing force determination unit 54 compares the pressing force detected by the first auxiliary force sensor 82 with the lower determination value 46a. Further, the pressing force determination unit 54 compares the pressing force detected by the first auxiliary force sensor 82 with the upper determination value 46b.
- a time when the pressing force is appropriate in the first auxiliary force transition line 91 is defined as a first auxiliary appropriate section 92.
- the first auxiliary improper section 93 is set.
- FIG. 10C is a diagram corresponding to the force determination process in step S3 and the correction process in step S5.
- shaft shows pressing force and the upper side is a bigger force than the lower side in the figure.
- the horizontal axis shows the passage of time, and the time changes from left to right in the figure.
- the pressing force determination unit 54 calculates a section that is the first main proper section 89 and the first sub proper section 92 to be the first proper section 56.
- a section other than the first appropriate section 56 is defined as a first inappropriate section 57.
- the pressing force detected by the first force sensor 12 and the pressing force detected by the first auxiliary force sensor 82 are both lower determination value 46a and lower determination value 46b, the pressing force is appropriate. judge.
- the first sub proper section 92 is included in the first main proper section 89, so the first proper section 56 is the first sub proper section 92. It becomes the same section.
- step S ⁇ b> 5 the average value calculation unit 53 calculates a pressing force average value that is an average value of the pressing force detected by the first force sensor 12 and the pressing force detected by the first auxiliary force sensor 82.
- the pressing force average value transition line 94 is a transition line obtained by calculating the average of the first main force transition line 88 and the first auxiliary force transition line 91.
- the light intensity distribution line 68 is corrected using the pressing force average value transition line 94 and the correction curve 69. That is, the average value of the pressing force detected by the first force sensor 12 and the pressing force detected by the first auxiliary force sensor 82 is applied to the pressing force pressed by the first infrared sensor 11 from the arm 4. Thereby, the pressing force with which the first infrared sensor 11 is pressed from the arm 4 can be accurately detected.
- the second detection unit 81, the third detection unit 84, and the fourth detection unit 85 have the same structure as the first detection unit 80.
- the pressing force determination unit 54 uses the second detection unit 81, the third detection unit 84, and the fourth detection unit 85 in the same manner as the method of calculating the first appropriate interval 56 and the first inappropriate interval 57. Calculate the appropriate interval and the inappropriate interval.
- step S5 the average value calculation unit 53 calculates the pressing force average value transition lines of the second detection unit 81, the third detection unit 84, and the fourth detection unit 85 in the same manner as the method of calculating the pressing force average value transition line 94. Calculate. Then, the light intensity distribution line 68 is corrected using the calculated pressing force average value transition line and the correction curve 69. Subsequent steps are the same as those in the first embodiment, and a description thereof will be omitted.
- FIG. 11A are schematic views showing the arrangement of the detection units.
- a first detection unit 80 and a second detection unit 81 are arranged in the body unit 79 of the biological measurement device 78 in a direction orthogonal to the longitudinal direction of the arm 4.
- the first force sensor 12 and the first auxiliary force sensor 82 are arranged side by side in a direction orthogonal to the longitudinal direction of the arm 4.
- the second force sensor 14 and the second auxiliary force sensor 83 are arranged side by side in a direction orthogonal to the longitudinal direction of the arm 4. In this form, it is possible to detect a state in which the second detection unit 81 is inclined with the longitudinal direction of the arm 4 as the rotation axis.
- the belt unit 3 of the living body measuring device 78 is provided with the third detection unit 84 and the fourth detection unit 85 arranged in a direction orthogonal to the longitudinal direction of the arm 4.
- the third detector 84 the third force sensor 16 and the third auxiliary force sensor 86 are arranged side by side in a direction orthogonal to the longitudinal direction of the arm 4. In this form, it is possible to detect a state in which the third detector 84 is inclined with the longitudinal direction of the arm 4 as the rotation axis.
- the fourth detection unit 85 the fourth force sensor 18 and the fourth auxiliary force sensor 87 are arranged side by side in a direction orthogonal to the longitudinal direction of the arm 4. In this embodiment, it is possible to detect a state in which the fourth detection unit 85 is inclined with the longitudinal direction of the arm 4 as the rotation axis.
- the first detection unit 80 and the second detection unit 81 are installed along the longitudinal direction of the arm 4 with the control unit 21 interposed therebetween.
- the first detector 80 the first force sensor 12 and the first auxiliary force sensor 82 are arranged side by side in the longitudinal direction of the arm 4. In this embodiment, it is possible to detect a state in which the first detection unit 80 is inclined with the direction orthogonal to the longitudinal direction of the arm 4 as the rotation axis.
- the second force sensor 14 and the second auxiliary force sensor 83 are arranged side by side in the longitudinal direction of the arm 4. In this form, it is possible to detect a state in which the second detection unit 81 is inclined with the direction orthogonal to the longitudinal direction of the arm 4 as the rotation axis.
- the belt unit 3 of the biological measuring device 95 is provided with a third detection unit 84 and a fourth detection unit 85 on the upper side of the adjustment unit 3a in the figure.
- the 5th detection part 97 as a detection part and the 6th detection part 98 as a detection part are installed in the lower side of the adjustment part 3a in the figure.
- the third detection unit 84 and the fourth detection unit 85 are installed along the longitudinal direction of the arm 4.
- the third force sensor 16 and the third auxiliary force sensor 86 are arranged side by side in the longitudinal direction of the arm 4. In this embodiment, it is possible to detect a state in which the third detector 84 is inclined with the direction orthogonal to the longitudinal direction of the arm 4 as the rotation axis.
- the fourth detection unit 85 the fourth force sensor 18 and the fourth auxiliary force sensor 87 are arranged side by side in the longitudinal direction of the arm 4. In this embodiment, it is possible to detect a state in which the fourth detector 85 is inclined with the direction orthogonal to the longitudinal direction of the arm 4 as the rotation axis.
- the fifth detection unit 97 and the sixth detection unit 98 are installed along the longitudinal direction of the arm 4.
- the fifth detection unit 97 is provided with a fifth infrared sensor 99 as an infrared sensor unit, a fifth force sensor 100 as a contact force sensor unit, and a fifth auxiliary force sensor 101 as a contact force sensor unit.
- the fifth infrared sensor 99 is the same sensor as the first infrared sensor 11, and the fifth force sensor 100 and the fifth auxiliary force sensor 101 are the same sensors as the first force sensor 12.
- the fifth force sensor 100 and the fifth auxiliary force sensor 101 are arranged side by side in the longitudinal direction of the arm 4. In this embodiment, it is possible to detect a state in which the fifth detector 97 is inclined with the direction orthogonal to the longitudinal direction of the arm 4 as the rotation axis.
- a sixth infrared sensor 102 as an infrared sensor unit, a sixth force sensor 103 as a contact force sensor unit, and a sixth auxiliary force sensor 104 as a contact force sensor unit are installed in the sixth detection unit 98.
- the sixth infrared sensor 102 is the same sensor as the first infrared sensor 11, and the sixth force sensor 103 and the sixth auxiliary force sensor 104 are the same sensors as the first force sensor 12.
- the sixth force sensor 103 and the sixth auxiliary force sensor 104 are arranged side by side in the longitudinal direction of the arm 4. In this embodiment, it is possible to detect a state in which the sixth detection unit 98 is inclined with the direction orthogonal to the longitudinal direction of the arm 4 as the rotation axis.
- one of the first detection unit 80 and the second detection unit 81 can detect the blood glucose level.
- one of the third detection unit 84 and the fourth detection unit 85 can detect the blood glucose level.
- one of the fifth detection unit 97 and the sixth detection unit 98 can detect the blood glucose level. Even when the arm 4 is twisted, any one of the first detection unit 80 to the sixth detection unit 98 can detect the blood glucose level. Therefore, the living body measuring device 95 can increase the robustness.
- a first detection unit 80, a second detection unit 81, and a third detection unit 84 are installed in the main body unit 106 of the biological measurement apparatus 105.
- the first detection unit 80, the second detection unit 81, and the third detection unit 84 are arranged on concentric circles centering on the control unit 21.
- the angle formed by the first detection unit 80 and the second detection unit 81 with respect to the control unit 21 is 120 degrees, and the angle formed by the first detection unit 80 and the third detection unit 84 with the control unit 21 as the center. Is 120 degrees.
- the adjustment unit 3a in the living body measurement apparatus 105, is provided with a fourth detection unit 85 on the right side in the drawing.
- the belt unit 3 is provided with a fifth detection unit 97 on the upper side of the adjustment unit 3a in the drawing, and a sixth detection unit 98 on the lower side of the adjustment unit 3a in the drawing.
- the 5th detection part 97 and the 6th detection part 98 are located in the left side in the figure in the belt part 3.
- the fourth detector 85 the fourth force sensor 18 and the fourth auxiliary force sensor 87 are arranged in the longitudinal direction of the arm 4.
- the fifth detection unit 97 the fifth force sensor 100 and the fifth auxiliary force sensor 101 are arranged side by side in the longitudinal direction of the arm 4.
- the sixth detection unit 98 the sixth force sensor 103 and the sixth auxiliary force sensor 104 are arranged side by side in the longitudinal direction of the arm 4. In this embodiment, it is possible to detect a state in which the fourth detection unit 85, the fifth detection unit 97, and the sixth detection unit 98 are tilted with the direction orthogonal to the longitudinal direction of the arm 4 as the rotation axis.
- any one of the first detection unit 80 to the sixth detection unit 98 can detect the blood glucose level. Furthermore, even when the arm 4 is twisted, any one of the first detection unit 80 to the sixth detection unit 98 can detect the blood glucose level. Therefore, the living body measuring device 105 can increase the robustness.
- FIG. 13 is a time chart showing the drive timing of the infrared sensor. This embodiment is different from the first embodiment in that each detector sequentially performs measurement. Note that description of the same points as in the first embodiment is omitted.
- the vertical axis represents the first infrared sensor 11 to the fourth infrared sensor 17, and the horizontal axis represents the transition of time. The time in the figure changes from left to right.
- the arrow lines indicate the timing at which each sensor is driven.
- the first infrared sensor 11 to the fourth infrared sensor 17 are driven. At this time, first, the first infrared sensor 11 is driven.
- the second infrared sensor 13 is then driven.
- the third infrared sensor 15 is then driven.
- the fourth infrared sensor 17 is then driven.
- the first infrared sensor 11 is then driven. In this way, the first infrared sensor 11 to the fourth infrared sensor 17 are sequentially driven.
- ⁇ Calculation is performed using the detection result of the infrared sensor in parallel with the time during which one infrared sensor is driven. That is, step S4 and steps S5 to S8 are performed in parallel.
- this embodiment has the following effects.
- the infrared sensor is driven sequentially. Thereby, the peak value of the electric power to drive can be lowered
- the first light receiving device 25 has a function of performing spectroscopy.
- the first light emitting device 24 may irradiate infrared light 26 having a predetermined wavelength.
- the first light receiving device 25 may detect the light intensity without performing spectroscopy.
- the first light emitting device 24 may include a plurality of LEDs that emit different wavelengths. Then, the light emitting LED may be switched to switch the wavelength of the infrared light 26 to emit light. Further, the wavelength may be shifted using a diffraction grating.
- the infrared light 26 having a predetermined wavelength may be emitted using various methods.
- the intensity distribution of the infrared light 26 with respect to the wavelength of the first light emitting device 24 is not considered.
- the correction calculation unit 52 may correct the data of the light intensity distribution line 68 detected by the first infrared sensor 11 corresponding to the intensity distribution of the infrared light 26 with respect to the wavelength of the first light emitting device 24.
- the accuracy of the measurement value of the blood component can be improved.
- the first light receiving device 25 outputs the data of the light intensity distribution line 68.
- the first light receiving device 25 may detect only the light intensity of a predetermined wavelength. By reducing the types of wavelengths of the infrared light 26 to be detected, the first light receiving device 25 can output light intensity of a predetermined wavelength in a short time.
- control unit 21 is housed inside the main body 2.
- part or all of the control unit 21 may be stored in an electronic device separate from the main body 2.
- this electronic apparatus and the main-body part 2 may communicate by wire or radio
- the blood glucose level was measured.
- Other component concentrations may be measured by changing the wavelength of the infrared light 26 to be analyzed.
- a pulse wave or blood pressure may be measured by irradiating infrared light 26 to a plurality of places to detect a pulse wave of blood flow.
- the infrared sensor control unit 49 drives the first infrared sensor 11 only in the first appropriate section 56.
- the first infrared sensor 11 may be driven at all times. Then, only the light intensity data 44 in the first appropriate section 56 may be adopted. Control of the first infrared sensor 11 can be facilitated.
- Modification 7 In the first embodiment, the correction calculation unit 52 corrects the light intensity distribution line 68. When the influence of the correction is small, the correction may be omitted. Data of the program software 43 can be reduced. Note that the contents of Modifications 1 to 7 may be applied to the second to fourth embodiments.
- the first detection unit 80 to the sixth detection unit 98 include two force sensors.
- the number of force sensors provided in each detection unit may be three or more. Furthermore, it is possible to accurately detect the state in which the detection unit contacts the arm 4.
- the direction in which the force sensors in the detection units are aligned is aligned.
- the direction in which the force sensor is aligned may be changed for each detection unit. You may arrange
- 3rd infrared sensor as an infrared sensor part
- 16 ... 3rd force sensor as contact force sensor part
- 17 ... 4th infrared sensor as infrared sensor part
- 18 ... 4th force sensor as contact force sensor part
- 26 ... Infrared light
- 51 Component concentration calculation Part
- 53 ... average value calculating part
- 54 ...
- a pressing force determination unit as a fixed unit
- 83 ... a second sub force sensor as a contact force sensor unit
- 86 ...
- auxiliary force sensor 87 Fourth auxiliary force sensor as contact force sensor unit 97: Fifth detecting unit as detecting unit 98: Sixth detecting unit as detecting unit 99: Infrared sensor unit 5th infrared sensor, 100 ... 5th force sensor as contact force sensor part, 101 ... 5th secondary force sensor as contact force sensor part, 102 ... 6th infrared sensor as infrared sensor part, 103 ... contact 6th force sensor as a force sensor part, 104 ... 6th auxiliary force sensor as a contact force sensor part.
Landscapes
- Health & Medical Sciences (AREA)
- Life Sciences & Earth Sciences (AREA)
- Physics & Mathematics (AREA)
- Engineering & Computer Science (AREA)
- Surgery (AREA)
- Public Health (AREA)
- Pathology (AREA)
- Veterinary Medicine (AREA)
- Biomedical Technology (AREA)
- Heart & Thoracic Surgery (AREA)
- Medical Informatics (AREA)
- Molecular Biology (AREA)
- Biophysics (AREA)
- Animal Behavior & Ethology (AREA)
- General Health & Medical Sciences (AREA)
- Optics & Photonics (AREA)
- Cardiology (AREA)
- Physiology (AREA)
- Spectroscopy & Molecular Physics (AREA)
- Emergency Medicine (AREA)
- Artificial Intelligence (AREA)
- Computer Vision & Pattern Recognition (AREA)
- Psychiatry (AREA)
- Signal Processing (AREA)
- Measurement Of The Respiration, Hearing Ability, Form, And Blood Characteristics Of Living Organisms (AREA)
- Investigating Or Analysing Materials By Optical Means (AREA)
Abstract
精度良く生体の成分濃度を計測する生体計測装置を提供する。腕(4)に赤外光(26)を照射し腕(4)に反射した赤外光(26)を受信して光強度データを出力する第1赤外センサー(11)と、第1赤外センサー(11)と腕(4)との間の接触力を検出する第1力センサー(12)と、を備える第1検出部(7)と、第2赤外センサー(13)及び第2力センサー(14)を備える第2検出部(8)と、第1赤外センサー(11)及び第2赤外センサー(13)が腕(4)に接触するように第1検出部(7)及び第2検出部(8)を保持する保持部(22)と、力を判定値と比較し力が所定の範囲内にあるか否かを判定する押圧力判定部と、接触力が所定の範囲内にあると押圧力判定部が判定したときの光強度データを用いて腕(4)の血糖値を演算する成分濃度演算部と、を備える。
Description
本発明は、生体計測装置および生体計測方法に関するものである。
近赤外光や赤外光を用いて人体の血糖値、血圧脈拍を測定する方法が検討されている。例えば、ATR法(Attenuated Total Reflection)を用いた血糖値の測定装置が特許文献1に開示されている。それによると、片面に反射膜が設置されたガラス板を用意する。そして、ガラス板において反射膜のない面を生体の皮膚に密着させる。ガラス板の一方の側面から赤外光を照射する。赤外光は皮膚と密着する面と反射膜との間で反射を繰り返しガラス板の他方の側面に到達する。他方の側面に到達した赤外光の光強度をセンサーにて検出する。
検出した赤外光を分光してスペクトルデータを得る。生体の皮膚には毛細血管があり、皮膚に表面に照射する赤外光の一部が毛細血管に吸収される。特定の波長において吸収される赤外光と血液成分とには相関がある。従って、検出された特定の波長における光強度と被検査生体の血液成分濃度との間で相関がある。これによりATR法を用いて、例えば、血中グルコース濃度を検出することができる。
腕に巻くベルトに光センサーが設置された測定装置が特許文献2に開示されている。それによると、測定装置本体にベルトが設置されている。ベルトを人体の腕に巻いて測定装置を固定する。そして、ベルトの腕側の面に光センサーが設置されている。腕に巻くベルトの長さを調整し、光センサーを肌に密着させて測定装置が用いられる。
特許文献1に示すATR法ではセンサー部が生体の皮膚に密着していないとき、赤外光の一部が毛細血管に吸収されない。このときには光強度データが生体の状態を反映していないため、正確な血液成分濃度を検出することができない。特許文献2に示す計測装置ではベルトが緩むと光センサーと腕との間に隙間ができる。そして、光センサーが検出する光強度が変動する。そこで、検出された光強度データが生体の状態を反映しているときの光強度データだけを活用して精度良く生体の成分濃度を計測することができる生体計測装置が望まれていた。
本発明は、上述の課題を解決するためになされたものであり、以下の形態または適用例として実現することが可能である。
[適用例1]
本適用例にかかる生体計測装置であって、生体に赤外光を照射し前記生体で反射または散乱した前記赤外光を受信して光強度データを出力する赤外センサー部と、前記赤外センサー部と前記生体との間の接触力を検出する接触力センサー部と、を備える複数の検出部と、前記赤外センサー部が前記生体に接触するように前記検出部を保持する保持部と、前記接触力を判定値と比較し前記接触力が所定の範囲内にあるか否かを判定する判定部と、前記接触力が所定の範囲内にあると前記判定部が判定したときの前記光強度データを用いて前記生体の成分濃度を演算する成分濃度演算部と、を備えることを特徴とする。
本適用例にかかる生体計測装置であって、生体に赤外光を照射し前記生体で反射または散乱した前記赤外光を受信して光強度データを出力する赤外センサー部と、前記赤外センサー部と前記生体との間の接触力を検出する接触力センサー部と、を備える複数の検出部と、前記赤外センサー部が前記生体に接触するように前記検出部を保持する保持部と、前記接触力を判定値と比較し前記接触力が所定の範囲内にあるか否かを判定する判定部と、前記接触力が所定の範囲内にあると前記判定部が判定したときの前記光強度データを用いて前記生体の成分濃度を演算する成分濃度演算部と、を備えることを特徴とする。
本適用例によれば、生体計測装置は複数の検出部、保持部及び判定部を備えている。検出部は赤外センサー部及び接触力センサー部を備えている。保持部は赤外センサー部が生体に接触するように検出部を保持する。赤外センサー部は生体に赤外光を照射する。そして、赤外センサー部は生体で反射または散乱した赤外光を受信して光強度データを出力する。接触力センサー部は赤外センサー部と生体との間の接触力を検出する。そして、判定部が接触力を判定値と比較し接触力が所定の範囲内にあるか否かを判定する。
赤外センサー部が生体から離れるとき赤外光は生体に吸光されない。従って、赤外センサー部は生体情報を反映した赤外光を精度良く受信することができない。また、赤外センサー部が生体を押圧しすぎるとき生体の血管が押圧されて表面近くの血流が阻害される。これにより、生体が計測に相応しくない状態となるので赤外センサー部が受信する光強度データは生体の状態を正しく反映していないデータとなる。
判定部は赤外センサー部が生体を押圧する状態を判定している。そして、成分濃度演算部は赤外センサー部が出力する光強度データが生体の状態を反映しているときのデータを活用し、光強度データが生体の状態を反映していないときのデータを活用しないで生体の成分濃度を演算する。従って、生体計測装置は複数の赤外センサー部が出力する光強度データのうち生体の状態を反映しているときの光強度データだけを活用して精度良く生体の成分濃度を計測することができる。
[適用例2]
上記適用例にかかる生体計測装置において、複数の前記赤外センサー部が出力した前記光強度データから演算された前記成分濃度の平均値を演算する平均値演算部を備えることを特徴とする。
上記適用例にかかる生体計測装置において、複数の前記赤外センサー部が出力した前記光強度データから演算された前記成分濃度の平均値を演算する平均値演算部を備えることを特徴とする。
本適用例によれば、生体計測装置には複数の赤外センサー部が設置され、各赤外センサー部が光強度データを出力する。そして、平均値演算部が複数の赤外センサー部が出力する光強度データの平均を演算するので、外乱の影響を抑制して信頼性の高い成分濃度を計測することができる。
[適用例3]
上記適用例にかかる生体計測装置において、複数の前記赤外センサー部は順次駆動されることを特徴とする。
上記適用例にかかる生体計測装置において、複数の前記赤外センサー部は順次駆動されることを特徴とする。
本適用例によれば、赤外センサー部は順次駆動される。これにより、複数の赤外センサー部を同時に駆動するときに比べて、駆動にて消費される電力のピーク値を下げることができる。従って、電力を供給する能力を低くすることができる為、電源の容量を小さくすることができる。
[適用例4]
上記適用例にかかる生体計測装置において、前記検出部は複数の前記接触力センサー部を備えることを特徴とする。
上記適用例にかかる生体計測装置において、前記検出部は複数の前記接触力センサー部を備えることを特徴とする。
本適用例によれば、検出部は赤外センサー部と複数の接触力センサー部とを備えている。そして、判定部は複数の接触力センサー部が出力する接触力を判定値と比較する。生体に対して赤外センサー部が傾くときには複数の接触力センサー部が腕から受ける接触力に差が生じる。これにより、赤外センサー部が生体に対して傾く状態も検出することができる。そして、赤外センサー部が生体に対して傾く状態で赤外センサー部が出力する光強度データは使用しない。従って、赤外センサー部が生体に対して傾かずに正しい姿勢となる状態のときに赤外センサー部が検出する反射光の光強度データを使用することができる。その結果、精度良く生体の情報を検出することができる。
[適用例5]
本適用例にかかる生体計測装置であって、生体に赤外光を照射し前記生体で反射または散乱した前記赤外光を受信して光強度データを出力する赤外センサー部と、前記赤外センサー部と前記生体との間の接触力を検出する接触力センサー部と、を備える複数の検出部と、前記赤外センサー部が前記生体に接触するように前記検出部を保持する保持部と、前記接触力を判定値と比較し前記接触力が所定の範囲内にあるか否かを判定する判定部と、前記接触力が所定の範囲内にあるときに前記赤外センサー部を駆動する制御を行う赤外センサー制御部と、前記光強度データを用いて前記生体の成分濃度を演算する成分濃度演算部と、を備えることを特徴とする。
本適用例にかかる生体計測装置であって、生体に赤外光を照射し前記生体で反射または散乱した前記赤外光を受信して光強度データを出力する赤外センサー部と、前記赤外センサー部と前記生体との間の接触力を検出する接触力センサー部と、を備える複数の検出部と、前記赤外センサー部が前記生体に接触するように前記検出部を保持する保持部と、前記接触力を判定値と比較し前記接触力が所定の範囲内にあるか否かを判定する判定部と、前記接触力が所定の範囲内にあるときに前記赤外センサー部を駆動する制御を行う赤外センサー制御部と、前記光強度データを用いて前記生体の成分濃度を演算する成分濃度演算部と、を備えることを特徴とする。
本適用例によれば、判定部は赤外センサー部が生体を押圧する状態を判定する。そして、赤外センサー制御部は赤外センサー部が生体を押圧する接触力が所定の範囲内にあるときに赤外センサー部を駆動する。従って、赤外センサー制御部は赤外センサー部が適切な光強度データを出力可能なときにのみ赤外センサー部を駆動する。従って、生体計測装置は複数の赤外センサー部が出力する光強度データのうち生体の状態を反映しているときの光強度データだけを活用して精度良く生体の成分濃度を計測することができる。さらに、赤外センサー部を駆動する電力を無駄にしないので省資源で赤外センサー部を駆動することができる。
[適用例6]
本適用例にかかる生体計測方法であって、複数の赤外センサー部を生体に押圧し、前記赤外センサー部と前記生体との間の接触力を検出し、前記接触力が所定の範囲内にある前記赤外センサー部を駆動し、前記赤外センサー部は前記生体に赤外光を照射し前記生体で反射または散乱した前記赤外光を受信して光強度データを出力し、前記光強度データから前記生体の成分濃度を演算することを特徴とする。
本適用例にかかる生体計測方法であって、複数の赤外センサー部を生体に押圧し、前記赤外センサー部と前記生体との間の接触力を検出し、前記接触力が所定の範囲内にある前記赤外センサー部を駆動し、前記赤外センサー部は前記生体に赤外光を照射し前記生体で反射または散乱した前記赤外光を受信して光強度データを出力し、前記光強度データから前記生体の成分濃度を演算することを特徴とする。
本適用例によれば、複数の赤外センサー部が生体に押圧される。そして、各赤外センサー部は生体に赤外光を照射し生体で反射または散乱した赤外光を受信して光強度データを出力する。そして、光強度データを用いて生体の成分濃度が演算される。各赤外センサー部と生体との間の接触力が検出され、接触力が所定の範囲内にあるときに赤外センサー部が駆動される。従って、赤外センサー部が精度良く光強度データを検出可能なときのみ赤外センサー部は赤外光の反射光の光強度データを検出する。その結果、生体から反射した赤外光の光強度を精度良く検出することができる。
本実施形態では、生体計測装置と、この生体計測装置を用いて非侵襲的に血糖値を測定する生体計測方法との特徴的な例について、図に従って説明する。以下、実施形態について図面に従って説明する。尚、各図面における各部材は、各図面上で認識可能な程度の大きさとするため、各部材毎に縮尺を異ならせて図示している。
(第1の実施形態)
第1の実施形態にかかわる生体計測装置について図1~図3に従って説明する。図1(a)は、生体計測装置の構成を示す概略斜視図であり、図1(b)は、生体計測装置の構成を示す模式正面図である。図1(c)は、生体計測装置の構成を示す模式側面図である。図2(a)は生体計測装置の本体部を示す要部模式拡大側面図である。
第1の実施形態にかかわる生体計測装置について図1~図3に従って説明する。図1(a)は、生体計測装置の構成を示す概略斜視図であり、図1(b)は、生体計測装置の構成を示す模式正面図である。図1(c)は、生体計測装置の構成を示す模式側面図である。図2(a)は生体計測装置の本体部を示す要部模式拡大側面図である。
図1及び図2(a)に示すように、生体計測装置1は保持部としての本体部2と本体部2に設置された保持部としてのベルト部3を備えている。本体部2とベルト部3により筒状の形態となっている。そして、筒状となっている場所に人体の生体としての腕4が挿入されている。つまり、生体計測装置1は腕時計のように腕4に設置して用いられる。
本体部2において腕4と反対側の面には表示装置5と入力装置6が設置されている。表示装置5は測定した血糖値等の情報を表示する部位である。表示装置5には液晶表示装置や有機EL(Electro Luminescence)装置等を用いることができる。入力装置6は複数のスイッチ等により構成され、操作者は入力装置6を操作することにより各種の設定を行うことが可能になっている。
本体部2において腕4を向く側の面には検出部としての第1検出部7及び検出部としての第2検出部8が設置されている。さらに、ベルト部3において腕4を向く側の面には検出部としての第3検出部9及び検出部としての第4検出部10が設置されている。第1検出部7には赤外センサー部としての第1赤外センサー11と接触力センサー部としての第1力センサー12が設置され、第2検出部8には赤外センサー部としての第2赤外センサー13と接触力センサー部としての第2力センサー14が設置されている。
第3検出部9には赤外センサー部としての第3赤外センサー15と接触力センサー部としての第3力センサー16が設置され、第4検出部10には赤外センサー部としての第4赤外センサー17と接触力センサー部としての第4力センサー18が設置されている。本体部2の内部には制御部21が設置されている。制御部21は表示装置5、入力装置6、第1検出部7~第4検出部10を制御する。他にも、本体部2には図示しない電池やブザーを備えている。
ベルト部3には調整部3aが設置されている。調整部3aはベルト部3の長さを調整可能になっている。操作者は生体計測装置1を腕4に装着した後で調整部3aを操作する。そして、第1検出部7~第4検出部10が腕4に接触するようにベルト部3の長さを操作者が調整する。ベルト部3は金属製であり複数の板ばねが連結した構造となっている。これによりベルト部3は伸縮する。本体部2及びベルト部3により保持部22が構成されている。第1赤外センサー11~第4赤外センサー17及び第1力センサー12~第4力センサー18は腕4に接触するように保持部22に保持されている。
図2(b)は、赤外センサーの構造を示す要部模式図である。図2(b)に示すように、第1赤外センサー11は板状のプリズム23を備えている。プリズム23は対向する一対の側面が斜面となっている。一方の斜面には第1発光装置24が設置され、他方の斜面には第1受光装置25が設置されている。プリズム23の材質は赤外光を透過する材料であればよく、例えば、ZnSe、Ge、Si等を用いることができる。
第1発光装置24はLED(Light Emitting Diode)等を備え、第1発光装置24はプリズム23の内部に向けて赤外光26を照射する。第1受光装置25は分光器及びフォトダイオードを備えている。第1受光装置25は赤外光26を所定の波長に分光し各波長の光強度を電気信号に変換する。分光器は回折格子、凹面鏡、スリットを組み合わせて構成されている。分光器は鏡を回転させて、所定の波長の光がスリットを通過するようにして分光する。スリットを通過した赤外光26はフォトダイオードにより電気信号に変換される。
プリズム23において腕4と接触する面を第1面23aとし、第1面23aと対向する面を第2面23bとする。第1面23aと第2面23bとは平行に配置されている。第2面23bには反射膜29が設置されている。反射膜29は銀等の反射率の高い金属を用いるのが好ましい。第1発光装置24が照射する赤外光26は第1面23aに向かって進行する。赤外光26は第1面23aにて腕4の表面を照射し、腕4の表面で反射する。反射した赤外光26は反射膜29に向かって進行し反射膜29にて反射する。このように赤外光26は第1面23aにおける腕4の表面と第2面23bとの間で反射を繰り返して第1受光装置25に向かって進行する。
赤外光26が第1面23aにて反射する毎に所定の波長の赤外光26の一部が腕4内の毛細血管に吸収される。これにより、赤外光26は所定の波長の光強度が低下する。第1受光装置25に到達した赤外光26は分光され電気信号に変換される。電気信号は光強度データに対応する信号である。つまり、第1赤外センサー11は腕4に赤外光26を照射し腕4に反射した赤外光26を受信して光強度データを出力する。そして、第2赤外センサー13~第4赤外センサー17は第1赤外センサー11と同様の構造となっており同様の機能を備えている。
保持部22において腕4を向く側の面を接触面22aとするとき接触面22aは第1面23aと略同一平面上に設置されている。従って、通常では第1面23aは腕4と接触するように保持部22が第1赤外センサー11~第4赤外センサー17を保持している。
図2(c)は、力センサーの構造を示す要部模式拡大図である。図2(c)に示すように、第1力センサー12はセンサー本体部12bと突起部としての押圧突起12aとを備えている。センサー本体部12bには圧電素子が内蔵されており、圧電素子はセンサー本体部12bと押圧突起12aとに挟まれた構造となっている。押圧突起12aがセンサー本体部12bに向けて押圧されるとき、圧電素子に力が加わる。そして、圧電素子は力の微分値に対応する電圧を発生して出力する。従って、圧電素子が出力する電圧を用いて第1力センサー12に加わる圧力を検出することができる。
第1赤外センサー11及び第1力センサー12は保持部22に保持され腕4と接触する。第1赤外センサー11と第1力センサー12とは近い場所に設置されているので、腕4が第1赤外センサー11に加える圧力と腕4が第1力センサー12に加える圧力とは略同じ圧力となっている。そして、第1力センサー12に加わる押圧力を検出することにより第1赤外センサー11に加わる押圧力を検出することができる。従って、第1力センサー12は第1赤外センサー11と腕4との間で押圧し合う力を検出することができる。
押圧突起12aは保持部22の接触面22aより腕4側に突出している。接触面22aはプリズム23の第1面23aと略同一の面である。従って、押圧突起12aは第1赤外センサー11より腕4側に突出する。これにより、第1赤外センサー11と腕4とが離れた状態のときにも押圧突起12aは腕4と接触することができる。従って、第1力センサー12は第1赤外センサー11と腕4とが接触しているか否かを確実に検出することができる。第2力センサー14~第4力センサー18は第1力センサー12と同様の構造であり同様の機能を備えている。
図3は生体計測装置の電気制御ブロック図である。図3に示すように、生体計測装置1の制御部21はプロセッサーとして各種の演算処理を行うCPU30(演算処理装置)と各種情報を記憶するメモリー31とを有する。
赤外センサー駆動装置32、第1力センサー12~第4力センサー18、表示装置5及び入力装置6が入出力インターフェイス33及びデータバス34を介してCPU30に接続されている。赤外センサー駆動装置32は第1赤外センサー11の第1発光装置24及び第1受光装置25を駆動する装置である。他にも、赤外センサー駆動装置32は第2赤外センサー13の第2発光装置35及び第2受光装置36を駆動する。他にも、赤外センサー駆動装置32は第3赤外センサー15の第3発光装置37及び第3受光装置38を駆動する。他にも、赤外センサー駆動装置32は第4赤外センサー17の第4発光装置41及び第4受光装置42を駆動する。
赤外センサー駆動装置32はCPU30から指示信号を入力して第1発光装置24~第4発光装置41を点灯する。そして、赤外センサー駆動装置32は第1受光装置25~第4受光装置42を駆動し第1受光装置25~第4受光装置42が出力する各波長における光強度を入力する。赤外センサー駆動装置32は測定したスペクトル等からなる光強度データをCPU30に出力する。
入力装置6には複数のスイッチの他に外部機器から各種の設定情報を入力するインターフェイスを備えている。そして、生体計測装置1は入力装置6を介して外部装置から生体成分を抽出するときに用いるデータ等を入力することができる。
メモリー31は、RAM、ROM等といった半導体メモリーや、外付けのハードディスク、CD-ROMといった外部記憶装置を含む概念である。機能的には、生体計測装置1における動作の制御手順が記述されたプログラムソフト43を記憶する記憶領域が設定される。さらに、第1赤外センサー11~第4赤外センサー17が出力するスペクトルのデータである光強度データ44を記憶するための記憶領域も設定される。他にも、第1力センサー12~第4力センサー18が検出する第1赤外センサー11~第4赤外センサー17と腕4との間で押圧し合う力のデータである押圧力データ45を記憶するための記憶領域が設定される。
他にも、押圧力データ45を用いてCPU30が押圧力を判定するときのデータである力判定データ46を記憶するための記憶領域が設定される。他にも、押圧力データ45を用いてCPU30が光強度データ44を補正するときに用いるデータである補正表データ47を記憶するための記憶領域が設定される。補正表データ47は腕4が第1赤外センサー11~第4赤外センサー17を押圧する押圧力に対する光強度データ44の補正量との関係を示すデータである。他にも、CPU30が血液の成分濃度を演算するときに用いるデータや計測した成分濃度データである生体成分データ48を記憶するための記憶領域が設定される。さらに、CPU30のためのワークエリアやテンポラリファイル等として機能する記憶領域やその他各種の記憶領域が設定される。
CPU30はメモリー31内に記憶されたプログラムソフト43に従って、第1赤外センサー11~第4赤外センサー17が出力するデータを用いて血液成分を検出するための制御を行うものである。具体的な機能実現部としてCPU30は赤外センサー駆動装置32に第1赤外センサー11~第4赤外センサー17を駆動させる指示を行う赤外センサー制御部49を有する。さらに、第1力センサー12~第4力センサー18に第1赤外センサー11~第4赤外センサー17と腕4との間の押圧力を検出させる指示を行う力センサー制御部50を有する。さらに、第1赤外センサー11~第4赤外センサー17が検出した光強度データ44を用いて血液成分濃度を演算する成分濃度演算部51を有する。
さらに、CPU30は押圧力データ45を用いて光強度データ44を補正する演算を行う補正部としての補正演算部52を有する。さらに、CPU30は生体成分データ48及び血液成分濃度の平均値を演算する平均値演算部53を有する。さらに、CPU30は押圧力データ45と力判定データ46とを用いて光強度データ44を利用するか否かを判断する判定部としての押圧力判定部54を有する。
次に、上述した生体計測装置1を用いて血液成分濃度を計測する生体計測方法について図4~図7にて説明する。図4は、生体計測方法のフローチャートであり、図5~図7は生体計測方法を説明するための図である。
図4のフローチャートにおいて、ステップS1は装置設置工程に相当し、腕4に生体計測装置1を設置する工程である。この工程では第1検出部7~第4検出部10が腕4を押圧するように生体計測装置1を設置する。これにより、保持部22が第1赤外センサー11~第4赤外センサー17を腕4に接触させる。次にステップS2に移行する。ステップS2は押圧力検出工程に相当する。この工程は、第1力センサー12~第4力センサー18が第1赤外センサー11~第4赤外センサー17と腕4との間で押圧し合う力である押圧力を検出する工程である。次にステップS3に移行する。ステップS3は力判定工程に相当し、検出した押圧力が判定値内にあるかを判定する工程である。押圧力の幾つかが判定値内にあり腕4と第1赤外センサー11~第4赤外センサー17のいずれかが腕4と互いに押圧していると判定するとき、ステップS4に移行する。総ての押圧力が判定値内になく腕4と第1赤外センサー11~第4赤外センサー17と腕4とが互いに押圧していないと判定するとき、ステップS2に移行する。
ステップS4は赤外光検出工程に相当する。この工程では赤外センサー駆動装置32が第1赤外センサー11~第4赤外センサー17のうち腕4と押圧し合う赤外センサーを駆動する。そして、駆動された赤外センサーが腕4に赤外光26を照射する。腕4に反射した赤外光26を第1赤外センサー11~第4赤外センサー17が受信して反射光のスペクトルである光強度データ44を出力する工程である。次にステップS5に移行する。ステップS5は補正工程に相当する。この工程は、押圧力データ45及び補正表データ47を用いて光強度データ44を補正する工程である。次にステップS6に移行する。ステップS6は血糖値演算工程に相当する。この工程は、補正した光強度データ44から血糖値を演算する工程である。次にステップS7に移行する。
ステップS7は平均値演算工程に相当する。この工程は、血糖値の平均値を演算する工程である。次にステップS8に移行する。ステップS8は表示工程に相当する。この工程は、演算した血糖値の平均値を表示装置5に表示する工程である。次にステップS9に移行する。ステップS9は終了判断工程に相当し、測定を終了するか継続するかを判断する工程である。計測を継続するときステップS2に移行する。計測を終了するときは生体を計測する工程を終了する。
次に、図5~図7を用いて、図4に示したステップと対応させて、生体計測方法を詳細に説明する。図5(a)はステップS1の装置設置工程に対応する図である。図5(a)に示すように、操作者は生体計測装置1を腕4に装着する。そして、操作者は調整部3aを操作してベルト部3の長さを調整する。そして、操作者は第1検出部7~第4検出部10を腕4に押圧させて密着させる。保持部22により第1赤外センサー11~第4赤外センサー17が腕4に接触される。このとき、ベルト部3が腕4を締め付けないようにして腕4の血管内の血流がよどみなく流動する程度に操作者はベルト部3の長さを調整する。
図5(b)~図5(e)はステップS2の押圧力検出工程及びステップS3の力判定工程に対応する図である。各図において縦軸は力センサーが検出した押圧力を示し、図中上側が下側より大きな力になっている。横軸は時間の経過を示し図中左から右へ時間が推移する。ステップS2では力センサー制御部50が第1力センサー12~第4力センサー18に押圧力を検出する指示を出力する。第1力センサー12~第4力センサー18は腕4から受ける押圧力を押圧力データ45としてメモリー31に記憶させる。図5(b)に示す第1力推移線55は第1力センサー12が検出した押圧力の推移を示している。
メモリー31には力判定データ46が記憶されている。力判定データ46は下側判定値46a及び上側判定値46bを含む。押圧力判定部54は押圧力と下側判定値46aとを比較する。そして、押圧力が下側判定値46aより小さいとき押圧力不足と判断する。さらに、押圧力判定部54は押圧力と上側判定値46bとを比較する。そして、押圧力が上側判定値46bより大きいとき押圧力過多と判断する。
押圧力が下側判定値46a以上であり上側判定値46b以下であるとき押圧力判定部54は押圧力が適正であると判断する。第1力推移線55において押圧力が適正なときを第1適正区間56とする。そして、第1力推移線55において押圧力が押圧力不足または押圧力過多のとき第1不適正区間57とする。
図5(c)に示す第2力推移線58は第2力センサー14が検出した押圧力の推移を示している。押圧力判定部54は押圧力を下側判定値46a及び上側判定値46bと比較する。第2力推移線58において押圧力が適正なときを第2適正区間61とする。そして、第2力推移線58において押圧力が押圧力不足または押圧力過多のとき第2不適正区間62とする。
図5(d)に示す第3力推移線63は第3力センサー16が検出した押圧力の推移を示している。押圧力判定部54は押圧力を下側判定値46a及び上側判定値46bと比較する。第3力推移線63において押圧力が適正なときを第3適正区間64とする。そして、第3力推移線63において押圧力が押圧力不足または押圧力過多のとき第3不適正区間65とする。
図5(e)に示す第4力推移線66は第4力センサー18が検出した押圧力の推移を示している。押圧力判定部54は押圧力を下側判定値46a及び上側判定値46bと比較する。第4力推移線66において押圧力が適正なときを第4適正区間67とする。そして、第4力推移線66において押圧力が押圧力不足または押圧力過多のとき第4不適正区間とする。図中第4力推移線66には第4不適正区間に該当する区間がないので表示されていない。
第1不適正区間57、第2不適正区間62、第3不適正区間65及び第4不適正区間では表示装置5に検出部が「検出不良」であること表示しても良い。さらに、ブザーから音を出して操作者に調整を促しても良い。
そして、第1力センサー12~第4力センサー18が検出した押圧力が総て不適正であるときにはステップS2とステップS3とを繰り返す。第1力センサー12~第4力センサー18が検出した押圧力の幾つかが適正であるときにはステップS4に移行する。
図6(a)及び図6(b)はステップS4の赤外光検出工程に対応する図である。ステップS4において赤外センサー制御部49は第1赤外センサー11~第4赤外センサー17を駆動する指示信号を赤外センサー駆動装置32に出力する。赤外センサー制御部49は検出した押圧力が適正である力センサーに対応する赤外センサーを駆動する。つまり、第1力センサー12が検出した押圧力が適正であるときには第1赤外センサー11を駆動し、第2力センサー14が検出した押圧力が適正であるときには第2赤外センサー13を駆動する。第3力センサー16が検出した押圧力が適正であるときには第3赤外センサー15を駆動し、第4力センサー18が検出した押圧力が適正であるときには第4赤外センサー17を駆動する。つまり、各力センサーが適正区間となっているときにのみ対応する赤外センサーを駆動する。
第1適正区間56では、図6(a)に示すように、赤外センサー駆動装置32は第1発光装置24を点灯し、第1発光装置24は赤外光26をプリズム23に照射する。プリズム23内では第1面23aに密着する腕4の表面と第2面23bとの間で赤外光26が反射を繰り返して第1受光装置25まで進行する。赤外光26は第1面23aにおいて腕4の表面を照射する。そして、一部の波長の赤外光26は腕4の毛細血管にて血液に吸収される。
第1受光装置25では波長毎の光強度を検出する。その結果、図6(b)に示すように赤外光26のスペクトルが出力される。図中縦軸は光強度を示し、図中上側は下側より強い光強度となっている。横軸は波長を示し図中右側が左側より長い波長となっている。光強度分布線68は各波長における赤外光26の光強度を示している。光強度分布線68において波長が920nm及び988nmの場所では光強度が小さくなっている。この波長では、赤外光26が毛細血管の血液に吸収されている。そして、血中のグルコース濃度が高い程赤外光26が吸収される。
同様に、第2適正区間61では第2赤外センサー13が駆動され赤外光26のスペクトルが出力される。第3適正区間64では第3赤外センサー15が駆動され赤外光26のスペクトルが出力される。第4適正区間67では第4赤外センサー17が駆動され赤外光26のスペクトルが出力される。
図6(c)はステップS5の補正工程に対応する図である。ステップS5では補正演算部52が光強度分布線68を補正する。メモリー31には補正表データ47が記憶されている。図6(c)に示す補正曲線69は補正表データ47のテーブルを示す曲線である。補正表データ47は第1力センサー12~第4力センサー18が検出する押圧力と第1赤外センサー11~第4赤外センサー17が検出したスペクトルを補正する補正量との関係を示している。そして、補正曲線69は押圧力と第1赤外センサー11が検出する光強度との関係に基づいて設定された曲線になっている。図中縦軸は補正係数を示し、図中上側は下側より補正係数が大きくなっている。横軸は押圧力を示し、図中右側は左側より押圧力が大きくなっている。補正係数が大きい程補正量が大きくなる関係になっている。
補正曲線69を第1区間70a、第2区間70b、第3区間70c、第4区間70d、第5区間70eに分けて説明する。第1区間70aは押圧力が下側判定値46aより小さい区間であり、プリズム23の第1面23aと腕4との接触が不安定な区間である。従って、ステップS4の赤外光検出工程が行われないので、補正曲線69は設定されていない。
第2区間70bでは第1赤外センサー11が毛細血管の血液による赤外光26の吸収を検出することが可能であるが、第1赤外センサー11と腕4とが押圧し合う押圧力が少ない区間である。第2区間70bでは押圧力が大きくなる程毛細血管の血液による赤外光26の吸収が大きくなる区間である。この区間では押圧力が小さくなる程補正係数を大きくする。
第3区間70cは、押圧力が適正であり第1赤外センサー11が毛細血管の血液による赤外光26の吸収を適切に検出することができる区間である。この区間では、光強度分布線68の補正を小さくする。
第4区間70dは、第1赤外センサー11が毛細血管の血液による赤外光26の吸収を検出することが可能であるが、毛細血管が押圧されて血液が少なくなる区間である。第1赤外センサー11が腕4に押圧される程血液が少なくなり赤外光26の吸収が少なくなる。従って、この区間では押圧力が大きくなる程補正係数を大きくする。
第5区間70eでは第1赤外センサー11が毛細血管の血液による赤外光26の吸収を検出することが不安定である区間である。従って、ステップS4の赤外光検出工程が行われないので、補正曲線69は設定されていない。
ステップS5では補正演算部52が押圧力と補正曲線69から補正係数を算出して光強度分布線68に積算する。操作者が腕4を動かすとき腕4と生体計測装置1との相対位置が移動する。このとき第1赤外センサー11と腕4とが押し合う押圧力が変動する。そして、補正演算部52が押圧力と補正曲線69とを用いて光強度分布線68を補正する。従って、押圧力が変動するときにも精度の良い光強度分布線68を得ることができる。さらに、第2赤外センサー13~第4赤外センサー17にて検出されたスペクトルについても同様に補正演算部52が押圧力と補正曲線69から補正係数を算出して光強度分布線に積算する。
ステップS6の血糖値演算工程では成分濃度演算部51が光強度分布線68を補正した値を用いて血糖値を算出する。所定の波長における光強度と血糖値との関係を示す光強度対血糖値相関テーブルが生体成分データ48に記憶されている。成分濃度演算部51は光強度対血糖値相関テーブルと光強度分布線68とを用いて血糖値を演算する。このときの血糖値は血液中のグルコース量を示している。尚、血糖値の演算にはPLS回帰分析法(Partial Least Squares Regression)を適用してさらに精度良く演算してもよい。
血糖値の演算結果は生体成分データ48としてメモリー31に記憶される。そして、計測を終了した後で生体計測装置1からパーソナルコンピューター等の外部機器に血糖値のデータを送信することが可能になっている。従って、パーソナルコンピューターに設置されたプログラムにより血糖値の推移を分析することができる。
図7(a)及び図7(b)はステップS7の平均値演算工程に対応する図である。図7(a)において、縦軸は計測した血糖値を示し、図中上側が下側より血糖値が高くなっている。横軸は計測時間の推移を示し、図中時間は左側から右側に推移する。そして、○印のプロットは第1赤外センサー11が検出したスペクトラムを用いて算出した血糖値の計測値の例を示している。□印のプロットは第2赤外センサー13が検出したスペクトラムを用いて算出した血糖値の計測値の例を示している。▽印のプロットは第3赤外センサー15が検出したスペクトラムを用いて算出した血糖値の計測値の例を示している。△印のプロットは第4赤外センサー17が検出したスペクトラムを用いて算出した血糖値の計測値の例を示している。
平均値演算部53は計測できなかったときのデータを用いずに、計測できたときの血糖値のデータのみを用いて単純平均の演算を行う。第1赤外センサー11~第4赤外センサー17の赤外センサーがスペクトラムを検出したときには4つの計測値の平均を演算する。例えば、第1赤外センサー11及び第4赤外センサー17がスペクトラムを検出し、第2赤外センサー13及び第3赤外センサー15は駆動されないときには2つの計測値の平均を演算する。そして、平均値演算部53は血糖値推移線71を算出する。
図7(b)は血糖値の分布を示すヒストグラムである。縦軸は度数である。横軸は血糖値を示し図中右側が左側より血糖値が高くなっている。血糖値のデータは第1赤外センサー11~第4赤外センサー17が検出したスペクトラムを用いて計測された血糖値である。平均値演算部53は単純移動平均の演算を行う。データ数は特に限定されないが本実施形態では例えば、最大データ数を50個としている。データ数が最大データ数より少ないときには、計測したデータの平均値を演算する。データ数が50個以上のときには、計測した時刻が現在時刻に近い50個のデータの平均値72を演算する。従って、新しいデータが計測されたときには平均値72が更新される。
図7(c)はステップS8の表示工程に対応する図である。図7(c)に示すように、ステップS8において、表示装置5に計測した結果が表示される。表示装置5には演算した血糖値のプロットと血糖値推移線71とが表示される。さらに、現在時刻に近い平均値の値が表示される。
ステップS9の終了判断工程では、操作者が血糖値の測定を継続するか終了するかを判断する。終了するときには入力装置6を押して終了することを指示する。CPU30は入力装置6の信号を入力して計測するプログラムを停止する。以上の工程により、生体計測工程を終了する。
上述したように、本実施形態によれば、以下の効果を有する。
(1)本実施形態によれば、第1力センサー12~第4力センサー18は第1赤外センサー11~第4赤外センサー17と腕4との間で押圧し合う力を検出する。そして、押圧力判定部54が力を下側判定値46a及び上側判定値46bと比較し力が所定の範囲内にあるか否かを判定する。
(1)本実施形態によれば、第1力センサー12~第4力センサー18は第1赤外センサー11~第4赤外センサー17と腕4との間で押圧し合う力を検出する。そして、押圧力判定部54が力を下側判定値46a及び上側判定値46bと比較し力が所定の範囲内にあるか否かを判定する。
第1赤外センサー11~第4赤外センサー17が腕4から離れるとき赤外光26は腕4に吸光されない。従って、第1赤外センサー11~第4赤外センサー17は血糖値の情報を反映した赤外光26を精度良く受信することができない。また、第1赤外センサー11~第4赤外センサー17が腕4を押圧しすぎるとき腕4の血管が押圧されて表面近くの血流が阻害される。これにより、腕4が計測に相応しくない状態となるので第1赤外センサー11~第4赤外センサー17が受信する光強度データは腕4の血液の状態を正しく反映していないデータとなる。
押圧力判定部54は第1赤外センサー11~第4赤外センサー17の各赤外センサーが腕4を押圧する状態を判定している。そして、第1赤外センサー11~第4赤外センサー17が出力する光強度データが腕4の血管を流れる血液の計測に適しているときには成分濃度演算部51は光強度データを活用して血糖値を演算する。そして、第1赤外センサー11~第4赤外センサー17が出力する光強度データが腕4の血管を流れる血液の計測に適していないときには成分濃度演算部51は光強度データを活用しない。従って、生体計測装置1は第1赤外センサー11~第4赤外センサー17が出力する光強度データのうち腕4の血液の状態を反映しているときの光強度データだけを活用する為、精度良く血糖値を計測することができる。
(2)本実施形態によれば、生体計測装置1には第1赤外センサー11~第4赤外センサー17が設置され、各赤外センサーが光強度データを出力する。そして、平均値演算部53は第1赤外センサー11~第4赤外センサー17が出力する光強度データの平均を演算するので、外乱の影響を抑制して信頼性の高い血糖値を計測することができる。
(3)本実施形態によれば、押圧力判定部54は第1赤外センサー11~第4赤外センサー17が腕4を押圧する状態を判定する。そして、赤外センサー制御部49は生体を押圧する力が所定の範囲内にある赤外センサーを駆動する。従って、赤外センサー制御部49は適切な光強度データを出力可能な赤外センサーのみ駆動する。従って、生体計測装置1は複数の赤外センサーが出力する光強度データのうち生体の状態を反映しているときの光強度データだけを活用して精度良く生体の成分濃度を計測することができる。さらに、赤外センサーを駆動する電力を無駄にしないので省資源で赤外センサーを駆動することができる。
(第2の実施形態)
次に、生体計測装置の一実施形態について図8の力センサーの構造を示す要部模式拡大図を用いて説明する。
本実施形態が第1の実施形態と異なるところは、図2(c)に示した押圧突起12aの一部が弾性体となっている点にある。尚、第1の実施形態と同じ点については説明を省略する。
次に、生体計測装置の一実施形態について図8の力センサーの構造を示す要部模式拡大図を用いて説明する。
本実施形態が第1の実施形態と異なるところは、図2(c)に示した押圧突起12aの一部が弾性体となっている点にある。尚、第1の実施形態と同じ点については説明を省略する。
すなわち、本実施形態では、図8に示すように力センサー74はセンサー本体部74bを有し、センサー本体部74bの腕4側には押圧突起74aが設置されている。センサー本体部74bには圧電素子が内蔵されており、圧電素子はセンサー本体部74bと押圧突起74aとに挟まれた構造となっている。押圧突起74aの腕4側には弾性体としての突起先端部74cが設置されている。腕4が力センサー74を押圧する押圧力は突起先端部74cを介して力センサー74を押圧する。
突起先端部74cの材質は弾性体であり、弾力性を有している。突起先端部74cの材質は弾性体であれば良く特に限定されない。シリコンゴム、合成ゴム、天然ゴムの他金属製のコイルばね等を用いることができる。本実施形態では例えば、突起先端部74cの材質にシリコンゴムを採用している。
上述したように、本実施形態によれば、以下の効果を有する。
(1)本実施形態によれば、突起先端部74cは弾性体を有している。従って、突起先端部74cが触れている感触に腕4が過敏になることを抑制することができる。
(1)本実施形態によれば、突起先端部74cは弾性体を有している。従って、突起先端部74cが触れている感触に腕4が過敏になることを抑制することができる。
(第3の実施形態)
次に、生体計測装置の一実施形態について図9~図12を用いて説明する。図9(a)は本体部の構造を示す要部模式拡大図である。図9(b)はベルト部の構造を示す要部模式拡大図である。図10(a)~図10(c)は、生体計測方法を説明するための模式図である。本実施形態が第1の実施形態と異なるところは、検出部に複数の力センサーが設置されている点にある。尚、第1の実施形態と同じ点については説明を省略する。
次に、生体計測装置の一実施形態について図9~図12を用いて説明する。図9(a)は本体部の構造を示す要部模式拡大図である。図9(b)はベルト部の構造を示す要部模式拡大図である。図10(a)~図10(c)は、生体計測方法を説明するための模式図である。本実施形態が第1の実施形態と異なるところは、検出部に複数の力センサーが設置されている点にある。尚、第1の実施形態と同じ点については説明を省略する。
すなわち、本実施形態では、図9(a)に示すように生体計測装置78は本体部79を備え、本体部79の腕4側には第1検出部80及び第2検出部81が設置されている。そして、第1検出部80では第1力センサー12と接触力センサー部としての第1副力センサー82とが第1赤外センサー11とならんで配置されている。第1力センサー12及び第1副力センサー82は第1赤外センサー11の長手方向に離れて配置されている。同様に、第2検出部81では第2力センサー14と接触力センサー部としての第2副力センサー83とが第2赤外センサー13とならんで配置されている。第2力センサー14及び第2副力センサー83は第2赤外センサー13の長手方向に離れて配置されている。
第1検出部80が腕4から離れるとき、第1力センサー12及び第1副力センサー82が検出する押圧力が小さくなる。第1検出部80が傾くとき、第1力センサー12と第1副力センサー82とのうち一方が検出する押圧力が小さくなる。このとき、第1赤外センサー11は腕4から離れる危険性がある。従って、第1力センサー12及び第1副力センサー82の出力を用いて第1赤外センサー11が腕4に接触しているか否かを確実に検出することができる。第2検出部81は第1検出部80と同様の構造になっている。従って、第2力センサー14及び第2副力センサー83の出力を用いて第2赤外センサー13が腕4に接触しているか否かを確実に検出することができる。
図9(b)に示すように、ベルト部3の腕4側には第3検出部84及び第4検出部85が設置されている。そして、第3検出部84では第3力センサー16と接触力センサー部としての第3副力センサー86とが第3赤外センサー15とならんで配置されている。第3力センサー16及び第3副力センサー86は第3赤外センサー15の長手方向に離れて配置されている。同様に、第4検出部85では第4力センサー18と接触力センサー部としての第4副力センサー87とが第4赤外センサー17とならんで配置されている。第4力センサー18及び第4副力センサー87は第4赤外センサー17の長手方向に離れて配置されている。
第3検出部84及び第4検出部85は第1検出部80と同様の構造になっている。従って、第3力センサー16及び第3副力センサー86の出力を用いて第3赤外センサー15が腕4に接触しているか否かを確実に検出することができる。さらに、第4力センサー18及び第4副力センサー87の出力を用いて第4赤外センサー17が腕4に接触しているか否かを確実に検出することができる。
次に、第1検出部80を用いた生体計測方法を説明する。図10(a)、図10(b)はステップS2の押圧力検出工程及びステップS3の力判定工程に対応する図である。図10(a)において縦軸は第1力センサー12が検出した押圧力を示し、図中上側が下側より大きな力になっている。横軸は時間の経過を示し図中左から右へ時間が推移する。第1主力推移線88は第1力センサー12が検出した押圧力の推移の例を示している。
押圧力判定部54は第1力センサー12が検出する押圧力と下側判定値46aとを比較する。さらに、押圧力判定部54は第1力センサー12が検出する押圧力と上側判定値46bとを比較する。第1主力推移線88において押圧力が適正なときが第1主適正区間89とする。そして、第1主力推移線88において押圧力が押圧力不足または押圧力過多のとき第1主不適正区間90とする。
同様に、図10(b)において縦軸は第1副力センサー82が検出した押圧力を示し、図中上側が下側より大きな力になっている。横軸は図10(a)と同じであり説明を省略する。第1副力推移線91は第1副力センサー82が検出した押圧力の推移の例を示している。押圧力判定部54は第1副力センサー82が検出する押圧力と下側判定値46aとを比較する。さらに、押圧力判定部54は第1副力センサー82が検出する押圧力と上側判定値46bとを比較する。第1副力推移線91において押圧力が適正なときが第1副適正区間92とする。そして、第1副力推移線91において押圧力が押圧力不足または押圧力過多のとき第1副不適正区間93とする。
図10(c)はステップS3の力判定工程及びステップS5の補正工程に対応する図である。図10(c)において縦軸は押圧力を示し、図中上側が下側より大きな力になっている。横軸は時間の経過を示し図中左から右へ時間が推移する。ステップS3において押圧力判定部54は第1主適正区間89であり且つ第1副適正区間92である区間を演算して第1適正区間56とする。そして、第1適正区間56以外の区間を第1不適正区間57とする。つまり、第1力センサー12が検出する押圧力と第1副力センサー82が検出する押圧力とがともに下側判定値46a以上であり上側判定値46b以下のときに押圧力が適正であると判定する。第1主力推移線88及び第1副力推移線91の例では、第1副適正区間92が第1主適正区間89に含まれているので、第1適正区間56は第1副適正区間92と同じ区間となっている。
ステップS5において、平均値演算部53は第1力センサー12が検出した押圧力と第1副力センサー82が検出した押圧力との平均値である押圧力平均値を演算する。押圧力平均値推移線94は第1主力推移線88と第1副力推移線91との平均を演算した推移線となっている。そして、押圧力平均値推移線94と補正曲線69とを用いて光強度分布線68を補正する。つまり、第1赤外センサー11が腕4から押圧される押圧力には第1力センサー12が検出する押圧力と第1副力センサー82が検出する押圧力の平均値を適用する。これにより、第1赤外センサー11が腕4から押圧される押圧力を精度良く検出することができる。
第2検出部81、第3検出部84及び第4検出部85は第1検出部80と同じ構造となっている。そして、ステップS3では押圧力判定部54は第1適正区間56及び第1不適正区間57を演算した方法と同様の方法で第2検出部81、第3検出部84及び第4検出部85の適正区間と不適正区間を演算する。
ステップS5では平均値演算部53は押圧力平均値推移線94を演算した方法と同様の方法で第2検出部81、第3検出部84及び第4検出部85の押圧力平均値推移線を演算する。そして、演算した押圧力平均値推移線と補正曲線69とを用いて光強度分布線68を補正する。以降の工程は第1の実施形態と同じであり説明を省略する。
図11及び図12は検出部の配置を示す模式図である。図11(a)において、生体計測装置78の本体部79には腕4の長手方向に対して直交する方向に第1検出部80及び第2検出部81がならんで設置されている。第1検出部80では腕4の長手方向に対して直交する方向に第1力センサー12及び第1副力センサー82が並んで配置されている。この形態では、腕4の長手方向を回転軸にして第1検出部80が傾く状態を検出することができる。同様に、第2検出部81でも腕4の長手方向に対して直交する方向に第2力センサー14及び第2副力センサー83が並んで配置されている。この形態では、腕4の長手方向を回転軸にして第2検出部81が傾く状態を検出することができる。
図11(b)において、生体計測装置78のベルト部3には腕4の長手方向に対して直交する方向に第3検出部84及び第4検出部85がならんで設置されている。第3検出部84では腕4の長手方向に対して直交する方向に第3力センサー16及び第3副力センサー86が並んで配置されている。この形態では、腕4の長手方向を回転軸にして第3検出部84が傾く状態を検出することができる。同様に、第4検出部85では腕4の長手方向に対して直交する方向に第4力センサー18及び第4副力センサー87が並んで配置されている。この形態では、腕4の長手方向を回転軸にして第4検出部85が傾く状態を検出することができる。
次に、生体計測装置78と検出器の配置が異なる生体計測装置95を説明する。図11(c)において、生体計測装置95の本体部96では制御部21を挟んで腕4の長手方向に第1検出部80及び第2検出部81がならんで設置されている。第1検出部80では腕4の長手方向に第1力センサー12及び第1副力センサー82が並んで配置されている。この形態では、腕4の長手方向に対して直交する方向を回転軸にして第1検出部80が傾く状態を検出することができる。同様に、第2検出部81でも腕4の長手方向に第2力センサー14及び第2副力センサー83が並んで配置されている。この形態では、腕4の長手方向に対して直交する方向を回転軸にして第2検出部81が傾く状態を検出することができる。
図12(a)において、生体計測装置95のベルト部3には調整部3aの図中上側に第3検出部84及び第4検出部85が設置されている。そして、調整部3aの図中下側には検出部としての第5検出部97及び検出部としての第6検出部98が設置されている。
第3検出部84及び第4検出部85は腕4の長手方向にならんで設置されている。第3検出部84では腕4の長手方向に第3力センサー16及び第3副力センサー86が並んで配置されている。この形態では、腕4の長手方向に対して直交する方向を回転軸にして第3検出部84が傾く状態を検出することができる。同様に、第4検出部85でも腕4の長手方向に第4力センサー18及び第4副力センサー87が並んで配置されている。この形態では、腕4の長手方向に対して直交する方向を回転軸にして第4検出部85が傾く状態を検出することができる。
第5検出部97及び第6検出部98は腕4の長手方向にならんで設置されている。第5検出部97には赤外センサー部としての第5赤外センサー99、接触力センサー部としての第5力センサー100及び接触力センサー部としての第5副力センサー101が設置されている。第5赤外センサー99は第1赤外センサー11と同様のセンサーであり、第5力センサー100及び第5副力センサー101は第1力センサー12と同様のセンサーである。第5力センサー100及び第5副力センサー101は腕4の長手方向に並んで配置されている。この形態では、腕4の長手方向に対して直交する方向を回転軸にして第5検出部97が傾く状態を検出することができる。
同様に、第6検出部98には赤外センサー部としての第6赤外センサー102、接触力センサー部としての第6力センサー103及び接触力センサー部としての第6副力センサー104が設置されている。第6赤外センサー102は第1赤外センサー11と同様のセンサーであり、第6力センサー103及び第6副力センサー104は第1力センサー12と同様のセンサーである。第6力センサー103及び第6副力センサー104は腕4の長手方向に並んで配置されている。この形態では、腕4の長手方向に対して直交する方向を回転軸にして第6検出部98が傾く状態を検出することができる。
腕4の長手方向と直交する方向を回転軸に対して生体計測装置95が傾くとき、第1検出部80と第2検出部81とのうち一方の検出部が血糖値を検出することができる。さらに、第3検出部84と第4検出部85とのうち一方の検出部が血糖値を検出することができる。さらに、第5検出部97と第6検出部98とのうち一方の検出部が血糖値を検出することができる。腕4が捩じられる動作をするときにも第1検出部80~第6検出部98のうちいずれかの検出部が血糖値を検出することができる。従って、生体計測装置95はロバスト性を高くすることができる。
次に、生体計測装置78及び生体計測装置95と検出器の配置が異なる生体計測装置105を説明する。図12(b)において、生体計測装置105の本体部106には第1検出部80、第2検出部81及び第3検出部84が設置されている。第1検出部80、第2検出部81及び第3検出部84は制御部21を中心にした同心円上に配置されている。そして、制御部21を中心にして第1検出部80と第2検出部81が成す角度は120度であり、制御部21を中心にして第1検出部80と第3検出部84が成す角度は120度になっている。
この形態では、第2検出部81及び第3検出部84を用いて腕4の長手方向を回転軸にして本体部106が傾く状態を検出することができる。さらに、第1検出部80~第3検出部84を用いて腕4の長手方向と直交する方向を回転軸にして本体部106が傾く状態を検出することができる。従って、本体部106がどちらの方向に傾いても傾いたことを検出することができる。
図12(c)において、生体計測装置105では調整部3aには図中右側に第4検出部85が設置されている。ベルト部3には調整部3aの図中上側に第5検出部97が設置され、調整部3aの図中下側には第6検出部98が設置されている。そして、第5検出部97及び第6検出部98はベルト部3において図中左側に位置している。
第4検出部85では腕4の長手方向に第4力センサー18及び第4副力センサー87が並んで配置されている。第5検出部97では腕4の長手方向に第5力センサー100及び第5副力センサー101が並んで配置されている。第6検出部98では腕4の長手方向に第6力センサー103及び第6副力センサー104が並んで配置されている。この形態では、腕4の長手方向に対して直交する方向を回転軸にして第4検出部85、第5検出部97及び第6検出部98が傾く状態を検出することができる。
腕4の長手方向と直交する方向を回転軸にして生体計測装置105が傾くとき、第1検出部80~第6検出部98のいずれかの検出部が血糖値を検出することができる。さらに、腕4が捩じられる動作をするときにも第1検出部80~第6検出部98のうちいずれかの検出部が血糖値を検出することができる。従って、生体計測装置105はロバスト性を高くすることができる。
(第4の実施形態)
次に、生体計測装置の一実施形態について図13を用いて説明する。図13は赤外センサーの駆動タイミングを示すタイムチャートである。本実施形態が第1の実施形態と異なるところは、各検出部が順次計測を行う点にある。尚、第1の実施形態と同じ点については説明を省略する。
次に、生体計測装置の一実施形態について図13を用いて説明する。図13は赤外センサーの駆動タイミングを示すタイムチャートである。本実施形態が第1の実施形態と異なるところは、各検出部が順次計測を行う点にある。尚、第1の実施形態と同じ点については説明を省略する。
図13において、縦軸は第1赤外センサー11~第4赤外センサー17を示し横軸は時間の推移を示す。図中時間は左側から右側へ推移する。矢印線は各センサーが駆動するタイミングを示している。ステップS4の赤外光検出工程において第1赤外センサー11~第4赤外センサー17が駆動される。このとき、まず、第1赤外センサー11が駆動される。第1赤外センサー11の駆動が終了したとき、次に、第2赤外センサー13が駆動される。第2赤外センサー13の駆動が終了したとき、次に、第3赤外センサー15が駆動される。第3赤外センサー15の駆動が終了したとき、次に、第4赤外センサー17が駆動される。第4赤外センサー17の駆動が終了したとき、次に、第1赤外センサー11が駆動される。この様に、第1赤外センサー11~第4赤外センサー17は順次駆動される。
1つの赤外センサーが駆動している時間と並行して赤外センサーの検出結果を用いて演算が行われる。つまり、ステップS4とステップS5~ステップS8とが並行して行われる。
上述したように、本実施形態によれば、以下の効果を有する。
(1)本実施形態によれば、赤外センサーは順次駆動される。これにより、複数の赤外センサーを同時に駆動するときに比べて、駆動する電力のピーク値を下げることができる。従って、電力を供給する能力が低くすることができる為、電源の容量を小さくすることができる。
(1)本実施形態によれば、赤外センサーは順次駆動される。これにより、複数の赤外センサーを同時に駆動するときに比べて、駆動する電力のピーク値を下げることができる。従って、電力を供給する能力が低くすることができる為、電源の容量を小さくすることができる。
尚、本実施形態は上述した実施形態に限定されるものではなく、本発明の技術的思想内で当分野において通常の知識を有する者により種々の変更や改良を加えることも可能である。変形例を以下に述べる。
(変形例1)
前記第1の実施形態では、第1受光装置25が分光する機能を備えていた。これに限らず、第1発光装置24が所定の波長の赤外光26を照射するようにしても良い。そして、第1受光装置25は分光せずに光強度を検出するようにしても良い。例えば、第1発光装置24は発光する波長の異なる複数のLEDを備えても良い。そして、発光するLEDを切り替えて赤外光26の波長を切り換えて発光させても良い。さらに、回折格子を用いて波長をシフトさせても良い。各種の方法を用いて所定の波長の赤外光26を発光させても良い。
(変形例1)
前記第1の実施形態では、第1受光装置25が分光する機能を備えていた。これに限らず、第1発光装置24が所定の波長の赤外光26を照射するようにしても良い。そして、第1受光装置25は分光せずに光強度を検出するようにしても良い。例えば、第1発光装置24は発光する波長の異なる複数のLEDを備えても良い。そして、発光するLEDを切り替えて赤外光26の波長を切り換えて発光させても良い。さらに、回折格子を用いて波長をシフトさせても良い。各種の方法を用いて所定の波長の赤外光26を発光させても良い。
(変形例2)
前記第1の実施形態では、第1発光装置24の波長に対する赤外光26の強度分布を配慮しなかった。補正演算部52は第1発光装置24の波長に対する赤外光26の強度分布に対応して第1赤外センサー11が検出した光強度分布線68のデータを補正してもよい。血液成分の計測値の精度を向上させることができる。
前記第1の実施形態では、第1発光装置24の波長に対する赤外光26の強度分布を配慮しなかった。補正演算部52は第1発光装置24の波長に対する赤外光26の強度分布に対応して第1赤外センサー11が検出した光強度分布線68のデータを補正してもよい。血液成分の計測値の精度を向上させることができる。
(変形例3)
前記第1の実施形態では、第1受光装置25が光強度分布線68のデータを出力した。第1受光装置25は所定の波長の光強度のみを検出するようにしてもよい。検出する赤外光26の波長の種類を減らすことにより第1受光装置25は短時間に所定の波長の光強度を出力することができる。
前記第1の実施形態では、第1受光装置25が光強度分布線68のデータを出力した。第1受光装置25は所定の波長の光強度のみを検出するようにしてもよい。検出する赤外光26の波長の種類を減らすことにより第1受光装置25は短時間に所定の波長の光強度を出力することができる。
(変形例4)
前記第1の実施形態では、本体部2の内部に制御部21が収納された。制御部21が本体部2の内部に収納しきれないときには、制御部21の一部または全部を本体部2とは別体の電子装置に収納してもよい。そして、この電子装置と本体部2とを有線または無線にて通信しても良い。これにより、製造し易い生体計測装置1にすることができる。
前記第1の実施形態では、本体部2の内部に制御部21が収納された。制御部21が本体部2の内部に収納しきれないときには、制御部21の一部または全部を本体部2とは別体の電子装置に収納してもよい。そして、この電子装置と本体部2とを有線または無線にて通信しても良い。これにより、製造し易い生体計測装置1にすることができる。
(変形例5)
前記第1の実施形態では、血糖値を計測した。分析する赤外光26の波長を変えて他の成分濃度を計測しても良い。他にも、複数の場所に赤外光26を照射して血流の脈波を検出して脈拍や血圧を計測しても良い。
前記第1の実施形態では、血糖値を計測した。分析する赤外光26の波長を変えて他の成分濃度を計測しても良い。他にも、複数の場所に赤外光26を照射して血流の脈波を検出して脈拍や血圧を計測しても良い。
(変形例6)
前記第1の実施形態では、赤外センサー制御部49は第1適正区間56においてのみ第1赤外センサー11を駆動させた。常時、第1赤外センサー11を駆動しても良い。そして、第1適正区間56における光強度データ44のみを採用しても良い。第1赤外センサー11の制御を容易にすることができる。
前記第1の実施形態では、赤外センサー制御部49は第1適正区間56においてのみ第1赤外センサー11を駆動させた。常時、第1赤外センサー11を駆動しても良い。そして、第1適正区間56における光強度データ44のみを採用しても良い。第1赤外センサー11の制御を容易にすることができる。
(変形例7)
前記第1の実施形態では、補正演算部52が光強度分布線68を補正した。補正の影響が小さいときには補正を省略しても良い。プログラムソフト43のデータを少なくすることができる。尚、変形例1~変形例7の内容は第2の実施形態~第4の実施形態にも適用しても良い。
前記第1の実施形態では、補正演算部52が光強度分布線68を補正した。補正の影響が小さいときには補正を省略しても良い。プログラムソフト43のデータを少なくすることができる。尚、変形例1~変形例7の内容は第2の実施形態~第4の実施形態にも適用しても良い。
(変形例8)
前記第3の実施形態では、第1検出部80~第6検出部98が2つの力センサーを備えていた。各検出部が備える力センサーの個数は3個以上でもよい。さらに、精度良く検出部が腕4に接触する状態を検出することができる。
前記第3の実施形態では、第1検出部80~第6検出部98が2つの力センサーを備えていた。各検出部が備える力センサーの個数は3個以上でもよい。さらに、精度良く検出部が腕4に接触する状態を検出することができる。
(変形例9)
前記第3の実施形態では、各検出部における力センサーがならぶ方向が揃えてあった。力センサーがならぶ方向は検出部毎に変えても良い。ベルト部3が変形し易い形態に合わせて力センサーを配置しても良い。力センサーが各検出部の傾きを検出し易くなるので精度良く生体情報を計測することができる。
前記第3の実施形態では、各検出部における力センサーがならぶ方向が揃えてあった。力センサーがならぶ方向は検出部毎に変えても良い。ベルト部3が変形し易い形態に合わせて力センサーを配置しても良い。力センサーが各検出部の傾きを検出し易くなるので精度良く生体情報を計測することができる。
1,78,95,105…生体計測装置、2…保持部としての本体部、3…保持部としてのベルト部、4…生体としての腕、7…検出部としての第1検出部、8…検出部としての第2検出部、9…検出部としての第3検出部、10…検出部としての第4検出部、11…赤外センサー部としての第1赤外センサー、12…接触力センサー部としての第1力センサー、13…赤外センサー部としての第2赤外センサー、14…接触力センサー部としての第2力センサー、15…赤外センサー部としての第3赤外センサー、16…接触力センサー部としての第3力センサー、17…赤外センサー部としての第4赤外センサー、18…接触力センサー部としての第4力センサー、26…赤外光、51…成分濃度演算部、53…平均値演算部、54…判定部としての押圧力判定部、74…力センサー、82…接触力センサー部としての第1副力センサー、83…接触力センサー部としての第2副力センサー、86…接触力センサー部としての第3副力センサー、87…接触力センサー部としての第4副力センサー、97…検出部としての第5検出部、98…検出部としての第6検出部、99…赤外センサー部としての第5赤外センサー、100…接触力センサー部としての第5力センサー、101…接触力センサー部としての第5副力センサー、102…赤外センサー部としての第6赤外センサー、103…接触力センサー部としての第6力センサー、104…接触力センサー部としての第6副力センサー。
Claims (6)
- 生体に赤外光を照射し前記生体で反射または散乱した前記赤外光を受信して光強度データを出力する赤外センサー部と、前記赤外センサー部と前記生体との間の接触力を検出する接触力センサー部と、を備える複数の検出部と、
前記赤外センサー部が前記生体に接触するように前記検出部を保持する保持部と、
前記接触力を判定値と比較し前記接触力が所定の範囲内にあるか否かを判定する判定部と、
前記接触力が所定の範囲内にあると前記判定部が判定したときの前記光強度データを用いて前記生体の成分濃度を演算する成分濃度演算部と、を備えることを特徴とする生体計測装置。 - 請求項1に記載の生体計測装置であって、
複数の前記赤外センサー部が出力した前記光強度データから演算された前記成分濃度の平均値を演算する平均値演算部を備えることを特徴とする生体計測装置。 - 請求項1または2に記載の生体計測装置であって、
複数の前記赤外センサー部は順次駆動されることを特徴とする生体計測装置。 - 請求項1~3のいずれか一項に記載の生体計測装置であって、
前記検出部は複数の前記接触力センサー部を備えることを特徴とする生体計測装置。 - 生体に赤外光を照射し前記生体で反射または散乱した前記赤外光を受信して光強度データを出力する赤外センサー部と、前記赤外センサー部と前記生体との間の接触力を検出する接触力センサー部と、を備える複数の検出部と、
前記赤外センサー部が前記生体に接触するように前記検出部を保持する保持部と、
前記接触力を判定値と比較し前記接触力が所定の範囲内にあるか否かを判定する判定部と、
前記接触力が所定の範囲内にあるときに前記赤外センサー部を駆動する制御を行う赤外センサー制御部と、
前記光強度データを用いて前記生体の成分濃度を演算する成分濃度演算部と、を備えることを特徴とする生体計測装置。 - 複数の赤外センサー部を生体に押圧し、
前記赤外センサー部と前記生体との間の接触力を検出し、
前記接触力が所定の範囲内にある前記赤外センサー部を駆動し、
前記赤外センサー部は前記生体に赤外光を照射し前記生体で反射または散乱した前記赤外光を受信して光強度データを出力し、
前記光強度データから前記生体の成分濃度を演算することを特徴とする生体計測方法。
Priority Applications (3)
| Application Number | Priority Date | Filing Date | Title |
|---|---|---|---|
| CN201580015709.1A CN106102579A (zh) | 2014-04-04 | 2015-03-31 | 生物体计测装置及生物体计测方法 |
| EP15772944.3A EP3127480A4 (en) | 2014-04-04 | 2015-03-31 | Biological measurement apparatus and biological measurement method |
| US15/300,081 US20170143210A1 (en) | 2014-04-04 | 2015-03-31 | Biological measurement apparatus and biological measurement method |
Applications Claiming Priority (2)
| Application Number | Priority Date | Filing Date | Title |
|---|---|---|---|
| JP2014077587A JP2015198689A (ja) | 2014-04-04 | 2014-04-04 | 生体計測装置および生体計測方法 |
| JP2014-077587 | 2014-04-04 |
Publications (1)
| Publication Number | Publication Date |
|---|---|
| WO2015151508A1 true WO2015151508A1 (ja) | 2015-10-08 |
Family
ID=54239853
Family Applications (1)
| Application Number | Title | Priority Date | Filing Date |
|---|---|---|---|
| PCT/JP2015/001849 Ceased WO2015151508A1 (ja) | 2014-04-04 | 2015-03-31 | 生体計測装置および生体計測方法 |
Country Status (5)
| Country | Link |
|---|---|
| US (1) | US20170143210A1 (ja) |
| EP (1) | EP3127480A4 (ja) |
| JP (1) | JP2015198689A (ja) |
| CN (1) | CN106102579A (ja) |
| WO (1) | WO2015151508A1 (ja) |
Cited By (2)
| Publication number | Priority date | Publication date | Assignee | Title |
|---|---|---|---|---|
| CN109922730A (zh) * | 2016-10-25 | 2019-06-21 | 豪夫迈·罗氏有限公司 | 用于确定体液中的分析物浓度的方法和分析物浓度测量设备 |
| JP2021126463A (ja) * | 2020-02-17 | 2021-09-02 | 株式会社村田製作所 | 測定装置及び測定システム |
Families Citing this family (14)
| Publication number | Priority date | Publication date | Assignee | Title |
|---|---|---|---|---|
| US11234648B2 (en) | 2016-12-26 | 2022-02-01 | Mitsubishi Electric Corporation | Biological material measuring apparatus |
| JP6739550B2 (ja) * | 2016-12-26 | 2020-08-12 | 三菱電機株式会社 | 生体物質測定装置および生体物質測定方法 |
| DE112017006565B4 (de) * | 2016-12-26 | 2022-10-13 | Mitsubishi Electric Corporation | Messvorrichtung für biologisches Material |
| KR102487058B1 (ko) * | 2017-11-17 | 2023-01-09 | 삼성전자주식회사 | 생체정보 측정 장치 및 방법 |
| JP6425861B1 (ja) * | 2018-02-02 | 2018-11-21 | 三菱電機株式会社 | 生体物質測定装置 |
| KR20200139135A (ko) * | 2018-03-29 | 2020-12-11 | 소니 주식회사 | 정보처리시스템, 정보처리장치, 및 정보처리 방법 |
| JP6570716B2 (ja) * | 2018-09-07 | 2019-09-04 | 三菱電機株式会社 | 生体物質測定装置 |
| KR102655673B1 (ko) * | 2018-09-18 | 2024-04-05 | 삼성전자주식회사 | 혈압 측정 장치 및 방법 |
| CN111759290B (zh) * | 2019-04-02 | 2022-02-08 | 清华大学 | 柔性生理信号检测装置 |
| KR102914473B1 (ko) * | 2019-08-20 | 2026-01-16 | 삼성전자주식회사 | 생체정보 추정 장치 및 방법 |
| KR102895685B1 (ko) * | 2019-10-22 | 2025-12-03 | 삼성전자주식회사 | 항산화 센서 및 항산화 수치 측정 방법 |
| US20230210416A1 (en) * | 2020-06-09 | 2023-07-06 | Joyson Safety Systems Acquisition Llc | System and method of touch sensing using physiological or biochemical sensors |
| CN113627344B (zh) * | 2021-08-11 | 2025-02-25 | 上海乐闪闪智能科技有限公司 | 双重生物特征检测系统、安全识别方法、应用及电子设备 |
| WO2026055256A1 (en) * | 2024-09-03 | 2026-03-12 | Cardiosense, Inc. | Systems, devices, and methods for determining physiological information, including handheld and implantable devices |
Citations (4)
| Publication number | Priority date | Publication date | Assignee | Title |
|---|---|---|---|---|
| JPH10248829A (ja) * | 1997-03-11 | 1998-09-22 | Hitachi Ltd | 無侵襲生化学計測装置 |
| WO2000057793A1 (fr) * | 1999-03-29 | 2000-10-05 | Hitachi Medical Corporation | Instrument de mesure optique biologique |
| JP2003111750A (ja) * | 2001-10-05 | 2003-04-15 | Shimadzu Corp | 無侵襲生体計測装置、及び該装置を用いた血糖測定装置 |
| JP2004298408A (ja) * | 2003-03-31 | 2004-10-28 | Olympus Corp | グルコース濃度測定装置 |
Family Cites Families (13)
| Publication number | Priority date | Publication date | Assignee | Title |
|---|---|---|---|---|
| US4799491A (en) * | 1986-11-06 | 1989-01-24 | Sri International | Blood pressure monitoring method and apparatus |
| GB2328279B (en) * | 1997-08-12 | 2001-10-10 | Abbott Lab | Optical glucose detector |
| AU2003274370A1 (en) * | 2002-06-07 | 2003-12-22 | Praesagus, Inc. | Characterization adn reduction of variation for integrated circuits |
| EP1691678A1 (en) * | 2003-11-28 | 2006-08-23 | Koninklijke Philips Electronics N.V. | Monitoring device and a monitoring body-wear |
| WO2007053963A1 (en) * | 2005-11-10 | 2007-05-18 | Solianis Holding Ag | Device for determining the glucose level in body tissue |
| US7684841B2 (en) * | 2006-03-10 | 2010-03-23 | Panasonic Corporation | Living body ingredient concentration measuring instrument |
| CN101848672A (zh) * | 2007-09-13 | 2010-09-29 | 密苏里大学董事会 | 光学装置组件 |
| WO2009141755A1 (en) * | 2008-05-19 | 2009-11-26 | Koninklijke Philips Electronics N.V. | Device for adapting pressure exerted by a probe to a measurement and/or treatment site |
| DE102010014775A1 (de) * | 2010-04-13 | 2011-10-13 | Vivantum Gmbh | Vorrichtung und Verfahren zur Bestimmen eines biologischen, chemischen und/oder physikalischen Parameters in lebendem biologischem Gewebe |
| EP2537460B1 (en) * | 2011-06-20 | 2015-01-07 | St. Jude Medical AB | Method and system for ischemia detection |
| US8784719B2 (en) * | 2011-06-30 | 2014-07-22 | Sabic Global Technologies B.V. | Flow in reinforced polyimide compositions |
| TWI421255B (zh) * | 2011-08-05 | 2014-01-01 | Ind Tech Res Inst | 有機金屬化合物及包含其之有機電激發光裝置 |
| CN104027103A (zh) * | 2013-03-06 | 2014-09-10 | 精工爱普生株式会社 | 生物体信息检测装置以及脉搏计 |
-
2014
- 2014-04-04 JP JP2014077587A patent/JP2015198689A/ja active Pending
-
2015
- 2015-03-31 EP EP15772944.3A patent/EP3127480A4/en not_active Withdrawn
- 2015-03-31 WO PCT/JP2015/001849 patent/WO2015151508A1/ja not_active Ceased
- 2015-03-31 US US15/300,081 patent/US20170143210A1/en not_active Abandoned
- 2015-03-31 CN CN201580015709.1A patent/CN106102579A/zh active Pending
Patent Citations (4)
| Publication number | Priority date | Publication date | Assignee | Title |
|---|---|---|---|---|
| JPH10248829A (ja) * | 1997-03-11 | 1998-09-22 | Hitachi Ltd | 無侵襲生化学計測装置 |
| WO2000057793A1 (fr) * | 1999-03-29 | 2000-10-05 | Hitachi Medical Corporation | Instrument de mesure optique biologique |
| JP2003111750A (ja) * | 2001-10-05 | 2003-04-15 | Shimadzu Corp | 無侵襲生体計測装置、及び該装置を用いた血糖測定装置 |
| JP2004298408A (ja) * | 2003-03-31 | 2004-10-28 | Olympus Corp | グルコース濃度測定装置 |
Non-Patent Citations (1)
| Title |
|---|
| See also references of EP3127480A4 * |
Cited By (4)
| Publication number | Priority date | Publication date | Assignee | Title |
|---|---|---|---|---|
| CN109922730A (zh) * | 2016-10-25 | 2019-06-21 | 豪夫迈·罗氏有限公司 | 用于确定体液中的分析物浓度的方法和分析物浓度测量设备 |
| CN109922730B (zh) * | 2016-10-25 | 2022-03-22 | 豪夫迈·罗氏有限公司 | 用于确定体液中的分析物浓度的方法和分析物浓度测量设备 |
| US11284817B2 (en) | 2016-10-25 | 2022-03-29 | Roche Diabetes Care, Inc. | Method for determination of an analyte concentration in a body fluid and analyte concentration measurement device |
| JP2021126463A (ja) * | 2020-02-17 | 2021-09-02 | 株式会社村田製作所 | 測定装置及び測定システム |
Also Published As
| Publication number | Publication date |
|---|---|
| CN106102579A (zh) | 2016-11-09 |
| EP3127480A1 (en) | 2017-02-08 |
| US20170143210A1 (en) | 2017-05-25 |
| JP2015198689A (ja) | 2015-11-12 |
| EP3127480A4 (en) | 2017-12-13 |
Similar Documents
| Publication | Publication Date | Title |
|---|---|---|
| WO2015151508A1 (ja) | 生体計測装置および生体計測方法 | |
| JP2015173935A (ja) | 生体計測装置および生体計測方法 | |
| KR102487058B1 (ko) | 생체정보 측정 장치 및 방법 | |
| US20200096501A1 (en) | Mobile Device Multi-Analyte Testing Analyzer for Use in Medical Diagnostic Monitoring and Screening | |
| CN100409803C (zh) | 光学式生物体信息测定装置、测定方法以及判定装置 | |
| US10782653B2 (en) | Actuator apparatus, electronic device, and control method | |
| US8855733B2 (en) | Substance component detection device | |
| EP3485810B1 (en) | Bio-information estimation apparatus and bio-information estimation method | |
| CN106061385B (zh) | 测量装置和测量方法 | |
| US9910262B2 (en) | Actuator control device, optical module, electronic apparatus, and actuator control method | |
| RU2017125449A (ru) | Прибор для измерения физиологического параметра с использованием носимого датчика | |
| CN106164652B (zh) | 成分测定装置 | |
| DE602005017492D1 (de) | Kombiniertes gerät zum messen von blutzucker aus augenflüssigkeit | |
| KR20200075512A (ko) | 다중 센서를 이용한 비침습식 생체정보 측위 기반 보정 시스템 및 방법 | |
| JP4553954B2 (ja) | 血中成分濃度測定装置及び血中成分濃度測定方法 | |
| JP6116692B2 (ja) | 試料塗布を判定する方法および装置 | |
| JP2004298408A (ja) | グルコース濃度測定装置 | |
| KR20220041750A (ko) | 광학 센서의 오차 보정 방법 및 장치와, 생체정보 추정 장치 | |
| JP2003310575A (ja) | 光式皮下脂肪厚測定方法及びそれに用いる装置 | |
| US20220125315A1 (en) | Apparatus for measuring vibrotactile perception and preparation method thereof including automated measurement of temperature | |
| JP4466162B2 (ja) | 生体情報測定装置 | |
| CN119255747A (zh) | 肌肤性状测定装置 | |
| JP2013132543A (ja) | 測定装置 | |
| JP6080004B2 (ja) | パラメータ計測装置、パラメータ計測方法、及びプログラム | |
| JP2008154873A (ja) | 光学測定装置 |
Legal Events
| Date | Code | Title | Description |
|---|---|---|---|
| 121 | Ep: the epo has been informed by wipo that ep was designated in this application |
Ref document number: 15772944 Country of ref document: EP Kind code of ref document: A1 |
|
| WWE | Wipo information: entry into national phase |
Ref document number: 15300081 Country of ref document: US |
|
| NENP | Non-entry into the national phase |
Ref country code: DE |
|
| REEP | Request for entry into the european phase |
Ref document number: 2015772944 Country of ref document: EP |
|
| WWE | Wipo information: entry into national phase |
Ref document number: 2015772944 Country of ref document: EP |