WO2015159623A1 - 血液状態解析装置、血液状態解析システム、血液状態解析方法及びプログラム - Google Patents
血液状態解析装置、血液状態解析システム、血液状態解析方法及びプログラム Download PDFInfo
- Publication number
- WO2015159623A1 WO2015159623A1 PCT/JP2015/057647 JP2015057647W WO2015159623A1 WO 2015159623 A1 WO2015159623 A1 WO 2015159623A1 JP 2015057647 W JP2015057647 W JP 2015057647W WO 2015159623 A1 WO2015159623 A1 WO 2015159623A1
- Authority
- WO
- WIPO (PCT)
- Prior art keywords
- blood
- drug
- state analysis
- time
- coagulation
- Prior art date
- Legal status (The legal status is an assumption and is not a legal conclusion. Google has not performed a legal analysis and makes no representation as to the accuracy of the status listed.)
- Ceased
Links
Images










Classifications
-
- G—PHYSICS
- G01—MEASURING; TESTING
- G01N—INVESTIGATING OR ANALYSING MATERIALS BY DETERMINING THEIR CHEMICAL OR PHYSICAL PROPERTIES
- G01N33/00—Investigating or analysing materials by specific methods not covered by groups G01N1/00 - G01N31/00
- G01N33/48—Biological material, e.g. blood, urine; Haemocytometers
- G01N33/483—Physical analysis of biological material
- G01N33/487—Physical analysis of biological material of liquid biological material
- G01N33/49—Blood
- G01N33/4905—Determining clotting time of blood
-
- G—PHYSICS
- G01—MEASURING; TESTING
- G01N—INVESTIGATING OR ANALYSING MATERIALS BY DETERMINING THEIR CHEMICAL OR PHYSICAL PROPERTIES
- G01N27/00—Investigating or analysing materials by the use of electric, electrochemical, or magnetic means
- G01N27/02—Investigating or analysing materials by the use of electric, electrochemical, or magnetic means by investigating impedance
-
- G—PHYSICS
- G01—MEASURING; TESTING
- G01N—INVESTIGATING OR ANALYSING MATERIALS BY DETERMINING THEIR CHEMICAL OR PHYSICAL PROPERTIES
- G01N27/00—Investigating or analysing materials by the use of electric, electrochemical, or magnetic means
- G01N27/02—Investigating or analysing materials by the use of electric, electrochemical, or magnetic means by investigating impedance
- G01N27/021—Investigating or analysing materials by the use of electric, electrochemical, or magnetic means by investigating impedance before and after chemical transformation of the material
-
- G—PHYSICS
- G01—MEASURING; TESTING
- G01N—INVESTIGATING OR ANALYSING MATERIALS BY DETERMINING THEIR CHEMICAL OR PHYSICAL PROPERTIES
- G01N27/00—Investigating or analysing materials by the use of electric, electrochemical, or magnetic means
- G01N27/02—Investigating or analysing materials by the use of electric, electrochemical, or magnetic means by investigating impedance
- G01N27/22—Investigating or analysing materials by the use of electric, electrochemical, or magnetic means by investigating impedance by investigating capacitance
-
- G—PHYSICS
- G01—MEASURING; TESTING
- G01N—INVESTIGATING OR ANALYSING MATERIALS BY DETERMINING THEIR CHEMICAL OR PHYSICAL PROPERTIES
- G01N33/00—Investigating or analysing materials by specific methods not covered by groups G01N1/00 - G01N31/00
- G01N33/48—Biological material, e.g. blood, urine; Haemocytometers
- G01N33/50—Chemical analysis of biological material, e.g. blood, urine; Testing involving biospecific ligand binding methods; Immunological testing
- G01N33/86—Chemical analysis of biological material, e.g. blood, urine; Testing involving biospecific ligand binding methods; Immunological testing involving blood coagulating time or factors, or their receptors
Definitions
- the present technology relates to a blood state analysis device, a blood state analysis system, a blood state analysis method, and a program. More specifically, the present invention relates to a technique for evaluating blood coagulation characteristics from changes over time in electrical characteristics.
- PT prothrombin time
- APTT activated partial thromboplastin time
- a coagulant is added to plasma obtained by centrifugation, and the time until the plasma starts to coagulate is measured.
- thromboelastometry which mechanically measures changes in viscoelasticity in the blood coagulation process (for example, see Patent Documents 1 and 2).
- the present inventor has proposed a method for acquiring information related to blood coagulation from the dielectric constant of blood (see, for example, Patent Document 3).
- the blood coagulation system analysis device described in Patent Document 3 from the parameter indicating the increase in the dielectric constant of the frequency to be noted in a predetermined period after the anticoagulant action of blood imparted by citrate addition or the like is solved, Estimates the time when certain viscoelastic characteristics appear and evaluates the risk of blood clots.
- Thromboelastometry is a method for comprehensively evaluating blood coagulation ability by observing the process in which all blood components such as plasma and platelets interact and coagulate.
- TEG registered trademark
- ROTEM registered trademark
- Thromboelastometry is a method for comprehensively evaluating blood coagulation ability by observing the process in which all blood components such as plasma and platelets interact and coagulate.
- TEG registered trademark
- ROTEM registered trademark
- these products are (1) the measurement is not automated and the test result depends on the operator's technique, (2) it is susceptible to vibration, (3) the quality control procedure is complicated and the reagent for that Are expensive, and (4) require skill to interpret the output signal (thromboelastogram). And these reasons are considered to be the first cause that prevents the widespread use.
- the blood coagulation system analyzer described in Patent Document 3 can not only overcome the above-mentioned weaknesses of thromboelastometry by automating measurement and analysis, high measurement accuracy, etc., but also the blood state immediately after the start of measurement. Changes can also be observed. And this blood coagulation system analysis apparatus can evaluate other factors representing the initial reaction of coagulation and the state of blood that could not be evaluated by thromboelastometry. For this reason, there is currently a demand for the development of a clinical test apparatus that can evaluate blood coagulation and fibrinolysis systems using electrical characteristics such as dielectric constant.
- the present disclosure mainly aims to provide a blood state analysis device, a blood state analysis system, a blood state analysis method, and a program capable of accurately evaluating a blood coagulation system or a fibrinolytic system from electrical characteristics. To do.
- the blood condition analysis apparatus provides temporal change data of electrical characteristics measured at a specific frequency or frequency band for two or more blood samples having different types or concentrations of drugs prepared from one blood sample. Utilizing at least an analysis unit for evaluating the influence of the drug or the factor in the blood on the coagulation system or fibrinolysis system of the blood. In this blood state analyzer, an activator or inhibitor for the blood coagulation system or fibrinolytic system can be used as the drug.
- the analysis unit determines the clotting time, clot formation time, clot maximum firmness, maximum dissolution, clotting amplitude, clotting rate, clot firmness after a certain time from the clotting time, It is possible to calculate at least one value selected from the group consisting of the clot firmness after a certain time has elapsed from the maximum firmness and the clot linear velocity after the maximum firmness, and the evaluation can be performed based on the calculated value. In that case, the analysis unit may correct the calculated value by a hematocrit value of the blood sample. The analysis unit can also evaluate the influence of platelet factor and / or fibrinogen on the blood coagulation system.
- a platelet function inhibitor, a fibrinogen function inhibitor, or a fibrin polymerization inhibitor can be used as the drug.
- the analysis unit for example, the difference between the temporal change data of the electrical characteristics of the blood sample not containing the drug and the blood sample containing the drug at an arbitrary concentration, or a value calculated from the temporal change data Based on the difference, the effect of the drug can be evaluated.
- the said analysis part can also estimate the minimum chemical
- the analysis unit can also evaluate the influence of plasmin or plasminogen on the blood fibrinolytic system.
- the agent may be plasminogen or a plasmin activator or inhibitor.
- the analysis unit evaluates the influence of plasmin or plasminogen, for example, by comparing temporal change data of electrical characteristics of a blood sample not containing the drug and a blood sample containing the drug at an arbitrary concentration. be able to.
- the blood state analysis apparatus of the present disclosure may use heparin as the drug, and the analysis unit may evaluate the blood coagulation inhibitory effect by the heparin.
- the blood state analysis system is a measurement in which electrical characteristics are measured over time at a specific frequency or frequency band for two or more blood samples having different types or concentrations of drugs prepared from one blood sample.
- An electrical characteristic measuring device including a section, and data on temporal changes of the electrical characteristics measured by the electrical characteristic measuring device, so that the agent or the factor in the blood enters the blood coagulation system or fibrinolysis system
- a blood state analysis apparatus including an analysis unit that evaluates the influence exerted.
- the blood state analysis system of the present disclosure further includes a server including an information storage unit that stores measurement data in the electrical characteristic measurement device and / or an analysis result in the blood state analysis device, and the server includes: It may be connected to the electrical property measuring device and / or the blood state analyzing device via a network.
- the blood condition analysis method is a measurement in which electrical characteristics are measured over time at a specific frequency or frequency band for two or more blood samples having different types or concentrations of drugs prepared from one blood sample. And an analysis process for evaluating the influence of the drug or the factor in the blood on the coagulation system or fibrinolysis system of the blood using the time-dependent data of the electrical characteristics measured in the measurement process. Have.
- the program according to the present disclosure uses time-dependent data of electrical characteristics measured at a specific frequency or frequency band for two or more blood samples having different types or concentrations of drugs prepared from one blood sample.
- the computer is configured to realize an analysis function for evaluating the influence of the drug or the factor in the blood on the coagulation system or fibrinolysis system of the blood.
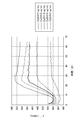
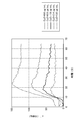
- FIG. 1 It is a figure showing a schematic structure of a blood state analysis system of a 1st embodiment of this indication. It is a drawing substitute graph which shows a time-dependent change of the complex dielectric constant accompanying blood coagulation, A shows a real part ((epsilon) '), B shows an imaginary part ((epsilon) "). It is a drawing substitute graph which compared the value calculated
- 6 is a drawing-substituting graph showing the difference between the value of a blood sample with a CyD concentration of 0 ⁇ g / mL and the value of other blood samples in the real part ( ⁇ ′) of the complex dielectric constant at 10 MHz shown in FIG. 5.
- 12 is a drawing-substituting graph showing the relationship between the coagulation time determined from the value of ⁇ ′ at 10 MHz shown in FIG. 11 and the heparin concentration.
- A is a graph showing the relationship between fibrinogen inhibitor (Pefabloc) concentration and coagulation amplitude
- B is a drawing substitute graph showing the relationship with coagulation time.
- It is a flowchart figure which shows the other operation example of the blood state analyzer shown in FIG.
- It is a drawing substitute graph which shows a time-dependent change of the real part ((epsilon ')) of the complex dielectric constant in 1 MHz of the blood sample from which PLT and HCT differ.
- It is a drawing substitute graph which shows the time-dependent change of the real part ((epsilon ')) of the complex dielectric constant in 10 MHz of the blood sample from which PLT and HCT differ.
- FIG. 20 is a drawing substitute graph showing the difference between the value shown in FIG. 18 and the value shown in FIG. 19.
- 6 is a drawing-substituting graph showing the relationship between the coagulation rate estimated from the real part ( ⁇ ′) of the complex dielectric constant and the platelet concentration.
- 6 is a drawing-substituting graph showing the relationship between the coagulation amplitude estimated from the real part ( ⁇ ′) of the complex dielectric constant and the platelet concentration.
- 6 is a drawing-substituting graph showing the relationship between the coagulation amplitude estimated from the real part ( ⁇ ′) of the complex dielectric constant and corrected by HCT, and the effective platelet concentration.
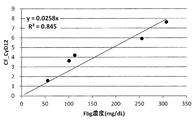
- FIG. 7 is a drawing-substituting graph showing the relationship between the amplitude CF of a blood sample in which the platelet function is completely suppressed by CyD and the effective fibrinogen concentration FIB.
- FIG. 9 is a drawing-substituting graph showing the relationship between the amplitude CF-a ⁇ the effective concentration FIB of fibrinogen and the effective concentration PLT of platelets.
- FIG. 9 is a drawing-substituting graph showing the relationship between the amplitude CF-a ⁇ the effective concentration FIB of fibrinogen and the effective concentration PLT of platelets.
- the above formula 9 6 is a drawing-substituting graph showing the correlation between the amplitude CF calculated by using and the actual measured amplitude CF.
- the amplitude CF calculated using Equation 9 from the measurement result different from the result used in the model confirmation (1) and the actual measurement amplitude CF It is a drawing substitute graph which shows a correlation. It is a drawing substitute graph which shows the relationship between the initial value of a complex dielectric constant, and a hematocrit value.
- FIG. 35 is a drawing substitute graph showing comparison data corresponding to FIG. 34 when correction is performed using a hematocrit value measured by a multi-item automatic blood cell counter. It is a drawing substitute graph which shows the comparison data corresponding to FIG. 33 at the time of correct
- FIG. 35 is a drawing substitute graph showing comparison data corresponding to FIG. 34 when correction is performed using a hematocrit value calculated from an initial value of a complex dielectric constant.
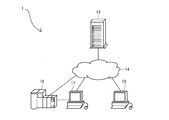
- FIG. 1 is a diagram showing a schematic configuration of a blood state analysis system of the present embodiment.
- the blood state analysis system 1 of the present embodiment is provided with an electrical characteristic measurement device 10 and a blood state analysis device 11.
- the server 12, the display apparatus 13, etc. may be connected to the blood state evaluation system of this embodiment as needed.
- the electrical property measuring apparatus 10 applies a voltage between a pair of electrodes provided in a sample container filled with a blood sample to be evaluated, and changes the electrical property of the blood sample over time at a specific frequency or frequency band. Is equipped with a measuring unit. Examples of the electrical characteristics measured by the electrical property measuring apparatus 10 include impedance, conductance, admittance, capacitance, dielectric constant, conductivity, phase angle, and an amount obtained by converting these values into electricity.
- the blood state analysis system 1 of the present embodiment can be evaluated with one of these electrical characteristics, but two or more electrical characteristics can also be used.
- the configuration of the electrical property measuring apparatus 10 is not particularly limited, and can be set as appropriate according to the electrical property to be measured.
- an impedance analyzer or a network analyzer can be used.
- the electrical characteristic measuring apparatus 10 may measure only the frequency or frequency band used in the blood condition analyzing apparatus 11 described later. However, the electrical characteristic measuring apparatus 10 was obtained by measuring the electrical characteristics in a wide band by changing the frequency. A frequency or frequency band used for evaluation can also be extracted from the spectrum.
- the blood state analysis apparatus 11 is connected to the electrical characteristic measurement apparatus 10 directly or via the network 14, and includes an analysis unit that evaluates the influence of a drug or a factor in blood on coagulation characteristics or fibrinolysis characteristics of blood. I have.
- the blood state analysis device 11 receives the time-dependent change data of the electrical characteristics measured by the electrical property measurement apparatus 10, and the analysis unit performs evaluation using the time-change data of the electrical characteristics.
- the server 12 is connected to, for example, the electrical characteristic measurement device 10, the blood state analysis device 11, the display device 13 and the like via the network 14, and is provided with an information storage unit and the like. And the server 12 manages the various data uploaded from the electrical property measuring apparatus 10 and the blood state analysis apparatus 11, and outputs it to the display apparatus 13 and the blood state analysis apparatus 11 according to a request
- the display device 13 displays the electrical property data of the blood sample measured by the electrical property measurement device 10, the evaluation result by the blood state analysis device 11, and the like.
- the display device 13 may be provided with an information input unit for selecting and inputting data to be displayed by the user. In this case, information input by the user is transmitted to the server 12 and the blood state analyzer 11 via the network 14.
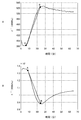
- FIG. 2 is a graph showing the time course of the complex permittivity associated with blood coagulation
- A indicates the real part ( ⁇ ′)
- B indicates the imaginary part ( ⁇ ′′)
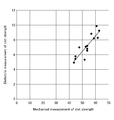
- FIG. 3 shows the blood coagulation strength. It is the figure which compared the value calculated
- the coagulation start time a and the coagulation end time b can be estimated from the time-dependent change data of the complex permittivity of blood.
- the amplitude difference between the real part and the imaginary part of the complex dielectric constant corresponds to the coagulation amplitude
- the slope of the line connecting the coagulation start time a and the coagulation end time b corresponds to the coagulation rate.
- the value of the blood coagulation strength (clotthstrength) estimated from the complex dielectric constant has a correlation with the value of the coagulation strength obtained by viscoelasticity measurement such as thromboelastometry. is there.
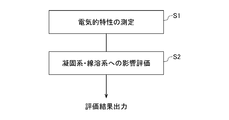
- FIG. 4 is a flowchart showing an operation example of the blood state analysis system 1 shown in FIG.
- the electrical characteristics measuring device 10 measures electrical characteristics over time at a specific frequency or frequency band for two or more blood samples having different drug concentrations. (Measurement process S1). Thereafter, by using the temporal change data of the electrical characteristics measured by the electrical property measuring apparatus 10, the blood condition analyzer 11 affects the influence of the drug or factors in the blood on the blood coagulation system or fibrinolytic system. Evaluate (analysis step S2).
- Measurement step S1 In the measurement step S1, electrical characteristics are measured over time at a specific frequency or frequency band for two or more blood samples having different types or concentrations of drugs prepared from the same blood sample.
- the measurement conditions for the electrical characteristics are not particularly limited, and can be appropriately set according to the type of electrical characteristics and the like within a range that does not alter the blood to be evaluated.
- the measurement may be performed only for the frequency or frequency band used in the analysis process described later, but it is also possible to measure the electrical characteristics in a wide band including all of the used frequency and frequency band.
- the blood state analyzer 11 may extract the frequency or frequency band used for evaluation from the obtained spectrum.
- the frequency band in which the measurement is performed is preferably in the range of 100 Hz to 100 MHz where the influence of protein is relatively small, and more preferably in the range of 1 kHz to 10 MHz.
- an activator or inhibitor for the blood coagulation system or fibrinolysis system can be used as a drug added to a blood sample.
- platelet function inhibitors such as cytochalasin D (hereinafter abbreviated as CyD), fibrinogen function inhibitors such as H-Gly-Pro-Arg-Pro-OH ⁇ AcOH (PefablocFG), fibrin polymerization inhibitors
- CyD cytochalasin D
- PefablocFG fibrinogen function inhibitors
- Plasminogen activators Plasminogen activators, plasmin inhibitors such as aprotinin and tranexamic acid, and coagulation inhibitors such as heparin.
- the blood condition analysis device 11 uses the electrical characteristics measurement device 10 to measure the change in the blood or blood coagulation system or fibrinolysis system. Evaluate the impact. For example, parameters conventionally used in the evaluation of blood coagulation system and fibrinolysis system are calculated from the time-dependent data of the electrical characteristics of each blood sample.
- parameters for evaluation of blood coagulation system and fibrinolysis system include, for example, coagulation time (ClotingTime), clot formation time (ClotFormationTime), clot maximum firmness (MaximumColtfirmness), maximum dissolution (MaximumLysis), coagulation amplitude (Coagulationamplitude ), Coagulation rate, clot firmness after elapse of a certain time from the coagulation time, clot firmness after elapse of a certain time from the maximum firmness, clot linear velocity after maximum firmness, and the like.
- examples of the coagulation factor to be evaluated include platelet factor and fibrinogen.
- a platelet function inhibitor, a fibrinogen function inhibitor, a fibrin polymerization inhibitor, or the like can be used as a drug to be added to the blood sample.
- the evaluation of these effects is based on, for example, the difference in coagulation amplitude or coagulation rate obtained from the temporal change data of the electrical characteristics of the blood sample containing no drug and the blood sample containing the drug at an arbitrary concentration. It can be carried out.
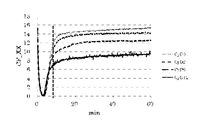
- FIG. 5 is a diagram showing the change with time of the real part ( ⁇ ′) of the complex dielectric constant at 10 MHz of blood samples having different CyD concentrations.
- FIG. 6 is a diagram showing the difference between the value of the blood sample having a CyD concentration of 0 ⁇ g / ml and the value of other blood samples in the real part ( ⁇ ′) of the complex dielectric constant at 10 MHz shown in FIG. .
- FIG. 5 it can be seen that the value of ⁇ ′ at 10 MHz and its change with time change depending on the CyD concentration.
- FIG. 6 it can be seen that the higher the CyD concentration, the greater the effect.
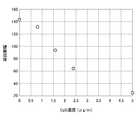
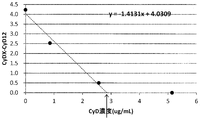
- FIG. 7 is a diagram showing the relationship between the coagulation amplitude obtained from the real part ( ⁇ ′) of the complex dielectric constant and the CyD concentration.
- the minimum drug dosage for completely eliminating the influence of the target factor contained in the blood For example, in the case of CyD, the coagulation rate does not change when the concentration exceeds a certain level. Therefore, 3.3 ⁇ g / ml, which coincides with the coagulation rate of a blood sample excessively containing CyD shown by the broken line in FIG. It is estimated to be the minimum drug dose for completely suppressing In the case of the blood sample shown in FIG. 8, since the number of platelets is 136500 per ⁇ l, the CyD amount for inhibiting platelet factor is 25 ng per platelet.
- examples of the coagulation factor to be evaluated include plasminogen and plasmin.
- an active agent or inhibitor of plasminogen or plasmin can be used as a drug to be added to the blood sample.
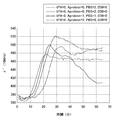
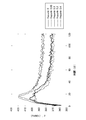
- FIG. 9 is a graph showing the change with time of the real part ( ⁇ ′) of the complex dielectric constant at 10 MHz of blood samples having different fibrinolytic accelerator (tPA) and fibrinolytic inhibitor (aprotinin) concentrations.
- FIG. 9 shows values measured using a fibrinolytic blood sample artificially prepared by adding tPA, which is a fibrinolytic promoter, to the blood.
- Evaluation of fibrinolytic blood is, for example, a value obtained by dividing the amplitude after 30 minutes from the time B shown in FIG. 2 by the amplitude of the time B (LI30: after a certain time has elapsed from the maximum firmness associated with fibrinolysis. Clot firm source) can be used as an evaluation parameter.
- FIG. 10 is a diagram showing the value of the evaluation parameter calculated from the value of ⁇ ′ at 10 MHz shown in FIG. As shown in FIG. 10, it can be seen that by adding aprotinin, which is a fibrinolytic inhibitor, to blood, the value of LI30, which is an evaluation parameter, returns to that of a control blood sample to which no drug is added.
- the evaluation of the fibrinolytic system is not limited to the method described above, and can be performed at a frequency other than 10 MHz, such as 100 kHz, for example.
- the evaluation can also use parameters related to the fibrinolytic system. Other values may be used.
- the blood state analysis method of the present embodiment is not limited to the above-described evaluation items and evaluation methods, and for example, heparin can be used as a drug, and the blood coagulation inhibitory effect by heparin can be evaluated.
- FIG. 11 is a diagram showing the change over time of the real part ( ⁇ ′) of the complex dielectric constant at 10 MHz of blood samples having different heparin concentrations
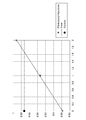
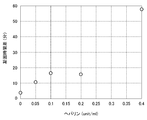
- FIG. 12 shows the clotting time obtained from the value of ⁇ ′ at 10 MHz shown in FIG. It is a figure which shows the relationship with a heparin density
- FIG. 13 is a diagram showing a coagulation curve of blood samples having different heparin concentrations
- FIG. 14 is a diagram showing a relationship between the heparin concentration and a difference in coagulation time.
- the value of ⁇ ′ at 10 MHz and its time-varying characteristics change according to the heparin concentration.
- the coagulation time becomes longer as the heparin concentration increases, and that the higher the heparin concentration, the greater the effect. Therefore, the influence of heparin can be evaluated by, for example, the coagulation time shown in FIG.
- the amount of heparin in the blood sample can be estimated by obtaining the difference in coagulation time between the blood sample to which heparin has been added and the blood sample to which heparin has not been added.
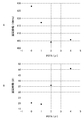
- FIG. 15A is a diagram showing the relationship between fibrinogen inhibitor (Pefabloc) concentration and coagulation amplitude
- FIG. 15B is a diagram showing the relationship with coagulation time.
- the fibrinogen inhibitor (Pefabloc) concentration in the blood sample increases, the clotting amplitude and the clotting time change. Therefore, by using this characteristic, it is possible to evaluate the effect of fibrinogen and The amount can be estimated.
- Such a computer program may be stored in a recording medium such as a magnetic disk, an optical disk, a magneto-optical disk, or a flash memory, and may be distributed via a network.
- the blood state analysis system of the present embodiment since the temporal change data of electrical characteristics is used for the evaluation, it is possible to evaluate the influence of a specific factor that could not be observed by the conventional evaluation method. is there. Thereby, an evaluation result with higher reliability than the conventional one can be obtained.
- the blood state analysis system of the present embodiment can accurately evaluate a blood coagulation system or fibrinolysis system by a simple method and in a short time measurement.
- the measurement device and the analysis device are provided separately, but these may be integrated.
- the analysis device can also perform evaluation based on data measured in advance.
- FIG. 16 is a flowchart showing another example of the operation of the blood state analyzing apparatus according to this modification. Specifically, as shown in FIG. 16, in the blood state analysis system of this modification, data correction is performed in the analysis step S2.
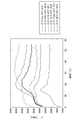
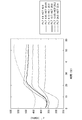
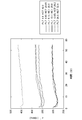
- FIG. 17 is a diagram showing the change with time of the real part ( ⁇ ′) of the complex dielectric constant at 1 MHz of blood samples having different PLT and HCT.
- FIG. 18 is a diagram showing the change with time of the real part ( ⁇ ′) of the complex dielectric constant at 10 MHz of blood samples having different PLT and HCT.
- FIG. 19 is a coagulation curve when CyD is excessively added to the blood sample shown in FIG. 18. From this figure, it is possible to observe the coagulation process in a state where the influence of platelets is completely eliminated.
- FIG. 20 is a diagram showing the difference between the values shown in FIG. 18 and the values shown in FIG. 19, from which the influence of platelets and the influence of fibrinogen-platelet interaction on coagulation can be observed.
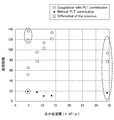
- FIG. 21 is a graph showing the relationship between the coagulation rate estimated from the real part ( ⁇ ′) of the complex dielectric constant and the platelet concentration.
- FIG. 22 is a diagram showing the relationship between the coagulation amplitude estimated from the real part ( ⁇ ′) of the complex dielectric constant and the platelet concentration.
- the data indicated by circles ( ⁇ ) in FIG. 21 and FIG. 22 is data without CyD addition extracted from the data in FIG. 17, and the data indicated by ⁇ is data of CyD excess addition extracted from the data in FIG. 18. .
- the data indicated by the squares ( ⁇ ) in FIGS. 21 and 22 show these differences, that is, the influence of platelets and the influence of the interaction between fibrinogen and platelets on coagulation.
- the “effective concentration” refers to the concentration of molecules, cells, etc. that are actually functioning for a predetermined reaction.
- the platelet concentration is simply the number of platelets contained in a certain blood sample, while the effective platelet concentration in the blood coagulation reaction is the number of platelets that actually function in the blood coagulation reaction. That is, when a drug or the like that suppresses the function of platelets is added, the effective platelet concentration decreases.
- the data indicated by circles and the data indicated by squares depend on the platelet count.
- the data surrounded by a broken line in FIGS. 21 and 22 corresponds to the blood sample with a small number of platelets and the blood sample with a large number of platelets shown in FIGS.
- These blood samples are different in HCT from other blood samples.
- the correlation between the blood coagulation rate and the amplitude is different from the platelet count. For this reason, correction is necessary for the data of these blood samples.
- FIG. 23 shows the values shown in FIG. 21 corrected by HCT (normalized by the fourth power of HCT). As shown in FIG. 23, as a result of correcting the data of FIG. 21 by HCT, the relationship with the platelet count is a straight line. Moreover, when taking the coagulation difference with and without CyD from one specimen, HCT and platelet count can be estimated by dielectric measurement of the two coagulation curves.
- the present disclosure can take the following configurations. (1) Using two or more blood samples with different types or concentrations of a drug prepared from one blood sample, using the time-dependent data of electrical characteristics measured at a specific frequency or frequency band, the drug or the blood A blood state analysis apparatus comprising at least an analysis unit for evaluating the influence of the factor on the blood coagulation system or fibrinolysis system. (2) The blood condition analyzing apparatus according to (1), wherein the drug is an activator or inhibitor for the blood coagulation system or fibrinolysis system.
- the analysis unit determines the clotting time, clot formation time, clot maximum firmness, maximum dissolution, clotting amplitude, clotting rate, clot firmness after a certain time from the clotting time, At least one value selected from the group consisting of the clot firmness after a certain period of time from the maximum firmness and the clot linear velocity after the maximum firmness is calculated, and the evaluation is performed based on the calculated value (1) or (2 ) Blood state analysis device.
- the analysis unit corrects the calculated value by a hematocrit value of the blood sample.
- the blood state analyzing apparatus evaluates the influence of platelet factor and / or fibrinogen on the blood coagulation system.
- the drug is a platelet function inhibitor, a fibrinogen function inhibitor, or a fibrin polymerization inhibitor.
- the analysis unit is based on a difference in time-dependent data of electrical characteristics of a blood sample not containing the drug and a blood sample containing the drug at an arbitrary concentration, or a difference in values calculated from the time-change data.
- the blood state analysis apparatus according to (5) or (6), wherein the influence of the drug is evaluated.
- the blood state analysis apparatus according to any one of (5) to (7), wherein the analysis unit estimates a minimum drug dose for eliminating an influence of a target factor contained in the blood sample.
- the blood state analysis device according to any one of (1) to (4), wherein the analysis unit evaluates an influence of plasmin or plasminogen on the blood fibrinolytic system.
- the blood condition analyzing apparatus according to (9), wherein the drug is plasminogen or a plasmin activator or inhibitor.
- the analysis unit evaluates the influence of plasmin or plasminogen by comparing time-dependent data of electrical characteristics of a blood sample not containing the drug and a blood sample containing the drug at an arbitrary concentration (9) or (10) The blood state analyzing apparatus according to (10).
- the blood condition analysis apparatus according to any one of (1) to (4), wherein the drug is heparin, and the analysis unit evaluates a blood coagulation inhibitory effect of the heparin.
- An electrical characteristic measuring apparatus comprising a measuring unit that measures electrical characteristics over time at a specific frequency or frequency band for two or more blood samples having different types or concentrations of drugs prepared from one blood sample; Blood provided with an analysis unit that evaluates the influence of the drug or the factor in the blood on the coagulation system or fibrinolysis system of the blood by using the temporal change data of the electrical characteristics measured by the electrical characteristic measuring device
- a blood state analysis system comprising: a state analysis device.
- the said server has the said electrical property via a network.
- CyD or Pefabloc was added to a blood sample collected from a healthy person, and the change in complex permittivity during the coagulation process was measured.
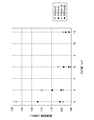
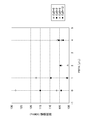
- the CyD concentration and Pefabloc concentration of each blood sample are shown in Table 1 below.
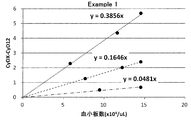
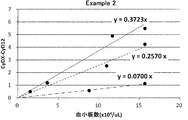
- FIG. 24 shows the results of examining the relationship between the CyD concentration and the coagulation amplitude for a plurality of samples having different Pefabloc concentrations.
- FIG. 25 shows the relationship between the Pefabloc concentration and the coagulation amplitude for a plurality of samples having different CyD concentrations. It is the result of investigation.
- clot firm CF depends on the effective concentration PLT of platelets and the effective concentration FIB of fibrinogen. Note that a, b, and c in Equation 1 below are parameters obtained by measurement.
- the effective platelet concentration PLT can be estimated from CyD concentration-dependent data.
- the effective concentration FIB of fibrinogen can be estimated from data on the concentration dependency of PFG.
- the effective concentration FIB of fibrinogen can be estimated from the above equation 2.
- the effective platelet concentration PLT can be estimated from the above equation 3.
- the effective platelet concentration PLT is 3.4 ⁇ g / ml (equivelent CyD) and the effective fibrinogen concentration FIB is 1000 ⁇ g / ml (equivelent PFG)
- a is 30.88 ml / MG (eqCyD) and b is 0. 105 ml / MG (eqPFG), c becomes -0.024 ml / MG (eqCyD).
- the effective concentration FIB of fibrinogen is calculated to be about 9640 ⁇ g / ml (equivalent PFG), and the effective concentration PLT of platelets is calculated to be about 1.1 ⁇ g / ml (equivalent CyD).
- Example 2 in blood coagulation measurement using electrical characteristics, it was confirmed how the effective concentration of platelets and the effective concentration of fibrinogen in the blood sample affect the amplitude.
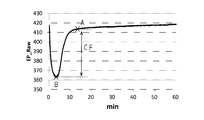
- FIG. 26 is a diagram showing an example of a change with time of the real part of the complex dielectric constant accompanying blood coagulation.
- A the measured value of a certain time
- B the minimum value of the measured value
- the value (corrected to reduce the value) was defined as the amplitude CF (Formula 8 below).
- the examination time was defined from the blood sample to which Pefabloc was not added. Specifically, from the measurement result of the blood sample to which Pefabloc was not added, 10 minutes, in which the clotting time was determined by most data, was defined as the examination time (FIG. 27).
- CyD suppresses platelet function but does not reduce platelets themselves. Therefore, a multi-item automatic blood cell counter (trade name “pocH” (registered trademark), manufactured by Sysmex Corporation) was used.
- the number of platelets is the same as that of the blood sample to which CyD is not added even for the blood sample to which CyD is added. Therefore, since the number of actually functioning platelets was not known, the number of functioning platelets was calculated from the CyD concentration by the following method.
- the number of platelets when the CyD concentration was 0 was calculated from the average of the number of platelets at each CyD concentration measured with a multi-item automatic blood cell counter.
- A is the number of platelets at a concentration at which no functioning platelets are present, and B is the average of the number of platelets at each CyD concentration.
- the effective concentration of fibrinogen measured with a fibrinogen measuring device depends on the hematocrit value. Therefore, in order to obtain the result of Example 2 more accurately, the influence of the hematocrit value should be considered. Therefore, in the confirmation (1) and (2) of the model of Example 2, correction was performed using the following formula 14.
- the hematocrit value can be measured using a multi-item automatic blood cell counter or the like, or can be calculated from the initial value of blood coagulation measurement using electrical characteristics. Specifically, for example, when the complex dielectric constant of a blood sample is measured, the hematocrit value can be obtained from the initial value.
- FIG. 35 shows the relationship between the initial value of the complex dielectric constant and the hematocrit value.
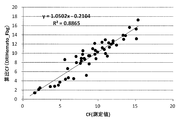
- FIG. 36 shows comparison data corresponding to FIG. 33 and FIG. 37 shows comparison data corresponding to FIG. 34 when correction is performed using the hematocrit value measured by the multi-item automatic blood cell counter.
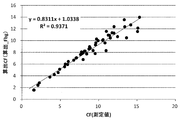
- FIG. 38 shows comparison data corresponding to FIG. 33 and FIG. 39 shows comparison data corresponding to FIG. 34 when correction is performed using the hematocrit value calculated from the initial value of the complex dielectric constant.
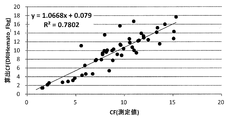
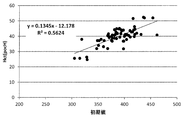
- FIG. 36 to FIG. 39 the correlation was shown as in FIG. 33 and FIG. Also, FIGS. 36 to 39 show good correlations as compared with FIGS. 33 and 34, respectively. Therefore, it was found that the correction using the hematocrit value is effective.
- the present disclosure is not limited to the above-described model, and can be set as appropriate, for example, by changing the shape of the interference term between platelets and fibrinogen or incorporating the effect of PFG and CyD.
Landscapes
- Health & Medical Sciences (AREA)
- Life Sciences & Earth Sciences (AREA)
- Chemical & Material Sciences (AREA)
- Engineering & Computer Science (AREA)
- Biomedical Technology (AREA)
- Physics & Mathematics (AREA)
- Hematology (AREA)
- Immunology (AREA)
- General Physics & Mathematics (AREA)
- General Health & Medical Sciences (AREA)
- Analytical Chemistry (AREA)
- Biochemistry (AREA)
- Pathology (AREA)
- Molecular Biology (AREA)
- Urology & Nephrology (AREA)
- Food Science & Technology (AREA)
- Medicinal Chemistry (AREA)
- Chemical Kinetics & Catalysis (AREA)
- Electrochemistry (AREA)
- Ecology (AREA)
- Biophysics (AREA)
- Microbiology (AREA)
- Cell Biology (AREA)
- Biotechnology (AREA)
- Investigating Or Analysing Biological Materials (AREA)
- Investigating Or Analyzing Materials By The Use Of Electric Means (AREA)
Abstract
Description
この血液状態解析装置では、前記薬剤として、前記血液の凝固系若しくは線溶系に対する活性剤又は抑制剤を用いることができる。
前記解析部は、各血液試料の電気的特性の経時変化データから、凝固時間、クロット形成時間、クロットの最大堅固、最大溶解、凝固振幅、凝固率、凝固時間から一定時間経過後のクロット堅固、最大堅固から一定時間経過後のクロット堅固及び最大堅固後のクロット線速度からなる群から選択される少なくとも1種の値を算出し、算出された値に基づいて評価を行うことができる。
その場合、前記解析部は、前記算出された値を、前記血液試料のヘマトクリット値により補正してもよい。
また、前記解析部は、前記血液の凝固系について、血小板因子による影響若しくはフィブリノゲンによる影響又はその両方を評価することもできる。
その場合、前記薬剤には、血小板機能抑制剤、フィブリノゲン機能抑制剤又はフィブリン重合抑制剤を用いることができる。
そして、前記解析部は、例えば、前記薬剤を含有しない血液試料及び任意の濃度で前記薬剤を含有する血液試料の電気的特性の経時変化データの差、又は、前記経時変化データから算出した値の差に基づいて、前記薬剤の影響を評価することができる。
また、前記解析部は、例えば、前記血液試料に含まれる対象因子による影響をなくすための最低限の薬剤投与量を推定することもできる。
一方、前記解析部は、前記血液の線溶系について、プラスミン又はプラスミノゲンによる影響を評価することもできる。
その場合、前記薬剤は、プラスミノゲン若しくはプラスミンの活性剤又は阻害剤を用いることができる。
そして、前記解析部は、例えば、前記薬剤を含有しない血液試料及び任意の濃度で前記薬剤を含有する血液試料の電気的特性の経時変化データを比較することにより、プラスミン又はプラスミノゲンによる影響を評価することができる。
更に、本開示の血液状態解析装置は、前記薬剤にヘパリンを使用し、前記解析部で前記ヘパリンによる血液凝固抑制効果を評価してもよい。
本開示の血液状態解析システムは、更に、前記電気的特性測定装置での測定データ及び/又は前記血液状態解析装置での解析結果を記憶する情報記憶部を備えるサーバを有し、前記サーバは、ネットワークを介して、前記電気的特性測定装置及び/又は前記血液状態解析装置と接続されていてもよい。
1.第1の実施の形態
(電気的特性から血液の凝固系・線溶系を評価する血液状態解析システムの例)
2.第1の実施の形態の変形例
(HCTにより補正を行う血液状態解析システムの例)
先ず、本開示の第1の実施形態に係る血液状態解析システムについて説明する。図1は本実施形態の血液状態解析システムの概略構成を示す図である。図1に示すように、本実施形態の血液状態解析システム1は、電気的特性測定装置10と血液状態解析装置11が設けられている。また、本実施形態の血液状態評価システムには、必要に応じて、サーバ12や表示装置13等が接続されていてもよい。
電気的特性測定装置10は、評価対象の血液試料が充填されるサンプル容器に設けられた電極対間に電圧を印加して、特定の周波数又は周波数帯域で、血液試料の電気的特性を経時的に測定する測定部を備えている。電気的特性測定装置10で測定される電気的特性は、例えばインピーダンス、コンダクタンス、アドミッタンス、キャパシタンス、誘電率、導電率、位相角及びこれらを電気量変換することにより得られる量が挙げられる。なお、本実施形態の血液状態解析システム1は、これらの電気的特性のうち1種で評価可能であるが、2種以上の電気的特性を利用することもできる。
血液状態解析装置11は、直接又はネットワーク14を介して電気的特性測定装置10に接続されており、薬剤又は血液中の因子が血液の凝固特性又は線溶特性に及ぼす影響を評価する解析部を備えている。この血液状態解析装置11には、電気的特性測定装置10で測定された電気的特性の経時変化データが入力され、解析部は電気的特性の経時変化データを利用して評価を行う。
サーバ12は、例えば、ネットワーク14を介して電気的特性測定装置10、血液状態解析装置11及び表示装置13等と接続されており、情報記憶部等が設けられている。そして、サーバ12は、電気的特性測定装置10や血液状態解析装置11からアップロードされた各種データを管理し、要求に応じて表示装置13や血液状態解析装置11に出力する。
表示装置13は、電気的特性測定装置10で測定された血液試料の電気的特性データや血液状態解析装置11での評価結果等を表示する。なお、表示装置13には、ユーザが表示するデータを選択し入力するための情報入力部が設けられていてもよい。この場合、ユーザにより入力された情報は、ネットワーク14を介してサーバ12や血液状態解析装置11に送信される。
次に、本実施形態の血液状態解析システムの動作、即ち、血液状態解析システムを用いて、血液試料の凝固系や線溶系を評価する方法について説明する。図2は血液凝固に伴う複素誘電率の経時変化を示す図であり、Aは実数部(ε´)を示し、Bは虚数部(ε”)を示す。また、図3は血液の凝固強さ(clot strength)について、粘弾性測定により求めた値と、誘電率から推定した値を比較した図である。
測定工程S1では、同一の血液検体から調整された薬剤の種類又は濃度が異なる2以上の血液試料について、特定の周波数又は周波数帯域で、電気的特性を経時的に測定する。その際、電気的特性の測定条件は、特に限定されるものではなく、評価対象の血液を変質させない範囲で、電気的特性の種類等に応じて適宜設定することができる。
解析工程S2では、電気的特性測定装置10で測定された電気的特性の経時変化データを利用して、血液状態解析装置11において、薬剤又は血液中の因子が前記血液の凝固系又は線溶系に及ぼす影響を評価する。例えば、各血液試料の電気的特性の経時変化データから、従来、血液の凝固系や線溶系の評価で用いられているパラメータを算出する。ここで、血液の凝固系や線溶系の評価用パラメータとしては、例えば、凝固時間(ClotingTime)、クロット形成時間(ClotFormationTime)、クロットの最大堅固(MaximumColtfirmness)、最大溶解(MaximumLysis)、凝固振幅(Coagulationamplitude)、凝固率(Coagulationrate)、凝固時間から一定時間経過後のクロット堅固、最大堅固から一定時間経過後のクロット堅固、最大堅固後のクロット線速度等が挙げられる。
本開示の血液状態解析システムでは、電気的特性の経時変化データから推定されたパラメータをそのまま評価に用いることもできるが、これらの推定値を、血液のヘマトクリット値(HCT)を用いてデータを補正してもよい。図16は本変形例の血液状態解析装置の他の動作例を示すフローチャート図である。具体的には、図16に示すように、本変形例の血液状態解析システムでは、解析工程S2において、データ補正を行う。
(1)
一の血液検体から調整された薬剤の種類又は濃度が異なる2以上の血液試料について、特定の周波数又は周波数帯域において測定された電気的特性の経時変化データを利用して、前記薬剤又は前記血液中の因子が前記血液の凝固系又は線溶系に及ぼす影響を評価する解析部を少なくとも備える血液状態解析装置。
(2)
前記薬剤は、前記血液の凝固系若しくは線溶系に対する活性剤又は抑制剤である(1)に記載の血液状態解析装置。
(3)
前記解析部は、各血液試料の電気的特性の経時変化データから、凝固時間、クロット形成時間、クロットの最大堅固、最大溶解、凝固振幅、凝固率、凝固時間から一定時間経過後のクロット堅固、最大堅固から一定時間経過後のクロット堅固及び最大堅固後のクロット線速度からなる群から選択される少なくとも1種の値を算出し、算出された値に基づいて評価を行う(1)又は(2)に記載の血液状態解析装置。
(4)
前記解析部は、前記算出された値を、前記血液試料のヘマトクリット値により補正する(3)に記載の血液状態解析装置。
(5)
前記解析部は、前記血液の凝固系について、血小板因子による影響若しくはフィブリノゲンによる影響又はその両方を評価する(1)~(4)のいずれかに記載の血液状態解析装置。
(6)
前記薬剤は、血小板機能抑制剤、フィブリノゲン機能抑制剤又はフィブリン重合抑制剤である(5)に記載の血液状態解析装置。
(7)
前記解析部は、前記薬剤を含有しない血液試料及び任意の濃度で前記薬剤を含有する血液試料の電気的特性の経時変化データの差、又は、前記経時変化データから算出した値の差に基づいて、前記薬剤の影響を評価する(5)又は(6)に記載の血液状態解析装置。
(8)
前記解析部は、前記血液試料に含まれる対象因子の影響をなくすための最低限の薬剤投与量を推定する(5)~(7)のいずれかに記載の血液状態解析装置。
(9)
前記解析部は、前記血液の線溶系について、プラスミン又はプラスミノゲンによる影響を評価する(1)~(4)のいずれかに記載の血液状態解析装置。
(10)
前記薬剤は、プラスミノゲン若しくはプラスミンの活性剤又は阻害剤である(9)に記載の血液状態解析装置。
(11)
前記解析部は、前記薬剤を含有しない血液試料及び任意の濃度で前記薬剤を含有する血液試料の電気的特性の経時変化データを比較することにより、プラスミン又はプラスミノゲンによる影響を評価する(9)又は(10)に記載の血液状態解析装置。
(12)
前記薬剤はヘパリンであり、前記解析部は前記ヘパリンによる血液凝固抑制効果を評価する(1)~(4)のいずれかに記載の血液状態解析装置。
(13)
一の血液検体から調整された薬剤の種類又は濃度が異なる2以上の血液試料について、特定の周波数又は周波数帯域で、電気的特性を経時的に測定する測定部を備える電気的特性測定装置と、 前記電気的特性測定装置で測定された電気的特性の経時変化データを利用して、前記薬剤又は前記血液中の因子が前記血液の凝固系又は線溶系に及ぼす影響を評価する解析部を備える血液状態解析装置と、を有する血液状態解析システム。
(14)
更に、前記電気的特性測定装置での測定データ及び/又は前記血液状態解析装置での解析結果を記憶する情報記憶部を備えるサーバを有し、 前記サーバは、ネットワークを介して、前記電気的特性測定装置及び/又は前記血液状態解析装置と接続されている(13)に記載の血液状態解析システム。
(15)
一の血液検体から調整された薬剤の種類又は濃度が異なる2以上の血液試料について、特定の周波数又は周波数帯域で、電気的特性を経時的に測定する測定工程と、前記測定工程で測定された電気的特性の経時変化データを利用して、前記薬剤又は前記血液中の因子が前記血液の凝固系又は線溶系に及ぼす影響を評価する解析工程と、を有する血液状態解析方法。
(16)
一の血液検体から調整された薬剤の種類又は濃度が異なる2以上の血液試料について、特定の周波数又は周波数帯域において測定された電気的特性の経時変化データを利用して、前記薬剤又は前記血液中の因子が前記血液の凝固系又は線溶系に及ぼす影響を評価する解析機能を、コンピュータに実現させるためのプログラム。








図26は、血液凝固に伴う複素誘電率の実数部の経時変化の例を示す図である。ある時間の測定値をA、測定値の最小値をBとしたとき、AをBで割ったもの(Min規格)から1を引いたもの(Min測定値を0としたとき)を、100倍したもの(値が小さくなるために補正)を、振幅CFと規定した(下記数式8)。

血液試料中にフィブリノゲンが存在しない場合又は血液試料中のフィビリノゲンが機能しない場合には振幅CFは出ないこと、血液試料中に血小板が存在しない場合又は血液試料中の血小板が機能しない場合には振幅CFはフィブリノゲンの実効濃度FIBのみに依存することから、下記数式9のモデルを仮定した。なお、a及びbは定数、PLTは血小板の実効濃度、FIBはフィブリノゲンの実効濃度である。

Pefablocを添加した血液試料では、Pefablocがフィブリノゲンに継続的に効いている可能性があることから、Pefabloc無添加の血液試料から検討時間の規定を行った。具体的には、Pefablocを添加していない血液試料の測定結果から、ほとんどのデータで凝固時間が決定される10分を検討時間として規定した(図27)。
CyDにより血小板の機能が抑制されている場合、振幅CFは、フィブリノゲンの実効濃度FIBに依存的に変化するため、CyDにより血小板の機能が抑制されている血液試料の振幅CFとフィブリノゲンの実効濃度FIBとの関係について確認を行った。CyDにより血小板の機能が完全に抑制されている血液試料の振幅CFとフィブリノゲンの実効濃度FIBとの関係を図28に示す。




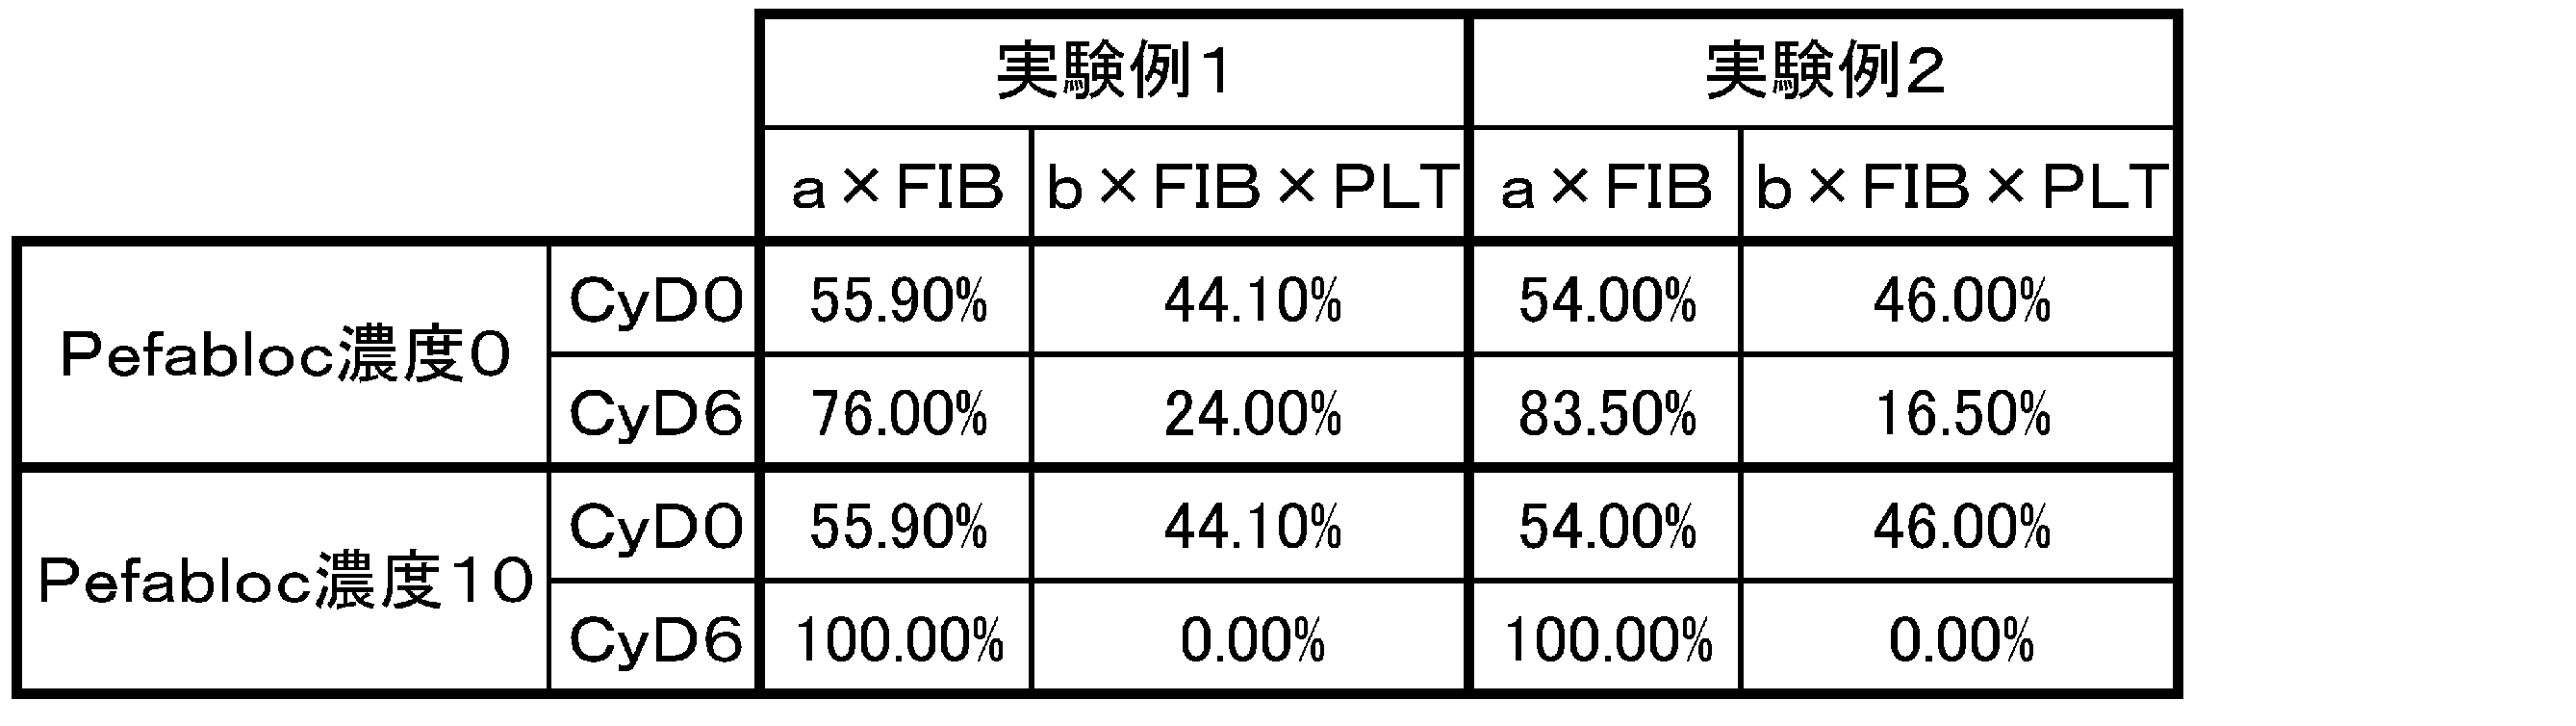
前記数式9のa×フィブリノゲンの実効濃度FIBと、b×フィブリノゲンの実効濃度FIB×血小板の実効濃度PLTのそれぞれの成分が、振幅CFに寄与する割合を算出した。算出した結果を下記表2に示す。なお、フィブリノゲンの実効濃度については、前述の図28から求めたaの値を用いて、振幅CFから算出した。
<フィブリノゲン測定装置で測定したフィブリノゲンの実効濃度を用いた場合>
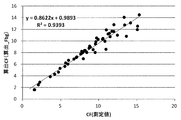
フィブリノゲン測定装置(商品名「DRIHemato」(登録商標)、A&T社製)で測定したフィブリノゲンの実効濃度と、多項目自動血球計数装置(商品名「pocH」(登録商標)、シスメックス社製)を用いて測定した血小板数から前記数式9を用いて算出した振幅CFと、実際の測定振幅CFとの相関を調べた。結果を図33に示す。
図28から算出したフィブリノゲンの実効濃度と、多項目自動血球計数装置(商品名「pocH」(登録商標)、シスメックス社製)を用いて測定した血小板数から前記数式9を用いて算出した振幅CFと、実際の測定振幅CFとの相関を調べた。結果を図34に示す。

また、複素誘電率の初期値から算出したヘマトクリット値を使用すると、前記数式9の係数は、a=0.0304、b=0.0017となった。
また、複素誘電率の初期値から算出したヘマトクリット値を使用して補正した場合の図33に対応する比較データを図38に、図34に対応する比較データを図39にそれぞれ示す。
10 電気的特性測定装置
11 血液状態解析装置
12 サーバ
13 表示装置
14 ネットワーク
Claims (16)
- 一の血液検体から調整された薬剤の種類又は濃度が異なる2以上の血液試料について、特定の周波数又は周波数帯域において測定された電気的特性の経時変化データを利用して、前記薬剤又は前記血液中の因子が前記血液の凝固系又は線溶系に及ぼす影響を評価する解析部を少なくとも備える血液状態解析装置。
- 前記薬剤は、前記血液の凝固系若しくは線溶系に対する活性剤又は抑制剤である請求項1に記載の血液状態解析装置。
- 前記解析部は、各血液試料の電気的特性の経時変化データから、凝固時間、クロット形成時間、クロットの最大堅固、最大溶解、凝固振幅、凝固率、凝固時間から一定時間経過後のクロット堅固、最大堅固から一定時間経過後のクロット堅固及び最大堅固後のクロット線速度からなる群から選択される少なくとも1種の値を算出し、算出された値に基づいて評価を行う請求項1に記載の血液状態解析装置。
- 前記解析部は、前記算出された値を、前記血液試料のヘマトクリット値により補正する請求項3に記載の血液状態解析装置。
- 前記解析部は、前記血液の凝固系について、血小板因子による影響若しくはフィブリノゲンによる影響又はその両方を評価する請求項1に記載の血液状態解析装置。
- 前記薬剤は、血小板機能抑制剤、フィブリノゲン機能抑制剤又はフィブリン重合抑制剤である請求項5に記載の血液状態解析装置。
- 前記解析部は、前記薬剤を含有しない血液試料及び任意の濃度で前記薬剤を含有する血液試料の電気的特性の経時変化データの差、又は、前記経時変化データから算出した値の差に基づいて、前記薬剤の影響を評価する請求項6に記載の血液状態解析装置。
- 前記解析部は、前記血液試料に含まれる対象因子による影響をなくすための最低限の薬剤投与量を推定する請求項6に記載の血液状態解析装置。
- 前記解析部は、前記血液の線溶系について、プラスミン又はプラスミノゲンによる影響を評価する請求項1に記載の血液状態解析装置。
- 前記薬剤は、プラスミノゲン若しくはプラスミンの活性剤又は阻害剤である請求項9に記載の血液状態解析装置。
- 前記解析部は、前記薬剤を含有しない血液試料及び任意の濃度で前記薬剤を含有する血液試料の電気的特性の経時変化データを比較することにより、プラスミン又はプラスミノゲンによる影響を評価する請求項10に記載の血液状態解析装置。
- 前記薬剤はヘパリンであり、前記解析部は前記ヘパリンによる血液凝固抑制効果を評価する請求項1に記載の血液状態解析装置。
- 一の血液検体から調整された薬剤の種類又は濃度が異なる2以上の血液試料について、特定の周波数又は周波数帯域で、電気的特性を経時的に測定する測定部を備える電気的特性測定装置と、
前記電気的特性測定装置で測定された電気的特性の経時変化データを利用して、前記薬剤又は前記血液中の因子が前記血液の凝固系又は線溶系に及ぼす影響を評価する解析部を備える血液状態解析装置と、
を有する血液状態解析システム。 - 更に、前記電気的特性測定装置での測定データ及び/又は前記血液状態解析装置での解析結果を記憶する情報記憶部を備えるサーバを有し、
前記サーバは、ネットワークを介して、前記電気的特性測定装置及び/又は前記血液状態解析装置と接続されている請求項13に記載の血液状態解析システム。 - 一の血液検体から調整された薬剤の種類又は濃度が異なる2以上の血液試料について、特定の周波数又は周波数帯域で、電気的特性を経時的に測定する測定工程と、
前記測定工程で測定された電気的特性の経時変化データを利用して、前記薬剤又は前記血液中の因子が前記血液の凝固系又は線溶系に及ぼす影響を評価する解析工程と、
を有する血液状態解析方法。 - 一の血液検体から調整された薬剤の種類又は濃度が異なる2以上の血液試料について、特定の周波数又は周波数帯域において測定された電気的特性の経時変化データを利用して、前記薬剤又は前記血液中の因子が前記血液の凝固系又は線溶系に及ぼす影響を評価する解析機能を、コンピュータに実現させるためのプログラム。
Priority Applications (3)
| Application Number | Priority Date | Filing Date | Title |
|---|---|---|---|
| US15/303,059 US20170030891A1 (en) | 2014-04-17 | 2015-03-16 | Blood condition analysis device, blood condition analysis system, blood condition analysis method, and program |
| EP15780046.7A EP3133390A4 (en) | 2014-04-17 | 2015-03-16 | Blood state analysis device, blood state analysis system, blood state analysis method, and program |
| JP2016513674A JP6607186B2 (ja) | 2014-04-17 | 2015-03-16 | 血液状態解析装置、血液状態解析システム、血液状態解析方法及びプログラム |
Applications Claiming Priority (2)
| Application Number | Priority Date | Filing Date | Title |
|---|---|---|---|
| JP2014085859 | 2014-04-17 | ||
| JP2014-085859 | 2014-04-17 |
Publications (1)
| Publication Number | Publication Date |
|---|---|
| WO2015159623A1 true WO2015159623A1 (ja) | 2015-10-22 |
Family
ID=54323838
Family Applications (1)
| Application Number | Title | Priority Date | Filing Date |
|---|---|---|---|
| PCT/JP2015/057647 Ceased WO2015159623A1 (ja) | 2014-04-17 | 2015-03-16 | 血液状態解析装置、血液状態解析システム、血液状態解析方法及びプログラム |
Country Status (4)
| Country | Link |
|---|---|
| US (1) | US20170030891A1 (ja) |
| EP (1) | EP3133390A4 (ja) |
| JP (2) | JP6607186B2 (ja) |
| WO (1) | WO2015159623A1 (ja) |
Cited By (9)
| Publication number | Priority date | Publication date | Assignee | Title |
|---|---|---|---|---|
| WO2017141508A1 (ja) | 2016-02-17 | 2017-08-24 | ソニー株式会社 | 血小板凝集能解析装置、血小板凝集能解析システム、血小板凝集能解析用プログラム及び血小板凝集能の解析方法 |
| WO2017168897A1 (ja) * | 2016-03-30 | 2017-10-05 | ソニー株式会社 | 血液状態解析装置、血液状態解析システム、血液状態解析方法、及びプログラム |
| WO2017169261A1 (ja) * | 2016-03-29 | 2017-10-05 | ソニー株式会社 | 血液凝固系解析システム、血液凝固系解析方法及び血液凝固系解析用プログラム |
| WO2017168885A1 (ja) * | 2016-03-28 | 2017-10-05 | ソニー株式会社 | 電気的特性測定装置、電気的特性測定システム、電気的特性測定方法、及びプログラム |
| WO2018128002A1 (ja) * | 2017-01-06 | 2018-07-12 | ソニー株式会社 | 血液凝固系解析装置、血液凝固系解析システム、血液凝固系解析方法、及び血液凝固系解析用プログラム、並びに、出血量予測装置、出血量予測システム、出血量予測方法、及び出血量予測用プログラム |
| JP2019191033A (ja) * | 2018-04-26 | 2019-10-31 | シスメックス株式会社 | 血液分析方法、血液分析装置、およびプログラム |
| JP2020041867A (ja) * | 2018-09-07 | 2020-03-19 | ソニー株式会社 | 血液凝固系解析装置、血液凝固系解析方法及び血液凝固系解析プログラム |
| JP2022021299A (ja) * | 2020-07-21 | 2022-02-02 | ソニーグループ株式会社 | 血液凝固系解析装置、血液凝固系測定装置、血液凝固系測定システム、血液凝固系解析方法及び血液凝固系測定方法 |
| US11982667B2 (en) | 2018-10-25 | 2024-05-14 | Sony Corporation | Platelet aggregation capacity analyzer, analysis method, and analysis system using complex dielectric permittivity |
Families Citing this family (2)
| Publication number | Priority date | Publication date | Assignee | Title |
|---|---|---|---|---|
| WO2015159583A1 (ja) | 2014-04-17 | 2015-10-22 | ソニー株式会社 | 血液状態解析装置、血液状態解析システム、血液状態解析方法、及び該方法をコンピューターに実現させるための血液状態解析プログラム |
| JP6442858B2 (ja) | 2014-04-17 | 2018-12-26 | ソニー株式会社 | 血液状態解析装置、血液状態解析システム、血液状態解析方法、および該方法をコンピューターに実現させるための血液状態解析プログラム |
Citations (6)
| Publication number | Priority date | Publication date | Assignee | Title |
|---|---|---|---|---|
| JPH0743388B2 (ja) * | 1990-05-29 | 1995-05-15 | 日立化成工業株式会社 | 血液凝固に伴うゲル化反応の測定法,測定装置及び測定用素子 |
| JP2007064916A (ja) * | 2005-09-02 | 2007-03-15 | Tosoh Corp | 抗凝固活性を有する薬剤の評価方法 |
| WO2010079845A1 (ja) * | 2009-01-08 | 2010-07-15 | ソニー株式会社 | 血液凝固系解析装置、血液凝固系解析方法及びプログラム |
| JP4921359B2 (ja) * | 2005-04-01 | 2012-04-25 | キッセイ薬品工業株式会社 | 高感度血液学的アッセイ及び試薬 |
| JP2012194087A (ja) * | 2011-03-17 | 2012-10-11 | Sony Corp | 血液凝固系解析方法および血液凝固系解析装置 |
| JP2013221782A (ja) * | 2012-04-13 | 2013-10-28 | Sony Corp | 血液凝固系解析装置、血液凝固系解析方法及びそのプログラム |
Family Cites Families (8)
| Publication number | Priority date | Publication date | Assignee | Title |
|---|---|---|---|---|
| US4810090A (en) * | 1987-08-24 | 1989-03-07 | Cobe Laboratories, Inc. | Method and apparatus for monitoring blood components |
| US6200532B1 (en) * | 1998-11-20 | 2001-03-13 | Akzo Nobel Nv | Devices and method for performing blood coagulation assays by piezoelectric sensing |
| US7179652B2 (en) * | 1999-02-22 | 2007-02-20 | Haemoscope Corporation | Protocol for monitoring platelet inhibition |
| JP4839010B2 (ja) * | 2005-03-29 | 2011-12-14 | シスメックス株式会社 | 分析システム、データ処理装置、及びアプリケーションプログラム |
| JP6393453B2 (ja) * | 2010-01-14 | 2018-09-19 | バクスアルタ ゲーエムベーハー | 出血性障害を治療するための方法及び組成物 |
| JP6035329B2 (ja) * | 2011-05-26 | 2016-11-30 | ザ ジェネラル ホスピタル コーポレイション | 光学的トロンボエラストグラフィーシステム及び血液凝固基準の評価方法 |
| JP2015503767A (ja) * | 2012-01-16 | 2015-02-02 | エイブラム サイエンティフィック,インコーポレーテッド | 流体の物理的特性を測定するための方法、デバイス、およびシステム |
| AU2013235567A1 (en) * | 2012-03-22 | 2014-10-09 | Baxalta GmbH | Aptamers to tissue factor pathway inhibitor and their use as bleeding disorder therapeutics |
-
2015
- 2015-03-16 JP JP2016513674A patent/JP6607186B2/ja active Active
- 2015-03-16 WO PCT/JP2015/057647 patent/WO2015159623A1/ja not_active Ceased
- 2015-03-16 US US15/303,059 patent/US20170030891A1/en not_active Abandoned
- 2015-03-16 EP EP15780046.7A patent/EP3133390A4/en not_active Withdrawn
-
2019
- 2019-10-24 JP JP2019193819A patent/JP6930568B2/ja active Active
Patent Citations (6)
| Publication number | Priority date | Publication date | Assignee | Title |
|---|---|---|---|---|
| JPH0743388B2 (ja) * | 1990-05-29 | 1995-05-15 | 日立化成工業株式会社 | 血液凝固に伴うゲル化反応の測定法,測定装置及び測定用素子 |
| JP4921359B2 (ja) * | 2005-04-01 | 2012-04-25 | キッセイ薬品工業株式会社 | 高感度血液学的アッセイ及び試薬 |
| JP2007064916A (ja) * | 2005-09-02 | 2007-03-15 | Tosoh Corp | 抗凝固活性を有する薬剤の評価方法 |
| WO2010079845A1 (ja) * | 2009-01-08 | 2010-07-15 | ソニー株式会社 | 血液凝固系解析装置、血液凝固系解析方法及びプログラム |
| JP2012194087A (ja) * | 2011-03-17 | 2012-10-11 | Sony Corp | 血液凝固系解析方法および血液凝固系解析装置 |
| JP2013221782A (ja) * | 2012-04-13 | 2013-10-28 | Sony Corp | 血液凝固系解析装置、血液凝固系解析方法及びそのプログラム |
Non-Patent Citations (1)
| Title |
|---|
| See also references of EP3133390A4 * |
Cited By (23)
| Publication number | Priority date | Publication date | Assignee | Title |
|---|---|---|---|---|
| CN108603888B (zh) * | 2016-02-17 | 2022-06-10 | 索尼公司 | 血小板聚集活性分析设备、分析系统、分析程序和分析方法 |
| WO2017141508A1 (ja) | 2016-02-17 | 2017-08-24 | ソニー株式会社 | 血小板凝集能解析装置、血小板凝集能解析システム、血小板凝集能解析用プログラム及び血小板凝集能の解析方法 |
| CN108603888A (zh) * | 2016-02-17 | 2018-09-28 | 索尼公司 | 血小板聚集活性分析设备、血小板聚集活性分析系统、血小板聚集活性分析程序和血小板聚集活性分析方法 |
| WO2017168885A1 (ja) * | 2016-03-28 | 2017-10-05 | ソニー株式会社 | 電気的特性測定装置、電気的特性測定システム、電気的特性測定方法、及びプログラム |
| JPWO2017168885A1 (ja) * | 2016-03-28 | 2019-02-07 | ソニー株式会社 | 電気的特性測定装置、電気的特性測定システム、電気的特性測定方法、及びプログラム |
| WO2017169261A1 (ja) * | 2016-03-29 | 2017-10-05 | ソニー株式会社 | 血液凝固系解析システム、血液凝固系解析方法及び血液凝固系解析用プログラム |
| US10962495B2 (en) | 2016-03-29 | 2021-03-30 | Sony Corporation | Blood coagulation system analysis system, blood coagulation system analysis method, and blood coagulation system analysis program |
| WO2017168897A1 (ja) * | 2016-03-30 | 2017-10-05 | ソニー株式会社 | 血液状態解析装置、血液状態解析システム、血液状態解析方法、及びプログラム |
| JPWO2017168897A1 (ja) * | 2016-03-30 | 2019-02-07 | ソニー株式会社 | 血液状態解析装置、血液状態解析システム、血液状態解析方法、及びプログラム |
| US11899008B2 (en) | 2016-03-30 | 2024-02-13 | Sony Group Corporation | Blood state analysis apparatus, blood state analysis system, blood state analysis method, and program |
| WO2018128002A1 (ja) * | 2017-01-06 | 2018-07-12 | ソニー株式会社 | 血液凝固系解析装置、血液凝固系解析システム、血液凝固系解析方法、及び血液凝固系解析用プログラム、並びに、出血量予測装置、出血量予測システム、出血量予測方法、及び出血量予測用プログラム |
| JPWO2018128002A1 (ja) * | 2017-01-06 | 2019-11-07 | ソニー株式会社 | 血液凝固系解析装置、血液凝固系解析システム、血液凝固系解析方法、及び血液凝固系解析用プログラム、並びに、出血量予測装置、出血量予測システム、出血量予測方法、及び出血量予測用プログラム |
| JP2022009126A (ja) * | 2017-01-06 | 2022-01-14 | ソニーグループ株式会社 | 血液凝固系解析装置、血液凝固系解析システム、血液凝固系解析方法、及び血液凝固系解析用プログラム、並びに、出血量予測装置、出血量予測システム、出血量予測方法、及び出血量予測用プログラム |
| US11650196B2 (en) | 2017-01-06 | 2023-05-16 | Sony Corporation | Blood coagulation system analysis apparatus, blood coagulation system analysis system, blood coagulation system analysis method, blood coagulation system analysis program, blood loss prediction apparatus, blood loss prediction system, blood loss prediction method, and blood loss prediction program |
| JP7192944B2 (ja) | 2017-01-06 | 2022-12-20 | ソニーグループ株式会社 | 血液凝固系解析装置、血液凝固系解析システム、血液凝固系解析方法、及び血液凝固系解析用プログラム、並びに、出血量予測装置、出血量予測システム、出血量予測方法、及び出血量予測用プログラム |
| JP2019191033A (ja) * | 2018-04-26 | 2019-10-31 | シスメックス株式会社 | 血液分析方法、血液分析装置、およびプログラム |
| US11268949B2 (en) | 2018-04-26 | 2022-03-08 | Sysmex Corporation | Blood analysis method, blood analyzer, and non-transitory computer readable medium |
| JP7221490B2 (ja) | 2018-04-26 | 2023-02-14 | シスメックス株式会社 | 血液分析方法、血液分析装置、およびプログラム |
| JP7135620B2 (ja) | 2018-09-07 | 2022-09-13 | ソニーグループ株式会社 | 血液凝固系解析装置、血液凝固系解析方法及び血液凝固系解析プログラム |
| JP2020041867A (ja) * | 2018-09-07 | 2020-03-19 | ソニー株式会社 | 血液凝固系解析装置、血液凝固系解析方法及び血液凝固系解析プログラム |
| US11982667B2 (en) | 2018-10-25 | 2024-05-14 | Sony Corporation | Platelet aggregation capacity analyzer, analysis method, and analysis system using complex dielectric permittivity |
| JP2022021299A (ja) * | 2020-07-21 | 2022-02-02 | ソニーグループ株式会社 | 血液凝固系解析装置、血液凝固系測定装置、血液凝固系測定システム、血液凝固系解析方法及び血液凝固系測定方法 |
| JP7681270B2 (ja) | 2020-07-21 | 2025-05-22 | ソニーグループ株式会社 | 血液凝固系解析装置、血液凝固系測定装置、血液凝固系測定システム、血液凝固系解析方法及び血液凝固系測定方法 |
Also Published As
| Publication number | Publication date |
|---|---|
| JP2020076766A (ja) | 2020-05-21 |
| JPWO2015159623A1 (ja) | 2017-04-13 |
| EP3133390A4 (en) | 2017-10-25 |
| US20170030891A1 (en) | 2017-02-02 |
| JP6930568B2 (ja) | 2021-09-01 |
| EP3133390A1 (en) | 2017-02-22 |
| JP6607186B2 (ja) | 2019-11-20 |
Similar Documents
| Publication | Publication Date | Title |
|---|---|---|
| JP6930568B2 (ja) | 血液状態解析装置、血液状態解析システム、血液状態解析方法及びプログラム | |
| Whiting et al. | TEG and ROTEM: technology and clinical applications | |
| JP7192944B2 (ja) | 血液凝固系解析装置、血液凝固系解析システム、血液凝固系解析方法、及び血液凝固系解析用プログラム、並びに、出血量予測装置、出血量予測システム、出血量予測方法、及び出血量予測用プログラム | |
| Karon | Why is everyone so excited about thromboelastrography (TEG)? | |
| JP6442858B2 (ja) | 血液状態解析装置、血液状態解析システム、血液状態解析方法、および該方法をコンピューターに実現させるための血液状態解析プログラム | |
| JP6579100B2 (ja) | 血液状態解析装置、血液状態解析システム、血液状態解析方法、及び該方法をコンピューターに実現させるための血液状態解析プログラム | |
| US10794896B2 (en) | Blood coagulation system examination module, blood coagulation system examination system, blood coagulation system examination method, and determination method of parameter for blood coagulation system examination module | |
| CN108132352B (zh) | 血栓弹力图仪无血清质控品及其用途 | |
| JP6747491B2 (ja) | 血液状態解析装置、血液状態解析システム、血液状態解析方法、および該方法をコンピューターに実現させるための血液状態解析プログラム | |
| US10962495B2 (en) | Blood coagulation system analysis system, blood coagulation system analysis method, and blood coagulation system analysis program | |
| JP2020041867A (ja) | 血液凝固系解析装置、血液凝固系解析方法及び血液凝固系解析プログラム | |
| JP7230429B2 (ja) | 血小板凝集能解析装置、血小板凝集能解析方法及び血小板凝集能解析システム | |
| EP3514547B1 (en) | Platelet aggregation ability analyzing method and device | |
| JPWO2017168897A1 (ja) | 血液状態解析装置、血液状態解析システム、血液状態解析方法、及びプログラム | |
| JP6973585B2 (ja) | 血小板凝集能解析方法、血小板凝集能解析装置、血小板凝集能解析用プログラム及び血小板凝集能解析システム | |
| JP6791121B2 (ja) | 電気的特性測定用試料及び電気的特性測定方法並びに電気的特性測定装置 | |
| JP2016191668A (ja) | 電気的特性測定方法、電気的特性測定装置、及び血液状態解析システム |
Legal Events
| Date | Code | Title | Description |
|---|---|---|---|
| 121 | Ep: the epo has been informed by wipo that ep was designated in this application |
Ref document number: 15780046 Country of ref document: EP Kind code of ref document: A1 |
|
| REEP | Request for entry into the european phase |
Ref document number: 2015780046 Country of ref document: EP |
|
| WWE | Wipo information: entry into national phase |
Ref document number: 15303059 Country of ref document: US Ref document number: 2015780046 Country of ref document: EP |
|
| ENP | Entry into the national phase |
Ref document number: 2016513674 Country of ref document: JP Kind code of ref document: A |
|
| NENP | Non-entry into the national phase |
Ref country code: DE |