WO2016042805A1 - 癌評価方法及び癌評価システム - Google Patents
癌評価方法及び癌評価システム Download PDFInfo
- Publication number
- WO2016042805A1 WO2016042805A1 PCT/JP2015/057005 JP2015057005W WO2016042805A1 WO 2016042805 A1 WO2016042805 A1 WO 2016042805A1 JP 2015057005 W JP2015057005 W JP 2015057005W WO 2016042805 A1 WO2016042805 A1 WO 2016042805A1
- Authority
- WO
- WIPO (PCT)
- Prior art keywords
- cancer
- subject
- evaluation
- group
- elements
- Prior art date
- Legal status (The legal status is an assumption and is not a legal conclusion. Google has not performed a legal analysis and makes no representation as to the accuracy of the status listed.)
- Ceased
Links
Images


Classifications
-
- G—PHYSICS
- G01—MEASURING; TESTING
- G01N—INVESTIGATING OR ANALYSING MATERIALS BY DETERMINING THEIR CHEMICAL OR PHYSICAL PROPERTIES
- G01N33/00—Investigating or analysing materials by specific methods not covered by groups G01N1/00 - G01N31/00
- G01N33/48—Biological material, e.g. blood, urine; Haemocytometers
- G01N33/50—Chemical analysis of biological material, e.g. blood, urine; Testing involving biospecific ligand binding methods; Immunological testing
- G01N33/53—Immunoassay; Biospecific binding assay; Materials therefor
- G01N33/575—Immunoassay; Biospecific binding assay; Materials therefor for cancer
- G01N33/5758—Immunoassay; Biospecific binding assay; Materials therefor for cancer involving compounds serving as markers for tumours, cancers or neoplasias, e.g. cellular determinants, receptors, heat shock/stress proteins, A-protein, oligosaccharides or metabolites
- G01N33/57585—Immunoassay; Biospecific binding assay; Materials therefor for cancer involving compounds serving as markers for tumours, cancers or neoplasias, e.g. cellular determinants, receptors, heat shock/stress proteins, A-protein, oligosaccharides or metabolites involving compounds identifiable in body fluids
-
- G—PHYSICS
- G01—MEASURING; TESTING
- G01N—INVESTIGATING OR ANALYSING MATERIALS BY DETERMINING THEIR CHEMICAL OR PHYSICAL PROPERTIES
- G01N33/00—Investigating or analysing materials by specific methods not covered by groups G01N1/00 - G01N31/00
- G01N33/48—Biological material, e.g. blood, urine; Haemocytometers
- G01N33/50—Chemical analysis of biological material, e.g. blood, urine; Testing involving biospecific ligand binding methods; Immunological testing
- G01N33/84—Chemical analysis of biological material, e.g. blood, urine; Testing involving biospecific ligand binding methods; Immunological testing involving inorganic compounds or pH
-
- G—PHYSICS
- G16—INFORMATION AND COMMUNICATION TECHNOLOGY [ICT] SPECIALLY ADAPTED FOR SPECIFIC APPLICATION FIELDS
- G16H—HEALTHCARE INFORMATICS, i.e. INFORMATION AND COMMUNICATION TECHNOLOGY [ICT] SPECIALLY ADAPTED FOR THE HANDLING OR PROCESSING OF MEDICAL OR HEALTHCARE DATA
- G16H10/00—ICT specially adapted for the handling or processing of patient-related medical or healthcare data
- G16H10/40—ICT specially adapted for the handling or processing of patient-related medical or healthcare data for data related to laboratory analysis, e.g. patient specimen analysis
-
- G—PHYSICS
- G16—INFORMATION AND COMMUNICATION TECHNOLOGY [ICT] SPECIALLY ADAPTED FOR SPECIFIC APPLICATION FIELDS
- G16H—HEALTHCARE INFORMATICS, i.e. INFORMATION AND COMMUNICATION TECHNOLOGY [ICT] SPECIALLY ADAPTED FOR THE HANDLING OR PROCESSING OF MEDICAL OR HEALTHCARE DATA
- G16H50/00—ICT specially adapted for medical diagnosis, medical simulation or medical data mining; ICT specially adapted for detecting, monitoring or modelling epidemics or pandemics
- G16H50/30—ICT specially adapted for medical diagnosis, medical simulation or medical data mining; ICT specially adapted for detecting, monitoring or modelling epidemics or pandemics for calculating health indices; for individual health risk assessment
-
- G—PHYSICS
- G01—MEASURING; TESTING
- G01N—INVESTIGATING OR ANALYSING MATERIALS BY DETERMINING THEIR CHEMICAL OR PHYSICAL PROPERTIES
- G01N2800/00—Detection or diagnosis of diseases
- G01N2800/50—Determining the risk of developing a disease
Definitions
- the present invention relates to a cancer evaluation method and a cancer evaluation system. More specifically, the present invention relates to a cancer evaluation method and a cancer evaluation using a concentration balance of element groups contained in human serum (correlation between concentrations of element groups for evaluation). About the system.
- Methods for diagnosing cancer include direct viewing and touching methods (palpation, endoscopy, etc.), judgment methods based on images projected inside the body (X-ray imaging, CT examination, MRI examination, PET examination, etc.) Methods for examining blood and cells (blood tests, cytology, biopsy, etc.) are known.
- the direct viewing and touching method has the drawback that the target (affected area) is limited to the breast, rectum, stomach, large intestine, etc., and the method of diagnosing with images is simple, but the detection sensitivity Not only is low, but also has the drawback of subject radiation exposure.
- a method of examining blood or cells is preferable because it has a low patient burden and high detection sensitivity.
- a diagnosis can be made by analyzing blood collected from a patient, the burden on the patient is small, and it is also possible to carry out a mass screening, which is more preferable.
- Patent Document 1 discloses a method for diagnosing lung cancer by measuring the blood amino acid concentration of a patient using this relationship.
- This diagnostic method includes the steps of obtaining amino acid concentration data relating to amino acid concentration values from blood collected from an evaluation object, and the concentration values of Lys and His included in the amino acid data of the evaluation object acquired in the evaluation step.
- a concentration value reference evaluation step for evaluating the state of lung cancer based on the evaluation object. In the concentration value reference evaluation step, whether the evaluation object is the lung cancer or the non-lung cancer based on the concentration values of Lys and His included in the amino acid data of the evaluation object acquired in the acquisition step.
- a density value reference determining step for determining whether or not.
- Non-Patent Document 1 the concentration of copper (Cu) and zinc (Zn) in the serum of breast cancer patients and the concentration ratio Cu / Zn of both have a correlation with the degree of progression of the patient's medical condition. It has been reported.
- Non-Patent Document 2 discloses that the concentration levels of cadmium (Cd) and lead (Pb) in the serum of cancer patients are higher than those of healthy individuals, and zinc (Zn), iron (Fe), and manganese ( It has been reported that the concentration level of Mn) is lower than that of healthy individuals.
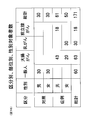
- essential elements indispensable for human life maintenance are 12 kinds of main elements such as hydrogen (H), carbon (C),... Iron (Fe), boron ( B), consisting of 16 kinds of trace elements such as fluorine (F),... Bromine (Br).
- H hydrogen
- C carbon
- Fe Iron
- B boron
- trace elements such as fluorine (F),... Bromine (Br).
- the main elements are important as components of the body. Trace elements are used for enzyme activity centers in substance metabolism in the body, and very small amounts are required. When trace elements are deficient or excessive, the balance of substance metabolism in the body is lost, and symptoms peculiar to each element appear.
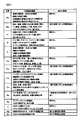
- FIG. 4 the relationship between the biological significance of each element and cancer is shown in FIG. As is clear from FIG. 4, there are many elements whose association with cancer is unknown. However, the present inventors, based on knowledge obtained through their own research and information from previously reported papers etc., know the correlation between serum concentrations of specific element groups, thereby The present inventors have found the possibility that the risk of morbidity can be estimated and have come to the present invention.
- An object of the present invention is to provide a cancer evaluation method and a cancer evaluation that can estimate the cancer risk of a subject with high accuracy and that do not have the problems of early degeneration and high cost as in the case of using amino acid concentration in blood. To provide a system.
- Another object of the present invention is to provide a cancer evaluation method and a cancer evaluation system that can be easily applied to mass screening.
- a cancer evaluation method Applying the concentration data of the evaluation element group in the serum collected from the subject to a discriminant function for discriminating whether the subject belongs to the control group or the case group, the evaluation element in the serum A correlation calculation step for calculating the correlation between the concentrations of the group; And a determining step of determining whether or not the subject has developed any cancer based on the correlation calculated in the correlation calculating step.
- the element group for evaluation is appropriately set according to the type and concentration of the element group contained in the serum, the type of cancer to be determined, and the like.
- the concentration data of the evaluation element group in the serum collected from the subject is discriminated for discriminating whether the subject belongs to the control group or the case group.
- Applied to the function after calculating the correlation between the concentrations of the evaluation element group in the serum, based on the obtained correlation, whether or not the subject has developed any cancer
- the cancer risk of the subject can be estimated with high accuracy, and there is no difficulty in early degeneration and high cost as in the case of using the amino acid concentration in blood.
- the computer automatically calculates to determine whether the subject belongs to the control group or the case group. Therefore, it is possible to easily and quickly discriminate even if there are many subjects. Therefore, it can be easily applied to group screening.
- a combination of elements is selected as the evaluation element group so that the Mahalanobis general distance related to the element from which the concentration data is obtained is maximized.
- the concentration data is obtained for both the subject belonging to the control group and the subject belonging to the case group as the evaluation element group.
- the combination of elements selected is selected. In this example, all combinations of elements for which the concentration data was obtained for both the subject belonging to the control group and the subject belonging to the case group may be used as the evaluation element group, Some combinations of elements may be used as the evaluation element group.
- the evaluation element group includes Na, Mg, Al, P, K, Ca, Ti, Mn, Fe, Zn, Cu, Se, A combination of 16 elements of Rb, Ag, Sn, and S is selected.
- the age data of the subject in addition to the concentration data, is also included. used.
- the method further includes a step of performing an analysis using a multiple logistic model (onset probability calculation step), and the subject develops some cancer in the future. Also present the probability of doing.
- a cancer evaluation system is provided.
- This cancer assessment system A data storage unit for storing concentration data of an evaluation element group in blood collected from a subject; A discriminant function generator for generating a discriminant function for discriminating whether the subject belongs to a control group or a case group; Applying the concentration data of the subject stored in the data storage unit to the discriminant function generated by the discriminant function generation unit, calculating the correlation between the concentrations of the evaluation element group in the serum, And an evaluation result calculation unit that outputs an evaluation result for determining whether or not the subject has developed any cancer based on the correlation.
- the element group for evaluation is appropriately set according to the type and concentration of the element group contained in the serum, the type of cancer to be determined, and the like.
- the concentration data of the evaluation element group in the serum collected from the subject stored in the data storage unit before Applying to the discriminant function generated by the discriminant function generator, the correlation between the concentrations of the evaluation element group is calculated. And based on the correlation, the evaluation result which discriminate
- a combination of elements that maximizes the Mahalanobis's general distance is selected as the evaluation element group.
- a combination of seven elements of S, P, Mg, Zn, Cu, Ti, and Rb is selected as the evaluation element group.
- the concentration data is obtained for both the subject belonging to the control group and the subject belonging to the case group as the evaluation element group.
- the combination of elements selected is selected. In this example, all combinations of elements for which the concentration data was obtained for both the subject belonging to the control group and the subject belonging to the case group may be used as the evaluation element group, Some combinations of elements may be used as the evaluation element group.
- the evaluation element group includes Na, Mg, Al, P, K, Ca, Ti, Mn, Fe, Zn, Cu, Se, A combination of 16 elements of Rb, Ag, Sn, and S is selected.
- the evaluation result calculation unit uses the age data of the subject in addition to the concentration data.
- the evaluation result calculation unit performs an analysis using a multiple logistic model, and has a probability that the subject will develop any cancer in the future. Include in the evaluation results.
- the evaluation result calculation unit develops in addition to the function of determining whether the subject belongs to a control group or a case group. Has the ability to identify the type of cancer that is.
- the cancer evaluation method according to the first aspect of the present invention and the cancer evaluation system according to the second aspect it is possible to estimate the cancer risk of the subject with high accuracy and to use the amino acid concentration in the blood As described above, there are no problems such as early degeneration and high cost, and it can be easily applied to mass screening.
- FIG. 6A is a continuation of FIG. 6A.
- the cancer evaluation method of this invention it is a conceptual diagram which shows that the discrimination
- the concentration of the element group in the serum is compared by comparing the concentration of the element group in the serum between the cancer patient and a healthy person (general person who has not been afflicted with cancer at the time of cancer screening). It may be possible to estimate the risk of developing cancer due to fluctuations.
- the second finding is that ICP (Inductively-Coupled Plasma Mass Spectrometry, ICP-MS) is commonly used in the semiconductor field to measure the concentration of elements in serum. It is said that can be used.
- the present inventors first performed preliminary inspection twice in order to select the element group to be measured as the “element group for evaluation”.
- ICP emission spectroscopy Inductively-Coupled Plasma Optical Emission Spectroscopy, ICP-OES
- ICP mass spectrometry Inductively-Coupled Plasma Mass Spectroscopy, ICP-MS
- Atomic Absorption Spectrometry AAS
- XRF X-Ray Fluorescence Analysis
- Second preliminary test 8 serum samples from the new control group different from those used for the first preliminary test under the optimal measurement conditions found in the first preliminary test and 12 cases from the case group Serum was used to measure the content of 75 element groups contained in the serum using ICP mass spectrometry.
- the breakdown of the 12 cases in the case group is 2 cases of lung cancer, 3 cases of breast cancer, 3 cases of colorectal cancer, and 2 cases of thyroid cancer.
- concentration of the element group of the obtained control group and a case group was analyzed statistically.
- the discriminant function was obtained as follows. This is to analyze the concentration balance (correlation) between elements. This is because the concentration of each element varies from person to person and is difficult to use as an index, so that the correlation between the concentrations of elements is known.
- the discriminant function can be expressed as the following formula (1).
- Discriminant value (D) function (F) (explanatory variables 1 to n, discrimination coefficient) (1) (Where n is an integer greater than or equal to 2)
- the formula (1) can be written as the following formula (2) in consideration of the weights (the degree of influence on the discrimination) of the explanatory variables 1 to n.
- Discriminant value (D) (discriminant coefficient 1) ⁇ (explanatory variable 1) + (Discriminant coefficient 2) ⁇ (explanatory variable 2) + ..
- discriminant value (discriminant score) (D) calculated in this way is 0 or less, the subject is judged to enter the case group (1), and if the discriminant value (D) is 0 or more, the control group ( 2) It is judged that it enters.
- an analysis is performed using a multiple logistic model to determine the incidence.
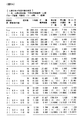
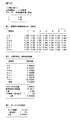
- Table 1 in FIG. 7A shows the correlation between the seven elements.
- S of 1 shows a strong positive correlation of 0.714 with Mg of 3). That is, when S increases, Mg also increases, and when S decreases, Mg also decreases.
- the correlation coefficient in Table 1 in FIG. 7A indicates the relationship between the seven elements.
- the Mahalanobis general distance in Table 2 of FIG. 7A represents the distance between the centroids of the case group (1) and the control group (2), and the larger this distance, the larger the distance between both groups (1) and (2). Can represent the difference.
- the Mahalanobis general distance was the largest value when the above-mentioned seven elements were used as the evaluation element group. Therefore, the formula using the above-described seven elements was finally used as a function for discriminating both groups. Identified as a discriminant function.
- Table 4 in FIG. 7B shows the significance of the variables used in the discriminant analysis
- Table 5 in the figure shows the apparent hit rate
- Table 6 in the figure shows each group in the discriminant space. The center of gravity is shown.
- the cancer evaluation method of the present invention seven elements (S, P, Mg, Zn, Cu, Ti, Rb) identified through two preliminary examinations as described above are set as an evaluation element group, and these elements are set. By measuring the serum concentration of the subjects of the group, it is evaluated whether or not the subject is suffering from cancer.
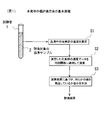
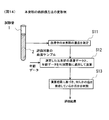
- the cancer evaluation method of the present invention first puts a serum sample 2 collected from a subject into a test tube 1 and stores it in an analyzer to analyze it.
- the concentration of the element group (element group for evaluation) is measured (step S1).
- the element group whose concentration is measured is seven kinds of S, P, Mg, Zn, Cu, Ti, and Rb.
- step S2 the concentration data of the evaluation element group in the serum obtained in step S1 is applied to a predetermined discriminant function for calculation (step S2).
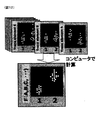
- step S3 based on the calculation result obtained in step S2, it is determined whether or not the subject who has collected the serum sample 2 has developed any cancer. As a result, as shown in FIG. 12, a desired evaluation result regarding the presence or absence of the onset of cancer is obtained (step S3).
- concentration data of evaluation element groups (S, P, Mg, Zn, Cu, Ti, Rb) in serum collected from a subject is applied to a predetermined discriminant function. After calculating the correlation between the concentrations of the evaluation element group, based on the obtained correlation between the concentrations of the evaluation element group, whether or not the subject has developed any cancer As a result of the determination, the cancer risk of the subject can be estimated with high accuracy, and there is no difficulty in early degeneration and high cost as in the case of using the amino acid concentration in blood.
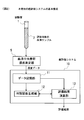
- FIG. 2 shows the basic configuration of the cancer evaluation system 10 of the present invention.
- the cancer evaluation system 10 of the present invention is for carrying out the above-described cancer evaluation method of the present invention.
- the data storage unit 11 the discriminant function generation unit 12, the evaluation result calculation Part 13.
- a serum element group concentration measurement unit 5 is provided outside the cancer evaluation system 10, and an evaluation element group in serum is obtained by using a serum sample 2 collected from a subject in a test tube 1. The concentration of (S, P, Mg, Zn, Cu, Ti, Rb) is measured. The concentration data of the evaluation element group in the serum obtained by the serum element group concentration measurement unit 5 in this way is supplied to the data storage unit 11.
- the serum element group concentration measuring unit 5 for example, a known ICP mass spectrometer device is used.
- the data storage unit 11 is a part for storing the concentration data of the evaluation element group obtained by the serum element group concentration measurement unit 5, and is usually composed of a known storage device.
- the discriminant function generation unit 12 is a part that generates a discriminant function used in the calculation in the evaluation result calculation unit 13, and is usually configured to include a known program.
- the evaluation result calculation unit 13 performs calculation by a predetermined method. Based on the calculation result output by the evaluation result calculation unit 13, a desired evaluation result, that is, the presence or absence of the onset of cancer is evaluated.
- the risk of carcinogenesis is calculated by pattern analysis of the concentration of evaluation element groups in serum, and the possibility of cancer is calculated based on the risk. Submit a result of probabilistic expression of gender. Specifically, serum (for example, 0.5 cc) collected at the time of a medical examination at a medical institution or medical examination institution is collected, and a specific element group for evaluation (S, P, Mg, Zn, Cu, Ti) is collected at the inspection institution. , Rb). Based on the concentration data of the element group for evaluation measured by the testing organization, the cancer risk is calculated at an organization such as a risk assessment center (tentative name).
- a risk assessment center tentative name
- the risk calculation result is sent to the blood sampling agency, and the blood sampling agency sends it to the patient. If cancer is suspected, it is recommended that the current blood sampling organization take the “current cancer screening”.
- the personal information is encrypted at the blood sampling organization or given a serial number, and the personal information does not reach the laboratory or risk assessment center.
- FIG. 14 shows a modified example (development example) of the cancer evaluation method of the present invention.
- a serum sample 2 collected from a subject is placed in a test tube 1, and this is stored in an analyzer and analyzed, whereby the group of elements in the serum is analyzed.
- the density is measured (step S11).
- the element whose concentration is measured is not limited, and the concentration of all measurable elements is measured.
- an element group (all or a part thereof) for which concentration data is obtained in both the control group and the case group is designated as an evaluation element group.
- the element group for evaluation is, for example, Na, Mg, Al, P, K, Ca, Ti, Mn, Fe, Zn, Cu, Se, Rb, Ag, Sn, and S. .
- the element group (all or a part) of which the concentration data was obtained in both the control group and the case group is designated as the element group for evaluation.
- These data can be used as discriminants as stable data. Because. In other words, density data that appears only in the control group or density data that appears only in the case group is difficult to obtain a desired discrimination result when used in the discriminant.
- step S12 the concentration data of the evaluation element group in serum obtained in step S11 and the age of the subject are calculated by applying them to a predetermined discriminant function (step S12).
- step S13 based on the calculation result obtained in step S2, it is determined whether or not the subject who has collected the serum sample 2 has developed any cancer. As a result, a desired evaluation result regarding the presence or absence of the onset of cancer is obtained (step S13).
- the evaluation element group in serum collected from the subject (all or all of the elements whose concentration data were obtained in both the control group and the case group) (Part) concentration data and the age of the subject are applied to a predetermined discriminant function, and after calculating the correlation between the concentration of the element group and the age of wrinkles, the obtained element group Since it is determined whether or not the subject has developed any cancer based on the correlation between the concentration and the age, the cancer risk of the subject can be estimated with high accuracy, and in the blood There is no problem of early denaturation and high cost as in the case of using the amino acid concentration.
- FIG. 15 shows a basic configuration of a cancer evaluation system 10A that is a modified example (development example) of the cancer evaluation system 10 of the present invention.
- This cancer evaluation system 10A is for carrying out the modified example (development example) of the cancer evaluation method of the present invention shown in FIG. 14, and as is clear from FIG. 15, the data storage unit 11A and the discriminant function generation 12A and an evaluation result calculation unit 13A.
- a serum element group concentration measuring unit 5A is provided outside the cancer evaluation system 10A, and an evaluation element group in serum is obtained by using a serum sample 2 collected from a subject in a test tube 1.
- the concentration of (16 kinds of Na, Mg, Al, P, K, Ca, Ti, Mn, Fe, Zn, Cu, Se, Rb, Ag, Sn, and S) is measured.
- the concentration data thus obtained by the serum element concentration measurement unit 5A is supplied to the data storage unit 11A.
- the age data of the subject is also supplied to the data storage unit 11A.
- the serum element group concentration measurement unit 5A for example, a known ICP mass spectrometer device is used.
- the data storage unit 11A is a part that stores the concentration data obtained by the serum element group concentration measurement unit 5A and the age data of the subject, and is usually composed of a known storage device.
- the discriminant function generation unit 12A is a part that generates a discriminant function used in the calculation in the evaluation result calculation unit 13A, and is usually configured to include a known program.
- the evaluation result calculation unit 13A performs calculation by a predetermined method. Based on the calculation result in the evaluation result calculation unit 13A, a desired evaluation result, that is, the presence or absence of the onset of cancer is evaluated.
- the risk calculation result is sent to the blood sampling agency, and the blood sampling agency sends it to the patient. If cancer is suspected, it is recommended that the current blood sampling organization take the “current cancer screening”.
- the personal information is encrypted at the blood sampling organization or given a serial number, and the personal information does not reach the laboratory or risk assessment center.
- Example 1 corresponds to the cancer evaluation method of the present invention shown in FIG.
- Discrimination value (D) 0.040 ⁇ S concentration ⁇ 0.0133 ⁇ P concentration + 0.3336 ⁇ Mg concentration + 3.3737 ⁇ Zn concentration ⁇ 5.3088 ⁇ Cu concentration + 1.1833 ⁇ Ti concentration
- the concentration of + 20.7033 ⁇ Rb was ⁇ 9.9368.
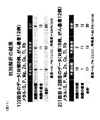
- the final discriminant analysis results are shown in the upper table of FIG.
- 8 cases in the control group are all predicted to be control groups according to the evaluation element group (S, P, Mg, Zn, Cu, Ti, Rb) used for discrimination.
- the case group cancer patients
- 11 cases are estimated as the case group
- 1 case is estimated as the control group (healthy person).
- the discrimination ability is 91% (11/12) for sensitivity (ratio at which an actual patient can be judged as a patient), and 100% (ratio at which a non-patient control can be judged as not a patient) (8% / 8).
- the determination probability of the case group is 100% for both sensitivity and specificity, but the screening methods used in current cancer screening (lung chest X-ray, stomach barium test, Since the sensitivity and specificity of the fecal occult blood test in the large intestine is about 80%, the newly used estimation method (screening) for cancer due to the difference in the concentration pattern of specific elements in serum is significant. Expected to be a way.
- This example also corresponds to the cancer evaluation method of the present invention shown in FIG.
- Example 1 the final discriminant analysis results were as shown in the lower table of FIG. The same element group as in Example 1 was extracted, and the sensitivity was the same as in Example 1, but the specificity decreased to 88%.
- This example corresponds to a modification / development example of the cancer evaluation method of the present invention shown in FIG.
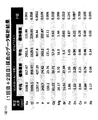
- the control group (general people) is 30 males and 30 females, and the case group (cancer patients) is 43 males with colorectal cancer, 20 females, 30 females with breast cancer, There were 18 men with prostate cancer.
- concentration of all the elements in the serum of all the subjects was measured by ICP mass spectrometry.
- the measured values were obtained for all subjects (total serum) from the 16 elements (Na, Mg, Al, P, K, etc.) out of 75 elements in the serum obtained in the second preliminary test described above.
- ICP emission spectroscopy ICP-OES
- ICP-MS ICP mass spectrometry
- AAS atomic absorption analysis
- XRF fluorescent X-ray analysis
- Discriminant value (score) (D) F (age, Na, Cl, S,..., Ti, Rb) (4)
- the cancer risk can be estimated based on whether the value of the discriminant value (score) (D) appears on the case group side or the control group side. 18 and 19 show the results when discriminant analysis is used.
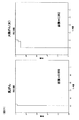
- ROC analysis is performed by changing the discriminant value (score) (D) value calculated from Equation (4) in order from the lowest value to the highest value, and the number of persons classified into the control group and the case group. From time to time, the sensitivity and specificity are calculated from the number of people classified as follows, and diagrams as shown in FIGS. 20 and 21 are created. In both figures, the vertical axis is sensitivity and the horizontal axis is (1-specificity). The suitability of discrimination (prediction) can be determined from the area under the curves shown in both figures. The minimum area is 0 and the maximum area is 1. The closer to 1, the more accurate the discrimination.
- the area for male colon cancer is 0.956, and the area for male prostate cancer is 1.000.
- the area in the case of female breast cancer is 0.999, and the area in the case of female colorectal cancer is 0.982. In each case, a sufficiently high value is obtained.
- the area of ROC in methods such as fecal occult blood reaction of colorectal cancer and mammography of breast cancer, which are currently used for cancer screening diagnosis, has been reported as 0.7 to 0.8. It can be seen that it is superior to the two methods.
- the values (discriminant score) of the discriminant function (D) can be obtained by inputting the age data and the concentration data of 16 elements into these discriminants.
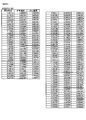
- FIG. 24 shows the discrimination score in the case of male colorectal cancer and the probability (normal probability and cancer probability) of being assigned (grouped) to either the control group or the case group. For example, assuming that the age data of a certain subject and the concentration data of 16 elements are input into the discriminant and the obtained discriminant score is 1.77860, from FIG. The probability of cancer is calculated as 99.562%, and it can be estimated that the possibility of having colorectal cancer is very high.
- FIG. 25 shows the discrimination score, normal probability, and cancer probability in male colorectal cancer.
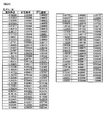
- FIG. 26 and FIG. 27 show the discrimination score, normal probability, and cancer probability for female breast cancer and colon cancer, respectively.
- these figures show the discrimination score and the probability of being grouped into either the control group or the case group (normal probability and cancer probability). It can be estimated with high accuracy.
- the discriminant is different for each type of cancer (cancer site), it is possible to identify not only the possibility of cancer but also the type of cancer that may develop (cancer site) It becomes.
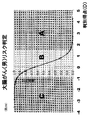
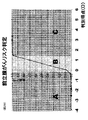
- FIG. 28 to FIG. 31 are graphs that are visually comprehensible using the data shown in FIG. 24 to FIG. 27 calculated from the discriminant function.
- the horizontal axis shows the discrimination score (D), and the vertical axis shows the probability of cancer.
- D discrimination score
- the cancer probability is 95% or more, so it is determined as “C determination”, and it is determined that the cancer is most suspected.
- D is 0.3 or less
- the cancer probability is 5% or less. Therefore, it is determined as “A determination” that the risk of developing cancer is small.
- the cancer probability is between 5% and 95%, so it is determined that there is a need for follow-up as “B determination” To do.
- FIGS. 28 and 30 to 31 The same applies to FIGS. 28 and 30 to 31.
- Example 3 as in Examples 1 and 2 described above, instead of paying attention to changes in the concentration of a specific element in serum, a concentration balance (higher or lower concentration of multiple elements (element group for evaluation)) in serum (The cancer risk diagnosis method is realized by utilizing the fact that the concentration distribution pattern) is clearly different between the case group and the control group, which is a new method different from the conventional method.
- Example 3 the discriminant function is calculated for four types of male colorectal cancer, male prostate cancer, female colorectal cancer, and female breast cancer, but similar results are obtained for cancers in other regions. is expected.
- Example 3 it can be said that the ability to determine the risk of a plurality of cancer sites with a single blood collection is a new technique that overturns the common sense of cancer diagnosis so far.
- Example 3 since all 16 types of elements for which concentration data were obtained for both the control group and the case group were used as the evaluation element group, there is only one Mahalanobis generalized distance. According to Example 3, it was confirmed that the discriminant generated under such conditions is also effective as in Examples 1 and 2 described above. In addition, if any part of the 16 elements from which concentration data was obtained for both the control group and the case group is selected and used as an evaluation element group (changing the combination of elements), Mahalanobis In this case, as described above in the basic principle of the cancer evaluation method of the present invention, it is preferable to select a combination of elements that maximizes the Mahalanobis universal distance.
- This example also corresponds to the modification / development example of the cancer evaluation method of the present invention shown in FIG.
- Example 3 Only the concentration data of 16 elements (Na, Mg, Al, P, K, Ca, Ti, Mn, Fe, Zn, Cu, Se, Rb, Ag, Sn, S) measured in the above-described Example 3 are analyzed. It discriminate
- the present invention is widely applicable to fields where it is desired to quickly and easily estimate whether a person (or animal) has cancer.
Landscapes
- Health & Medical Sciences (AREA)
- Life Sciences & Earth Sciences (AREA)
- Engineering & Computer Science (AREA)
- Chemical & Material Sciences (AREA)
- Immunology (AREA)
- Biomedical Technology (AREA)
- Hematology (AREA)
- Molecular Biology (AREA)
- Urology & Nephrology (AREA)
- General Health & Medical Sciences (AREA)
- Pathology (AREA)
- Physics & Mathematics (AREA)
- Food Science & Technology (AREA)
- Medicinal Chemistry (AREA)
- Microbiology (AREA)
- Analytical Chemistry (AREA)
- Biochemistry (AREA)
- Cell Biology (AREA)
- General Physics & Mathematics (AREA)
- Biotechnology (AREA)
- Inorganic Chemistry (AREA)
- Medical Informatics (AREA)
- Public Health (AREA)
- Epidemiology (AREA)
- Primary Health Care (AREA)
- Data Mining & Analysis (AREA)
- Databases & Information Systems (AREA)
- Investigating Or Analysing Biological Materials (AREA)
- Hospice & Palliative Care (AREA)
- Oncology (AREA)
Abstract
Description
対象者から採取した血清中の評価用元素群の濃度データを、前記対象者が対照群と症例群のいずれに属するかを判別するための判別関数に適用して、前記血清における前記評価用元素群の濃度間の相関関係を演算する相関関係演算ステップと、
前記相関関係演算ステップで演算された前記相関関係に基づいて、前記対象者が何らかの癌を発症しているか否かを判別する判別ステップと
を備えてなることを特徴とする。
対象者から採取した血液中の評価用元素群の濃度データを記憶するデータ記憶部と、
前記対象者が対照群と症例群のいずれに属するかを判別するための判別関数を生成する判別関数生成部と、
前記データ記憶部に記憶された前記対象者の濃度データを、前記判別関数生成部で生成された判別関数に適用して、前記血清における前記評価用元素群の濃度間の相関関係を演算し、その相関関係に基づいて前記対象者が何らかの癌を発症しているか否かを判別する評価結果を出力する評価結果演算部と
を備えてなることを特徴とする。
本発明者らは、対象者の血清中に含まれる元素群の濃度(含有量)を用いた、新たな癌スクリーニング法を開発すべく、鋭意研究を重ねた結果、次のような知見を得た。第1の知見は、癌患者と健康人(癌検診を受診した時点での癌罹患が認められなかった一般人)との血清中の元素群の濃度の比較を行うことによって、元素群の濃度の変動による癌罹患リスクを推定できるのではないか、というものである。そして、第2の知見は、血清中の元素群の濃度の測定に、半導体分野で一般的に使用されているICP(誘導結合プラズマ)質量分析法(Inductively-Coupled Plasma Mass Spectrometry, ICP-MS)を利用できるのではないか、というものである。
判別値(D)=関数(F)(説明変数1~n、判別係数) (1)
(ただし、nは2以上の整数)
数式(1)は、各説明変数1~nの重み(判別に及ぼす影響度)を考慮すると、次の数式(2)のように書くことができる。
判別値(D)=(判別係数1)×(説明変数1)+
(判別係数2)×(説明変数2)+
・・(判別係数n)×(説明変数n)+定数 (2)
そこで、2群の母平均値の差の検定(t検定)の結果から選択された7種の元素群(S、P、Mg、Zn、Cu、Ti、Rb)を説明変数とし、それらの重みとして判別係数を用いると、判別関数が得られる。所望の判別関数は、これら7種の元素群の濃度値(濃度データ)を公知の判別分析法プログラムに読み込ませることで、容易に得ることができる。
発生率=1/[1+exp(-判別値)] (3)
数式(3)により発生率が得られるので、対象者が症例群(1)に入る確率まで求めることができる。つまり、対象者は、自分の現在の癌発症リスクを知ることができるのである。
次に、本発明の癌評価システムについて説明する。
次に、本発明の癌評価方法の変形例について説明する。これは、上述した本発明の癌評価方法の発展例とも言えるものである。
本発明の癌評価システム10の変形例(発展例)である癌評価システム10Aの基本構成を図15に示す。この癌評価システム10Aは、図14に示した本発明の癌評価方法の変形例(発展例)を実施するためのもので、図15より明らかなように、データ記憶部11Aと、判別関数生成部12Aと、評価結果演算部13Aとを備えている。
判別値(D)=0.0040×Sの濃度-0.0133×Pの濃度+0.3336×Mgの濃度+3.3637×Znの濃度-5.3088×Cuの濃度+1.1833×Tiの濃度+20.7033×Rbの濃度-9.9368、であった。
F(年齢、Na,Cl,S,・・・・,Ti,Rb) (4)
判別値(得点)(D)の値が症例群側に出るか対照群側に出るかで、癌リスクを推測することができる。図18と図19に判別分析を用いた場合の結果を示した。
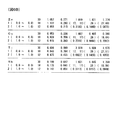
―0.0002593×Mg+0.0000492×Al
-0.0000252×P+0.0000105×K
+0.000046×Ca+0.0006909×Ti
+0.0154933×Mn-0.0001292×Fe
-0.0027147×Cu-0.0002606×Zn
+0.0166826×Se-0.0077824×Rb
-0.0019460×Ag+0.0193273×Sn
-0.0000003×S -21.5837825(定数) (5)
男の大腸癌の場合は、図22の右側のようになる。また、女の乳癌の場合は、図23の左側のようになり、女の大腸癌の場合は図23の右側のようになる。
2 血清サンプル
5、5A 血清中元素群濃度測定部
10、10A 癌評価システム
11、11A データ記憶部
12、12A 判別関数生成部
13、13A 評価結果演算部
Claims (16)
- 対象者から採取した血清中の評価用元素群の濃度データを、前記対象者が対照群と症例群のいずれに属するかを判別するための判別関数に適用して、前記血清における前記評価用元素群の濃度間の相関関係を演算する相関関係演算ステップと、
前記相関関係演算ステップで演算された前記相関関係に基づいて、前記対象者が何らかの癌を発症しているか否かを判別する判別ステップと
を備えてなることを特徴とする癌評価方法。 - 前記元素群として、マハラノビスの汎距離が最大となるような元素の組み合わせが選択されている請求項1に記載の癌評価方法。
- 前記元素群として、S,P,Mg,Zn,Cu,Ti,Rbの7種の元素の組み合わせが選択されている請求項1に記載の癌評価方法。
- 前記元素群として、対照群に属する前記対象者と症例群に属する前記対象者の双方について前記濃度データが得られた元素の組み合わせが選択されている請求項1に記載の癌評価方法。
- 前記元素群として、Na,Mg,Al,P,K,Ca,Ti,Mn,Fe,Zn,Cu,Se,Rb,Ag,Sn,Sの16種の元素の組み合わせが選択されている請求項1に記載の癌評価方法。
- 前記相関関係演算ステップにおいて、前記濃度データに加えて前記対象者の年齢データも使用される請求項1~5のいずれかに記載の癌評価方法。
- 多重ロジスティックモデルを用いた分析をするステップをさらに含んでいて、前記対象者が将来何らかの癌を発症する確率をも提示する請求項1~6のいずれかに記載の癌評価方法。
- 前記対象者が何らかの癌を発症しているとの判別に加えて、発症しているのがどの部位の癌であるかの判別も行われる請求項1~7のいずれかに記載の癌評価方法。
- 対象者から採取した血液中の評価用元素群の濃度データを記憶するデータ記憶部と、
前記対象者が対照群と症例群のいずれに属するかを判別するための判別関数を生成する判別関数生成部と、
前記データ記憶部に記憶された前記対象者の濃度データを、前記判別関数生成部で生成された判別関数に適用して、前記血清における前記評価用元素群の濃度間の相関関係を演算し、その相関関係に基づいて前記対象者が何らかの癌を発症しているか否かを判別する評価結果を出力する評価結果演算部と
を備えてなることを特徴とする癌評価システム。 - 前記元素群として、マハラノビスの汎距離が最大となるような元素の組み合わせが選択される請求項9に記載の癌評価システム。
- 前記元素群として、S,P,Mg,Zn,Cu,Ti,Rbの7種の元素の組み合わせが選択される請求項9に記載の癌評価システム。
- 前記元素群として、対照群に属する前記対象者と症例群に属する前記対象者の双方について前記濃度データが得られた元素の組み合わせが選択される請求項9に記載の癌評価システム。
- 前記元素群として、Na,Mg,Al,P,K,Ca,Ti,Mn,Fe,Zn,Cu,Se,Rb,Ag,Sn,Sの16種の元素の組み合わせが選択される請求項9に記載の癌評価システム。
- 前記評価結果演算部において、前記濃度データに加えて前記対象者の年齢データも使用される請求項9~13のいずれかに記載の癌評価システム。
- 前記評価結果演算部が、多重ロジスティックモデルを用いた分析を行って、前記対象者が将来何らかの癌を発症する確率をも前記評価結果に含める請求項9~14のいずれかに記載の癌評価システム。
- 前記評価結果演算部が、前記対象者が対照群と症例群のいずれに属するかを判別する機能に加えて、発症している癌の種類を特定する機能を持っている請求項9~15のいずれかに記載の癌評価システム。
Priority Applications (5)
| Application Number | Priority Date | Filing Date | Title |
|---|---|---|---|
| JP2015549896A JP6082478B2 (ja) | 2014-09-15 | 2015-03-10 | 癌評価方法及び癌評価システム |
| KR1020177005279A KR102305151B1 (ko) | 2014-09-15 | 2015-03-10 | 암 평가 방법 및 암 평가 시스템 |
| SG11201702076WA SG11201702076WA (en) | 2014-09-15 | 2015-03-10 | Cancer evaluation method and cancer evaluation system |
| EP15841232.0A EP3182132B1 (en) | 2014-09-15 | 2015-03-10 | Cancer evaluation method and cancer evaluation system |
| US15/511,329 US10845372B2 (en) | 2014-09-15 | 2015-03-10 | Cancer evaluation method and cancer evaluation system |
Applications Claiming Priority (2)
| Application Number | Priority Date | Filing Date | Title |
|---|---|---|---|
| JP2014187170 | 2014-09-15 | ||
| JP2014-187170 | 2014-09-15 |
Publications (1)
| Publication Number | Publication Date |
|---|---|
| WO2016042805A1 true WO2016042805A1 (ja) | 2016-03-24 |
Family
ID=55532854
Family Applications (1)
| Application Number | Title | Priority Date | Filing Date |
|---|---|---|---|
| PCT/JP2015/057005 Ceased WO2016042805A1 (ja) | 2014-09-15 | 2015-03-10 | 癌評価方法及び癌評価システム |
Country Status (6)
| Country | Link |
|---|---|
| US (1) | US10845372B2 (ja) |
| EP (1) | EP3182132B1 (ja) |
| JP (1) | JP6082478B2 (ja) |
| KR (1) | KR102305151B1 (ja) |
| SG (1) | SG11201702076WA (ja) |
| WO (1) | WO2016042805A1 (ja) |
Cited By (7)
| Publication number | Priority date | Publication date | Assignee | Title |
|---|---|---|---|---|
| WO2018186434A1 (ja) * | 2017-04-04 | 2018-10-11 | 株式会社レナテック | 加齢黄斑変性症のリスク評価方法及びシステム |
| WO2019065854A1 (ja) * | 2017-09-27 | 2019-04-04 | 株式会社レナテック | がんリスク評価方法及びがんリスク評価システム |
| WO2020067261A1 (ja) * | 2018-09-26 | 2020-04-02 | 株式会社レナテック | 犬のがんリスク評価方法及びがんリスク評価システム |
| JP2020056774A (ja) * | 2018-09-26 | 2020-04-09 | 株式会社レナテック | 犬のがんリスク評価方法及びがんリスク評価システム |
| JP2021531464A (ja) * | 2018-07-17 | 2021-11-18 | エヌアイビー バイオテック エセ.エレ.エレ. | 尿中バイオマーカーにより前立腺癌をin vitroで診断する方法 |
| WO2021246013A1 (ja) * | 2020-06-03 | 2021-12-09 | 株式会社日立ハイテク | 画像診断方法、画像診断支援装置、及び計算機システム |
| WO2024177086A1 (ja) * | 2023-02-21 | 2024-08-29 | 株式会社レナテック | 認知症リスク評価方法及び認知症リスク評価システム |
Citations (2)
| Publication number | Priority date | Publication date | Assignee | Title |
|---|---|---|---|---|
| JP2005524071A (ja) * | 2002-04-25 | 2005-08-11 | フューチャー データ インコーポレイティド | 元素不均衡の診断試験 |
| JP2011047715A (ja) * | 2009-08-25 | 2011-03-10 | La Belle Vie Kk | 毛髪中ミネラル成分の網羅的分析に基づく癌の検出方法 |
Family Cites Families (1)
| Publication number | Priority date | Publication date | Assignee | Title |
|---|---|---|---|---|
| JP5470848B2 (ja) | 2006-08-04 | 2014-04-16 | 味の素株式会社 | 肺癌の評価方法、肺癌評価装置、肺癌評価方法、肺癌評価システム、肺癌評価プログラム、記録媒体、および、情報通信端末装置 |
-
2015
- 2015-03-10 KR KR1020177005279A patent/KR102305151B1/ko active Active
- 2015-03-10 US US15/511,329 patent/US10845372B2/en active Active
- 2015-03-10 EP EP15841232.0A patent/EP3182132B1/en active Active
- 2015-03-10 SG SG11201702076WA patent/SG11201702076WA/en unknown
- 2015-03-10 WO PCT/JP2015/057005 patent/WO2016042805A1/ja not_active Ceased
- 2015-03-10 JP JP2015549896A patent/JP6082478B2/ja active Active
Patent Citations (2)
| Publication number | Priority date | Publication date | Assignee | Title |
|---|---|---|---|---|
| JP2005524071A (ja) * | 2002-04-25 | 2005-08-11 | フューチャー データ インコーポレイティド | 元素不均衡の診断試験 |
| JP2011047715A (ja) * | 2009-08-25 | 2011-03-10 | La Belle Vie Kk | 毛髪中ミネラル成分の網羅的分析に基づく癌の検出方法 |
Non-Patent Citations (5)
| Title |
|---|
| CHAO TAN ET AL.: "Early prediction of lung cancer based on the combination of trace element analysis in urine and an Adaboost algorithm", JOURNAL OF PHARMACEUTICAL AND BIOMEDICAL ANALYSIS, vol. 49, no. 3, April 2009 (2009-04-01), pages 746 - 752, XP026006079, DOI: doi:10.1016/j.jpba.2008.12.010 * |
| HIROFUMI TAKAGI: "Discriminant analysis and multiple logistic model", JOURNAL OF CLINICAL AND EXPERIMENTAL MEDICINE, vol. 174, no. 4, 1995, pages 285 - 289, XP008185288 * |
| HONG-DAR ISAAC WU ET AL.: "Differentiation of serum levels of trace elements in normal and malignant breast patients", BIOLOGICAL TRACE ELEMENT RESEARCH, vol. 113, 2006, pages 9 - 18, XP008185263 * |
| SANJEEV K. GUPTA ET AL.: "Serum trace elements and Cu/Zn ratio in breast cancer patients", JOURNAL OF SURGICAL ONCOLOGY, vol. 46, no. 3, 1991, pages 178 - 181, XP055393817 * |
| See also references of EP3182132A4 * |
Cited By (12)
| Publication number | Priority date | Publication date | Assignee | Title |
|---|---|---|---|---|
| WO2018186434A1 (ja) * | 2017-04-04 | 2018-10-11 | 株式会社レナテック | 加齢黄斑変性症のリスク評価方法及びシステム |
| JP2018179565A (ja) * | 2017-04-04 | 2018-11-15 | 株式会社レナテック | 加齢黄斑変性症のリスク評価方法及びシステム |
| WO2019065854A1 (ja) * | 2017-09-27 | 2019-04-04 | 株式会社レナテック | がんリスク評価方法及びがんリスク評価システム |
| JP2019060749A (ja) * | 2017-09-27 | 2019-04-18 | 株式会社レナテック | がんリスク評価方法及びがんリスク評価システム |
| JP2021531464A (ja) * | 2018-07-17 | 2021-11-18 | エヌアイビー バイオテック エセ.エレ.エレ. | 尿中バイオマーカーにより前立腺癌をin vitroで診断する方法 |
| JP7619934B2 (ja) | 2018-07-17 | 2025-01-22 | エヌアイビー バイオテック エセ.エレ.エレ. | 尿中バイオマーカーにより前立腺癌をin vitroで診断する方法 |
| WO2020067261A1 (ja) * | 2018-09-26 | 2020-04-02 | 株式会社レナテック | 犬のがんリスク評価方法及びがんリスク評価システム |
| JP2020056774A (ja) * | 2018-09-26 | 2020-04-09 | 株式会社レナテック | 犬のがんリスク評価方法及びがんリスク評価システム |
| WO2021246013A1 (ja) * | 2020-06-03 | 2021-12-09 | 株式会社日立ハイテク | 画像診断方法、画像診断支援装置、及び計算機システム |
| WO2024177086A1 (ja) * | 2023-02-21 | 2024-08-29 | 株式会社レナテック | 認知症リスク評価方法及び認知症リスク評価システム |
| JPWO2024177086A1 (ja) * | 2023-02-21 | 2024-08-29 | ||
| JP7698805B2 (ja) | 2023-02-21 | 2025-06-25 | 株式会社レナテック | 認知症リスク評価方法及び認知症リスク評価システム |
Also Published As
| Publication number | Publication date |
|---|---|
| JPWO2016042805A1 (ja) | 2017-04-27 |
| US20170254821A1 (en) | 2017-09-07 |
| KR20170054384A (ko) | 2017-05-17 |
| JP6082478B2 (ja) | 2017-02-15 |
| EP3182132A4 (en) | 2017-10-25 |
| US10845372B2 (en) | 2020-11-24 |
| EP3182132A1 (en) | 2017-06-21 |
| SG11201702076WA (en) | 2017-06-29 |
| EP3182132B1 (en) | 2019-01-02 |
| KR102305151B1 (ko) | 2021-09-27 |
Similar Documents
| Publication | Publication Date | Title |
|---|---|---|
| JP6082478B2 (ja) | 癌評価方法及び癌評価システム | |
| KR102635700B1 (ko) | 암 리스크 평가 방법 및 암 리스크 평가 시스템 | |
| Zheng et al. | Serum creatinine/cystatin C ratio as a screening tool for sarcopenia and prognostic indicator for patients with esophageal cancer | |
| JP6692422B2 (ja) | 尿中代謝物による疾病診断法 | |
| JP7288283B2 (ja) | 小児がん検査用尿中代謝物マーカー | |
| Yin et al. | Identifying cancer cachexia in patients without weight loss information: machine learning approaches to address a real-world challenge | |
| CN111965240A (zh) | 用于甲状腺癌相关筛查及评估的产品、应用及方法 | |
| Szefel et al. | Bioelectrical impedance analysis to increase the sensitivity of screening methods for diagnosing cancer cachexia in patients with colorectal cancer | |
| CN111965235A (zh) | 用于胰腺癌相关筛查及评估的产品、应用及方法 | |
| CN111965242A (zh) | 用于肝细胞癌相关筛查及评估的产品、应用及方法 | |
| CN117169320A (zh) | 一组用于结直肠癌诊断的血液多金属离子组合及其应用 | |
| JP7698805B2 (ja) | 認知症リスク評価方法及び認知症リスク評価システム | |
| CN111965237A (zh) | 用于结直肠癌相关筛查及评估的产品、应用及方法 | |
| JP6629782B2 (ja) | 加齢黄斑変性症のリスク評価方法及びシステム | |
| Apollos et al. | Performance evaluation of Veri-Q Red Haemoglobin Meter for point-of-care haemoglobin and packed cell volume estimations | |
| CN111965241A (zh) | 用于卵巢癌相关筛查及评估的产品、应用及方法 | |
| RU2827968C1 (ru) | Способ выявления рака легкого, рака предстательной железы, рака жкт у мужчин | |
| JP6875451B2 (ja) | 犬のがんリスク評価方法及びがんリスク評価システム | |
| JP7534426B2 (ja) | 代謝物パネルによるがん検査法 | |
| WO2020067261A1 (ja) | 犬のがんリスク評価方法及びがんリスク評価システム | |
| Kulkarni et al. | S0335 Colorectal Cancer Screening Gender and Race Disparities in Western PA… Is There Really a Difference? | |
| JP2021131345A (ja) | 癌の判別方法、判別装置およびプログラム | |
| CN111965236A (zh) | 用于嗜铬细胞瘤及副神经节瘤相关筛查及评估的产品、应用及方法 | |
| CN111965234A (zh) | 用于前列腺癌相关筛查及评估的产品、应用及方法 |
Legal Events
| Date | Code | Title | Description |
|---|---|---|---|
| ENP | Entry into the national phase |
Ref document number: 2015549896 Country of ref document: JP Kind code of ref document: A |
|
| 121 | Ep: the epo has been informed by wipo that ep was designated in this application |
Ref document number: 15841232 Country of ref document: EP Kind code of ref document: A1 |
|
| ENP | Entry into the national phase |
Ref document number: 20177005279 Country of ref document: KR Kind code of ref document: A |
|
| REEP | Request for entry into the european phase |
Ref document number: 2015841232 Country of ref document: EP |
|
| WWE | Wipo information: entry into national phase |
Ref document number: 2015841232 Country of ref document: EP |
|
| NENP | Non-entry into the national phase |
Ref country code: DE |
|
| WWE | Wipo information: entry into national phase |
Ref document number: 15511329 Country of ref document: US |
|
| WWE | Wipo information: entry into national phase |
Ref document number: 11201702076W Country of ref document: SG |