WO2016063446A1 - 説明変数表示優先順位決定システム、方法およびプログラム - Google Patents
説明変数表示優先順位決定システム、方法およびプログラム Download PDFInfo
- Publication number
- WO2016063446A1 WO2016063446A1 PCT/JP2015/004284 JP2015004284W WO2016063446A1 WO 2016063446 A1 WO2016063446 A1 WO 2016063446A1 JP 2015004284 W JP2015004284 W JP 2015004284W WO 2016063446 A1 WO2016063446 A1 WO 2016063446A1
- Authority
- WO
- WIPO (PCT)
- Prior art keywords
- explanatory variable
- display priority
- variable
- value
- explanatory
- Prior art date
- Legal status (The legal status is an assumption and is not a legal conclusion. Google has not performed a legal analysis and makes no representation as to the accuracy of the status listed.)
- Ceased
Links
Images






Classifications
-
- G—PHYSICS
- G06—COMPUTING OR CALCULATING; COUNTING
- G06Q—INFORMATION AND COMMUNICATION TECHNOLOGY [ICT] SPECIALLY ADAPTED FOR ADMINISTRATIVE, COMMERCIAL, FINANCIAL, MANAGERIAL OR SUPERVISORY PURPOSES; SYSTEMS OR METHODS SPECIALLY ADAPTED FOR ADMINISTRATIVE, COMMERCIAL, FINANCIAL, MANAGERIAL OR SUPERVISORY PURPOSES, NOT OTHERWISE PROVIDED FOR
- G06Q10/00—Administration; Management
- G06Q10/06—Resources, workflows, human or project management; Enterprise or organisation planning; Enterprise or organisation modelling
- G06Q10/063—Operations research, analysis or management
-
- G—PHYSICS
- G06—COMPUTING OR CALCULATING; COUNTING
- G06Q—INFORMATION AND COMMUNICATION TECHNOLOGY [ICT] SPECIALLY ADAPTED FOR ADMINISTRATIVE, COMMERCIAL, FINANCIAL, MANAGERIAL OR SUPERVISORY PURPOSES; SYSTEMS OR METHODS SPECIALLY ADAPTED FOR ADMINISTRATIVE, COMMERCIAL, FINANCIAL, MANAGERIAL OR SUPERVISORY PURPOSES, NOT OTHERWISE PROVIDED FOR
- G06Q30/00—Commerce
- G06Q30/02—Marketing; Price estimation or determination; Fundraising
Definitions
- the present invention relates to an explanatory variable display priority determining system, an explanatory variable display priority determining method, and an explanatory variable display priority determining program for determining priorities when displaying explanatory variables.
- Estimating the future from available data in various business fields is effective for business improvement. For example, in a store, if future sales can be estimated from sales data for the last two weeks, inventory management can be performed appropriately.
- Non-Patent Document 1 discloses software that supports analysis of available data performed by an analyst such as a statistician.
- the software disclosed in Non-Patent Document 1 has an estimation function and a function for visualizing an estimation result.
- Non-Patent Document 2 when a prediction formula is automatically selected from a plurality of prediction formulas and a predicted value is calculated using the prediction formula, the selected prediction formula is displayed together with a graph of predicted values and actual values. It displays that the graph which shows transition of is displayed.
- an expression representing regularity found between the objective variable and the explanatory variable is called an “estimation expression”.
- a value estimated using the estimation formula is referred to as an “estimated value”.
- the estimation formula is represented in the following format, for example.
- y is an estimated value.
- X 1 , x 2 ,..., X n are explanatory variables.
- b is a constant term, and a 1 , a 2 ,..., a n , b are determined in advance using learning data.
- the estimated value y can be calculated using the above formula.
- SAS Visual Analytics SAS Institute Japan, Inc., [October 23, 2014 search], Internet ⁇ URL: http://www.sas.com/en_us/software/business-intelligence/visual-analytics.html> “Machine learning that has taken a step forward, penetration of data usage increased rapidly with IoT”, Nikkei BP, “Nikkei Big Data”, 2014 06, p. 7-12
- each explanatory variable for example, change in the value of each explanatory variable
- each explanatory variable can be grasped together with the display of the change in the estimated value.
- explanatory variables there are many types of explanatory variables, and when all explanatory variables are displayed in a random order, it may be difficult for an analyst to understand the relationship between the explanatory variables and the estimated values.
- the present invention provides an explanatory variable display priority determination system, an explanatory variable display priority determination method, and an explanation capable of determining display priority for explanatory variables given for calculating an estimated value and displaying the explanatory variables.
- An object is to provide a variable display priority determination program.
- the display priority of each explanatory variable used in the estimation of the value by the estimation formula is based on the residual that is the estimated amount of error between the estimated value by the estimation formula and the actual measurement value.
- Display priority determining means for determining the display variable, and display means for displaying the explanatory variable according to the display priority displays the explanatory variable based on the magnitude of the influence of the explanatory variable on the residual. The priority order is determined.
- the explanatory variable display priority determination system determines the display priority of each explanatory variable used in the estimation of the value by the estimation formula based on the coefficient of each explanatory variable in the estimation formula.
- a display means for displaying a change in the estimated value by the estimation formula and a change in the value of the explanatory variable along a predetermined axis.
- the explanatory variable display priority determination method provides the display priority of each explanatory variable used in the estimation of the value by the estimation formula as a residual that is an estimated amount of error between the estimated value by the estimation formula and the actual measurement value. Display the explanatory variables according to the display priority, and determine the display priority of the explanatory variables based on the magnitude of the influence of the explanatory variables on the residual when the display priority is determined.
- the explanatory variable display priority determination method determines the display priority of each explanatory variable used in the estimation of the value by the estimation formula based on the coefficient of each explanatory variable in the estimation formula, A change in the estimated value and a change in the value of the explanatory variable are displayed along a predetermined axis.
- the explanatory variable display priority determination program causes the computer to display the display priority of each explanatory variable used in the estimation of the value by the estimation formula by the estimated amount of error between the estimated value by the estimation formula and the actual measurement value.
- a display priority determination process that is determined based on a certain residual and a display process that displays explanatory variables according to the display priority are executed. Based on the influence of the explanatory variable on the residual in the display priority determination process The display priority order of the explanatory variables is determined.
- the explanatory variable display priority determination program displays to the computer the display priority of each explanatory variable used in the estimation of the value by the estimation formula based on the coefficient of each explanatory variable in the estimation formula. It is characterized by executing a priority order determination process and a display process for displaying a change in an estimated value by an estimation formula and a change in the value of an explanatory variable along a predetermined axis.
- the estimation formula is represented by, for example, the following formula (1).
- Y is an estimated value.
- the object estimated by Expression (1) for example, traffic volume and the like can be mentioned, but the object to be estimated is not particularly limited.
- explanatory variables are represented as x 1 , x 2 ,..., X n .
- the number of explanatory variables represented in Formula (1) is not particularly limited.
- the estimated value y is obtained using equation (1).
- Continuous variables take numerical values.
- the continuous variable for example, air temperature or the like can be cited.
- Categorical variables take items as values. Examples of categorical variables include “gender”. Taking “gender” as an example, the possible values of “sex” as a categorical variable are “male” and “female”. Other examples of categorical variables include days of the week. Taking “day of the week” as an example, possible values of “day of the week” as a categorical variable are, for example, “Sunday”, “Monday”,..., “Saturday”.
- One continuous variable corresponds to one of the explanatory variables in the estimation formula (in other words, the explanatory variables included in the estimation formula) x 1 , x 2 ,..., X n . Then, when the value (numerical value) of the explanatory variable corresponding to the continuous variable is given, the value is assigned to the corresponding explanatory variable in the estimation formula.
- Each value of one categorical variable corresponds to one of explanatory variables x 1 , x 2 ,..., X n in the estimation formula.
- the possible values of “day of the week” which is a categorical variable are the explanatory variables x 1 , x 2 ,..., X n in the estimation formula, respectively.
- each explanatory variable in the estimation formula corresponding to each value of the categorical variable has two values (for example, 0 and 1). Either value is assigned.
- the value of the continuous variable is input to the explanatory variable in the estimation equation corresponding to the continuous variable, and one of the binary values is input to each explanatory variable in the estimation equation corresponding to each value of the categorical variable.
- an estimated value y is obtained.
- each value of one categorical variable corresponds to one of the explanatory variables x 1 , x 2 ,..., X n in the estimation formula. Therefore, it can be said that one categorical variable corresponds to a plurality of explanatory variables in the estimation formula.
- the present invention determines the display priority of explanatory variables (various continuous variables and various categorical variables) given to calculate the estimated value y.
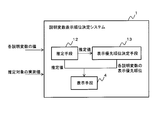
- FIG. FIG. 1 is a block diagram illustrating a configuration example of an explanatory variable display priority determination system according to the first embodiment of this invention.
- the explanatory variable display priority determination system 1 of the first embodiment includes an estimation unit 2, a display priority determination unit 3, and a display unit 4.
- the explanatory variable display priority determination system 1 receives various explanatory variable values corresponding to continuous variables and categorical variables via an input device (not shown in FIG. 1).
- the estimation means 2 calculates an estimated value using an estimation formula expressed in a predetermined formula (1).
- the estimation formula used by the estimation means 2 is determined in advance using learning data.
- the estimation unit 2 substitutes the value of the input explanatory variable corresponding to the continuous variable into the explanatory variable in the estimation formula corresponding to the continuous variable. Further, the estimating means 2 substitutes 1 for an explanatory variable in the estimation expression corresponding to the value of the explanatory variable corresponding to the input categorical variable, and in the estimation expression corresponding to each other value of the categorical variable. Substitute 0 for each explanatory variable. And the estimation means 2 calculates the estimated value y by calculating an estimation formula.
- each explanatory variable is input to the explanatory variable display priority determination system 1, and the estimation means 2 calculates the estimated value y based on the value of each explanatory variable and the estimation formula.
- the value of each explanatory variable is associated with time information, for example. In this case, the estimation means 2 calculates the estimated value y at each time point based on the value of each explanatory variable at each time point and the estimation formula.
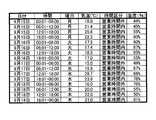
- FIG. 2 is a diagram showing an example of explanatory variables input to the explanatory variable display priority order determination system 1.
- “date” and “time” correspond to time information.
- the explanatory variables “day of the week”, “temperature”, “time division”, and “humidity” are associated with this time information.
- “Day of the week” and “Time division” are categorical variables.
- the possible values of “time division” are “within business hours” and “out of business hours”.
- “Air temperature” and “humidity” are continuous variables.
- the estimation unit 2 may calculate the estimated value y for each row illustrated in FIG.
- the estimation unit 2 sends the calculated estimated value y to the display unit 4.
- the estimating unit 2 associates the calculated estimated value y with the time information corresponding to the estimated value y, and sends it to the display unit 4.
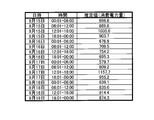
- FIG. 3 is a diagram showing an example of the calculated estimated value y.
- the power consumption is illustrated as the estimated value y.
- this estimated value (power consumption amount) is a value obtained by the value of each explanatory variable shown in FIG. 2 and the estimation formula.
- “Date” and “Time” shown in FIG. 3 are the same as “Date” and “Time” shown in FIG. 2, and “Date” and “Time” correspond to time information in FIG.
- the estimation unit 2 may send the estimated value y and the time information to the display unit 4 in association with each row illustrated in FIG.
- the display priority determining means 3 determines the display priority of each explanatory variable when displaying the change in the value of the explanatory variable input to the explanatory variable display priority determining system 1.
- the “change in the value of the explanatory variable” is, for example, a change in the value of the explanatory variable along the time axis.
- the display priority order determining means 3 is a coefficient (more specifically, a coefficient of each of the explanatory variables x 1 , x 2 ,..., X n in the estimation formula used by the estimating means 2 to calculate the estimated value y.
- the display priority order is determined based on the absolute value.
- the display priority determining means 3 increases the display priority of the explanatory variable as the absolute value of the coefficient of the explanatory variable in the estimation equation corresponding to the explanatory variable to which the value is input is increased, and the smaller the absolute value of the coefficient is as the absolute value of the coefficient is. Decrease the display priority of explanatory variables.
- explanatory variables to which values are input are continuous variables (for example, temperature, humidity, etc.), and individual explanatory variables x 1 , x 2 ,..., X n in the estimation formula. Also correspond to continuous variables.
- the display priority determining means 3 compares the absolute values of the coefficients of the explanatory variables in the estimation formula corresponding to the continuous variables, and displays the priority of the continuous variables in descending order of the absolute values of the coefficients. What is necessary is just to determine a ranking.
- the explanatory variable having the larger absolute value of the coefficient has a larger influence on the estimated value y.
- the explanatory variable corresponding to x 1 is estimated more than the explanatory variable corresponding to x 2
- the influence on y is great. Therefore, by determining the display priority of each continuous variable in descending order of the absolute value of the coefficient, it is possible to preferentially display the change in the value of the explanatory variable that has a large influence on the estimated value y.
- the explanation variables used for calculating the estimated value y are all assumed to be continuous variables.
- the explanatory variables used for calculating the estimated value y are not limited to continuous variables, but may include categorical variables.
- the value of the categorical variable is also input to the explanatory variable display priority determination system 1.
- the estimation formula includes explanatory variables corresponding to each value (each item) of the categorical variable.
- the display priority determining means 3 determines the display priority of each explanatory variable as follows.
- the display priority order determination means 3 calculates the sum of the absolute values of the coefficients of each explanatory variable in the estimation formula corresponding to each value of the categorical variable for each categorical variable. In this case, one value is calculated for each categorical variable. Then, the display priority determining means 3 determines the category based on the sum of the absolute values of the coefficients calculated for each categorical variable and the absolute value of the coefficient of each explanatory variable in the estimation formula corresponding to each continuous variable. The display priority of each explanatory variable that is a type variable and each explanatory variable that is a continuous type variable is determined.
- the display priority determination means 3 selects the category in descending order of the value calculated for each categorical variable (sum of the absolute values of the coefficients) and the absolute value of the coefficient in the estimation formula corresponding to each continuous variable. The display priority of each explanatory variable that is a type variable and each explanatory variable that is a continuous type variable is determined.
- the display priority order determination means 3 sends the display priority order of each explanatory variable thus determined to the display means 4.
- the display unit 4 displays the change in the estimated value calculated by the estimation unit 2 and also displays the change in the value of the explanatory variable according to the display priority determined by the display priority determination unit 3.
- FIG. 4 is a schematic diagram showing a display example by the display means 4.
- the display unit 4 displays, for example, a change in the estimated value y in the estimated value display area 11 defined at the upper part of the screen (see FIG. 4).
- the change in the estimated value y is displayed along the axis between axes (horizontal axis).
- the display means 4 displays the change of the value of various explanatory variables according to a display priority order below the estimated value display area 11 (refer FIG. 4).
- FIG. 4 is a schematic diagram showing a display example by the display means 4.
- the display unit 4 displays, for example, a change in the estimated value y in the estimated value display area 11 defined at the upper part of the screen (see FIG. 4).
- the change in the estimated value y is displayed along the axis between axes
- the change in the value of the explanatory variable is displayed along the time axis.
- the time axis in the estimated value display area 11 and the time axis for displaying the change in the value of the explanatory variable are aligned with each other.
- the change in the estimated value y and the explanatory variable It is preferable to display the change in value along a common time axis. By displaying in this way, the analyst can intuitively understand how the estimated value y and the value of the explanatory variable correlate along the time axis.
- the values shown in parentheses indicate the display priority.
- the display means 4 changes the value of the explanatory variable “temperature”, the value of the explanatory variable “time division”, the value of the explanatory variable “day of the week” from the side closer to the estimated value display area 11 in the order of display priority. Changes in values and changes in the value of the explanatory variable “humidity” are displayed.
- the display unit 4 may display changes in the values of all explanatory variables in the order of display priority. Alternatively, the display unit 4 may display the change in the value of the explanatory variable up to the upper predetermined number in the display priority order.
- FIG. 4 illustrates the case where the display unit 4 represents the change in the value of the explanatory variable in a heat map format (a format for displaying a color or a pattern according to the value).
- the display mode of the change is not particularly limited.
- the display unit 4 may display a change in the value of the explanatory variable in a line graph or the like.
- the display means 4 may switch the display mode of the change of the value of each explanatory variable according to the operation of the analyst.
- the estimated value y and the value of the explanatory variable are displayed along the time axis (horizontal axis), but the horizontal axis is not limited to the time axis. As long as the information corresponding to the horizontal axis is associated with the value of the explanatory variable, the information corresponding to the horizontal axis is not limited to time information, and may be arbitrary information.
- the estimation unit 2, the display priority order determination unit 3, and the display unit 4 are realized by, for example, a CPU of a computer that performs an input device and a display device.
- the CPU reads the explanatory variable display priority determination program from a program recording medium such as a computer program storage device (not shown in FIG. 1), and in accordance with the explanatory variable display priority determination program, What is necessary is just to operate
- the display means 4 a portion for causing the display device to execute display is realized by the CPU.
- Each means may be realized by separate hardware.
- the explanatory variable display priority determination system 1 may have a configuration in which two or more physically separated devices are connected by wire or wirelessly. This also applies to embodiments described later.
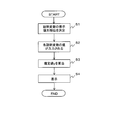
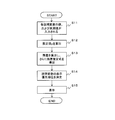
- FIG. 5 is a flowchart illustrating an example of processing progress of the first embodiment.
- the display priority determining means 3 determines the display priority of each explanatory variable to which a value is input based on the coefficient of each explanatory variable in the estimation formula used by the estimating means 2 for calculating the estimated value (step S1).
- step S1 The process of step S1 will be specifically described.
- the estimation formula used by the estimation means 2 is the estimation formula shown in FIG.
- the explanatory variables x 1 to x 7 in the estimation formula are the values of the explanatory variable “day of the week” (“Sunday”, “Monday”,... ]).
- the explanatory variable x 8 in estimation formula corresponds to the explanatory variable "temperature” is a continuous variable.
- the explanatory variables x 9 and x 10 in the estimation formula correspond to the values of the explanatory variable “time segment” (“within business hours” and “out of business hours”), which are categorical variables, respectively.
- the explanatory variable x 11 in estimation formula corresponds to a continuous variable explanatory variables "humidity".
- the estimation formula shown in FIG. 6 is schematically shown for simplicity of explanation, and the number of x n in the estimation formula and what kind of explanatory variable the x n in the estimation formula corresponds to. It is not limited to the example shown in FIG.
- the explanatory variable display priority determination system 1 includes, for example, a value of “day of the week”, a value of “temperature”, a value of “time segment”, “ A set of values of “humidity” is input.
- the display priority order determination means 3 calculates the sum of the absolute values of the coefficients of each explanatory variable in the estimation formula corresponding to each value of the categorical variable for each categorical variable.
- the display priority determining means 3 calculates the sum of absolute values of the coefficients x 1 to x 7 corresponding to the values of “day of the week” for the categorical variable “day of the week”. That is, the display priority determination means 3 calculates
- the display priority determination means 3 calculates the sum of absolute values of the respective coefficients of x 9 and x 10 corresponding to the respective values of the “time segment” with respect to the categorical variable “time segment”. That is, the display priority order determination unit 3 calculates
- the display priority determining means 3 calculates the absolute value of the coefficient of each explanatory variable in the estimation formula corresponding to the values a 1to7 and a 9to10 calculated for each categorical variable and the continuous variables “temperature” and “humidity”. Based on the above, the display priorities of the explanatory variables “day of the week” and “time division” which are categorical variables and the explanatory variables “temperature” and “humidity” which are continuous variables are determined.
- the absolute value of the coefficient of the explanatory variable x 8 in the estimation equation corresponding to “temperature” is
- the absolute value of the coefficient of the explanatory variable x 11 in the estimation equation corresponding to “humidity” is
- the display priority determination means 3 determines the display priority of “day of the week”, “time division”, “temperature”, and “humidity” in descending order of a 1to7 , a 9to10 ,
- the estimating means 2 calculates the estimated value y from the value of each explanatory variable and the estimation formula (step S2). S3). For example, “Sunday”, “25 ° C.”, “Outside business hours”, and “60%” are input as values of each explanatory variable “day of the week”, “temperature”, “time category”, and “humidity” at a certain time.
- the estimated value y at the time is calculated.
- the estimation means 2 calculates the estimated values at other time points in the same manner.
- the estimation unit 2 associates the calculated estimated value y with the time information corresponding to the estimated value y and sends it to the display unit 4.
- the display unit 4 displays the change in the estimated value y, and displays the change in the value of the explanatory variable according to the display priority determined in step S ⁇ b> 1 (step). S4).
- the display priorities of “temperature”, “time category”, “day of the week”, and “humidity” are 1st, 2nd, 3rd, and 4th respectively
- the display means 4 estimates From the side close to the value display area 11 (see FIG. 4), a change in temperature, a change in time division, a change in day of the week, and a change in humidity may be displayed.
- the display means 4 may display the change in the value of the explanatory variable up to the upper predetermined number (for example, the upper third) of the display priority. For example, the top number of explanatory variable values to be displayed may be determined in advance.
- the present embodiment as described above, it is possible to set the display priority for the explanatory variable given for calculating the estimated value and display the change in the value of the explanatory variable. As a result, a change in the value of the explanatory variable that has a large influence on the estimated value y can be preferentially displayed.
- the display unit 4 displays the change in the estimated value along a predetermined axis (typically, the time axis), and further, the change in the value of the explanatory variable is also the common time axis. Display along. In other words, the display unit 4 displays the change in the estimated value and the change in the value of the explanatory variable along the same axis. This makes it easy for the analyst to intuitively understand how the change in the estimated value and the change in the explanatory variable are linked along the predetermined axis.
- a predetermined axis typically, the time axis
- the change in the value of the explanatory variable is also the common time axis. Display along.
- the display unit 4 displays the change in the estimated value and the change in the value of the explanatory variable along the same axis. This makes it easy for the analyst to intuitively understand how the change in the estimated value and the change in the explanatory variable are linked along the predetermined axis.
- the target displayed according to the display priority order is not limited to the change in the value of the explanatory variable.
- the display unit 4 may display the names of the explanatory variables according to the display priority when displaying the names of the explanatory variables side by side. This also applies to the embodiments described later.
- the estimation unit 2 uses one estimation formula.
- two or more estimation formulas used by the estimation unit 2 may exist.
- the estimation unit 2 may select one estimation formula from a plurality of estimation formulas, and calculate an estimated value using the selected estimation formula.
- the operation in this case will be described as a modification of the first embodiment. Note that description of operations similar to those already described is omitted.
- the configuration of the explanatory variable display priority determination system in this modification is the same as the configuration shown in FIG. However, operations of the estimation unit 2 and the display priority order determination unit 3 are partially different. The operation of the display priority determining means 3 will be described later.
- the estimation means 2 stores a model for selecting an estimation formula.
- This model is a model in which one estimation formula can be determined according to the value of each explanatory variable at each time point.
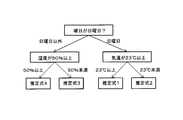
- FIG. 7 is a schematic diagram illustrating an example of a model for selecting an estimation formula.
- the estimation means 2 selects an estimation formula from the model schematically shown in FIG. 7 according to the value of each explanatory variable at a certain point in time, and calculates an estimated value based on the value of each explanatory variable at that point and the selected estimation formula To do.
- the operation for calculating the estimated value y using the estimation formula is the same as the operation in the first embodiment described above.
- a plurality of estimation formulas and a model for selecting the estimation formulas are determined in advance using learning data.
- FIG. 7 shows a tree structure model
- the model may have a common leaf and a plurality of tree structures with different roots.
- step S1 the display priority determining means 3 determines the display priority of each explanatory variable to which a value is input based on the coefficient of each explanatory variable in a plurality of estimation formulas used by the estimating means 2 for calculating the estimated value. To decide.
- the two estimation expressions include explanatory variables x 1 to x 11 , respectively.
- the explanatory variables x 1 to x 7 in each estimation formula shown in FIG. 8 correspond to the respective values of the explanatory variable “day of the week” that is a categorical variable.
- the explanatory variable x 8 in each estimation formula corresponds to the explanatory variable "temperature" is a continuous variable.
- explanatory variables x 9 and x 10 in each estimation formula correspond to the respective values of the explanatory variable “time segment” which is a categorical variable.
- explanatory variable x 11 in each estimation formula corresponds to a continuous variable explanatory variables "humidity".
- the two estimation formulas shown in FIG. 8 are schematically shown for simplicity of explanation, and the number of x n in the estimation formula and what kind of explanatory variable the x n in the estimation formula corresponds to. It is not limited to the example shown in FIG.
- the display priority order determination unit 3 calculates, for each categorical variable, the sum of the absolute values of the coefficients of each explanatory variable in all the estimation equations corresponding to each value of the categorical variable.
- the display priority determining means 3 relates to the categorical variable “day of the week”, the absolute value of each coefficient of x 1 to x 7 corresponding to each value of “day of the week” in the first estimation formula, And the sum of the absolute values of the coefficients x 1 to x 7 corresponding to the values of “day of the week” is calculated by the second equation.
- the display priority order determination means 3 uses
- the display priority determining means 3 relates to the absolute value of each coefficient of x 9 and x 10 corresponding to each value of the “time segment” in the first estimation formula for the categorical variable “time segment”, and 2
- the sum of absolute values of the respective coefficients of x 9 and x 10 corresponding to the respective values of the “time segment” is calculated by the second equation. That is, the display priority order determination unit 3 calculates
- the display priority order determination unit 3 calculates, for each continuous variable, the sum of the absolute values of the coefficients of the explanatory variables in all the estimation equations corresponding to the continuous variable.
- the display priority determining means 3 with respect continuous variables "Temperature”, the absolute value of the coefficient of x 8 corresponding to "temperature” in the first estimation formula, and in the second estimation equation to calculate the sum of the absolute values of the coefficient of x 8 that corresponds to the "temperature”. That is, the display priority determination means 3 calculates
- the display priority determining means 3 with respect continuous variables "humidity", the absolute value of the coefficient of x 11, corresponding to the "humidity” in the first estimation formula, and the "humidity” second estimated equation Calculate the sum of the absolute values of the corresponding x 11 coefficients. That is, the display priority order determination unit 3 calculates
- the display priority determining means 3 then calculates the sum of the absolute values of the coefficients calculated for each categorical variable (A 1 , A 2 in this example) and the sum of the absolute values of the coefficients calculated for each continuous variable ( In this example, the display priority of each explanatory variable that is a categorical variable and each explanatory variable that is a continuous variable is determined based on A 3 , A 4 ). In this example, the display priority determination means 3 determines the display priority of “day of the week”, “time division”, “temperature”, and “humidity” in descending order of A 1 , A 2 , A 3 , A 4. .
- the display priority determining means 3 sets the display priority to 1 in the order of “temperature”, “time category”, “day of the week”, “humidity”. First place, second place, third place, fourth place.
- the estimation unit 2 uses the value of each explanatory variable and the above-described model (model for selecting an estimation formula). Then, an estimation formula is selected, and an estimated value is calculated from the value of each explanatory variable and the selected estimation formula (step S3).
- Step S4 is the same as step S4 already described, and the description is omitted.
- step S1 is not limited to the above example.
- the explanatory variable display priority determination system 1 may execute step S1 after step S3.
- FIG. FIG. 9 is a block diagram illustrating a configuration example of the explanatory variable display priority determination system according to the second embodiment of this invention.
- the explanatory variable display priority determination system 1 according to the second embodiment includes an estimation unit 12, a display priority determination unit 13, and a display unit 4.
- the display unit 4 is the same as the display unit 4 in the first embodiment, and a description thereof will be omitted.
- the value of each explanatory variable is input via an input device (not shown in FIG. 9), as in the first embodiment.
- the actual measurement value of the estimation target corresponding to the set of explanatory variables is also input to the explanatory variable display priority determination system 1 via the input device.
- the explanatory variable display priority order determination system 1 of the present embodiment calculates an estimated value based on the value of each explanatory variable at each time point for which an actual measurement value has already been obtained, and the estimated value and the actual measurement value at each time point. Find the error with.
- the explanatory variable display priority determination system 1 derives an estimation formula (hereinafter referred to as a residual estimation formula) for obtaining a residual that is an estimated value of the error, and each explanation in the residual estimation formula. Based on the coefficient of the variable, the display priority order of each explanatory variable to which the value is input is determined.
- a residual estimation formula an estimation formula for obtaining a residual that is an estimated value of the error
- each explanatory variable input to the explanatory variable display priority determination system 1 is associated with time information as illustrated in FIG.
- the actual measurement value input to the explanatory variable display priority determination system 1 is also associated with the time information.
- the estimating means 12 uses the estimated expression expressed in the form of the predetermined formula (1) and the value of each explanatory variable at each time point.
- the estimated value y is calculated. Since the operation of calculating the estimated value y using the estimation formula has been described in the first embodiment, description thereof is omitted here.
- the estimating means 12 selects one estimation formula from a plurality of estimation formulas, as in the modification of the first embodiment, and the estimation formula The estimated value y may be calculated using
- the estimation unit 12 sends the calculated estimated value y at each time point to the display priority order determination unit 13 and the display unit 4.
- the display priority order determination means 13 calculates an error between the estimated value y calculated by the estimation means 12 and the actual measurement value input to the explanatory variable display priority determination system 1 for each time point. That is, assuming that the actual measurement value is Y and the error between the estimated value y and the actual measurement value Y is Z, the display priority determining means 13 calculates the error Z by calculation of the following equation (2) at each time point. calculate.
- the display priority order determination means 13 derives an estimation formula (residual estimation formula) for calculating a residual that is an estimated value of the error after calculating the error Z at each time point.
- the residual is represented by the symbol z.
- the display priority determination means 13 derives a residual estimation formula including each explanatory variable x 1 , x 2 ,..., X n in the estimation formula shown in Formula (1).
- the display priority determination means 13 may derive a residual estimation formula by performing regression analysis using the value of each explanatory variable and the error Z at each time point, for example.
- the error estimation formula is expressed as the following formula (3).
- d is a constant term
- c 1 to c n are coefficients of x 1 to x n , respectively.
- the display priority order determination means 13 receives each value that is input based on the coefficient (more specifically, the absolute value of the coefficient) of each explanatory variable in the residual estimation expression expressed as Expression (3). Determine the display priority of explanatory variables.
- the display priority determining means 13 determines the display priority based on the coefficient of each explanatory variable in the residual estimation formula.
- the display priority determining means 3 is as shown in Expression (1). This is the same as the operation of determining the display priority based on the coefficient of each explanatory variable in the estimated expression. That is, the display priority order determination unit 13 calculates, for each categorical variable, the sum of the absolute values of the coefficients of each explanatory variable in the residual estimation formula corresponding to each value of the categorical variable.
- the display priority order determination means 13 is based on the sum of the absolute values of the coefficients calculated for each categorical variable and the absolute values of the coefficients of each explanatory variable in the residual estimation formula corresponding to each continuous variable.
- the display priority of each explanatory variable that is a categorical variable and each explanatory variable that is a continuous variable is determined.
- the display priority order determining means 13 is arranged in descending order of the value calculated for each categorical variable (sum of absolute values of coefficients) and the absolute value of coefficients in the residual estimation formula corresponding to each continuous variable.
- the display priority of each explanatory variable that is a categorical variable and each explanatory variable that is a continuous variable is determined.
- the display priority order determination means 13 sends the display priority order of each explanatory variable thus determined to the display means 4.
- the estimation unit 12, the display priority order determination unit 13, and the display unit 4 are realized by, for example, a CPU of a computer that performs an input device and a display device.
- the CPU reads the explanatory variable display priority determination program from a program recording medium such as a computer program storage device (not shown in FIG. 9), for example, and according to the explanatory variable display priority determination program, the estimation means 12, What is necessary is just to operate
- a program recording medium such as a computer program storage device (not shown in FIG. 9)
- FIG. 10 is a flowchart illustrating an example of processing progress of the second embodiment.
- the estimating means 12 calculates the value of each explanatory variable at each time point.
- the estimated value y at each time point is calculated using the estimation formula (step S12).
- the display priority order determination means 13 calculates the error Z between the estimated value y calculated by the estimation means 12 and the actual measurement value Y input in step S11 for each time point. Calculated by (2). Then, the display priority determination means 13 uses the error Z at each time point and the value of each explanatory variable at each time point input in step S11, for example, in the form of equation (3) by regression analysis. An error estimation expression is derived (step S13).
- the display priority determining means 13 determines the display priority of each explanatory variable to which a value is input based on the coefficient of each explanatory variable in the residual estimation formula (step S14). As described above, the operation in which the display priority determining unit 13 determines the display priority based on the coefficient of each explanatory variable in the residual estimation formula is performed by the display priority determining unit 3 in the first embodiment. This is the same as the operation for determining the display priority based on the coefficient of each explanatory variable in the estimation formula expressed as 1).
- step 14 The process of step 14 will be specifically described. Assume that the residual derivation formula derived in step S13 is the formula shown in FIG. As in the case shown in FIG. 6, the explanatory variables x 1 to x 7 in the residual estimation formula shown in FIG. 11 correspond to the respective values of the explanatory variable “day of the week” that is a categorical variable. The explanatory variable x 8 in the residual estimation formula corresponds to the explanatory variable “temperature” which is a continuous variable. Further, the explanatory variables x 9 and x 10 in the residual estimation formula correspond to the respective values of the explanatory variable “time segment” which is a categorical variable.
- the explanatory variable x 11 residual in estimation formula corresponds to a continuous variable explanatory variables "humidity".
- the residual estimation formula shown in FIG. 11 is schematically shown for the sake of simplicity. What is the number of x n in the residual estimation formula and what is x n in the residual estimation formula? Whether it corresponds to the explanatory variable is not limited to the example shown in FIG.
- the display priority determination means 13 calculates the sum of the absolute values of the coefficients of each explanatory variable in the residual estimation formula corresponding to each value of the categorical variable for each categorical variable.
- the display priority determining means 13 calculates the sum of absolute values of the coefficients x 1 to x 7 corresponding to the values of “day of the week” for the categorical variable “day of the week”. That is, the display priority order determination unit 13 calculates
- the display priority determination means 13 calculates the sum of absolute values of the respective coefficients of x 9 and x 10 corresponding to the respective values of the “time segment” with respect to the categorical variable “time segment”. That is, the display priority order determination means 13 calculates
- the display priority determining means 13 calculates the coefficients c1to7 and c9to10 calculated for each categorical variable and the coefficients of the explanatory variables in the residual estimation formula corresponding to the continuous variables “temperature” and “humidity”. Based on the absolute value, the display priorities of the explanatory variables “day of the week” and “time division” which are categorical variables and the explanatory variables “temperature” and “humidity” which are continuous variables are determined.
- the absolute value of the coefficient of the explanatory variable x 8 in the residual estimation formula corresponding to “temperature” is
- the absolute value of the coefficient of the explanatory variable x 11 in the residual estimation formula corresponding to “humidity” is
- the display priority determining means 13 determines the display priority of “day of the week”, “time division”, “temperature”, and “humidity” in descending order of c 1to7 , c 9to10 ,
- Step S15 is the same as step S4 in the first embodiment.
- the display unit 4 displays a change in the estimated value y and a change in the value of each explanatory variable along a common time axis.
- the display unit 4 may display the change in the actual measurement value Y together with the change in the estimation value y in the estimated value display area 11.
- the display priority determining means 13 determines the display priority based on the absolute value of the coefficient of the explanatory variable in the residual estimation formula. Accordingly, it is possible to preferentially display the change in the value of the explanatory variable that has a high degree of causing the error.
- the effect of this embodiment will be specifically described.
- the analyst can grasp whether the explanatory variable greatly affects the residual by looking at the order in which the explanatory variable is displayed. Thereby, the analyst can obtain hints for explanatory variables that must be newly added to the estimation, for example.
- the display unit 4 displays the explanatory variables in the order of “day of the week”, “time division”, “temperature”, and “humidity”.
- the analyst who has seen this display result further analyzes the error for each day of the week in detail.
- the error on Friday is larger than the error on other days of the week.
- the analyst can notice the existence of an explanatory variable that greatly affects the residual, the analyst can use this as a trigger to notice the existence of a new explanatory variable that has not been noticed until now.
- the analyst checks, for example, in detail the change in the temperature value.
- the explanatory variable “temperature” includes a lot of noise.
- the analyst can come up with performing a data cleansing process on the explanatory variable “temperature”.
- the explanatory variable “time division” has a great influence on the residual.
- the only possible values for the explanatory variable “time division” are “non-business hours” and “within business hours”.
- the analyst can imagine that it is better to subdivide the possible values of the explanatory variable “time segment”. For example, the analyst can imagine subdividing the possible values of the explanatory variable “time division” into “outside business hours”, “in the morning business hours”, “in the afternoon business hours”, and the like.
- the explanatory variable “age (10-year unit)” greatly affects the residual, the explanatory variable is more detailed “age (1 year unit)”. It can be conceived that it is better to treat as.
- explanatory variables In data mining, it is not uncommon for the types of explanatory variables to be analyzed to be hundreds or thousands. In such a case, it is not easy for the analyst to conduct a detailed examination on all of the explanatory variables. By prioritizing the explanatory variables in the order in which they greatly affect the residual as in the present embodiment, the analyst can select the explanatory variables to be watched more from among the large number of explanatory variables. This increases the efficiency of data analysis work.
- the display priority order determination means 13 may use another formula instead of the residual estimation formula.
- the display priority determination means 13 may derive an estimation formula for the absolute value of the error and determine the display priority of each explanatory variable using the estimation formula.
- the display priority determining means 13 derives an expression for discriminating and analyzing whether or not the absolute value of the error is a certain value or more, and using the expression, the display priority of each explanatory variable is determined. May be determined.
- the algorithm that creates the residual estimation formula and the various formulas exemplified above do not necessarily match the algorithm that creates the objective variable estimation formula.
- discriminant analysis of “whether an error of 10 or more occurs” may be performed using a decision tree.
- the display unit 4 may display a change in the estimated value and a change in the explanatory variable over time. Further, the value of each explanatory variable and the actual measurement value of the estimation target may be input in association with information other than time information, and the display unit 4 may change the estimated value or change of the explanatory variable in an order other than time. May be displayed.
- the explanatory variable display priority determination system 1 of the present invention may be implemented in an estimation device that performs estimation using an estimation formula obtained by learning.
- the explanatory variable display priority determination system 1 of this invention may be mounted in the learning apparatus which learns estimation formulas.
- the learning device may also have an estimation function based on the estimation formula for the purpose of checking the learned estimation formula.
- the explanatory variable display priority determination system 1 may be mounted on such a learning device.
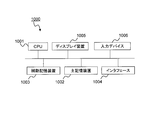
- FIG. 12 is a schematic block diagram showing a configuration example of a computer according to each embodiment of the present invention.
- the computer 1000 includes a CPU 1001, a main storage device 1002, an auxiliary storage device 1003, an interface 1004, a display device 1005, and an input device 1006.
- the explanatory variable display priority determination system 1 of each embodiment is implemented in a computer 1000.
- the operation of the explanatory variable display priority determination system 1 is stored in the auxiliary storage device 1003 in the form of a program (explanatory variable display priority determination program).
- the CPU 1001 reads out the program from the auxiliary storage device 1003, develops it in the main storage device 1002, and executes the above processing according to the program.
- the auxiliary storage device 1003 is an example of a tangible medium that is not temporary.
- Other examples of the non-temporary tangible medium include a magnetic disk, a magneto-optical disk, a CD-ROM, a DVD-ROM, and a semiconductor memory connected via the interface 1004.
- this program is distributed to the computer 1000 via a communication line, the computer 1000 that has received the distribution may develop the program in the main storage device 1002 and execute the above processing.
- the program may be for realizing a part of the above-described processing.
- the program may be a differential program that realizes the above-described processing in combination with another program already stored in the auxiliary storage device 1003.
- FIG. 13 is a block diagram showing an example of the minimum configuration of the present invention.
- the explanatory variable display priority determination system of the present invention includes a display priority determination means 73 and a display means 74.
- the display priority order determining means 73 determines the display priority order of each explanatory variable used in the estimation of the value by the estimation formula, the estimated value by the estimation formula and the actual measurement value. Is determined based on the residual, which is an estimated amount of error. More specifically, the display priority order determination unit 73 determines the display priority order of the explanatory variables based on the magnitude of the influence of the explanatory variables on the residual.
- Display means 74 (for example, display means 4 of the second embodiment) displays the explanatory variables according to the display priority order.
- the effect of the present invention can be obtained by such a configuration.
- the display priority order determining unit 73 and the display unit 74 may operate as follows.
- the display priority order determining means 73 (for example, the display priority order determining means 3 of the first embodiment) sets the display priority order of each explanatory variable used in the estimation of the value by the estimation formula for each explanatory variable in the estimation formula. Determine based on the coefficient.
- the display unit 74 (for example, the display unit 4 of the first embodiment) displays the change in the estimated value based on the estimation formula and the change in the value of the explanatory variable along a predetermined axis.
- Display priority determination for determining the display priority of each explanatory variable used in the estimation of the value by the estimation formula based on the residual that is the estimated amount of error between the estimated value by the estimation formula and the actual measurement value Means for displaying the explanatory variable according to the display priority, and the display priority determining means sets the display priority of the explanatory variable based on the magnitude of the influence of the explanatory variable on the residual.
- An explanatory variable display priority determination system characterized by determining.
- the display priority determining means derives a residual estimation formula for estimating a residual that is an estimated amount of error between the estimated value and the measured value, and each of the residual estimation formulas
- the said display priority determination means calculates the sum of the absolute value of the coefficient of each explanatory variable in the residual estimation formula corresponding to each value of a categorical variable for every categorical variable, Each explanatory variable and continuous variable that is a categorical variable based on the sum of the absolute values of the coefficients calculated for each and the absolute value of the coefficient of each explanatory variable in the residual estimation formula corresponding to each continuous variable.
- the explanatory variable display priority determination system according to attachment 2 wherein the display priority order of each explanatory variable is determined.
- the said display means further displays the change of the estimated value by the said estimation formula with the change of the measured value corresponding to the said estimated value,
- the said display means displays the change of the estimated value by the said estimation formula, the change of the said actual value, and the change of the value of the said explanatory variable along the predetermined axis,
- the explanatory variable of Additional remark 4 Display priority determination system.
- the display priority determining means sets the display priority higher as the explanatory variable having the larger absolute value of the coefficient, and the display means sets the value of the explanatory variable as the explanatory variable having the higher display priority.
- the said display priority order determination means calculates the sum of the absolute value of the coefficient of each explanatory variable in the estimation formula corresponding to each value of a categorical variable for every categorical variable, Each explanatory variable that is a categorical variable and each explanation that is a continuous variable based on the sum of the absolute values of the calculated coefficients and the absolute value of the coefficient of each explanatory variable in the estimation formula corresponding to each continuous variable.
- the explanatory variable display priority determination system according to appendix 6 or appendix 7, wherein the display priority order of variables is determined.
- the display priority order determining unit performs all estimations corresponding to each value of the categorical variable for each categorical variable. Calculate the sum of the absolute values of the coefficients of each explanatory variable in the equation, and for each continuous variable, calculate the sum of the absolute values of the coefficients of each explanatory variable in all the estimation equations corresponding to the continuous variable, Based on the sum of absolute values of coefficients calculated for each categorical variable and the sum of absolute values of coefficients calculated for each continuous variable, each explanatory variable that is a categorical variable and each explanatory variable that is a continuous variable 8.
- the explanatory variable display priority determination system according to appendix 6 or appendix 7, wherein the display priority order is determined.
- the display priority of each explanatory variable used in the estimation of the value by the estimation formula is determined based on the residual that is the estimated amount of error between the estimated value by the estimation formula and the actual measurement value, and the display priority
- the explanatory variable is displayed according to the ranking, and the display priority of the explanatory variable is determined based on the magnitude of the influence of the explanatory variable on the residual when the display priority is determined. Prioritization method.
- each explanatory variable used by the estimation of the value by an estimation formula is determined based on the coefficient of each explanatory variable in the said estimation formula, the change of the estimated value by the said estimation formula, and the said description
- An explanatory variable display priority determination method characterized by displaying changes in variable values along a predetermined axis.
- the display which determines the display priority of each explanatory variable used by estimation of the value by an estimation formula on the computer based on the residual which is an estimated amount of the error between the estimated value by the estimation formula and the actual measurement value
- a priority determination process and a display process for displaying the explanatory variable in accordance with the display priority order, and the display priority determination process, based on the magnitude of the influence of the explanatory variable on the residual,
- An explanatory variable display priority determination program for determining display priority.
- the present invention can be suitably applied to an apparatus that presents changes in values of various explanatory variables.
Landscapes
- Business, Economics & Management (AREA)
- Engineering & Computer Science (AREA)
- Strategic Management (AREA)
- Human Resources & Organizations (AREA)
- Entrepreneurship & Innovation (AREA)
- Economics (AREA)
- Development Economics (AREA)
- Game Theory and Decision Science (AREA)
- General Physics & Mathematics (AREA)
- Marketing (AREA)
- Theoretical Computer Science (AREA)
- Physics & Mathematics (AREA)
- General Business, Economics & Management (AREA)
- Finance (AREA)
- Accounting & Taxation (AREA)
- Educational Administration (AREA)
- Tourism & Hospitality (AREA)
- Quality & Reliability (AREA)
- Operations Research (AREA)
- Management, Administration, Business Operations System, And Electronic Commerce (AREA)
Abstract
Description
図1は、本発明の第1の実施形態の説明変数表示優先順位決定システムの構成例を示すブロック図である。第1の実施形態の説明変数表示優先順位決定システム1は、推定手段2と、表示優先順位決定手段3と、表示手段4とを備える。
図9は、本発明の第2の実施形態の説明変数表示優先順位決定システムの構成例を示すブロック図である。第2の実施形態の説明変数表示優先順位決定システム1は、推定手段12と、表示優先順位決定手段13と、表示手段4とを備える。表示手段4は、第1の実施形態における表示手段4と同様であり、説明を省略する。
2,12 推定手段
3,13 表示優先順位決定手段
4 表示手段
Claims (13)
- 推定式による値の推定で用いられる各説明変数の表示優先順位を、前記推定式による推定値と実測値との誤差の推定量である残差に基づいて決定する表示優先順位決定手段と、
前記表示優先順位に従って前記説明変数を表示する表示手段とを備え、
前記表示優先順位決定手段は、残差に対する説明変数の影響の大きさに基づいて、前記説明変数の表示優先順位を決定する
ことを特徴とする説明変数表示優先順位決定システム。 - 前記表示優先順位決定手段は、前記推定値と前記実測値との誤差の推定量である残差を推定するための残差推定式を導出し、当該残差推定式内の各説明変数の係数に基づいて、前記表示優先順位を決定する
請求項1に記載の説明変数表示優先順位決定システム。 - 前記表示優先順位決定手段は、カテゴリ型変数毎に、カテゴリ型変数の各値に対応する残差推定式内の各説明変数の係数の絶対値の和を算出し、カテゴリ型変数毎に算出した係数の絶対値の和と、各連続型変数に対応する残差推定式内の各説明変数の係数の絶対値とに基づいて、カテゴリ型変数である各説明変数および連続型変数である各説明変数の表示優先順位を決定する
請求項2に記載の説明変数表示優先順位決定システム。 - 前記表示手段は、さらに、前記推定式による推定値の変化を、前記推定値に対応する実測値の変化とともに表示する
請求項1から請求項3のうちのいずれか1項に記載の説明変数表示優先順位決定システム。 - 前記表示手段は、前記推定式による推定値の変化および前記実測値の変化と、前記説明変数の値の変化とを、所定の軸に沿って表示する
請求項4に記載の説明変数表示優先順位決定システム。 - 推定式による値の推定で用いられる各説明変数の表示優先順位を、前記推定式内の各説明変数の係数に基づいて決定する表示優先順位決定手段と、
前記推定式による推定値の変化と、前記説明変数の値の変化とを、所定の軸に沿って表示する表示手段とを備える
ことを特徴とする説明変数表示優先順位決定システム。 - 前記表示優先順位決定手段は、前記係数の絶対値が大きい説明変数ほど表示優先順位を高く設定し、
前記表示手段は、前記表示優先順位が高い説明変数ほど、当該説明変数の値の変化を、前記推定値の変化を表示する領域の近くに表示する
請求項6に記載の説明変数表示優先順位決定システム。 - 前記表示優先順位決定手段は、
カテゴリ型変数毎に、カテゴリ型変数の各値に対応する推定式内の各説明変数の係数の絶対値の和を算出し、カテゴリ型変数毎に算出した係数の絶対値の和と、各連続型変数に対応する推定式内の各説明変数の係数の絶対値とに基づいて、カテゴリ型変数である各説明変数および連続型変数である各説明変数の表示優先順位を決定する
請求項6または請求項7に記載の説明変数表示優先順位決定システム。 - 前記表示優先順位決定手段は、
推定値を算出するために選択される推定式が複数存在する場合に、カテゴリ型変数毎に、カテゴリ型変数の各値に対応する、全ての推定式内の各説明変数の係数の絶対値の和を算出し、連続型変数毎に、連続型変数に対応する、全ての推定式内の各説明変数の係数の絶対値の和を算出し、カテゴリ型変数毎に算出した係数の絶対値の和と、連続型変数毎に算出した係数の絶対値の和とに基づいて、カテゴリ型変数である各説明変数および連続型変数である各説明変数の表示優先順位を決定する
請求項6または請求項7に記載の説明変数表示優先順位決定システム。 - 推定式による値の推定で用いられる各説明変数の表示優先順位を、前記推定式による推定値と実測値との誤差の推定量である残差に基づいて決定し、
前記表示優先順位に従って前記説明変数を表示し、
表示優先順位を決定する際に、残差に対する説明変数の影響の大きさに基づいて、前記説明変数の表示優先順位を決定する
ことを特徴とする説明変数表示優先順位決定方法。 - 推定式による値の推定で用いられる各説明変数の表示優先順位を、前記推定式内の各説明変数の係数に基づいて決定し、
前記推定式による推定値の変化と、前記説明変数の値の変化とを、所定の軸に沿って表示する
ことを特徴とする説明変数表示優先順位決定方法。 - コンピュータに、
推定式による値の推定で用いられる各説明変数の表示優先順位を、前記推定式による推定値と実測値との誤差の推定量である残差に基づいて決定する表示優先順位決定処理、および、
前記表示優先順位に従って前記説明変数を表示する表示処理を実行させ、
前記表示優先順位決定処理で、残差に対する説明変数の影響の大きさに基づいて、前記説明変数の表示優先順位を決定させる
ための説明変数表示優先順位決定プログラム。 - コンピュータに、
推定式による値の推定で用いられる各説明変数の表示優先順位を、前記推定式内の各説明変数の係数に基づいて決定する表示優先順位決定処理、および、
前記推定式による推定値の変化と、前記説明変数の値の変化とを、所定の軸に沿って表示する表示処理
を実行させるための説明変数表示優先順位決定プログラム。
Priority Applications (3)
| Application Number | Priority Date | Filing Date | Title |
|---|---|---|---|
| US15/521,275 US20170308825A1 (en) | 2014-10-24 | 2015-08-26 | Priority order determination system, method, and program for explanatory variable display |
| JP2016555053A JP6558375B2 (ja) | 2014-10-24 | 2015-08-26 | 説明変数表示優先順位決定システム、方法およびプログラム |
| EP15852193.0A EP3211579A4 (en) | 2014-10-24 | 2015-08-26 | Priority order determination system, method and program for explanatory variable display |
Applications Claiming Priority (2)
| Application Number | Priority Date | Filing Date | Title |
|---|---|---|---|
| JP2014-216839 | 2014-10-24 | ||
| JP2014216839 | 2014-10-24 |
Publications (1)
| Publication Number | Publication Date |
|---|---|
| WO2016063446A1 true WO2016063446A1 (ja) | 2016-04-28 |
Family
ID=55760510
Family Applications (1)
| Application Number | Title | Priority Date | Filing Date |
|---|---|---|---|
| PCT/JP2015/004284 Ceased WO2016063446A1 (ja) | 2014-10-24 | 2015-08-26 | 説明変数表示優先順位決定システム、方法およびプログラム |
Country Status (4)
| Country | Link |
|---|---|
| US (1) | US20170308825A1 (ja) |
| EP (1) | EP3211579A4 (ja) |
| JP (1) | JP6558375B2 (ja) |
| WO (1) | WO2016063446A1 (ja) |
Cited By (6)
| Publication number | Priority date | Publication date | Assignee | Title |
|---|---|---|---|---|
| WO2019039077A1 (ja) * | 2017-08-23 | 2019-02-28 | 日本電気株式会社 | 現金需要予測システム、現金需要予測方法および現金需要予測プログラム |
| WO2019163160A1 (ja) * | 2018-02-22 | 2019-08-29 | 株式会社日立製作所 | 分析装置、分析方法、および分析プログラム |
| JP2020077033A (ja) * | 2018-11-05 | 2020-05-21 | 日本電気株式会社 | 解析装置および解析方法 |
| JP2021141637A (ja) * | 2020-03-02 | 2021-09-16 | 富士電機株式会社 | 情報処理装置、情報処理方法及びプログラム |
| JPWO2022064679A1 (ja) * | 2020-09-28 | 2022-03-31 | ||
| WO2024154398A1 (ja) * | 2023-01-19 | 2024-07-25 | 株式会社Nttドコモ | 推定装置 |
Families Citing this family (1)
| Publication number | Priority date | Publication date | Assignee | Title |
|---|---|---|---|---|
| WO2021220999A1 (ja) * | 2020-04-30 | 2021-11-04 | パナソニックIpマネジメント株式会社 | 特性表示装置、特性表示方法およびプログラム |
Citations (3)
| Publication number | Priority date | Publication date | Assignee | Title |
|---|---|---|---|---|
| JP2004062521A (ja) * | 2002-07-29 | 2004-02-26 | Nippon Telegr & Teleph Corp <Ntt> | 日毎雷害故障数予測装置及び日毎雷害故障数予測方法 |
| JP2005149162A (ja) * | 2003-11-17 | 2005-06-09 | Sansaara Corporation:Kk | 情報表示解析システムおよび方法 |
| JP2012128800A (ja) * | 2010-12-17 | 2012-07-05 | Nippon Steel Engineering Co Ltd | プロセスの状態予測方法及びそれを用いたプロセス制御装置 |
Family Cites Families (3)
| Publication number | Priority date | Publication date | Assignee | Title |
|---|---|---|---|---|
| FR2893808A1 (fr) * | 2005-11-22 | 2007-05-25 | Thomson Licensing Sas | Procede et dispositif de codage d'une image video |
| US8560346B2 (en) * | 2009-01-05 | 2013-10-15 | Siemens Medical Solutions Usa, Inc. | System and method for ranking quality improvement factors in patient care |
| US20150112891A1 (en) * | 2012-06-13 | 2015-04-23 | Sony Corporation | Information processor, information processing method, and program |
-
2015
- 2015-08-26 WO PCT/JP2015/004284 patent/WO2016063446A1/ja not_active Ceased
- 2015-08-26 EP EP15852193.0A patent/EP3211579A4/en not_active Withdrawn
- 2015-08-26 US US15/521,275 patent/US20170308825A1/en not_active Abandoned
- 2015-08-26 JP JP2016555053A patent/JP6558375B2/ja active Active
Patent Citations (3)
| Publication number | Priority date | Publication date | Assignee | Title |
|---|---|---|---|---|
| JP2004062521A (ja) * | 2002-07-29 | 2004-02-26 | Nippon Telegr & Teleph Corp <Ntt> | 日毎雷害故障数予測装置及び日毎雷害故障数予測方法 |
| JP2005149162A (ja) * | 2003-11-17 | 2005-06-09 | Sansaara Corporation:Kk | 情報表示解析システムおよび方法 |
| JP2012128800A (ja) * | 2010-12-17 | 2012-07-05 | Nippon Steel Engineering Co Ltd | プロセスの状態予測方法及びそれを用いたプロセス制御装置 |
Non-Patent Citations (1)
| Title |
|---|
| See also references of EP3211579A4 * |
Cited By (14)
| Publication number | Priority date | Publication date | Assignee | Title |
|---|---|---|---|---|
| WO2019039077A1 (ja) * | 2017-08-23 | 2019-02-28 | 日本電気株式会社 | 現金需要予測システム、現金需要予測方法および現金需要予測プログラム |
| JPWO2019039077A1 (ja) * | 2017-08-23 | 2020-09-17 | 日本電気株式会社 | 現金需要予測システム、現金需要予測方法および現金需要予測プログラム |
| JP7184040B2 (ja) | 2017-08-23 | 2022-12-06 | 日本電気株式会社 | 現金需要予測システム、現金需要予測方法および現金需要予測プログラム |
| US11507881B2 (en) | 2018-02-22 | 2022-11-22 | Hitachi, Ltd. | Analysis apparatus, analysis method, and analysis program for calculating prediction error and extracting error factor |
| WO2019163160A1 (ja) * | 2018-02-22 | 2019-08-29 | 株式会社日立製作所 | 分析装置、分析方法、および分析プログラム |
| JP2019144970A (ja) * | 2018-02-22 | 2019-08-29 | 株式会社日立製作所 | 分析装置、分析方法、および分析プログラム |
| JP2020077033A (ja) * | 2018-11-05 | 2020-05-21 | 日本電気株式会社 | 解析装置および解析方法 |
| JP7225688B2 (ja) | 2018-11-05 | 2023-02-21 | 日本電気株式会社 | 解析装置、解析方法、および解析プログラム |
| JP2021141637A (ja) * | 2020-03-02 | 2021-09-16 | 富士電機株式会社 | 情報処理装置、情報処理方法及びプログラム |
| JP7413843B2 (ja) | 2020-03-02 | 2024-01-16 | 富士電機株式会社 | 情報処理装置、情報処理方法及びプログラム |
| WO2022064679A1 (ja) * | 2020-09-28 | 2022-03-31 | 日本電気株式会社 | 予測装置、予測方法、及び、記録媒体 |
| JPWO2022064679A1 (ja) * | 2020-09-28 | 2022-03-31 | ||
| JP7567922B2 (ja) | 2020-09-28 | 2024-10-16 | 日本電気株式会社 | 予測装置、予測方法、及び、プログラム |
| WO2024154398A1 (ja) * | 2023-01-19 | 2024-07-25 | 株式会社Nttドコモ | 推定装置 |
Also Published As
| Publication number | Publication date |
|---|---|
| US20170308825A1 (en) | 2017-10-26 |
| EP3211579A4 (en) | 2018-03-14 |
| EP3211579A1 (en) | 2017-08-30 |
| JPWO2016063446A1 (ja) | 2017-08-03 |
| JP6558375B2 (ja) | 2019-08-14 |
Similar Documents
| Publication | Publication Date | Title |
|---|---|---|
| JP6558375B2 (ja) | 説明変数表示優先順位決定システム、方法およびプログラム | |
| JP6708204B2 (ja) | 精度推定モデル生成システムおよび精度推定システム | |
| JP2015108904A (ja) | 表示方法、表示装置及び表示プログラム | |
| JP6529096B2 (ja) | シミュレートシステム、シミュレート方法およびシミュレート用プログラム | |
| EP3214585A1 (en) | Estimated result display system, estimated result display method and estimated result display program | |
| US20160155081A1 (en) | Process flow header | |
| JP5993273B2 (ja) | 意思決定支援システム及び方法 | |
| JP6399206B2 (ja) | 推定器管理システム | |
| EP3211569A1 (en) | Estimation results display system, estimation results display method, and estimation results display program | |
| WO2018154662A1 (ja) | 価格最適化システム、価格最適化方法および価格最適化プログラム | |
| US20180240046A1 (en) | Display system for displaying analytical information, method, and program | |
| WO2016132684A1 (ja) | 影響度可視化システム、方法およびプログラム | |
| JP7352378B2 (ja) | 製造制御装置、製造制御方法及びプログラム | |
| JP5160670B2 (ja) | マーケティング支援システム | |
| JP6414321B2 (ja) | 人数予測システム、人数予測方法および人数予測プログラム | |
| US10504254B2 (en) | Predictor visualization system, predictor visualization method, and predictor visualization program | |
| US20230044694A1 (en) | Action evaluation system, action evaluation method, and recording medium | |
| WO2023013194A1 (ja) | レイアウト分析装置及びレイアウト分析方法 | |
| JP5574206B1 (ja) | チャート表示装置、チャート表示方法、プログラムおよびチャート表示システム | |
| JP7565500B2 (ja) | 品質推定装置および方法 | |
| JP6216600B2 (ja) | 紹介者候補抽出システム | |
| JP2012123532A (ja) | 特許情報解析システム | |
| JP2016021144A (ja) | グラフ表示方法、グラフ表示装置およびグラフ表示プログラム | |
| Siripanthana et al. | Sufficient reduction methods for multivariate time-dependent health surveillance data | |
| JP2021068173A (ja) | 予測装置および予測方法 |
Legal Events
| Date | Code | Title | Description |
|---|---|---|---|
| 121 | Ep: the epo has been informed by wipo that ep was designated in this application |
Ref document number: 15852193 Country of ref document: EP Kind code of ref document: A1 |
|
| ENP | Entry into the national phase |
Ref document number: 2016555053 Country of ref document: JP Kind code of ref document: A |
|
| REEP | Request for entry into the european phase |
Ref document number: 2015852193 Country of ref document: EP |
|
| WWE | Wipo information: entry into national phase |
Ref document number: 15521275 Country of ref document: US |
|
| NENP | Non-entry into the national phase |
Ref country code: DE |