WO2016120959A1 - ノイズレベル推定方法、測定データ処理装置、及び測定データ処理用プログラム - Google Patents
ノイズレベル推定方法、測定データ処理装置、及び測定データ処理用プログラム Download PDFInfo
- Publication number
- WO2016120959A1 WO2016120959A1 PCT/JP2015/051973 JP2015051973W WO2016120959A1 WO 2016120959 A1 WO2016120959 A1 WO 2016120959A1 JP 2015051973 W JP2015051973 W JP 2015051973W WO 2016120959 A1 WO2016120959 A1 WO 2016120959A1
- Authority
- WO
- WIPO (PCT)
- Prior art keywords
- segment
- noise
- waveform data
- noise level
- component
- Prior art date
- Legal status (The legal status is an assumption and is not a legal conclusion. Google has not performed a legal analysis and makes no representation as to the accuracy of the status listed.)
- Ceased
Links
Images

Classifications
-
- G—PHYSICS
- G01—MEASURING; TESTING
- G01N—INVESTIGATING OR ANALYSING MATERIALS BY DETERMINING THEIR CHEMICAL OR PHYSICAL PROPERTIES
- G01N30/00—Investigating or analysing materials by separation into components using adsorption, absorption or similar phenomena or using ion-exchange, e.g. chromatography or field flow fractionation
- G01N30/02—Column chromatography
- G01N30/86—Signal analysis
- G01N30/8603—Signal analysis with integration or differentiation
- G01N30/861—Differentiation
-
- G—PHYSICS
- G01—MEASURING; TESTING
- G01N—INVESTIGATING OR ANALYSING MATERIALS BY DETERMINING THEIR CHEMICAL OR PHYSICAL PROPERTIES
- G01N30/00—Investigating or analysing materials by separation into components using adsorption, absorption or similar phenomena or using ion-exchange, e.g. chromatography or field flow fractionation
- G01N30/02—Column chromatography
- G01N30/86—Signal analysis
- G01N30/8624—Detection of slopes or peaks; baseline correction
- G01N30/8641—Baseline
-
- G—PHYSICS
- G01—MEASURING; TESTING
- G01N—INVESTIGATING OR ANALYSING MATERIALS BY DETERMINING THEIR CHEMICAL OR PHYSICAL PROPERTIES
- G01N30/00—Investigating or analysing materials by separation into components using adsorption, absorption or similar phenomena or using ion-exchange, e.g. chromatography or field flow fractionation
- G01N30/02—Column chromatography
- G01N30/86—Signal analysis
- G01N30/8675—Evaluation, i.e. decoding of the signal into analytical information
-
- G—PHYSICS
- G01—MEASURING; TESTING
- G01N—INVESTIGATING OR ANALYSING MATERIALS BY DETERMINING THEIR CHEMICAL OR PHYSICAL PROPERTIES
- G01N30/00—Investigating or analysing materials by separation into components using adsorption, absorption or similar phenomena or using ion-exchange, e.g. chromatography or field flow fractionation
- G01N30/02—Column chromatography
- G01N30/86—Signal analysis
- G01N30/8675—Evaluation, i.e. decoding of the signal into analytical information
- G01N30/8686—Fingerprinting, e.g. without prior knowledge of the sample components
Definitions
- the present invention relates to a method for estimating the magnitude (noise level) of noise components in measurement data composed of peak components, baseline components and noise components such as chromatograms and spectra, and processing of such measurement data.
- the present invention relates to a device and a program for processing measurement data.
- liquid chromatograph as one of the devices for analyzing components contained in a liquid sample.
- a liquid sample is introduced into a column on the flow of a mobile phase, each component in the sample is temporally separated in the column, and then detected with a detector such as an absorptiometer to obtain a chromatogram. create.
- a detector such as an absorptiometer to obtain a chromatogram. create.
- each component is identified from the peak position on a chromatogram, and the density
- a chromatogram obtained by measurement can be divided into three components: a peak component, a baseline component, and a noise component.
- the size of the peak component fluctuates with the elution of various components contained in the liquid sample, and the size of the baseline component changes in the pressure of the pump that sends the mobile phase and the ambient temperature changes. Fluctuates (baseline drift).
- the fluctuation of the baseline component is gentle compared to the peak component and the noise component.
- the magnitude of the noise component noise level
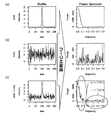
- FIG. 1 shows an example of a peak component (a), a noise component (b), and a waveform (Profile) of their sum (c), and an example of a power spectrum (Power Spectrum) obtained by Fourier transforming these waveforms.
- a peak component
- b noise component
- c waveform
- Power Spectrum power spectrum
- a high-pass filter that reduces low-frequency components below a predetermined frequency is used.
- the high pass filter for example, a second-order differential filter is used.
- a second-order differential filter is used as the high-pass filter, a signal having a shape similar to a waveform obtained by second-order differentiation of the chromatogram can be obtained.
- the baseline component is usually localized in the low frequency band, most of the baseline component is removed by the high-pass filter in the same manner as the peak component.
- a chromatogram has been described as an example, but there are other similar problems in various measurement data including a peak component, a baseline component, and a noise component, as in a spectrum obtained by spectroscopic measurement.
- the problem to be solved by the present invention is that the noise component included in the measurement data including the peak component, the baseline component, and the noise component can be reliably separated, and the noise level can be estimated with high accuracy.
- a noise level estimation method, a measurement data processing apparatus, and a measurement data processing program are provided.
- the first aspect of the present invention estimates a noise level representing the magnitude of a noise component from measurement data including three components, a peak component, a baseline component, and a noise component.
- a method a) A high-frequency noise component is extracted from the assumed noise data consisting only of the assumed noise with respect to the measurement data by using a high-pass filter that attenuates a low-frequency component having a frequency lower than a predetermined frequency, and is first waveform data of the high-frequency noise component.
- a region in which positive values are continuous and a region in which negative values are continuous are each set as one segment, or a region between adjacent maximum values and minimum values is set as one segment in the first waveform data.
- the threshold of the plurality of segment widths is, for example, an upper limit value of the distribution of the widths of the plurality of segments obtained by dividing the first waveform data, or a predetermined ratio (for example, 90%) of the plurality of segments. Or the upper limit value of the distribution to which the segment belongs.
- the estimation of the noise level based on the height or area of a plurality of segments included in the first segment group may be performed by calculating an average value or median value of the heights or areas of the plurality of segments, for example. it can.
- the second waveform obtained by extracting a high-frequency measurement component using a high-pass filter is divided into a plurality of segments. Then, a segment having a width wider than the threshold of the segment width obtained from the assumed noise data is excluded as a component derived from a component other than the noise component, that is, a component derived from a peak component or a baseline component. Therefore, even if a part of the peak component or baseline component passes through the high-pass filter, the segment corresponding to the component is excluded at this stage. Therefore, it is possible to reliably separate the noise component from the measurement data and estimate the noise level with high accuracy.
- the noise level estimation method further, e) comparing the noise level obtained by the estimation and the height or area of each of the plurality of segments included in the first segment group to extract an outlier of the height or area; f) creating a second segment group by excluding the segment having the outlier from the plurality of segments of the first segment group; g) It is desirable to determine the noise level based on the height or area of a plurality of segments included in the second segment group.
- segment height or area outliers by excluding segment height or area outliers and estimating the noise level, segments derived from components other than noise that were not excluded by width comparison alone are excluded, and more accurate.
- the noise level can be estimated. Further, it is possible to further improve the noise level estimation accuracy by repeating the exclusion of segments having outliers and the estimation of noise level until the noise level outliers disappear or until a predetermined number of times is reached. .
- h) determining a segment position representing each of the plurality of segments of the second waveform data; i) For each of the plurality of segments of the second waveform data, a segment having a segment position within a predetermined range from the segment position of the segment is extracted as a target segment. j) The noise level at the segment position of the segment can be obtained based on the height or area of the segment and the target segment.
- the noise level at the segment position of each segment is obtained.
- the noise level may change with time.
- the noise level at the segment position of each segment is estimated for each of the plurality of segments, the noise level can be estimated with high accuracy even when the noise level changes with time.
- the second aspect of the present invention which has been made to solve the above problem, is a measurement data process used for estimating a noise level from measurement data including three components of a peak component, a baseline component, and a noise component.
- a device a) a high-pass filter that attenuates low frequency components below a predetermined frequency; b) A region in which high-frequency noise components are extracted using the high-pass filter for the assumed noise data consisting only of the assumed noise for the measurement data, and positive values continue in the first waveform data that is the waveform data of the high-frequency noise components
- the first waveform data is divided into a plurality of segments, each having a continuous negative value as one segment, or a region between adjacent maximum and minimum values in the first waveform data as one segment.
- a storage unit in which a threshold value of the segment width obtained in advance based on the distribution of the widths of the plurality of segments obtained is stored; c) a second waveform data acquisition unit that extracts a high-frequency measurement component from the measurement data using the high-pass filter and acquires second waveform data that is waveform data of the high-frequency measurement component; d) In the second waveform data, a region in which positive values are continuous and a region in which negative values are continuous are each regarded as one segment, or a region between adjacent maximum and minimum values is 1 in the second waveform data.
- a segment dividing unit for dividing the second waveform data into a plurality of segments as one segment e) a first segment group creating unit that creates a first segment group by excluding a segment having a width exceeding the threshold from a plurality of segments obtained by dividing the second waveform data; f) A noise level calculation unit that obtains a noise level based on the height or area of a plurality of segments included in the first segment group.
- the third aspect of the present invention which has been made to solve the above problem, is a measurement data process used for estimating a noise level from measurement data including three components of a peak component, a baseline component, and a noise component.
- the noise component included in the measurement data including the peak component, the baseline component, and the noise component is reliably detected.
- the noise level can be estimated with high accuracy.
- FIG. 1 is a configuration diagram of a measurement data processing apparatus according to Embodiment 1.
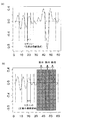
- FIG. 5 is a flowchart of the noise level estimation method according to the first embodiment. Distribution of segment width after second-order difference of regular white noise. Measurement data (a) and first waveform data (b) in Example 1. The figure explaining segment division (a) and segment exclusion (b) in the first embodiment.
- FIG. 6 is a configuration diagram of a measurement data processing apparatus according to a second embodiment.
- 10 is a flowchart of a noise level estimation method according to the second embodiment.
- Embodiments of a noise level estimation method, a measurement data processing apparatus, and a measurement data processing program according to the present invention will be described below with reference to the drawings.
- a noise level that is the size of a noise component included in a chromatogram acquired using a liquid chromatograph is estimated.
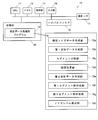
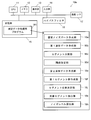
- FIG. 2 shows the configuration of the measurement data processing apparatus 10 according to the first embodiment.
- the substance of the measurement data processing apparatus 10 is a general-purpose personal computer, and is from a central processing unit (CPU) 11, a memory 12, a display unit (monitor) 13, an input unit 14, a high-pass filter 15, a large-capacity storage device such as a hard disk. And a storage interface 16, a communication interface (communication I / F) 17, and the like.
- the measurement data processing apparatus 10 is connected to a liquid chromatograph (not shown) through the communication I / F 17.
- the storage unit 16 stores a measurement data processing program 18.
- the CPU 11 causes an expected noise data generation unit to be described later.
- 18a, first waveform data creation unit 18b, segment division unit 18c, threshold setting unit 18d, second waveform data creation unit 18e, first segment group creation unit 18f, second segment group creation unit 18g, and noise level calculation unit 18h Function as.
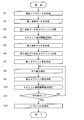
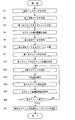
- the assumed noise data creating unit 18a creates assumed noise data consisting only of assumed noise for the measurement data (step S1).
- the assumed noise in this embodiment is regular white noise. Normal white noise is noise having characteristics of both white noise and Gaussian noise (normal distribution noise) having the same intensity at all frequencies.
- the first waveform data creation unit 18b creates first waveform data that is waveform data of a high-frequency noise component obtained by attenuating a low-frequency component from the assumed noise data using the high-pass filter 15 (step S2).
- the high pass filter 15 of the present embodiment is a second-order difference filter.
- assumed noise data in addition to data created from regular white noise, data created from colored noise such as pink noise and brown noise, measured noise data, and the like can also be used.
- the segment dividing unit 18c sets the first waveform data as a segment, each of which includes a region where positive values continue and a region where negative values continue in the first waveform data. Divide into a plurality of segments (step S3).
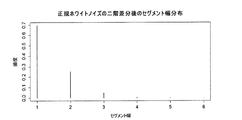
- the threshold setting unit 18d creates a distribution of the widths of the plurality of segments (FIG. 4), and sets a threshold of the segment width based on the distribution (step S4).
- “6” (arbitrary unit in the time axis direction), which is the maximum value of the segment width distribution, is set as a threshold value and the value is stored in the storage unit 16.
- the threshold value set in steps S1 to S4 can be used for a plurality of chromatogram data. Therefore, if a threshold value is set in advance and stored in the storage unit 16, the noise component can be estimated from the plurality of chromatogram data by performing only step S6 and subsequent steps described below.
- the second waveform data creation unit 18e reads out the chromatogram measurement data stored in advance in the storage unit 16 (FIG. 5 (a)), and uses the high-pass filter 15 as the waveform data of the high-frequency measurement component.
- Two waveform data are created (step S5, FIG. 5 (b)).
- the segment dividing unit 18c sets the second waveform data as a segment in which each of the second waveform data includes a region where positive values are continuous and a region where negative values are continuous. Divided into a plurality of segments (step S6, FIG. 6A).
- Step S7 is a step of excluding the peak component and the baseline component based on the fact that the width of the segment corresponding to the peak component and the baseline component that has passed through the high-pass filter is larger than the width of the segment caused by noise.
- the noise level calculation unit 18h calculates the area of each of the plurality of segments included in the first segment group, and sets the average value as the segment area reference value. Then, the second segment group creation unit 18g compares the segment area reference value with the area of each segment of the first segment group, and a certain ratio (for example, 5%) of the total number of segments in descending order of the area reference value.
- the segments corresponding to the outliers are excluded (step S8), and a second segment group is created (step S9).
- Outlier extraction can be performed, for example, by considering a value larger than the average value of the segment areas of each segment + N ⁇ (N is a positive integer and ⁇ is an unbiased standard deviation) as an outlier.
- N may be a value suitable for each measurement data in consideration of the distribution of segment area values.
- the segment area value may be the median of the segment area distribution of each segment.
- outliers can be extracted by, for example, considering a value larger than the median value of each segment area + M ⁇ MAD (Median Absolute Deviation) (M is a positive integer) as an outlier.
- M Median Absolute Deviation
- the extraction of outliers can be performed by various methods such as extracting a value whose difference from the area reference value is larger than a preset value.
- Steps S7 to S9 are steps for eliminating the influence of a noise component having a specific magnitude generated due to a sudden factor during measurement.
- the area value of an extremely small segment may be treated as an outlier.
- the average value of the segment areas ⁇ N ⁇ , A value outside the range of the median area ⁇ M ⁇ MAD may be set as an outlier.
- the peak-derived segment and the baseline-derived segment that are not excluded by the processing using the width threshold are removed by these steps.
- the noise level calculation unit obtains the area of each segment included in the second segment group again, and sets the average value as the segment area reference value (step S10). Then, based on the segment area reference value, it is checked whether or not there is an outlier in the area value of each segment. If there is no outlier (YES in step S11), the segment area reference value set this time The noise level is calculated from On the other hand, if there is an outlier (NO in step S11), the second segment group creation unit 18g again extracts outliers and excludes the segment (step S8), creates the second segment group (step S9), and The setting of the segment area reference value (step S10) is repeated until there is no outlier, and the noise level is calculated.
- steps S8 to S11 are steps for calculating the noise level with high accuracy, and are not essential steps in the present invention. That is, the noise level may be calculated as it is from the area of the segments in the first segment group.
- the noise level estimation method, the measurement data processing apparatus, and the measurement data processing program according to the first embodiment are used, even if a part of the peak component or the baseline component passes through the high pass filter, Since the corresponding segment is excluded, the noise component can be reliably separated from the measurement data and the noise level can be estimated with high accuracy. Further, in Example 1, by estimating the noise level by excluding the outlier of the area of the segment, the segment derived from the component other than the noise that was not excluded only by the width comparison is excluded, and more accurately. The noise level can be estimated. In the above example, the segment (area) reference value and the noise level are obtained based on the segment area value. However, the segment (height) reference value and the noise level can be obtained from the segment height.
- FIG. 7 shows the configuration of the measurement data processing apparatus 10a according to the second embodiment.
- the CPU 11 when the measurement data processing program 181 stored in the storage unit 16 is started, the CPU 11 causes an assumed noise data creation unit 18a, a first waveform data creation unit 18b, a segment division unit 18c, a threshold value, which will be described later. It functions as a setting unit 18d, a second waveform data creation unit 18e, a first segment group creation unit 18f, a segment position determination unit 18j, a target segment extraction unit 18k, and a noise level calculation unit 18h.
- step S1 to S4 The setting of the segment width threshold using the assumed noise data (steps S1 to S4) and the creation of the first segment group (steps S5 to S7) which is the waveform data of the high frequency measurement component are the same as in the first embodiment.
- step S5 to S7 The subsequent steps S21 to S27 are characteristic steps of the second embodiment.
- the segment position determining unit 18j determines the center position of the segment as the segment position for each of the plurality of segments of the first segment group (step S21).
- the target segment extraction unit 18k extracts, as one target segment, a segment having a segment position within a preset range from the segment position of the target segment for one of the segments (this is referred to as a target segment).
- the noise level calculation unit 18h calculates the noise level at the segment position of the segment of interest based on the average value (or median value, etc.) of the area (or height) of the segment of interest and the target segment (step 25).
- steps S22 to S25 are performed for all segments of the first segment group.
- the noise level at the segment position of the segment is calculated for all segments (YES in step S26)
- the segment excluded at the time of creating the first segment group that is, the segment derived from the peak component or the baseline component) at the segment position.
- the noise level is complemented (step S27).
- the noise level complementation may be performed using an appropriate method in accordance with the form of noise level change, such as linear interpolation or spline interpolation.
- the noise level estimation method, the measurement data processing apparatus, and the measurement data processing program according to the second embodiment are used, the peak component and the baseline component are surely excluded, and each position of the chromatogram The noise level at can be calculated. Therefore, when the noise level fluctuates due to the measurement system, for example, in the chromatogram acquired by gradient analysis, the baseline component tends to fluctuate, and the noise level fluctuates accordingly. And an apparatus can be used suitably.
- the first embodiment and the second embodiment are both examples, and can be appropriately changed in accordance with the gist of the present invention.
- each characteristic configuration and step is divided into two embodiments in order to explain the configuration.
- both the configurations and steps of the first and second embodiments may be provided.
- the noise level in each position of the chromatogram can be determined and the accuracy thereof can be increased.
- various kinds, such as the spectrum acquired by the spectroscopic measurement are also shown. Can be used to determine the noise level of the measured data.
- a region where positive values are continuous and a region where negative values are continuous in the waveform data obtained by extracting high-frequency components using a second-order differential filter is defined as one segment, but other high-pass filters are used.
- high frequency components may be extracted.
- an area where positive values continue (or an area where negative values continue) in high-frequency component waveform data extracted using an n-th order difference filter uses an n + 1-order difference filter. In the waveform data of the high-frequency component extracted in this way, the region is sandwiched between adjacent maximum and minimum values.
- the waveform data is divided into a region between adjacent maximum and minimum values as one segment. Can also process the measurement data in the same manner as described above.
Landscapes
- General Physics & Mathematics (AREA)
- Physics & Mathematics (AREA)
- Immunology (AREA)
- Pathology (AREA)
- Analytical Chemistry (AREA)
- Biochemistry (AREA)
- General Health & Medical Sciences (AREA)
- Life Sciences & Earth Sciences (AREA)
- Health & Medical Sciences (AREA)
- Chemical & Material Sciences (AREA)
- Algebra (AREA)
- Mathematical Analysis (AREA)
- Mathematical Optimization (AREA)
- Pure & Applied Mathematics (AREA)
- Engineering & Computer Science (AREA)
- Library & Information Science (AREA)
- Measurement Of Mechanical Vibrations Or Ultrasonic Waves (AREA)
- Indication And Recording Devices For Special Purposes And Tariff Metering Devices (AREA)
Abstract
Description
a) 前記測定データに対する想定ノイズのみからなる想定ノイズデータについて、所定の周波数未満の低周波成分を減衰させるハイパスフィルタを用いて高周波ノイズ成分を抽出し、該高周波ノイズ成分の波形データである第1波形データにおいて正の値が連続する領域及び負の値が連続する領域をそれぞれ1つのセグメントとして、あるいは該第1波形データにおいて隣接する極大値と極小値の間の領域を1つのセグメントとして、該第1波形データを複数のセグメントに分割して得た該複数のセグメントの幅の分布に基づいてセグメント幅の閾値を求め、
b) 前記ハイパスフィルタを用いて前記測定データから高周波測定成分を抽出し、該高周波測定成分の波形データである第2波形データにおいて正の値が連続する領域及び負の値が連続する領域をそれぞれ1つのセグメントとして、あるいは該第2波形データにおいて隣接する極大値と極小値の間の領域を1つのセグメントとして、該第2波形データを複数のセグメントに分割し、
c) 前記第2波形データを分割して得た複数のセグメントから、前記閾値を超える幅を有するセグメントを除外して残るセグメントを第1セグメント群として作成し、
d) 前記第1セグメント群に含まれる複数のセグメントの高さ又は面積に基づきノイズレベルを求める
ことを特徴とする。
上記複数のセグメント幅の閾値は、例えば上記第1波形データを分割して得た複数のセグメントの幅の分布の上限の値としたり、該複数のセグメントのうちの所定の割合(例えば90%)のセグメントが属する分布の上限値としたりすることができる。
上記第1セグメント群に含まれる複数のセグメントの高さ又は面積に基づくノイズレベルの推定は、例えば該複数のセグメントのそれぞれの高さ又は面積の平均値や中央値を計算することにより行うことができる。
e) 前記推定によって得られたノイズレベルと、前記第1セグメント群に含まれる複数のセグメントのそれぞれの高さ又は面積をそれぞれ比較して該高さ又は面積の外れ値を抽出し、
f) 前記外れ値を有するセグメントを前記第1セグメント群の複数のセグメントから除外して第2セグメント群を作成し、
g) 前記第2セグメント群に含まれる複数のセグメントの高さ又は面積に基づいてノイズレベルを求める
ことが望ましい。
h) 前記第2波形データの複数のセグメントのそれぞれを代表するセグメント位置を決定し、
i) 前記第2波形データの複数のセグメントのそれぞれについて、当該セグメントのセグメント位置から予め決められた範囲内にセグメント位置が存在するセグメントを対象セグメントとして抽出し、
j) 前記当該セグメントと前記対象セグメントの高さ又は面積に基づき、前記当該セグメントのセグメント位置におけるノイズレベルを求める
ように構成することができる。
例えば、測定条件を時間的に変化させるグラジエント分析などでは、ノイズレベルが時間的に変化することがある。上記のように複数のセグメントのそれぞれについて、当該セグメントのセグメント位置におけるノイズレベルを推定すると、ノイズレベルが時間的に変化する場合でも該ノイズレベルを高い精度で推定することができる。
また、各セグメントのセグメント位置におけるノイズレベルを求める場合にも、上述したように外れ値を有するセグメントを除外してノイズレベルの推定精度を高めることができる。さらに、外れ値を有するセグメントの除外とノイズレベルの推定を、ノイズレベルの外れ値がなくなるまで繰り返したり、予め決められた回数に達するまで繰り返したりして、ノイズレベルの推定精度を更に高めることもできる。
a) 所定の周波数未満の低周波成分を減衰させるハイパスフィルタと、
b) 前記測定データに対する想定ノイズのみからなる想定ノイズデータについて、前記ハイパスフィルタを用いて高周波ノイズ成分を抽出し、該高周波ノイズ成分の波形データである第1波形データにおいて正の値が連続する領域及び負の値が連続する領域をそれぞれ1つのセグメントとして、あるいは該第1波形データにおいて隣接する極大値と極小値の間の領域を1つのセグメントとして、該第1波形データを複数のセグメントに分割して得た該複数のセグメントの幅の分布に基づいて予め求められたセグメント幅の閾値が保存された記憶部と、
c) 前記ハイパスフィルタを用いて前記測定データから高周波測定成分を抽出し、該高周波測定成分の波形データである第2波形データを取得する第2波形データ取得部と、
d) 前記第2波形データにおいて正の値が連続する領域及び負の値が連続する領域をそれぞれ1つのセグメントとして、あるいは該第2波形データにおいて隣接する極大値と極小値の間の領域を1つのセグメントとして、該第2波形データを複数のセグメントに分割するセグメント分割部と、
e) 前記第2波形データを分割して得た複数のセグメントから、前記閾値を超える幅を有するセグメントを除外して第1セグメント群を作成する第1セグメント群作成部と、
f) 前記第1セグメント群に含まれる複数のセグメントの高さ又は面積に基づきノイズレベルを求めるノイズレベル算出部と
を備えることを特徴とする。
また、これらのステップにより、幅の閾値を用いた処理では除外されなかったピーク由来のセグメントやベースライン由来のセグメントが除去される。
上記実施例では、それぞれ特徴的な構成及びステップを説明するために2つの実施例に分割したが、実施例1及び2の両方の構成及びステップを備えるように構成してもよい。これにより、クロマトグラムの各位置におけるノイズレベルを決定し、かつその精度を高めることができる。
また、上記実施例では、液体クロマトグラフにより取得したクロマトグラムを処理する例を説明したが、液体クロマトグラフやガスクロマトグラフを用いて取得したクロマトグラム以外にも、分光測定により取得したスペクトルなどの種々の測定データのノイズレベルを決定するために用いることができる。
11…CPU
12…メモリ
13…表示部
14…入力部
15…ハイパスフィルタ
16…記憶部
18、181…測定データ処理用プログラム
18a…想定ノイズデータ作成部
18b…第1波形データ作成部
18c…セグメント分割部
18d…閾値設定部
18e…第2波形データ作成部
18f…第1セグメント群作成部
18g…第2セグメント群作成部
18h…ノイズレベル算出部
18j…セグメント位置決定部
18k…対象セグメント抽出部
17…通信I/F
Claims (7)
- ピーク成分、ベースライン成分、及びノイズ成分の3成分が含まれる測定データからノイズ成分の大きさを表すノイズレベルを推定する方法であって、
a) 前記測定データに対する想定ノイズのみからなる想定ノイズデータについて、所定の周波数未満の低周波成分を低減させるハイパスフィルタを用いて高周波ノイズ成分を抽出し、該高周波ノイズ成分の波形データである第1波形データにおいて正の値が連続する領域及び負の値が連続する領域をそれぞれ1つのセグメントとして、あるいは該第1波形データにおいて隣接する極大値と極小値の間の領域を1つのセグメントとして、該第1波形データを複数のセグメントに分割して得た該複数のセグメントの幅の分布に基づいてセグメント幅の閾値を求め、
b) 前記ハイパスフィルタを用いて前記測定データから高周波測定成分を抽出し、該高周波測定成分の波形データである第2波形データにおいて正の値が連続する領域及び負の値が連続する領域をそれぞれ1つのセグメントとして、あるいは該第2波形データにおいて隣接する極大値と極小値の間の領域を1つのセグメントとして、該第2波形データを複数のセグメントに分割し、
c) 前記第2波形データを分割して得た複数のセグメントから、前記閾値を超える幅を有するセグメントを除外して第1セグメント群を作成し、
d) 前記第1セグメント群に含まれる複数のセグメントの高さ又は面積に基づきノイズレベルを求める
ことを特徴とするノイズレベル推定方法。 - e) 前記ノイズレベルと、前記第1セグメント群に含まれる複数のセグメントのそれぞれの高さ又は面積をそれぞれ比較して該高さ又は面積の外れ値を抽出し、
f) 前記外れ値を有するセグメントを前記第1セグメント群の複数のセグメントから除外して第2セグメント群を作成し、
g) 前記第2セグメント群に含まれる複数のセグメントの高さ又は面積に基づいてノイズレベルを求めることを特徴とする請求項1に記載のノイズレベル推定方法。 - h) 前記第1セグメント群の複数のセグメントのそれぞれを代表するセグメント位置を決定し、
i) 前記第1セグメント群の複数のセグメントのそれぞれについて、当該セグメントのセグメント位置から予め決められた範囲内にセグメント位置が存在するセグメントを対象セグメントとして抽出し、
j) 前記当該セグメントと前記対象セグメントの高さ又は面積に基づき、前記当該セグメントのセグメント位置におけるノイズレベルを求める
ことを特徴とする請求項1に記載のノイズレベル推定方法。 - k) 前記当該セグメントと前記対象のセグメントの高さ又は面積を比較して該高さ又は面積の外れ値を抽出し、
l) 前記外れ値を有するセグメントを前記当該セグメントあるいは前記対象のセグメントから除外して第2セグメント群を作成し、
m) 前記第2セグメント群に含まれるセグメントの高さ又は面積に基づいて、前記当該セグメントのセグメント位置におけるノイズレベルを求める
ことを特徴とする請求項3に記載のノイズレベル推定方法。 - 前記第2セグメント群に含まれる複数のセグメントのそれぞれの高さ又は面積の中から外れ値を抽出し、該外れ値に対応するセグメントを除外して新たに第2セグメント群を作成する工程を、外れ値がなくなるまで、あるいは予め決められた回数に達するまで繰り返した後にノイズレベルを求める
ことを特徴とする請求項2又は4に記載のノイズレベル推定方法。 - ピーク成分、ベースライン成分、及びノイズ成分の3成分が含まれる測定データからノイズレベルを推定するために用いられる測定データ処理装置であって、
a) 所定の周波数未満の低周波成分を低減させるハイパスフィルタと、
b) 前記測定データに対する想定ノイズのみからなる想定ノイズデータについて、前記ハイパスフィルタを用いて高周波ノイズ成分を抽出し、該高周波ノイズ成分の波形データである第1波形データにおいて正の値が連続する領域及び負の値が連続する領域をそれぞれ1つのセグメントとして、あるいは該第1波形データにおいて隣接する極大値と極小値の間の領域を1つのセグメントとして、該第1波形データを複数のセグメントに分割して得た該複数のセグメントの幅の分布に基づいて予め求められたセグメント幅の閾値が保存された記憶部と、
c) 前記ハイパスフィルタを用いて前記測定データから高周波測定成分を抽出し、該高周波測定成分の波形データである第2波形データを取得する第2波形データ取得部と、
d) 前記第2波形データにおいて正の値が連続する領域及び負の値が連続する領域をそれぞれ1つのセグメントとして、あるいは該第2波形データにおいて隣接する極大値と極小値の間の領域を1つのセグメントとして、該第2波形データを複数のセグメントに分割するセグメント分割部と、
e) 前記第2波形データを分割して得た複数のセグメントから、前記閾値を超える幅を有するセグメントを除外して第1セグメント群を作成する第1セグメント群作成部と、
f) 前記第1セグメント群に含まれる複数のセグメントの高さ又は面積に基づきノイズレベルを求めるノイズレベル算出部と
を備えることを特徴とする測定データ処理装置。 - ピーク成分、ベースライン成分、及びノイズ成分の3成分が含まれる測定データからノイズレベルを推定するために用いられるプログラムであって、セグメント幅の閾値が保存された記憶部とハイパスフィルタを備えたコンピュータを、請求項6に記載の第2波形データ取得部、セグメント分割部、第1セグメント群作成部、及びノイズレベル算出部として機能させることを特徴とする測定データ処理用プログラム。
Priority Applications (5)
| Application Number | Priority Date | Filing Date | Title |
|---|---|---|---|
| PCT/JP2015/051973 WO2016120959A1 (ja) | 2015-01-26 | 2015-01-26 | ノイズレベル推定方法、測定データ処理装置、及び測定データ処理用プログラム |
| US15/544,036 US10359404B2 (en) | 2015-01-26 | 2015-01-26 | Noise level estimation method, measurement data processing device and program for processing measurement data |
| EP15879857.9A EP3252465A4 (en) | 2015-01-26 | 2015-01-26 | Noise level estimation method, measurement data processing device, and program for measurement data processing |
| CN201580073796.6A CN107209157B (zh) | 2015-01-26 | 2015-01-26 | 噪声水平估计方法和测定数据处理装置 |
| JP2016571512A JP6458812B2 (ja) | 2015-01-26 | 2015-01-26 | ノイズレベル推定方法、測定データ処理装置、及び測定データ処理用プログラム |
Applications Claiming Priority (1)
| Application Number | Priority Date | Filing Date | Title |
|---|---|---|---|
| PCT/JP2015/051973 WO2016120959A1 (ja) | 2015-01-26 | 2015-01-26 | ノイズレベル推定方法、測定データ処理装置、及び測定データ処理用プログラム |
Publications (1)
| Publication Number | Publication Date |
|---|---|
| WO2016120959A1 true WO2016120959A1 (ja) | 2016-08-04 |
Family
ID=56542619
Family Applications (1)
| Application Number | Title | Priority Date | Filing Date |
|---|---|---|---|
| PCT/JP2015/051973 Ceased WO2016120959A1 (ja) | 2015-01-26 | 2015-01-26 | ノイズレベル推定方法、測定データ処理装置、及び測定データ処理用プログラム |
Country Status (5)
| Country | Link |
|---|---|
| US (1) | US10359404B2 (ja) |
| EP (1) | EP3252465A4 (ja) |
| JP (1) | JP6458812B2 (ja) |
| CN (1) | CN107209157B (ja) |
| WO (1) | WO2016120959A1 (ja) |
Cited By (1)
| Publication number | Priority date | Publication date | Assignee | Title |
|---|---|---|---|---|
| JP2020193847A (ja) * | 2019-05-27 | 2020-12-03 | 株式会社東芝 | 波形セグメンテーション装置及び波形セグメンテーション方法 |
Families Citing this family (5)
| Publication number | Priority date | Publication date | Assignee | Title |
|---|---|---|---|---|
| WO2016132422A1 (ja) * | 2015-02-16 | 2016-08-25 | 株式会社島津製作所 | ノイズレベル推定方法、測定データ処理装置、及び測定データ処理用プログラム |
| DE112016006822T5 (de) * | 2016-06-30 | 2019-01-10 | Intel Corporation | Sensorbasiertes datensatzverfahren und einrichtung |
| CN109714821B (zh) * | 2017-10-23 | 2020-09-29 | 深圳市优必选科技有限公司 | 无线定位测距基站的选择方法及装置 |
| CN114444542A (zh) * | 2022-01-10 | 2022-05-06 | 中国科学院苏州生物医学工程技术研究所 | 液质色谱峰噪声估计方法、装置、存储介质、系统 |
| CN117314790B (zh) * | 2023-11-23 | 2024-02-13 | 奥谱天成(湖南)信息科技有限公司 | 高光谱图像噪声处理方法 |
Citations (2)
| Publication number | Priority date | Publication date | Assignee | Title |
|---|---|---|---|---|
| JPH11153588A (ja) * | 1997-09-17 | 1999-06-08 | Hewlett Packard Co <Hp> | 信号解析方法とプログラム記録媒体とデータ解析システム |
| JP2009008582A (ja) * | 2007-06-29 | 2009-01-15 | Shimadzu Corp | クロマトグラムデータ処理装置 |
Family Cites Families (12)
| Publication number | Priority date | Publication date | Assignee | Title |
|---|---|---|---|---|
| JPS62291562A (ja) * | 1986-06-11 | 1987-12-18 | Hitachi Ltd | クロマトグラフのデ−タ処理方法 |
| JPH051953A (ja) * | 1991-06-24 | 1993-01-08 | Shimadzu Corp | ピーク判定方法 |
| JPH0798270A (ja) | 1993-09-29 | 1995-04-11 | Shimadzu Corp | フロースルー型紫外可視分光光度計 |
| US5966684A (en) * | 1995-11-09 | 1999-10-12 | Richardson; Thomas L. | Method and apparatus for cancelling periodic electrical interference |
| US5748491A (en) * | 1995-12-20 | 1998-05-05 | The Perkin-Elmer Corporation | Deconvolution method for the analysis of data resulting from analytical separation processes |
| JP4016831B2 (ja) * | 2002-12-26 | 2007-12-05 | 株式会社大林組 | 壁面剥離診断のためのウェーブレット変換方法、壁面剥離診断用装置 |
| US20050285023A1 (en) * | 2004-06-23 | 2005-12-29 | Lambda Solutions, Inc. | Automatic background removal for input data |
| US20100283785A1 (en) * | 2009-05-11 | 2010-11-11 | Agilent Technologies, Inc. | Detecting peaks in two-dimensional signals |
| DE102009035587B3 (de) * | 2009-07-31 | 2011-03-24 | Siemens Aktiengesellschaft | Verfahren zur Filterung eines Chromatogramms |
| WO2011106527A2 (en) | 2010-02-24 | 2011-09-01 | Ampersand International, Inc. | Method for noise filtering based on confidence interval evaluation |
| CN102998296B (zh) * | 2012-11-28 | 2014-10-29 | 中国科学院重庆绿色智能技术研究院 | 一种去除背景噪声影响的拉曼光谱预处理方法 |
| JP2014137350A (ja) * | 2013-01-18 | 2014-07-28 | Hitachi High-Technologies Corp | クロマトグラムのノイズ除去方法およびクロマトグラフィー装置 |
-
2015
- 2015-01-26 CN CN201580073796.6A patent/CN107209157B/zh active Active
- 2015-01-26 JP JP2016571512A patent/JP6458812B2/ja active Active
- 2015-01-26 US US15/544,036 patent/US10359404B2/en active Active
- 2015-01-26 WO PCT/JP2015/051973 patent/WO2016120959A1/ja not_active Ceased
- 2015-01-26 EP EP15879857.9A patent/EP3252465A4/en not_active Withdrawn
Patent Citations (2)
| Publication number | Priority date | Publication date | Assignee | Title |
|---|---|---|---|---|
| JPH11153588A (ja) * | 1997-09-17 | 1999-06-08 | Hewlett Packard Co <Hp> | 信号解析方法とプログラム記録媒体とデータ解析システム |
| JP2009008582A (ja) * | 2007-06-29 | 2009-01-15 | Shimadzu Corp | クロマトグラムデータ処理装置 |
Non-Patent Citations (1)
| Title |
|---|
| See also references of EP3252465A4 * |
Cited By (3)
| Publication number | Priority date | Publication date | Assignee | Title |
|---|---|---|---|---|
| JP2020193847A (ja) * | 2019-05-27 | 2020-12-03 | 株式会社東芝 | 波形セグメンテーション装置及び波形セグメンテーション方法 |
| JP7324050B2 (ja) | 2019-05-27 | 2023-08-09 | 株式会社東芝 | 波形セグメンテーション装置及び波形セグメンテーション方法 |
| US12000868B2 (en) | 2019-05-27 | 2024-06-04 | Kabushiki Kaisha Toshiba | Waveform segmentation device and waveform segmentation method |
Also Published As
| Publication number | Publication date |
|---|---|
| CN107209157A (zh) | 2017-09-26 |
| US20180011067A1 (en) | 2018-01-11 |
| EP3252465A4 (en) | 2018-01-17 |
| JPWO2016120959A1 (ja) | 2017-06-29 |
| CN107209157B (zh) | 2019-04-02 |
| EP3252465A1 (en) | 2017-12-06 |
| JP6458812B2 (ja) | 2019-01-30 |
| US10359404B2 (en) | 2019-07-23 |
Similar Documents
| Publication | Publication Date | Title |
|---|---|---|
| JP6458812B2 (ja) | ノイズレベル推定方法、測定データ処理装置、及び測定データ処理用プログラム | |
| CN105105737B (zh) | 基于光电容积描记和谱分析的运动状态心率监测方法 | |
| JP6610678B2 (ja) | ピーク検出方法及びデータ処理装置 | |
| US10928367B2 (en) | Peak extraction method and program | |
| Gutierrez-Osuna et al. | Transient response analysis of an electronic nose using multi-exponential models | |
| Li et al. | Morphological weighted penalized least squares for background correction | |
| JP6094684B2 (ja) | 波形中のピーク端点検出方法および検出装置 | |
| JP2015049136A5 (ja) | ||
| CN109596354B (zh) | 基于自适应共振频带识别的带通滤波方法 | |
| Hosseinzadeh et al. | The stability study of numerical solution of Fredholm integral equations of the first kind with emphasis on its application in boundary elements method | |
| Zhou et al. | Shrinkage sliding Fourier-Bessel packet: a coarse-to-fine local narrowband filtering method | |
| CN102472732A (zh) | 色谱滤波方法 | |
| JP6332545B2 (ja) | ノイズレベル推定方法、測定データ処理装置、及び測定データ処理用プログラム | |
| JP6610782B2 (ja) | ピーク検出方法及びデータ処理装置 | |
| JP2016075474A (ja) | 解析装置 | |
| Bhoi et al. | Multidimensional approaches for noise cancellation of ECG signal | |
| CN108201437B (zh) | 一种信号处理的方法和装置 | |
| Al-Manie et al. | A modified S-transform for EEG signals analysis | |
| Levenets et al. | Method for evaluating periodic trends in measured signals based on the number of zero crossings | |
| Polat et al. | Reflection emotions based on different stories onto EEG signal | |
| JP6966245B2 (ja) | 支援装置および支援方法 | |
| JP6680139B2 (ja) | データ平滑化方法及びその方法を実行するプログラム | |
| JP6977526B2 (ja) | 検出レンジ切り替え時のクロマトグラム処理方法 | |
| CN106094509B (zh) | 一种lcr滤波控制方法及装置 | |
| Yang et al. | Multi-Phase Locking Value: A Generalized Method for Determining Instantaneous Multi-frequency Phase Coupling |
Legal Events
| Date | Code | Title | Description |
|---|---|---|---|
| 121 | Ep: the epo has been informed by wipo that ep was designated in this application |
Ref document number: 15879857 Country of ref document: EP Kind code of ref document: A1 |
|
| ENP | Entry into the national phase |
Ref document number: 2016571512 Country of ref document: JP Kind code of ref document: A |
|
| WWE | Wipo information: entry into national phase |
Ref document number: 15544036 Country of ref document: US |
|
| NENP | Non-entry into the national phase |
Ref country code: DE |
|
| REEP | Request for entry into the european phase |
Ref document number: 2015879857 Country of ref document: EP |