WO2016163539A1 - 肝疾患の病態を判別する方法 - Google Patents
肝疾患の病態を判別する方法 Download PDFInfo
- Publication number
- WO2016163539A1 WO2016163539A1 PCT/JP2016/061609 JP2016061609W WO2016163539A1 WO 2016163539 A1 WO2016163539 A1 WO 2016163539A1 JP 2016061609 W JP2016061609 W JP 2016061609W WO 2016163539 A1 WO2016163539 A1 WO 2016163539A1
- Authority
- WO
- WIPO (PCT)
- Prior art keywords
- group
- value
- vcam1
- marker
- amount
- Prior art date
- Legal status (The legal status is an assumption and is not a legal conclusion. Google has not performed a legal analysis and makes no representation as to the accuracy of the status listed.)
- Ceased
Links
Images


Classifications
-
- G—PHYSICS
- G01—MEASURING; TESTING
- G01N—INVESTIGATING OR ANALYSING MATERIALS BY DETERMINING THEIR CHEMICAL OR PHYSICAL PROPERTIES
- G01N33/00—Investigating or analysing materials by specific methods not covered by groups G01N1/00 - G01N31/00
- G01N33/48—Biological material, e.g. blood, urine; Haemocytometers
- G01N33/50—Chemical analysis of biological material, e.g. blood, urine; Testing involving biospecific ligand binding methods; Immunological testing
- G01N33/68—Chemical analysis of biological material, e.g. blood, urine; Testing involving biospecific ligand binding methods; Immunological testing involving proteins, peptides or amino acids
- G01N33/6893—Chemical analysis of biological material, e.g. blood, urine; Testing involving biospecific ligand binding methods; Immunological testing involving proteins, peptides or amino acids related to diseases not provided for elsewhere
-
- G—PHYSICS
- G01—MEASURING; TESTING
- G01N—INVESTIGATING OR ANALYSING MATERIALS BY DETERMINING THEIR CHEMICAL OR PHYSICAL PROPERTIES
- G01N33/00—Investigating or analysing materials by specific methods not covered by groups G01N1/00 - G01N31/00
- G01N33/48—Biological material, e.g. blood, urine; Haemocytometers
- G01N33/483—Physical analysis of biological material
- G01N33/487—Physical analysis of biological material of liquid biological material
- G01N33/49—Blood
- G01N33/492—Determining multiple analytes
-
- G—PHYSICS
- G01—MEASURING; TESTING
- G01N—INVESTIGATING OR ANALYSING MATERIALS BY DETERMINING THEIR CHEMICAL OR PHYSICAL PROPERTIES
- G01N33/00—Investigating or analysing materials by specific methods not covered by groups G01N1/00 - G01N31/00
- G01N33/48—Biological material, e.g. blood, urine; Haemocytometers
- G01N33/50—Chemical analysis of biological material, e.g. blood, urine; Testing involving biospecific ligand binding methods; Immunological testing
- G01N33/53—Immunoassay; Biospecific binding assay; Materials therefor
-
- G—PHYSICS
- G01—MEASURING; TESTING
- G01N—INVESTIGATING OR ANALYSING MATERIALS BY DETERMINING THEIR CHEMICAL OR PHYSICAL PROPERTIES
- G01N33/00—Investigating or analysing materials by specific methods not covered by groups G01N1/00 - G01N31/00
- G01N33/48—Biological material, e.g. blood, urine; Haemocytometers
- G01N33/50—Chemical analysis of biological material, e.g. blood, urine; Testing involving biospecific ligand binding methods; Immunological testing
- G01N33/68—Chemical analysis of biological material, e.g. blood, urine; Testing involving biospecific ligand binding methods; Immunological testing involving proteins, peptides or amino acids
- G01N33/6863—Cytokines, i.e. immune system proteins modifying a biological response such as cell growth proliferation or differentiation, e.g. TNF, CNF, GM-CSF, lymphotoxin, MIF or their receptors
- G01N33/6869—Interleukin
-
- G—PHYSICS
- G01—MEASURING; TESTING
- G01N—INVESTIGATING OR ANALYSING MATERIALS BY DETERMINING THEIR CHEMICAL OR PHYSICAL PROPERTIES
- G01N33/00—Investigating or analysing materials by specific methods not covered by groups G01N1/00 - G01N31/00
- G01N33/48—Biological material, e.g. blood, urine; Haemocytometers
- G01N33/50—Chemical analysis of biological material, e.g. blood, urine; Testing involving biospecific ligand binding methods; Immunological testing
- G01N33/74—Chemical analysis of biological material, e.g. blood, urine; Testing involving biospecific ligand binding methods; Immunological testing involving hormones or other non-cytokine intercellular protein regulatory factors such as growth factors, including receptors to hormones and growth factors
- G01N33/743—Steroid hormones
-
- G—PHYSICS
- G01—MEASURING; TESTING
- G01N—INVESTIGATING OR ANALYSING MATERIALS BY DETERMINING THEIR CHEMICAL OR PHYSICAL PROPERTIES
- G01N33/00—Investigating or analysing materials by specific methods not covered by groups G01N1/00 - G01N31/00
- G01N33/48—Biological material, e.g. blood, urine; Haemocytometers
- G01N33/50—Chemical analysis of biological material, e.g. blood, urine; Testing involving biospecific ligand binding methods; Immunological testing
- G01N33/92—Chemical analysis of biological material, e.g. blood, urine; Testing involving biospecific ligand binding methods; Immunological testing involving lipids, e.g. cholesterol, lipoproteins, or their receptors
-
- G—PHYSICS
- G01—MEASURING; TESTING
- G01N—INVESTIGATING OR ANALYSING MATERIALS BY DETERMINING THEIR CHEMICAL OR PHYSICAL PROPERTIES
- G01N21/00—Investigating or analysing materials by the use of optical means, i.e. using sub-millimetre waves, infrared, visible or ultraviolet light
- G01N21/17—Systems in which incident light is modified in accordance with the properties of the material investigated
- G01N21/25—Colour; Spectral properties, i.e. comparison of effect of material on the light at two or more different wavelengths or wavelength bands
- G01N21/27—Colour; Spectral properties, i.e. comparison of effect of material on the light at two or more different wavelengths or wavelength bands using photo-electric detection ; circuits for computing concentration
-
- G—PHYSICS
- G01—MEASURING; TESTING
- G01N—INVESTIGATING OR ANALYSING MATERIALS BY DETERMINING THEIR CHEMICAL OR PHYSICAL PROPERTIES
- G01N2333/00—Assays involving biological materials from specific organisms or of a specific nature
- G01N2333/435—Assays involving biological materials from specific organisms or of a specific nature from animals; from humans
- G01N2333/705—Assays involving receptors, cell surface antigens or cell surface determinants
- G01N2333/70503—Immunoglobulin superfamily, e.g. VCAMs, PECAM, LFA-3
- G01N2333/70542—CD106
-
- G—PHYSICS
- G01—MEASURING; TESTING
- G01N—INVESTIGATING OR ANALYSING MATERIALS BY DETERMINING THEIR CHEMICAL OR PHYSICAL PROPERTIES
- G01N2800/00—Detection or diagnosis of diseases
- G01N2800/08—Hepato-biliairy disorders other than hepatitis
- G01N2800/085—Liver diseases, e.g. portal hypertension, fibrosis, cirrhosis, bilirubin
-
- G—PHYSICS
- G01—MEASURING; TESTING
- G01N—INVESTIGATING OR ANALYSING MATERIALS BY DETERMINING THEIR CHEMICAL OR PHYSICAL PROPERTIES
- G01N2800/00—Detection or diagnosis of diseases
- G01N2800/52—Predicting or monitoring the response to treatment, e.g. for selection of therapy based on assay results in personalised medicine; Prognosis
-
- G—PHYSICS
- G01—MEASURING; TESTING
- G01N—INVESTIGATING OR ANALYSING MATERIALS BY DETERMINING THEIR CHEMICAL OR PHYSICAL PROPERTIES
- G01N2800/00—Detection or diagnosis of diseases
- G01N2800/56—Staging of a disease; Further complications associated with the disease
-
- G—PHYSICS
- G01—MEASURING; TESTING
- G01N—INVESTIGATING OR ANALYSING MATERIALS BY DETERMINING THEIR CHEMICAL OR PHYSICAL PROPERTIES
- G01N2800/00—Detection or diagnosis of diseases
- G01N2800/60—Complex ways of combining multiple protein biomarkers for diagnosis
-
- G—PHYSICS
- G01—MEASURING; TESTING
- G01N—INVESTIGATING OR ANALYSING MATERIALS BY DETERMINING THEIR CHEMICAL OR PHYSICAL PROPERTIES
- G01N2800/00—Detection or diagnosis of diseases
- G01N2800/70—Mechanisms involved in disease identification
- G01N2800/7052—Fibrosis
-
- G—PHYSICS
- G16—INFORMATION AND COMMUNICATION TECHNOLOGY [ICT] SPECIALLY ADAPTED FOR SPECIFIC APPLICATION FIELDS
- G16H—HEALTHCARE INFORMATICS, i.e. INFORMATION AND COMMUNICATION TECHNOLOGY [ICT] SPECIALLY ADAPTED FOR THE HANDLING OR PROCESSING OF MEDICAL OR HEALTHCARE DATA
- G16H50/00—ICT specially adapted for medical diagnosis, medical simulation or medical data mining; ICT specially adapted for detecting, monitoring or modelling epidemics or pandemics
- G16H50/20—ICT specially adapted for medical diagnosis, medical simulation or medical data mining; ICT specially adapted for detecting, monitoring or modelling epidemics or pandemics for computer-aided diagnosis, e.g. based on medical expert systems
Definitions
- the present invention relates to a method for determining the pathological condition of liver disease.
- the present invention also relates to a method for discriminating non-alcoholic fatty liver (NAFL) and non-alcoholic steatohepatitis (NASH), and a method for discriminating liver fibrosis.
- NAFL non-alcoholic fatty liver
- NASH non-alcoholic steatohepatitis
- Nonalcoholic fatty liver disease is a liver disease closely related to lifestyle-related diseases such as diabetes and obesity.
- NAFLD includes non-alcoholic fatty liver (NAFL) with a good prognosis to non-alcoholic steatohepatitis (NASH) with a poor prognosis.
- NASH is also known to involve inflammation, hepatocyte degeneration or necrosis, or fibrosis. When NASH progresses, it can lead to cirrhosis or liver cancer.
- the number of NASH patients has increased in recent years. Therefore, there is a strong demand for diagnosing NASH and performing appropriate treatment.
- liver biopsy is a highly invasive technique of collecting liver tissue by puncture. Liver biopsy is often not applied even if it is suspected of suffering from NASH because hospitalization is usually necessary and the cost is high. Therefore, liver biopsy is not a sufficient method to make a diagnosis for many patients. Under such circumstances, development of a diagnostic method (discriminating method) using a noninvasive NASH diagnostic marker (a marker for diagnosing NASH) that does not require a liver biopsy is awaited.
- liver fibrosis which is one of the symptoms of NASH, greatly affects the prognosis of NASH (J Hepatol. 2005 Jan; 42 (1): 132-8). It is important to distinguish fibrosis.
- liver biopsy is required for definitive diagnosis also in the determination of the presence or absence of liver fibrosis or the evaluation of its progress. Under these circumstances, development of a method for discriminating NASH in which liver fibrosis has occurred and a method for evaluating its progress are also awaited without relying on liver biopsy.
- NASH non-invasive NASH diagnostic markers
- the current clinical practice guidelines indicate “fatty degeneration, inflammation, hepatocellular injury (balloon-like degeneration)” as features of NASH.
- NASH also includes cases with liver fibrosis.
- the classification of the material based on the pathological findings of liver biopsy (Matteoni, C., Younossi, Z. & Gramlich, T.
- Nonalcoholic fatty liver disease a spectrum of clinical and pathological severity 141.Gastroenterology 141 1419 (1999).) Is widely used.
- most of the existing NASH diagnostic methods are a combination of inflammation markers, hepatocyte damage markers, fibrosis markers, and the like based on the characteristic pathology of NASH.
- NASH Test Non-patent Document 1
- NASH Diagnostics Non-patent Document 2
- NAFIC score Non-patent Document 3
- ROC Receiver Operating Characteristic
- AUROC Receiver Operating Characteristic curve
- the present invention has been made in view of the above circumstances, and provides a method for discriminating the disease type or pathology of a liver disease such as non-alcoholic fatty liver disease that is noninvasive and more accurate. Objective.
- the present inventors have used a group of marker molecules that are in a biological control relationship with each other, thereby enabling pathological conditions of liver diseases such as non-alcoholic fatty liver disease by a non-invasive method. Has been found to be more accurate than conventional methods, and the present invention has been completed.
- M represents normalized score
- N denotes the number of marker molecules
- m i denotes the amount of each marker molecules measured
- mean (m i) each predetermined marker Indicates the mean value of the amount of molecules
- sd (m i ) indicates the standard deviation of each predetermined marker molecule
- mean (m i NASH ) indicates each predetermined value in patients suffering from NASH shows the average value of the amount of the marker molecule
- mean (m i NAFL) shows the average value of the amount of each marker molecule predetermined in patients suffering from NAFL.
- each predetermined marker Indicates the mean value of the amount of molecules
- sd (m i ) indicates the standard deviation of each predetermined marker molecule
- mean (m i NASH ) indicates each predetermined value in patients suffering from NASH shows the average value of the amount of the marker molecule
- mean (m i NAFL) shows the average value of the amount of each marker molecule predetermined in patients suffering from NAFL.
- the index value is the normalized score
- the index value is a method using an average calculation formula from the normalized scores of two groups, a method using a linear regression formula, a method using a linear discriminant formula, a method using a logistic regression formula
- the index value is calculated from one of the following decision trees 1 to 6 from the normalized scores of two groups, [1] The method according to any one of to [3].
- Decision tree 6 (In decision trees 1 to 6, I indicates an index value, and M1 a, M2 a, M3 a, and M4 a indicate the normalized scores of group 1, group 2, group 3, and group 4, respectively.) .
- [6] The method according to any one of [1] to [3] above, wherein the marker molecule is PROS1 and CLU of Group 1 above.
- the marker molecules are VCAM1 and HA of group 2, VCAM1 and CTSD, VCAM1 and COL4, VCAM1 and COL4-7S, HA and COL4
- the marker molecule is AST and PSAT of Group 3 above, AST and LEP, AST and ICAM1, AST, PSAT and LEP, AST, PSAT And CAM-18, AST, LEP and CK-18, AST, ICAM1 and GSTA1, or AST, PSAT and 6Ckine.
- the marker molecules selected from Group 1 are PROS1 and CLU of Group 1 above, and the marker molecules selected from Group 3 are AST And PSAT, AST and LEP, AST and ICAM1, AST, PSAT and LEP, AST, PSAT and ICAM1, AST, LEP and CK-18, AST, ICAM1 and GSTA1 Or the method according to any one of [1] to [5] above, which is AST, PSAT and 6Ckine.
- a method for discriminating liver fibrosis comprising: A step of measuring the amount of a marker molecule contained in blood collected from a subject, wherein the marker molecule to be measured is VCAM1, HA, CTSD, COL4, COL4-7S, ALB, AFP, AXL, CCL19, CGB , CSF1, FAS, Mac-2bp, CA19-9, NRCAM, OPG, VWF and YKL-40, or at least two marker molecules selected from the group 2, or VCAM1;
- the step of determining that the subject has or may have a pathological condition of liver fibrosis and A method in which a normalized score is calculated from Equation 1 below.
- a method for determining liver fibrosis comprising: The marker molecules are VCAM1, HA, CTSD, COL4, COL4-7S, ALB, AFP, AXL, CCL19, CGB, CSF1, FAS, Mac-2bp, CA19-9, NRCAM, OPG, VWF and YKL-40 VCAM1, VCAM1 and HA, VCAM1 and CTSD, VCAM1 and COL4, VCAM1
- Discrimination of liver fibrosis is performed by discriminating between the pathology of Type-1 to Type-3 and the pathology of Type-4 in the Mateoni classification, or the pathology of Stage0, Stage1 or Stage2 in fibrosis Stage, and Stage3 or The method according to [10] or [11] above, which is discrimination from the disease state of Stage4.
- a method for determining the degree of progression of liver disease A step of measuring the amount of marker molecules contained in blood collected from a subject, wherein the marker molecules to be measured are VCAM1, VCAM1 and HA, HA and COL4, VCAM1 and COL4 HA and COL4-7S, or VCAM1 and COL4-7S, and The higher the normalized score calculated based on the amount of the marker molecule, the higher the degree of progression of liver fibrosis, the degree of balloon-like degeneration of hepatocytes, or the degree of progression of liver inflammation in the subject. Or a step of determining that there is such a possibility, wherein the normalized score is calculated from the following Equation 1.
- M represents normalized score
- N denotes the number of marker molecules
- m i denotes the amount of each marker molecules measured
- mean (m i) each predetermined marker Indicates the mean value of the amount of molecules
- sd (m i ) indicates the standard deviation of each predetermined marker molecule
- mean (m i NASH ) is the predetermined value for each patient developing NASH.
- a method for determining the degree of progression of non-alcoholic fatty liver disease A step of measuring the amount of marker molecules contained in blood collected from a subject, wherein the marker molecules to be measured are VCAM1, VCAM1 and HA, HA and COL4, VCAM1 and COL4 HA and COL4-7S, or VCAM1 and COL4-7S, and The greater the normalized score calculated based on the amount of the marker molecule, the greater the degree of progression of liver fibrosis, the degree of activity of nonalcoholic fatty liver disease, the balloon-like degeneration of hepatocytes in the subject.
- M represents normalized score
- N denotes the number of marker molecules
- m i denotes the amount of each marker molecules measured
- mean (m i) each predetermined marker Indicates the mean value of the amount of molecules
- sd (m i ) indicates the standard deviation of each predetermined marker molecule
- mean (m i NASH ) is the predetermined value for each patient developing NASH.
- a method for discriminating liver fibrosis comprising: Measuring the amount of VCAM1 contained in blood collected from the subject; Determining that the subject has or is likely to have a pathology of liver fibrosis when the amount of VCAM1 is greater than a reference value.
- a method for determining the degree of progression of liver disease Measuring the amount of VCAM1 contained in blood collected from the subject; It is determined that the greater the amount of VCAM1, the higher the degree of progression of liver fibrosis, the degree of balloon-like degeneration of hepatocytes, or the degree of progression of liver inflammation in the subject, or the possibility thereof. how to.
- NAFLD non-alcoholic fatty liver disease
- a method of determining that the degree is high or possible [22] A kit for use in the method according to any one of [18] to [21] above, A kit comprising a reagent for detecting VCAM1. [23] A program for use in the method according to any one of [1] to [16] above, On the computer, A standardization step of calculating a standardized score from the measurement data of the amount of the marker molecule contained in the blood collected from the subject based on the formula 1 and obtaining an index value from the calculated standardized score; A comparison step for comparing the obtained index value with a reference value; A determination step of determining whether or not the patient has a disease state of liver disease based on the comparison result; and A program for running [24] A program for use in the method according to any one of [18] to [21], On the computer, A comparison step of comparing the amount of VCAM1 contained in blood collected from the subject with a reference value; A determination step of determining whether or not the patient has a disease state of liver disease based on the comparison result;
- a measuring device for use in the method according to any one of [1] to [16] and [18] to [21], A measuring apparatus comprising: a sample setting unit for setting a sample; a light source unit for irradiating the sample with light; and a detection unit for detecting light transmitted through the sample.
- a liver disease determination system for use in the method according to any one of [1] to [16] above, A measuring device for measuring the amount of the marker molecule contained in blood collected from a subject, and a liver disease determination device for determining the pathological condition of liver disease based on the measured amount of the marker molecule,
- the measurement apparatus includes a sample setting unit for setting a sample, a light source unit for irradiating the sample with light, and a detection unit for detecting light transmitted through the sample, A standard in which the liver disease determination device calculates a standardized score from the measurement data based on the above-described equation 1 by acquiring measurement data from the measurement device, and obtains an index value from the calculated standardized score
- a liver disease determination system comprising: a conversion unit; a comparison unit that compares the obtained index value with a reference value; and a determination unit that determines whether or not the patient has a liver disease state based on the comparison result.
- a liver disease determination system for use in the method according to any one of [18] to [21] above, A measurement device for measuring the amount of VCAM1 contained in blood collected from a subject, and a liver disease determination device for determining the pathology of liver disease based on the measured amount of VCAM1,
- the measurement apparatus includes a sample setting unit for setting a sample, a light source unit for irradiating the sample with light, and a detection unit for detecting light transmitted through the sample, Whether or not the liver disease determination device has a pathological condition of liver disease based on a result of comparison between acquisition means for acquiring measurement data from the measurement device, comparison means for comparing the amount of VCAM1 with a reference value
- a liver disease determination system comprising: determination means for determining [29] suffering from non-alcoholic steatohepatitis (NASH), a pathological condition of liver fibrosis, a high degree of progress of liver fibrosis, a high degree of progress of pathological condition of balloon-like degeneration of hepatocytes
- reagent for detecting VCAM1 is an antibody.
- NASH non-alcoholic steatohepatitis
- liver fibrosis balloon-like degeneration of hepatocytes, liver inflammation, liver hypertrophy, hepatocyte necrosis, hepatocyte apoptosis, hepatocyte degeneration, or liver Use of a reagent to detect VCAM1 for in vitro detection of adiposis.
- the other diagnostic agent is a diagnostic agent for detecting HA, COL4, or COL4-7S.
- the program or the recording medium thereof according to [34] further causing an acquisition step of acquiring measurement data of the amount of marker molecules contained in blood collected from a subject to be executed by a computer.
- the program according to [34] or [35] further causing a computer to calculate a normalization score from the measurement data and to obtain an index value from the calculated normalization score, and to further execute a normalization step.
- the recording medium [37] The program according to any one of [34] to [36] or the recording medium thereof, wherein the marker molecule further comprises HA, COL4, or COL4-7S.
- a method for discriminating between non-alcoholic fatty liver (NAFL) and non-alcoholic steatohepatitis (NASH), or a method for collecting data for diagnosis of NAFL and NASH (1) A step of measuring the amount of a marker molecule contained in blood collected from a subject, wherein the marker molecule is (A) All marker molecules of group 1 consisting of PROS1, CLU, ANG, APOC3, APOD, CFHR1, Cortisol, EGFR, HPN, IGFBP3, IL1B, IL23A, MET, MMP10, tetranectin, TTR, VDBP and VEGFR-2 , All of Group 2 consisting of VCAM1, HA, CTSD, COL4, COL4-7S, ALB, AFP, AXL, CCL19, CGB, CSF1, FAS, Mac-2bp, CA19-9, NRCAM, OPG, VWF and YKL-40 All of group 3 consisting
- each predetermined marker Indicates the mean value of the amount of molecules, sd (m i ) indicates the standard deviation of each predetermined marker molecule, mean (m i NASH ) indicates each predetermined value in patients suffering from NASH shows the average value of the amount of the marker molecule, mean (m i NAFL) shows the average value of the amount of each marker molecule predetermined in patients suffering from NAFL.
- the index value is the normalized score
- the step of determining that the subject suffers from or may have NASH, or the index value is larger than the reference value Collecting data for determining whether the subject is suffering from NASH based on a criterion that the subject may be suffering from NASH; Including methods.
- the marker molecule is all molecules of the group 2.
- nonlinear equation is a nonlinear average calculation equation, a nonlinear regression equation, a nonlinear discriminant equation, or a nonlinear logistic regression equation.
- nonlinear average calculation formula is a geometric average in the case of (B).
- nonlinear regression equation is a linear multiplication or a neural network.
- nonlinear discriminant is a decision tree or a support vector machine.
- a method for determining the effect of a therapeutic agent for nonalcoholic steatohepatitis comprising: A step of measuring the amount of a marker molecule contained in blood collected from the patient before and after the application of the therapeutic agent to a NASH patient, wherein the marker molecule to be measured is VCAM1 A VCAM1 and HA, HA and COL4, VCAM1 and COL4, HA and COL4-7S, or VCAM1 and COL4-7S, When the normalized score before and after application of the therapeutic agent is calculated based on the amount of the marker molecule, and the normalized score after application is lower than the normalized score before application, the treatment A method including a step of determining that there is a possibility that there is an effect of applying a medicine, wherein the normalized score is calculated from the following Equation 1.
- M represents normalized score
- N denotes the number of marker molecules
- m i denotes the amount of each marker molecules measured
- mean (m i) each predetermined marker Indicates the mean value of the amount of molecules
- sd (m i ) indicates the standard deviation of each predetermined marker molecule
- mean (m i NASH ) is the predetermined value for each patient developing NASH.
- a method for determining the effect of a therapeutic agent for nonalcoholic steatohepatitis comprising: Measuring the amount of VCAM1 contained in blood collected from the patient before and after application of the therapeutic agent for NASH patients, A method of determining that there is a possibility that there is an effect of applying the therapeutic agent when the amount of VCAM1 after application is lower than the amount of VCAM1 before application.
- M represents normalized score
- N denotes the number of marker molecules
- m i denotes the amount of each marker molecules measured
- mean (m i) each predetermined marker Indicates the mean value of the amount of molecules
- sd (m i ) indicates the standard deviation of each predetermined marker molecule
- mean (m i NASH ) indicates each predetermined value in patients suffering from NASH shows the average value of the amount of the marker molecule
- mean (m i NAFL) shows the average value of the amount of each marker molecule predetermined in patients suffering from NAFL.
- a method for discriminating a pathological condition of a liver disease such as a non-alcoholic fatty liver disease which is noninvasive and has higher accuracy.
- FIG. 6 is a graph showing normalized scores in patients with a pathological condition of Type-1 to Type-3 and patients with a pathological condition of Type-4 when each marker molecule (measurement method 1) is used.
- FIG. 6 is a graph showing normalized scores or measured VCAM1 values in patients with a pathology of Type-1 to Type-3 and patients with a pathology of Type-4 when each marker molecule (measurement method 2) is used.
- Patients with stage 0, stage 1 or stage 2 pathological condition (F0-2) and stage 3 or stage 4 pathological condition in “Stage” which is an index of the degree of progression of liver fibrosis when using each marker molecule (measurement method 1) It is a graph which shows the normalization score in a patient (F3-4).
- stage 0, stage 1 or stage 2 pathological condition (F0-2) and stage 3 or stage 4 pathological condition in “Stage” which is an indicator of the degree of progression of liver fibrosis when using each marker molecule (measurement method 2) It is a graph which shows a normalization score or a VCAM1 measured value in a patient (F3-4). It is a graph which shows the correlation with "Stage” which is a parameter
- NAS NAFLD Activity Score
- the method for discriminating between non-alcoholic fatty liver (NAFL) and non-alcoholic steatohepatitis (NASH) according to the present embodiment (hereinafter sometimes referred to as “discrimination method”) is as follows. (1) a step of measuring the amount of a marker molecule contained in blood collected from a subject; (2) obtaining an index value based on a normalized score calculated based on the amount of the marker molecule in the same group; (3) including a step of determining that the subject has developed or may have NASH when the index value is greater than a reference value.
- Non-alcoholic steatohepatitis is a disease classified into non-alcoholic fatty liver disease (NAFLD) together with non-alcoholic fatty liver (NAFL).
- NAFLD is defined as a fatty liver disease that does not involve excessive intake of alcohol among liver diseases excluding viral liver diseases and autoimmune liver diseases.
- NASH is defined by pathological diagnosis as “in addition to macrodroplet steatosis of hepatocytes, which shows balloon-like degeneration of hepatocytes accompanied by inflammation”. NASH matches the cases classified as Type-3 or Type-4 in the Mateoni classification. It is known that NASH can develop cirrhosis or liver cancer as its disease state progresses.
- NASH liver fibrosis
- balloon-like degeneration of hepatocytes liver inflammation, liver hypertrophy, hepatocyte necrosis, hepatocyte apoptosis, hepatocyte degeneration, liver fatification, and the like.
- NAFL is a disease based on large lipid fatification of hepatocytes that does not correspond to NASH among NAFLD.
- NAFL is consistent with cases classified as Type-1 or Type-2 in the Mateoni classification. NAFL is known to have a better prognosis than NASH.
- each step will be described.
- Step of measuring the amount of marker molecule contained in blood collected from a subject examples include whole blood, serum, plasma and the like, and serum or plasma is preferably used.
- the marker molecule will be described.
- group the group of biomolecules (sometimes referred to as “group”, “factor module”, or “module”) that are linked to each other and have strong biological relationships with each other.
- group the group of biomolecules (sometimes referred to as “group”, “factor module”, or “module”) that are linked to each other and have strong biological relationships with each other.
- module the group of biomolecules
- Marker molecules in group 1 are marker molecules that are associated with defense responses against fatty liver, such as PROS1 (vitamin K-dependent protein S), CLU (clusterin), ANG (angio) Genin), APOC3 (apolipoprotein C-III), APOD (apolipoprotein D), CFHR1 (Complement factor H-related protein 1), cortisol, EGFR (epidermal growth factor receptor), HPN (Hepsin), IGFBP3 (insulin-like) Growth factor binding protein type 3), IL1B (interleukin 1 ⁇ ), IL23A (interleukin 23), MET (hepatocyte growth factor receptor), MMP10 (matrix metalloprotease 10), tetranectin, TTR (transthyretin), VDBP (Vitamin D It is 18 kinds of coupling protein) and VEGFR-2 (vascular endothelial cell growth factor receptor 2).
- PROS1 vitamin K-dependent protein S
- CLU clusterin
- ANG angio
- the marker molecule of group 2 is a marker molecule associated with the immune system's defense response against hepatocellular injury, VCAM1 (vascular cell adhesion molecule 1), HA (hyaluronic acid) CTSD (cathepsin D), COL4 (collagen 4), COL4-7S (type 4 collagen 7S), ALB (albumin), AFP ( ⁇ -fetoprotein), AXL (AXL receptor tyrosine kinase), CCL19 (Chemokine (CC motif) ligand 19), CGB (human chorionic gonadotropin ⁇ ), CSF1 (macrophage colony stimulating factor 1), FAS (FASLG Receptor), Mac-2bp (Mac-2 binding protein), CA19-9 (tumor antigen 19-9), NRCAM (nerve cell adhesion molecule), OPG (osteoprotegerin), V F, which is a 18 kind of (von Willebrand factor) and YKL-40
- Marker molecules in group 3 are marker molecules associated with innate immune reactions caused by hepatitis, and include AST (aspartate aminotransferase), PSAT (Phosphoserine Aminotransferase), LEP ( Leptin), ICAM1 (cell adhesion molecule 1), CK-18 (CK18 M30 fragment), GSTA1 (Glutathione S-Transferase alpha), ALT (alanine), INS IVD (insulin, measured by CLIA method), INS MAP (insulin, human MAP method (measured by multiple immunoassay service provided by Myriad RBM), 6 Ckine, AGT (angiotensinogen), CRP (C-reactive protein), CXCL10 (CXC motif chemokine 10, Interferon gamma Induced P rotein 10), FABP4 (Fatty Acid-Binding Protein 4, adipocyte), G6PI (Glucose-6-phosphate Isomerase),
- Marker molecules of group 4 are marker molecules associated with cell proliferation related to hepatocellular injury and liver fibrosis, and are AREG (amphiregulin), BDNF (brain-derived nerves). (Nutrient factor), CD40-L (CD40 ligand), EREG (epiregulin), FGF2 (basic fibroblast growth factor), HBEGF (heparin-binding EGF-like growth factor), IGFBP2 (insulin-like growth factor binding protein 2), MMP9 (Matrix metalloprotease 9), PAI-1 (plasminogen activation inhibitor 1), PDGFB (platelet-derived growth factor BB), PLGF (placental growth factor), SAP (serum amyloid P component), TGFA (transforming growth) Factor ⁇ ), TGFB1 (Latency-Associated Peptide of Transforming Growth) Factor beta 1), is sixteen THBSl (thrombospondin 1) and VTN (Vitronectin).
- (A1) at least two marker molecules selected from group 1, at least two marker molecules selected from group 2, at least two marker molecules selected from group 3, or at least two marker molecules selected from group 4 or , (B1) Of the two groups selected from the group 1, the group 2, the group 3, and the group 4, at least two marker molecules selected from one and at least two marker molecules selected from the other, Can be mentioned.
- the marker molecules to be measured are, for example, at least two marker molecules selected from group 1 and at least two marker molecules selected from group 2, at least two marker molecules selected from group 1 and At least two marker molecules selected from group 3, at least two marker molecules selected from group 1 and at least two marker molecules selected from group 4, at least two marker molecules selected from group 2 and at least selected from group 3
- Two marker molecules, at least two marker molecules selected from group 2 and at least two marker molecules selected from group 4, at least two marker molecules selected from group 3 and at least two marker molecules selected from group 4 Can be mentioned.
- the marker molecule to be measured is (A2) all marker molecules of group 1, all marker molecules of group 2, all marker molecules of group 3, or all marker molecules of group 4, or (B2) All marker molecules of two groups selected from the group 1, the group 2, the group 3, and the group 4 can be mentioned.
- the marker molecules to be measured are, for example, all marker molecules of group 1 and group 2, all marker molecules of group 1 and group 3, all marker molecules of group 1 and group 4, Examples include all marker molecules of group 2 and group 3, all marker molecules of group 2 and group 4, all marker molecules of group 3 and group 4, and preferably all marker molecules of group 1 and group 3. is there.
- the method for measuring the amount of the marker molecule described above is not particularly limited as long as the amount in the blood can be measured, and a known method can be used.
- methods for measuring the amount of marker molecule include ELISA, immunochemiluminescence (CLIA), latex agglutination, radioimmunoassay, immunoturbidimetry, enzyme activity measurement, dye-binding method, Luminex method, Western blotting, human MAP method, mass spectrometry method and the like can be mentioned.
- a step of obtaining an index value from a normalized score calculated based on the amount of marker molecules in the same group includes a measured marker
- a step of normalizing data derived from the amount of molecules, a step of converting the distribution of the normalized data, and a step of selecting a representative value obtained from the converted distribution as a normalized score are included.
- a known method can be used without any particular limitation.
- a method for normalizing the above data for example, a method of proportional conversion so that the root mean square is 1, a method of linear conversion so that the mean and variance are equal, a maximum value of 1 and a minimum value of 0
- the method of performing linear transformation so that the average and the variance are preferably the same is mentioned.
- a known method can be used without any particular limitation.
- Examples of the method for converting the distribution of normalized data include conversion using a logarithmic function, conversion using a sigmoid function, and the like, and preferably conversion using a standard sigmoid function. Further, this step can be omitted.
- a known method can be used without any particular limitation.
- the representative value include a general statistical value, that is, an average value, a median value, a mode value, a maximum value, a minimum value, an arbitrary percentile value, and the like, and preferably an average value and a median value. .
- the step of normalizing the data by a method of linear transformation so that the mean and variance are equivalent preferably, the step of converting the distribution of data by a standard sigmoid function And a step of selecting an average value obtained from the converted distribution as a representative value.
- the normalized score is calculated from the following equation 1 based on the amount of marker molecules in the same group.
- M represents a normalized score
- N represents the number of marker molecules
- m i represents the amount of each marker molecule measured
- mean (m i ) represents each predetermined marker molecule Sd (m i ) indicates the standard deviation of each predetermined marker molecule
- mean (m i NASH ) indicates each predetermined marker in patients suffering from NASH shows the average value of the amount of molecules
- mean (m i NAFL) shows the average value of the amount of each marker molecule predetermined in patients suffering from NAFL.
- mean (m i ) is an average value of the amount of each marker molecule, which is an average value obtained by measuring a specimen of a patient with NAFLD, an average value of NAFLD patients based on known measurement data, An average value of local residents including a person to be discriminated or evaluated based on known measurement data, an average value of a race to be discriminated or evaluated based on known measurement data, and the like can be used.
- the average value of those affected with NAFLD the simple average value of the entire affected population, the simple average value of NAFL affected population and the average value of NASH patients in the affected population, the average of NAFL affected subjects
- a weighted average value obtained by applying an arbitrary weight to each of the value and the average value of the NASH patient can be used.
- the simple average value of NAFLD patients based on known measurement data the average value of NAFL patients and the average value of NASH patients based on known measurement data
- Use a weighted average value obtained by applying an arbitrary weight to each of the average value of NAFL patients and the average value of patients with NASH based on known measurement data Can do.
- known measurement data measurement values of biomolecules published in papers, values described in package inserts of in vitro diagnostic agents, values described in clinical guidelines, and the like can be used. A plurality of data can be combined and used.
- a simple average value of the entire affected population obtained by measuring a sample of NAFLD-affected individuals or a simple average value of the average value of NAFL affected individuals and the average value of NASH patients in the affected population. It is done. More preferably, a simple average value of the average value of NAFL patients in the affected population and the average value of NASH patients obtained by measuring specimens of NAFLD patients can be mentioned.
- sd (m i ) is a standard deviation of the amount of each marker molecule, which is obtained by measuring a sample of a patient with NAFLD, a standard deviation of a patient with NAFLD based on known measurement data, and a known measurement
- the standard deviation of the local residents including the person to be discriminated or evaluated based on the data, the standard deviation of the race to be discriminated or evaluated based on the known measurement data can be used.
- the standard deviation of NAFLD sufferers When the standard deviation of NAFLD sufferers is used, the standard deviation of the entire affected population, the simple average of the standard deviation of NAFL sufferers in the affected population and the standard deviation of NASH patients, the standard deviation of NAFL sufferers A weighted average value obtained by applying an arbitrary weight to each of the standard deviation of NASH and the standard deviation of the NASH patient can be used.
- the standard deviation of NAFLD patients based on known measurement data When the standard deviation of NAFLD patients based on known measurement data is used, the standard deviation of NAFLD patients based on known measurement data, the standard deviation of NAFL patients based on the known measurement data, and the standard deviation of NASH patients A simple average value, a weighted average value obtained by applying an arbitrary weight to each of the standard deviation of a patient with NAFL and the standard deviation of a patient with NASH based on known measurement data, and the like may be used. it can.
- known measurement data measurement values of biomolecules published in papers, values described in package inserts of in vitro diagnostic agents, values described in clinical guidelines, and the like can be used. A plurality of data can be combined and used.
- the standard deviation of the whole affected population obtained by measuring a sample of NAFLD-affected individuals, or the simple average value of the standard deviation of NAFL affected individuals and the standard deviation of NASH patients in the affected population is used.
- a simple average value of the standard deviation of NAFL patients and the standard deviation of NASH patients in the affected population obtained by measuring specimens of NAFLD patients can be mentioned.
- mean (m i), sd ( m i), mean (m i NASH) and mean (m i NAFL) can be the same marker molecules, when the method of measuring the amount of marker molecules are different, respectively Different values corresponding to the measurement methods may be set. If the relationship between the measurement values of different measurements is observed and set in one of the measurement methods mean (m i), sd ( m i), mean (m i NASH) and mean (m i NAFL) May be substituted into a predetermined relational expression and converted into the respective values of the other measurement method.
- Mean (m i ), sd (m i ), mean (m i NASH ), and mean (m i NAFL ) may be appropriately set according to the race or region to be measured.
- mean (m i), sd ( m i), specific examples of the mean (m i NASH) and mean (m i NAFL) include the values set forth in Tables 5 to 8 and Table 41 below.
- the normalized score calculated is one (when the marker molecule is (A) above), the value of the normalized score is used as an index value as it is.
- the calculated normalized score is 2 or more (when the marker molecule is (B) above), it is possible to obtain an index value using a plurality of normalized scores.
- a known method can be used without particular limitation in the step of obtaining an index value from a plurality of normalized scores.
- Examples of a method for obtaining an index value from a plurality of standardized scores include a method using a linear format and a method using a non-linear expression.
- Examples of the method using a linear format include a method using an average calculation formula, a method using a linear regression formula, a method using a linear discriminant formula, and a method using a logistic regression formula.
- Examples of the method using the average calculation formula include a method using an arithmetic average.
- Examples of the method using the linear discriminant include a method using linear discriminant analysis.
- Examples of the method using a nonlinear equation include a method using a nonlinear average calculation equation, a method using a nonlinear regression equation, a method using a nonlinear discriminant equation, and a method using a nonlinear logistic regression equation.
- Examples of the method using the nonlinear average calculation formula include a method using a geometric average.
- Examples of the method using a non-linear regression equation include a method using a linear multiplication and a method using a neural network.
- Examples of the method using a nonlinear discriminant include a method using a decision tree and a method using a support vector machine.
- a preferable method includes a method using a decision tree or a method using a logistic regression equation.
- a more preferable method includes a method using a logistic regression equation, and a preferable index value is a value calculated from the following equation 2.
- I indicates an index value
- M a1 and M a2 are the normalized score of one of the two groups and the normalized score of the other (“first normalized score” and “second represents normalized score ") of, a 1 and a 2, it shows a constant discrimination error between NAFL and NASH is determined so as to minimize.
- I a 1 ⁇ M a1 + a 2 ⁇ M a2 (Formula 2)
- a 1 and a 2 may be obtained by any method as long as the discriminant error between NAFL and NASH is minimized.
- a 1 and a 2 may be obtained by a method such as linear discriminant analysis or logistic regression analysis. It is done.
- Specific examples of a 1 and a 2 include values described in Table 9 described later.
- the following decision trees 1 to 6 are used.
- the index value is obtained from the decision tree, for example, the values described in Table 11 of the example described later are used as the reference value.
- Decision tree 6 In decision trees 1 to 6, I indicates an index value, and M1 a, M2 a, M3 a, and M4 a indicate the normalized scores of group 1, group 2, group 3, and group 4, respectively.) .
- the step of determining that the subject may have NASH when the index value is larger than the reference value is a reference value (cutoff value) and can be set arbitrarily.
- the reference value may be an index value in NAFL sufferers or a preset value.
- the preset values include the reference value and sensitivity (correct diagnosis rate of NASH affected persons) and specificity (NAFL affected persons) estimated from the ROC curve derived from the index values of NAFL affected persons and NASH affected persons. Based on the relationship of the correct diagnosis rate), an index value that provides the sensitivity and specificity required by the user can be set as the reference value.
- Examples of the reference value used for determining whether or not a subject may have NASH include the following values.
- the reference values shown below correspond to the case where the standardized score value is used as it is as the index value, and the case where the index value obtained from a plurality of standardized scores using the above (Equation 2) is used.
- the reference value is illustrated.
- the marker molecule is at least two marker molecules of group 1
- the reference value is a value set between 0.149 and 0.907, for example.
- the reference value is a value set between 0.087 and 0.848, for example.
- the reference value is a value set between 0.164 and 0.909, for example.
- the reference value is a value set between 0.073 and 0.854, for example.
- the reference value is a value set between 0.359 and 0.586, for example, which is preferable from the viewpoint of improving the correct diagnosis rate of those suffering from NASH
- the value is set between 0.359 and 0.486, and is preferably set between 0.486 and 0.586 from the viewpoint of improving the correct diagnosis rate of NAFL patients.
- the reference value is, for example, a value set between 0.357 and 0.509, preferably from the viewpoint of improving the correct diagnosis rate of NASH affected individuals.
- the value is set between 0.357 and 0.419, and is preferably set between 0.419 and 0.509 from the viewpoint of improving the correct diagnosis rate of NAFL sufferers.
- the reference value is a value set, for example, between 0.378 and 0.545, preferably from the viewpoint of improving the correct diagnosis rate of those with NASH.
- the value is set between 0.378 and 0.45, and is preferably set between 0.45 and 0.545 from the viewpoint of improving the correct diagnosis rate of NAFL patients.
- the reference value is a value set between 0.272 and 0.583, for example, and preferably from the viewpoint of improving the correct diagnosis rate of NASH affected persons
- the value is set between 0.272 and 0.489, and is preferably set between 0.489 and 0.583 from the viewpoint of improving the correct diagnosis rate of NAFL sufferers.
- the reference value is a value set between 3.438 and 25.735, for example.
- the reference value is a value set between 5.987 and 34.702, for example.
- the reference value is a value set between 1.932 and 14.239, for example.
- the reference value is a value set between 2.836 and 19.664, for example.
- the reference value is a value set between 1.387 and 14.334, for example.
- the reference value is a value set between 3.044 and 20.554, for example.
- the reference value is a value set between 12.055 and 15.396, for example, and the viewpoint of improving the correct diagnosis rate of NASH sufferers Is preferably a value set between 12.025 and 13.795, and is preferably set between 13.795 and 15.396 from the viewpoint of improving the correct diagnosis rate of NAFL patients. .
- the reference value is a value set between 15.915 and 20.712, for example, and the viewpoint of improving the correct diagnosis rate of those suffering from NASH Is preferably a value set between 15.915 and 18.297, and is preferably set between 18.297 and 20.712 from the viewpoint of improving the correct diagnosis rate of NAFL sufferers. .
- the reference value is a value set between, for example, 6.219 to 8.967, and the viewpoint of improving the correct diagnosis rate of NASH affected persons Is preferably a value set between 6.219 and 7.533, and is preferably set between 7.533 and 8.967 from the viewpoint of improving the correct diagnosis rate of NAFL patients.
- the reference value is a value set between 8.497 and 11.466, preferably between 8.497 and 10.129. From the viewpoint of improving the correct diagnosis rate of NAFL patients, the value is preferably set between 10.129 and 11.466.
- the reference value is a value set between 5.889 and 8.934, for example, and the viewpoint of improving the correct diagnosis rate of those suffering from NASH Is preferably a value set between 5.889 and 7.445, and is preferably set between 7.445 and 8.934 from the viewpoint of improving the correct diagnosis rate of NAFL patients. .
- the reference value is a value set between 9.023 and 12.548, for example, and the viewpoint of improving the correct diagnosis rate of NASH sufferers Is preferably a value set between 9.023 and 10.665, and preferably a value set between 10.665 and 12.548 from the viewpoint of improving the correct diagnosis rate of NAFL patients. .
- one aspect of the determination method according to the present embodiment is a group composed of a plurality of biomolecules (16 to 18 types) that are linked to the abundance in blood and have strong mutual biological relationships.
- the major features are the use of (modules) and the use of normalized scores based on measurements of all marker molecules in a given group (module) rather than the amount of individual marker molecules.
- a method for discriminating between NAFL and NASH based on measurement of a plurality of marker molecules has been reported so far. However, both methods are based on the measurement of a small number of marker molecules. Methods based on the measurement of a small number of marker molecules tend to be susceptible to variations or biases in the measurement of the amount of each marker molecule.
- the discriminating method according to the present embodiment is based on the measurement of a larger number of marker molecules, and the module is composed of marker molecules that have a strong biological relationship with each other and are linked to the abundance in blood.
- a representative value standardized score
- the discrimination method according to the present embodiment uses a statistical value such as an average value or a median of standardized measurement values of marker molecules as an index value, and learning in this step is not performed. This has the advantage of avoiding excessive adaptation to the specimen group. From these two points, the discrimination method according to the present embodiment is a discrimination method of NAFL and NASH that has superior features as compared with the prior art.
- the marker molecule to be measured may be one or a plurality of marker molecules of a predetermined group (module).
- a marker molecule representing each module it is possible to easily make a determination while maintaining high accuracy.
- the marker molecule representing each module can be appropriately selected without particular limitation.
- the types of marker molecules selected may be, for example, 2 to 3 types, or 4 to all types.
- the marker molecule may include PROS1 and CLU, or PROS1 and CLU.
- the marker molecule may contain VCAM1, VCAM1, VCAM1 and HA, VCAM1 and HA, VCAM1 and CTSD.
- VCAM1 and CTSD may be included
- VCAM1 and COL4 may be included
- VCAM1 and COL4 may be included
- VCAM1 and COL4-7S may be included.
- HA And CTSD may be included
- HA and COL4 may be included
- HA and COL4 may be included
- CTSD and CTSD may be included.
- the marker molecule may be AST and PSAT, may include AST and PSAT, may be AST and LEP, or may include AST and LEP.
- AST and ICAM1 may be included, AST and ICAM1 may be included, AST, PSAT and LEP may be included, AST, PSAT and LEP may be included, AST and PSAT May include AST, PSAT and ICAM1, may include AST, LEP and CK-18, or may include AST, LEP and CK-18.
- AST, ICAM1 and GSTA1 may include AST, ICAM1 and GSTA1, and may include AST, PSAT and It may be a 6Ckine, AST, may include PSAT and 6Ckine.
- the normalized score is calculated from the above equation 1 based on the amount of the marker molecule.
- Examples of the reference value used to determine whether or not a subject is likely to suffer from NASH include the following values.
- the reference value can be set as follows.
- the marker molecule is PROS1 and CLU
- the reference value is, for example, a value set between 0.256 and 0.634. It is a value set between 0.42, and is preferably a value set between 0.42 and 0.634 from the viewpoint of improving the correct diagnosis rate of NAFL patients.
- any method may be used to measure the amount of each marker molecule, but commercially available products can be used, for example.
- the ELISA method “Hyaluronan Quantikine ELISA Kit” is used for the measurement of HA
- the HumanMAP method is used for the measurement of VCAM1, CTSD and COL4
- the radioimmunoassay method “type IV collagen 7S kit” is used for the measurement of COL4-7S.
- the reference value can be set as follows.
- the marker molecules are VCAM1, VCAM1 and HA, VCAM1 and CTSD, VCAM1 and COL4, VCAM1 and COL4-7S, HA and COL4-7S, HA and CTSD, HA and
- the reference value is, for example, a value set between 0.256 and 0.644, and the correct diagnosis rate of persons with NASH The value is preferably set between 0.256 and 0.42 from the viewpoint of improvement of the risk, and is preferably set between 0.389 and 0.644 from the viewpoint of improving the correct diagnosis rate of NAFL sufferers. Value.
- the reference value is, for example, a value set between 0.28 and 0.644.
- the reference value is, for example, a value set between 0.326 and 0.617, and preferably from 0.326 to 0.6 from the viewpoint of improving the correct diagnosis rate of NASH affected persons.
- the value is set between 0.398, and is preferably set between 0.398 and 0.617 from the viewpoint of improving the correct diagnosis rate of NAFL sufferers.
- the reference value is, for example, a value set between 0.277 and 0.604, and preferably 0.277 to 0.677 in terms of improving the correct diagnosis rate of NASH affected persons.
- the value is set between 0.408, and is preferably set between 0.408 and 0.604 from the viewpoint of improving the correct diagnosis rate of NAFL patients.
- the reference value is a value set between 0.319 and 0.617, for example, and preferably from 0.319 to 0.619 in terms of improving the correct diagnosis rate of NASH affected persons.
- the value is set between 0.407, and is preferably set between 0.407 and 0.617 from the viewpoint of improving the correct diagnosis rate of NAFL sufferers.
- the reference value is, for example, a value set between 0.303 and 0.543. From the viewpoint of improving the correct diagnosis rate of those suffering from NASH, it is preferably 0. The value is set between 303 and 0.416, and is preferably set between 0.416 and 0.543 from the viewpoint of improving the correct diagnosis rate of NAFL sufferers.
- the reference value is, for example, a value set between 0.326 and 0.509. From the viewpoint of improving the correct diagnosis rate of those suffering from NASH, the reference value is preferably 0.8.
- the value is set between 326 and 0.398, and is preferably set between 0.398 and 0.509 from the viewpoint of improving the correct diagnosis rate of NAFL sufferers.
- the reference value is, for example, a value set between 0.343 and 0.487, and preferably from 0.343 to 0.483 from the viewpoint of improving the correct diagnosis rate of NASH sufferers.
- the value is set between 0.395, and is preferably set between 0.395 and 0.487 from the viewpoint of improving the correct diagnosis rate of NAFL sufferers.
- the reference value is a value set between 0.305 and 0.545, for example, and preferably from 0.305 to 0.55 in terms of improving the correct diagnosis rate of those with NASH.
- the value is set between 0.411, and is preferably set between 0.411 and 0.545 from the viewpoint of improving the correct diagnosis rate of NAFL patients.
- the reference value is, for example, a value set between 0.307 and 0.536, and preferably from 0.307 to 0.57 in terms of improving the correct diagnosis rate of NASH affected persons.
- the value is set between 0.415, and is preferably set between 0.415 and 0.536 from the viewpoint of improving the correct diagnosis rate of NAFL sufferers.
- the reference value is, for example, a value set between 0.271 and 0.575. From the viewpoint of improving the correct diagnosis rate of those suffering from NASH, the reference value is preferably 0.8.
- the value is set between 271 and 0.419, and is preferably set between 0.419 and 0.575 from the viewpoint of improving the correct diagnosis rate of NAFL sufferers.
- an in vitro diagnostic agent “chemylmihyaluronic acid” based on latex agglutination method or CLIA method is used for HA measurement
- ELISA method Human sVCAM-1 / CD106 Quantikine ELISA Kit”
- VCAM1 measurement VCAM1 measurement
- COL4-7S When the radioimmunoassay method “type IV collagen 7S kit” is used for the measurement, the reference value can be set as follows.
- the marker molecules are VCAM1 and HA
- the reference value is a value set between 0.326 and 0.684, for example, and preferably from 0.326 to 0.62 in terms of improving the correct diagnosis rate of NASH affected persons.
- the value is set between 0.39, and is preferably set between 0.39 and 0.684 from the viewpoint of improving the correct diagnosis rate of NAFL sufferers.
- the reference value is a value set between 0.293 and 0.548, for example.
- the value is set between 293 and 0.394, and is preferably set between 0.394 and 0.548 from the viewpoint of improving the correct diagnosis rate of NAFL sufferers.
- the reference value is, for example, a value set between 0.308 and 0.662, and preferably from the viewpoint of improving the correct diagnosis rate of NASH sufferers.
- the value is set between 308 and 0.394, and is preferably set between 0.394 and 0.662 from the viewpoint of improving the correct diagnosis rate of NAFL sufferers.
- the measured value of VCAM1 (the amount of VCAM1) may be used as an index value as it is instead of the normalized score calculated from the above formula 1.
- the ELISA method “Human sVCAM-1 / CD106 Quantikine ELISA Kit” is used to measure the amount of VCAM1
- the standard value (concentration in serum (ng / ml)) is, for example, 551.1 to 1280.1 From the viewpoint of improving the correct diagnosis rate of NASH affected persons, it is preferably set between 551.1 and 806.2, which means that the correct diagnosis rate of NAFL affected persons is improved. From the viewpoint, it is preferably a value set between 806.2 and 1280.1.
- the enzyme activity measurement method is used for the measurement of AST
- the HumanMAP method is used for the measurement of PSAT, LEP, ICAM1, GSTA1, and 6Ckine
- the ELISA method “M30 Apoptosense ELISA” is used for the measurement of CK-18
- the reference value can be set as follows.
- the marker molecules are AST and PSAT, AST and LEP, AST and ICAM1, AST, PSAT and LEP, AST, PSAT and ICAM1, AST, LEP and CK-18, AST,
- the reference value is a value set between 0.284 and 0.629, for example, and the viewpoint of improving the correct diagnosis rate of persons with NASH Is preferably a value set between 0.284 and 0.439, and preferably a value set between 0.393 and 0.629 from the viewpoint of improving the correct diagnosis rate of NAFL patients. .
- the reference value is, for example, a value set between 0.284 and 0.544, and preferably 0.284 to 0.584 from the viewpoint of improving the correct diagnosis rate of NASH affected persons.
- the value is set between 0.397, and is preferably set between 0.397 and 0.544 from the viewpoint of improving the correct diagnosis rate of NAFL patients.
- the reference value is a value set between 0.309 and 0.629, for example, and preferably from 0.309 to 0.69 in terms of improving the correct diagnosis rate of NASH affected persons.
- the value is set between 0.412, and is preferably set between 0.412 and 0.629 from the viewpoint of improving the correct diagnosis rate of NAFL patients.
- the reference value is, for example, a value set between 0.302 and 0.546, and preferably from 0.302 to 0.52 in terms of improving the correct diagnosis rate of NASH affected persons.
- the value is set between 0.406, and is preferably set between 0.406 and 0.546 from the viewpoint of improving the correct diagnosis rate of NAFL patients.
- the reference value is, for example, a value set between 0.303 and 0.619. From the viewpoint of improving the correct diagnosis rate of those with NASH, the reference value is preferably 0.
- the value is set between 303 and 0.418, and is preferably set between 0.418 and 0.619 from the viewpoint of improving the correct diagnosis rate of NAFL patients.
- the reference value is a value set between 0.301 and 0.551, for example.
- the value is set between 301 and 0.406, and is preferably set between 0.406 and 0.551 from the viewpoint of improving the correct diagnosis rate of NAFL patients.
- the reference value is a value set, for example, between 0.297 and 0.625, preferably from the viewpoint of improving the correct diagnosis rate of persons with NASH
- the value is set between 0.297 and 0.439, and is preferably set between 0.439 and 0.625 from the viewpoint of improving the correct diagnosis rate of NAFL patients.
- the reference value is a value set between 0.302 and 0.573, for example, and preferably from the viewpoint of improving the correct diagnosis rate of those suffering from NASH.
- the value is set between 302 and 0.393, and is preferably set between 0.393 and 0.573 from the viewpoint of improving the correct diagnosis rate of NAFL patients.
- the reference value is, for example, a value set between 0.291 and 0.535.
- the value is set between 291 and 0.416, and is preferably set between 0.416 and 0.535 from the viewpoint of improving the correct diagnosis rate of NAFL sufferers.
- one type of marker molecule may be selected as a marker molecule representing a predetermined group (module).
- the measured value of the marker molecule (the measured amount of the marker molecule) may be used as an index value as it is.
- the marker molecule representing group 2 may be VCAM1, and the measured value of VCAM1 (for example, concentration in serum) may be used as the index value.
- the reference value concentration in serum (ng / ml)
- the value is set between 693.5 and 925.3 from the viewpoint of improving the correct diagnosis rate of persons suffering from NASH.
- a normalization score calculated based on the amounts of PROS1 and CLU is used as the first normalization score
- an amount of at least one marker molecule selected from group 3 is used as the second normalization score
- AST and PSAT Amount AST and LEP amount
- AST and ICAM1 amount AST, PSAT and LEP amount
- AST, PSAT and ICAM1 amount AST, LEP and CK-18 amount
- AST, ICAM1 and GSTA1 amount or
- the index value may be calculated from Equation 2 above using a normalized score calculated based on the amounts of AST, PSAT, and 6Ckine.
- HumanMAP method is used to measure PROS1, CLU, PSAT, LEP, ICAM1, GSTA1 and 6Ckine, enzyme activity measurement method is used to measure AST, and ELISA method “M30 Apoptosense ELISA” is used to measure CK-18.
- the reference value can be set as follows.
- the marker molecules are PROS1 and CLU, and AST and PSAT, AST and LEP, AST and ICAM1, AST, PSAT and LEP, AST, PSAT and ICAM1, AST, LEP and
- the reference value is, for example, a value set between 13.493 and 21.205, and a person suffering from NASH From the viewpoint of improving the correct diagnosis rate, it is preferably a value set between 13.493 and 18.331, and preferably from 16.789 to 21.205 from the viewpoint of improving the correct diagnosis rate of NAFL sufferers. It is a value set between.
- the reference value is a value set between, for example, 13.493 to 21.02, which improves the accuracy of diagnosis in persons with NASH Is preferably set between 13.493 and 17.141, and is preferably set between 17.141 and 21.02 from the viewpoint of improving the accuracy of NAFL sufferers. It is.
- the reference value is a value set, for example, between 14.228 and 20.755, which improves the accuracy of diagnosis in persons with NASH Is preferably a value set between 14.228 and 18.145, and preferably a value set between 18.145 and 20.755 from the viewpoint of improving the correct diagnosis rate of NAFL patients. It is.
- the reference value is a value set between, for example, 13.663 to 20.831, which improves the accuracy of diagnosis in persons with NASH Is preferably set between 13.663 and 17.406, and preferably set between 17.406 and 20.831 from the viewpoint of improving the correct diagnosis rate of NAFL patients. It is.
- the reference value is a value set between 14.229 and 20.833, for example, and the correct diagnosis rate of NASH affected persons
- the value is preferably set between 14.229 and 18.331, from the viewpoint of improving the frequency, and preferably set between 18.331 and 20.843, from the viewpoint of improving the correct diagnosis rate of NAFL sufferers. Value.
- the reference value is a value set between 13.929 and 21.053, for example, and the correct diagnosis rate of persons with NASH The value is preferably set between 13.929 and 17.7.749 from the viewpoint of improvement of the rate, and preferably set between 17.749 and 21.053 from the viewpoint of improving the correct diagnosis rate of NAFL sufferers. Value.
- the reference value is a value set between 13.544 and 21.168, for example.
- the value is preferably set between 13.544 and 18.319 from the viewpoint of improving the diagnosis rate, and preferably between 18.319 and 21.168 from the viewpoint of improving the correct diagnosis rate of NAFL sufferers.
- the marker molecules are PROS1 and CLU, and AST, ICAM1 and GSTA1
- the reference value is a value set between, for example, 13.788 and 20.882
- the value is preferably set between 13.788 and 17.643 from the viewpoint of improvement of the rate, and is preferably set between 17.643 and 20.882 from the viewpoint of improving the correct diagnosis rate of NAFL sufferers. Value.
- the reference value is a value set between, for example, 13.844 to 21.205, and the correct diagnosis rate of NASH affected persons
- the value is preferably set between 13.844 and 16.789, from the viewpoint of improving the frequency, and preferably set between 16.789 and 21.205, from the viewpoint of improving the correct diagnosis rate of NAFL sufferers. Value.
- the determination method according to the present embodiment can also be used as a method for determining the degree of progression of the pathological condition of NAFLD, NAFL, or NASH. It is determined that the greater the index value, the higher the degree of progression of the pathological condition of NAFLD, NAFL, or NASH in the subject. Alternatively, when the index value after application of the therapeutic agent is smaller than the index value before adaptation, it may be determined that there may be an effect of applying the therapeutic agent.
- the discrimination method includes a method of discriminating between the pathology of Type-1 to Type-3 and the pathology of Type-4 in the Mateoni classification, the pathology of Stage0, Stage1 or Stage2 in the fibrosis Stage, and Stage3 or Stage4 It can also be used as a method for discriminating liver fibrosis, such as a method for discriminating from the pathological condition.
- a method for discriminating liver fibrosis when the normalized score is larger than the reference value, it is determined that the subject may have a disease state of liver fibrosis.
- these pathological conditions have been determined based on pathological findings by liver biopsy.
- Mateoni classification is a method of diagnosis of NAFL and NASH based on the pathological findings of liver biopsy, and is a commonly used method (Matteoni, C., Younossi, Z. & Gramlich, T. Nonalcoholic fatty liver disease. : A spectrum of clinical and pathological severity. Gastroenterology 1413-1419 (1999). Table 1 shows the relationship between materialion classification and pathological findings (histological findings). In recent years, it has become clear that liver fibrosis is a prognostic deterioration factor in the pathology of NASH. Therefore, in the pathology of NASH, it is important to discriminate pathologies classified into Type-4 of the Mateoni classification, including those with NASH who have liver fibrosis.
- the marker molecules to be measured may be all marker molecules of the above group 2, VCAM1 may be included, VCAM1, VCAM1 and HA, or VCAM1.
- HA may be included
- VCAM1 and CTSD may be included
- VCAM1 and CTSD may be included
- VCAM1 and COL4 may be included
- VCAM1 and COL4 may be included
- VCAM1 and COL4-7S may be included
- VCAM1 and COL4-7S may be included
- HA and COL4-7S may be included
- HA and COL4-7S may be included
- HA and COL4-7S may be included
- HA and COL4-7S may be included
- HA and COL4-7S may be included.
- HA and CTSD may be included, HA and CTSD may be included, HA and COL4 may be included, H And COL4 may be included, CTSD and COL4 may be included, CTSD and COL4 may be included, CTSD and COL4-7S may be included, and CTSD and COL4-7S may be included. You may go out.
- the normalized score is calculated from Equation 1 based on the amount of the marker molecule.
- ELISA method “Hyaluronan Quantikine ELISA Kit” is used to measure HA
- HumanMAP method is used to measure VCAM1, CTSD and COL4
- radioimmunoassay method “type IV collagen 7S kit” is used to measure COL4-7S.
- the marker molecule is at least two marker molecules of group 2
- the reference value is a value set between 0.087 and 0.848, for example.
- the marker molecules are all the marker molecules of group 2, VCAM1, VCAM1 and HA, VCAM1 and CTSD, VCAM1 and COL4, VCAM1 and COL4-7S, HA and COL4-7S Is HA and CTSD, HA and COL4, CTSD and COL4, or CTSD and COL4-7S, the reference value is set between 0.303 and 0.617, for example The value is preferably set between 0.303 and 0.475 from the viewpoint of improving the correct diagnosis rate of Type-4 disease state, and the correct diagnosis rate of Type-1 to Type-3 disease state From the standpoint of improvement, the value is preferably set between 0.408 and 0.536.
- the reference value is a value set, for example, between 0.401 and 0.536, and the viewpoint of improving the correct diagnosis rate of Type-4 disease state Is preferably a value set between 0.401 and 0.45, and preferably between 0.45 and 0.536 from the viewpoint of improving the correct diagnosis rate of the pathological condition of Type-1 to Type-3.
- the reference value is, for example, a value set between 0.303 and 0.538, and preferably from 0.303 to 0.54 in terms of improving the correct diagnosis rate of Type-4 pathology.
- the value is set between 0.421, and is preferably set between 0.421 and 0.538 from the viewpoint of improving the correct diagnosis rate of the pathological conditions of Type-1 to Type-3.
- the reference value is, for example, a value set between 0.328 and 0.617. From the viewpoint of improving the correct diagnosis rate of Type-4 pathology, it is preferably 0. It is a value set between 328 and 0.418, and is preferably set between 0.418 and 0.617 from the viewpoint of improving the correct diagnosis rate of the pathological conditions of Type-1 to Type-3. is there.
- the reference value is a value set between 0.313 and 0.581, for example, and preferably from the viewpoint of improving the correct diagnosis rate of Type-4 pathology. It is a value set between 313 and 0.432, and preferably a value set between 0.432 and 0.581 from the viewpoint of improving the correct diagnosis rate of the pathological conditions of Type-1 to Type-3. is there.
- the marker molecules are VCAM1 and COL4
- the reference value is, for example, a value set between 0.343 and 0.558. From the viewpoint of improving the correct diagnosis rate of Type-4 pathology, it is preferably 0.
- the reference value is, for example, a value set between 0.358 and 0.602, preferably from the viewpoint of improving the correct diagnosis rate of Type-4 pathology It is a value set between 0.358 and 0.438, and is preferably set between 0.438 and 0.602 from the viewpoint of improving the correct diagnosis rate of the pathology of Type-1 to Type-3. Value.
- the reference value is, for example, a value set between 0.354 and 0.562, which is preferable from the viewpoint of improving the correct diagnosis rate of Type-4 pathology. It is a value set between 0.354 and 0.451, and is preferably set between 0.451 and 0.562 from the viewpoint of improving the correct diagnosis rate of the pathology of Type-1 to Type-3. Value.
- the reference value is, for example, a value set between 0.36 and 0.522.
- 0.36 to The value is set between 0.408, and is preferably set between 0.408 and 0.522 from the viewpoint of improving the correct diagnosis rate of the pathological conditions of Type-1 to Type-3.
- the reference value is, for example, a value set between 0.311 and 0.545.
- it is preferably 0. It is a value set between 311 and 0.432.
- it is a value set between 0.432 and 0.545 from the viewpoint of improving the correct diagnosis rate of the pathological conditions of Type-1 to Type-3. is there.
- the reference value is, for example, a value set between 0.317 and 0.544. From the viewpoint of improving the correct diagnosis rate of Type-4 pathology, it is preferably 0. It is a value set between 317 and 0.436, and preferably a value set between 0.436 and 0.544 from the viewpoint of improving the correct diagnosis rate of the pathological conditions of Type-1 to Type-3. is there.
- the reference value is, for example, a value set between 0.364 and 0.604, preferably from the viewpoint of improving the correct diagnosis rate of Type-4 pathology
- the value is set between 0.364 and 0.475, and is preferably set between 0.475 and 0.604 from the viewpoint of improving the correct diagnosis rate of the pathological conditions of Type-1 to Type-3. Value.
- an in vitro diagnostic agent “chemylmihyaluronic acid” based on latex agglutination method or CLIA method is used for HA measurement
- ELISA method Human sVCAM-1 / CD106 Quantikine ELISA Kit”
- VCAM1 measurement VCAM1 measurement
- COL4-7S When the radioimmunoassay method “type IV collagen 7S kit” is used for the measurement, the reference value can be set as follows.
- the marker molecule is VCAM1 and HA
- the reference value is a value set between 0.357 and 0.572, for example, and preferably from the viewpoint of improving the correct diagnosis rate of Type-4 pathology.
- the reference value is, for example, a value set between 0.356 and 0.603, preferably from the viewpoint of improving the correct diagnosis rate of Type-4 pathology It is a value set between 0.356 and 0.426, and is preferably set between 0.426 and 0.603 from the viewpoint of improving the correct diagnosis rate of the pathology of Type-1 to Type-3. Value.
- the reference value is, for example, a value set between 0.331 and 0.563, and is preferable from the viewpoint of improving the correct diagnosis rate of Type-4 pathology. It is a value set between 0.331 and 0.42, and is preferably set between 0.42 and 0.563 from the viewpoint of improving the correct diagnosis rate of the pathology of Type-1 to Type-3. Value.
- the measured value of VCAM1 (the amount of VCAM1) may be used as an index value as it is instead of the normalized score calculated from the above equation 1.
- the reference value concentration in serum (ng / ml)
- the value is, for example, 618.1 to 1239.5 From the viewpoint of improving the correct diagnosis rate of Type-4 pathology, it is preferably set between 618.1 and 840.0, and between Type-1 and Type-3 From the viewpoint of improving the correct diagnosis rate of the disease state, the value is preferably set between 840.0 and 1239.5.
- the condition may be The reference value used at this time can be set as follows when ELISA method “Hyaluronan Quantikine ELISA Kit” is used for HA measurement and HumanMAP method is used for VCAM1 measurement. For example, the following values are mentioned.
- the marker molecule is at least two marker molecules of group 2
- the reference value is a value set between 0.087 and 0.848, for example.
- the marker molecules are all the marker molecules of group 2, VCAM1, VCAM1 and HA, VCAM1 and CTSD, VCAM1 and COL4, VCAM1 and COL4-7S, HA and COL4-7S Is HA and CTSD, HA and COL4, CTSD and COL4, or CTSD and COL4-7S, the reference value is set between 0.353 and 0.766, for example It is a value, and is preferably a value set between 0.353 and 0.574 from the viewpoint of improving the correct diagnosis rate of stage 3 or stage 4 pathology, and improving the correct diagnosis rate of stage 0, stage 1 or stage 2 pathology From this point of view, it is preferably a value set between 0.453 and 0.766.
- the reference value is a value set between 0.421 and 0.632, for example, and the viewpoint of improving the correct diagnosis rate of stage 3 or stage 4 pathology Is preferably a value set between 0.421 and 0.544, and is preferably set between 0.544 and 0.632 from the viewpoint of improving the correct diagnosis rate of the disease state of Stage0, Stage1 or Stage2. Value.
- the reference value is, for example, a value set between 0.371 and 0.587, and preferably 0.371 to 0.57 from the viewpoint of improving the correct diagnosis rate of stage 3 or stage 4 pathology.
- the reference value is, for example, a value set between 0.389 and 0.766. From the viewpoint of improving the correct diagnosis rate of stage 3 or stage 4 pathology, it is preferably 0.
- the value is set between 389 and 0.519, and is preferably set between 0.519 and 0.766 from the viewpoint of improving the correct diagnosis rate of the disease state of Stage0, Stage1 or Stage2.
- the reference value is, for example, a value set between 0.406 and 0.718.
- the reference value is preferably 0.00.
- the value is set between 406 and 0.524, and is preferably set between 0.524 and 0.718 from the viewpoint of improving the correct diagnosis rate of the disease state of Stage0, Stage1, or Stage2.
- the reference value is, for example, a value set between 0.407 and 0.678.
- the reference value is preferably 0.00.
- the value is set between 407 and 0.534, and is preferably set between 0.534 and 0.678 from the viewpoint of improving the correct diagnosis rate of the disease state of Stage0, Stage1 or Stage2.
- the reference value is, for example, a value set between 0.413 and 0.685, preferably from the viewpoint of improving the correct diagnosis rate of the disease state of Stage3 or Stage4 It is a value set between 0.413 and 0.574, and is preferably set between 0.574 and 0.685 from the viewpoint of improving the correct diagnosis rate of the disease state of Stage0, Stage1 or Stage2. is there.
- the reference value is, for example, a value set between 0.398 and 0.7, preferably from the viewpoint of improving the correct diagnosis rate of stage 3 or stage 4 pathology It is a value set between 0.398 and 0.539, and preferably a value set between 0.539 and 0.7 from the viewpoint of improving the correct diagnosis rate of the disease state of Stage0, Stage1 or Stage2. is there.
- the reference value is, for example, a value set between 0.392 and 0.683. From the viewpoint of improving the correct diagnosis rate of stage 3 or stage 4 pathology, it is preferably 0.
- the value is set between 392 and 0.463, and is preferably set between 0.463 and 0.683 from the viewpoint of improving the correct diagnosis rate of the disease state of Stage0, Stage1 or Stage2.
- the reference value is a value set between 0.373 and 0.69, for example, and preferably from the viewpoint of improving the correct diagnosis rate of stage 3 or stage 4 pathology.
- the value is set between 373 and 0.465, and is preferably set between 0.465 and 0.69 from the viewpoint of improving the correct diagnosis rate of the disease state of Stage0, Stage1 or Stage2.
- the reference value is, for example, a value set between 0.353 and 0.635, and is preferably 0.
- the reference value is, for example, a value set between 0.403 and 0.676, preferably from the viewpoint of improving the correct diagnosis rate of stage 3 or stage 4 pathology It is a value set between 0.403 and 0.559, and is preferably set between 0.559 and 0.676 from the viewpoint of improving the correct diagnosis rate of the disease state of Stage0, Stage1 or Stage2. is there.
- an in vitro diagnostic agent “chemylmihyaluronic acid” based on latex agglutination method or CLIA method is used for HA measurement
- ELISA method Human sVCAM-1 / CD106 Quantikine ELISA Kit”
- VCAM1 measurement VCAM1 measurement
- COL4-7S When the radioimmunoassay method “type IV collagen 7S kit” is used for the measurement, the reference value can be set as follows.
- the marker molecule is VCAM1 and HA
- the reference value is, for example, a value set between 0.381 and 0.759. From the viewpoint of improving the correct diagnosis rate of stage 3 or stage 4 pathology, it is preferably 0.
- the value is set between 381 and 0.526, and is preferably set between 0.526 and 0.759 from the viewpoint of improving the correct diagnosis rate of the disease state of Stage0, Stage1, or Stage2.
- the reference value is, for example, a value set between 0.394 and 0.71, preferably from the viewpoint of improving the correct diagnosis rate of the disease state of Stage3 or Stage4 It is a value set between 0.394 and 0.565, and preferably a value set between 0.565 and 0.71 from the viewpoint of improving the correct diagnosis rate of the disease state of Stage0, Stage1 or Stage2. is there.
- the reference value is, for example, a value set between 0.373 and 0.698, preferably from the viewpoint of improving the correct diagnosis rate of stage 3 or stage 4 pathology It is a value set between 0.373 and 0.563, and is preferably set between 0.563 and 0.698 from the viewpoint of improving the correct diagnosis rate of the disease state of Stage0, Stage1 or Stage2. is there.
- the measured value of VCAM1 (the amount of VCAM1) may be used as an index value as it is instead of the normalized score calculated from the above equation 1.
- the reference value (concentration in serum (ng / ml)) is, for example, 789.8 to 1344.2. From the viewpoint of improving the correct diagnosis rate of stage 3 or stage 4 pathology, it is preferably set between 789.8 and 1029.3, and stage 0, stage 1 or stage 2 pathology From the viewpoint of improving the correct diagnosis rate, it is preferably a value set between 1029.3 and 1344.2.
- the determination method according to the present embodiment can also be used as a method for determining the degree of progression of the pathological condition of NAFLD, NAFL, or NASH. It is determined that the greater the index value, the higher the degree of progression of the pathological condition of NAFLD, NAFL, or NASH in the subject. Alternatively, when the index value after application of the therapeutic agent is lower than the index value before adaptation, it may be determined that there may be an effect of applying the therapeutic agent.
- the discriminating method according to the present embodiment can also be used as a method for judging the degree of progress of the disease state of liver disease.
- the degree of progression of the pathological condition of liver disease that has been determined based on pathological findings by liver biopsy can be determined by a noninvasive method.
- liver diseases include NAFLD, alcoholic liver injury, chronic hepatitis, and drug-induced liver injury.
- Progression of liver disease pathology includes progress of liver fibrosis, progress of liver inflammation, progress of balloon-like degeneration of hepatocytes, progress of NAFLD activity, and necrosis of hepatocytes.
- Liver fibrosis is a pathological condition observed in, for example, NAFLD, alcoholic liver disorder, chronic hepatitis, and drug-induced liver disorder.
- Inflammation of the liver is a pathological condition found in, for example, NAFLD, alcoholic liver injury, chronic hepatitis, and drug-induced liver injury.
- Balloon-like degeneration of hepatocytes is a pathological condition seen in, for example, NAFLD, alcoholic liver injury, and chronic hepatitis.
- Hepatocyte necrosis is a pathological condition found in, for example, NAFLD, alcoholic liver injury, chronic hepatitis, and drug-induced liver injury.
- the NAFLD Activity Score (NAS), which is a score for evaluating the activity of NAFLD, will be described.
- the NAFLD Activity Score is determined based on the following table 3 based on the hepatocyte fattening rate, hepatocyte balloon-like degeneration, and pathological findings of lobular inflammation. The higher this score, the higher the severity of the NAFLD pathology.
- the marker molecule measured in the step (1) may contain VCAM1, VCAM1, VCAM1 and HA, VCAM1 and HA, or VCAM1 and COL4 may be included, VCAM1 and COL4 may be included, VCAM1 and COL4-7S may be included, VCAM1 and COL4-7S may be included, and HA and COL4- 7S may be included, HA and COL4-7S may be included, HA and COL4 may be included, and HA and COL4 may be included.
- the normalized score is calculated from Equation 1 based on the amount of the marker molecule. The normalized score can be used as an index value of the degree of progress of the disease state of liver disease.
- the measured value of VCAM1 (the amount of VCAM1) may be used as an index value as it is instead of the normalized score calculated from the above formula 1.
- the therapeutic agents include NAFLD therapeutic agents, particularly NASH therapeutic agents.
- NASH NASH therapeutic agents
- thiazolidine derivatives rosiglitazone, pioglitazone
- HMG-CoA reductase inhibitor atorvastatin
- cholesterol transporter inhibitor ezetimibe
- angiotensin II receptor Antagonists Lisartan, Telmisartan, Valsartan
- Vitamin E etc.
- the application period of a therapeutic agent can be set suitably as needed, you may confirm the effect 12 weeks, 24, 36, 48, 60, 72, 84, 96 weeks after application, for example.
- kits for use in the method according to the present embodiment a reagent for detecting the marker molecule, an instruction for performing the method, A kit is provided.
- a kit for use in the above method according to the present embodiment which includes a reagent for detecting VCAM1, is provided.
- the above-mentioned kit suffers from non-alcoholic steatohepatitis (NASH), is a pathological condition of liver fibrosis, has a high degree of progress of liver fibrosis, and has a high degree of progress of pathological condition of balloon-like degeneration of hepatocytes , Liver inflammation is high, hepatic hypertrophy, hepatocyte necrosis, hepatocyte apoptosis, hepatocyte degeneration, hepatic steatosis It can also be grasped as a diagnostic agent for determining whether or there is such possibility.
- NASH non-alcoholic steatohepatitis
- the reagent for detecting the marker molecule examples include an antibody that specifically recognizes the marker molecule, a protein or nucleic acid that specifically binds to the marker molecule, and a synthetic VCAM1 for use as a standard for mass spectrometry. Can be mentioned.
- the reagent for detecting the marker molecule may be a commercially available one, or may be produced by a known method.
- the instructions for carrying out the method are not particularly limited as long as it is described so that the method according to the present embodiment can be carried out.
- the calculation method of the normalized score or the index value the method There are instructions that describe the standard values used.
- the kit includes, for example, sterilized water, physiological saline, surfactant, buffer, protein stabilizer, preservative, blocking solution, reaction solution, reaction stop solution, and control reagent.
- sterilized water for example, sterilized water, physiological saline, surfactant, buffer, protein stabilizer, preservative, blocking solution, reaction solution, reaction stop solution, and control reagent.
- tissue samples, positive control and negative control biomolecules for example, tissue samples, positive control and negative control biomolecules
- a labeling reagent for example, tissue samples, positive control and negative control biomolecules
- a solid support may be included as necessary.
- FIG. 11 is a schematic diagram illustrating an embodiment of a liver disease determination system.
- the liver disease determination system 100 includes, for example, a measuring apparatus 1 that measures the amount of the marker molecule contained in blood collected from a subject, and a liver that determines the pathological condition of the liver disease based on the measured amount of the marker molecule.
- a disease determination device 11 Details will be described below.
- the measurement apparatus is obtained by a sample placement unit 3 for placing a sample, a light source unit 2 for irradiating the sample with light, a detection unit 4 for detecting light transmitted through the sample, and a detection unit 4.
- a communication unit 5 that electrically transmits the measured data (measurement data of the amount of the marker molecule) to the liver disease determination device 11.
- the sample is prepared from, for example, blood collected from a subject.
- the light source unit 2 includes, for example, a single light source or a plurality of light sources that can irradiate a plurality of wavelengths. That is, a multi-wavelength light source such as a halogen lamp, a combination of a wavelength selection filter and a set of LEDs having different peak wavelengths, and the like.
- a multi-wavelength light source such as a halogen lamp, a combination of a wavelength selection filter and a set of LEDs having different peak wavelengths, and the like.
- the light source unit 2 irradiates the sample set in the sample setting unit 3 with light having a predetermined wavelength, and the wavelength can be appropriately set according to the reagent to be detected (fluorescent dye or the like). 400 nm to 1000 nm.
- the light source unit 2 may be a monochromatic light source or a light source in which a plurality of light sources are combined. Further, when the target to be detected is a light amount of a luminescent dye, radiation emitted from a radioactive isotope, or the like, the light source unit 2 may not be provided.
- the detection unit 4 detects light transmitted through the sample.
- the detection unit 4 may detect the amount of light such as a fluorescent dye or a luminescent dye, or may detect radiation emitted from a radioisotope.
- the communication unit 5 electrically transmits the measurement data obtained by the detection unit 4 to the liver disease determination device 11.
- the light source unit 2, the detection unit 4, and the communication unit 5 are electrically connected to the liver disease determination device 11, and their functions are controlled by the control unit 12 in the liver disease determination device 11. Also good.
- FIG. 11 A part of FIG. 11 can also be grasped as a schematic diagram showing the hardware configuration of the liver disease determination device 11.
- the liver disease determination device 11 includes a control unit 12, a recording unit 13 for recording measurement data transmitted from the communication unit 5 and information necessary for analysis, and a calculation unit 14 for performing calculation analysis of measurement results. And a display unit 15 for displaying the analysis result, and an input unit 16 for inputting information necessary for control.
- Each function of the liver disease determination device 11 to be described later is configured such that predetermined computer software is read on hardware such as the recording unit 13 and the calculation unit 14, thereby allowing the input unit 16 and the display unit 15 to be controlled under the control of the calculation unit 14. This is realized by reading and writing data in the recording unit 13 and the calculation unit 14.
- the control unit 12 is a control device that can control the operation status of the liver disease determination system 100 according to a predetermined procedure.
- the liver disease determination device 11 and the control unit 12 may use one computer having both functions, or functions corresponding to the control unit 12, the recording unit 13, the calculation unit 14, the display unit 15, and the input unit 16. You may use the computer etc. which were equipped with.
- FIG. 12 is a schematic diagram showing a functional configuration of the liver disease determination device 11.
- the liver disease determination apparatus 11 includes an acquisition unit D1, a normalization unit D2, a comparison unit D3, a determination unit D4, and a display unit D5 as functional components.
- the acquisition unit D1 acquires measurement data (measurement data of the amount of the marker molecule) from the measurement device 1.
- the normalization means D2 calculates a standardization score based on the obtained measurement data based on the above-described equation 1, and obtains an index value from the calculated standardization score.
- the comparison unit D3 compares the index value obtained by the normalization unit D2 with a reference value.
- the determination unit D4 determines whether or not the patient has a disease state of liver disease based on the comparison result.
- the display means D5 displays the determined result.
- a program for use in the method according to the present embodiment causes a computer to function as the acquisition unit D1, the normalization unit D2, the comparison unit D3, the determination unit D4, and the display unit D5 described above.
- the program causes a computer to execute an acquisition step S1, a normalization step S2, a comparison step S3, a determination step S4, and a display step S5, which will be described later.
- the computer By causing the computer to read the program, the computer operates as the liver disease determination device 11.
- the program is provided by being stored in a recording medium, for example. Examples of the recording medium include a flexible disk, a recording medium such as a CD and a DVD, a recording medium such as a ROM, or a semiconductor memory.
- FIG. 13 is a flowchart of a liver disease determination method. According to the determination method performed by the liver disease determination device 11, it is possible to quantitatively and automatically determine whether or not the patient has a disease state of liver disease with high accuracy.
- the acquisition unit D1 acquires measurement data from the measurement device 1 (measurement data of the amount of the marker molecule contained in blood collected from the subject).
- the normalization means D2 calculates a normalization score from the measurement data acquired by the acquisition means D1 based on the formula 1, and obtains an index value from the calculated normalization score.
- the measurement data may be input to the liver disease determination device 11 in advance instead of being acquired by the acquisition unit D1.
- the normalized score may be used as an index value as it is.
- the comparison unit D3 compares the index value obtained by the normalization unit D2 with a reference value.
- the comparison step S3 may be performed using the measurement data acquired by the acquisition unit D1 as an index value without performing the normalization step S2.
- the determination unit D4 determines whether or not the patient has a disease state of liver disease based on the comparison result. For example, when the index value is larger than the reference value, the subject is suffering from non-alcoholic steatohepatitis (NASH), which is a pathological condition of liver fibrosis, the degree of progression of liver fibrosis, hepatocytes Deterioration of hepatocytes, which is a pathological condition of balloon-like degeneration, or a pathological condition of liver hypertrophy, a pathological condition of hepatocyte necrosis, a pathological condition of hepatocyte apoptosis, which has a high degree of progression of liver inflammation It is determined that the condition is, or is possibly a condition of liver fattening.
- NASH non-alcoholic steatohepatitis
- the display means D5 displays the result determined in determination step S4. For example, whether or not the subject has a pathological condition of liver disease is displayed by the display means D5.
- the determination method according to the present embodiment is non-invasive and can determine the pathological condition of a liver disease such as a non-alcoholic fatty liver disease with higher accuracy than the conventional method.
- determination method can be used also as a method of collecting the data for diagnosis of liver diseases, such as non-alcoholic fatty liver disease.
- the index value is obtained using the standardized score calculated from Equation 1, but the index value may be obtained using a statistical value other than the standardized score.
- the statistical value include a maximum value, a minimum value, a mode value, an average value, a median value, and a percentile value.
- One type of statistical value used when obtaining the index value may be used alone, or a plurality of statistical values may be used in combination.
- the measurement values may be standardized in order to correct differences in measurement value units, scales, concentrations, amounts, etc., in each marker molecule. Further, the distribution of measured values may be converted into a distribution suitable for discrimination using a sigmoid function.
- Test Example 1 Method for discriminating between NAFL and NASH (1)
- biomolecules marker molecules shown in Table 4 below in blood were measured for 132 patients who were previously classified into NASH patients and NAFL patients according to materialion classification.
- ALB, ALT, AST, COL4-7S and INS IVD were measured using in-vitro diagnostic drugs approved in Japan.
- ALB was measured by the improved BCP method, which is one of the dye binding methods.
- ALT and AST were measured by an enzyme activity measurement method.
- COL4-7S was measured by the RIA method.
- INS IVD was measured by the CLIA method.
- CK-18 was measured by a commercially available evaluation kit (M30 Apoptosense (registered trademark) ELISA).
- HA was measured by a commercially available evaluation kit (Hyaluronan Quantikine ELISA Kit).
- Mac-2bp was measured by a commercially available evaluation kit (Human Mac-2 binding protein (Mac-2bp) Assay Kit-IBL).
- Spectramax M5 manufactured by Molecular Devices
- P3NP was measured using a commercially available evaluation kit (ELISA Kit for Procollagen III N-Terminal Propeptide (PIIINP)).
- Other biomolecules were measured using a multiple immunoassay service Human DiscoveryMAP (registered trademark) 250+ (v. 2.0) provided by Myriad RBM.
- Equation 2 M a1 (first normalized score) in Equation 2
- M a2 second normalized score
- a 1 and a 2 it was used the following values.
- FIG. 1 shows a graph in which the obtained normalized score or index value is classified and plotted into a NAFL patient group and a NASH patient group.
- a solid line indicates both ends of “reference value range A” in Table 10
- a broken line indicates both ends of “reference value range B” in Table 10.
- a significant difference was found between the NAFL patient group and the NASH patient group, which proved effective in discriminating between NAFL and NASH. It was also found effective to set the reference value (cut-off value) for determining whether or not NASH is within the range shown in Table 10 below.
- AUROC is a value calculated using the sample group of this example.
- the index values based on the above-described decision trees were also obtained as follows.
- I 2 if M1 a ⁇ 0.476
- I 1 if M1 a ⁇ 0.476 and M2 a ⁇ 0.466
- I 0 if M1 a ⁇ 0.476 and M2 a ⁇ 0.466.
- Decision tree 6 In decision trees 1 to 6, I indicates an index value, and M1 a, M2 a, M3 a, and M4 a indicate the normalized scores of group 1, group 2, group 3, and group 4, respectively.) . In any of the index values, a significant difference was observed between the NAFL patient group and the NASH patient group, and it was found that the index values were effective in distinguishing between NAFL and NASH.
- a preferable index value is a value calculated from the following equation 3.
- I indicates an index value
- M a1 and M a2 are the normalized score of one of the two groups and the normalized score of the other (“first normalized score” and “second The normalized score of “)”.
- I (M a1 + M a2 ) / 2 (Formula 3)
- the values shown in Table 12 below were used for M a1 (first normalized score) and M a2 (second normalized score) in Equation 3.
- NAFIC score AUROC is a value calculated using the sample group of this example.
- a preferable index value is a value calculated from the following equation 4.
- I indicates an index value
- M a1 and M a2 are the normalized score of one of the two groups and the normalized score of the other (“first normalized score” and “second B 1 and b 2 are constants determined by linear regression analysis.
- I b 1 ⁇ M a1 + b 2 ⁇ M a2 (Formula 4)
- the values shown in Table 14 below were used for M a1 (first normalized score), M a2 (second normalized score), b 1 and b 2 in Equation 4.
- NAFIC score AUROC is a value calculated using the sample group of this example.
- a preferable index value is a value calculated from the following formula 5.
- I represents an index value
- M a1 and M a2 are the normalized score of one of the two groups and the normalized score of the other (“first normalized score” and “second C 1 and C 2 are constants determined by linear discriminant analysis.
- I c 1 ⁇ M a1 + c 2 ⁇ M a2 (Formula 5)
- the values shown in Table 16 below were used for M a1 (first normalized score), M a2 (second normalized score), c 1, and c 2 in Equation 5.
- NAFIC score AUROC is a value calculated using the sample group of this example.
- a preferable index value is a value calculated from the following equation (6).
- I indicates an index value
- M a1 and M a2 are the normalized score of one of the two groups and the normalized score of the other (“first normalized score” and “second The normalized score of “)”.
- the values shown in Table 18 below were used for M a1 (first normalized score) and M a2 (second normalized score) in Equation 6.
- a significant difference was found between the NAFL patient group and the NASH patient group, which proved effective in discriminating between NAFL and NASH.
- a preferable index value is a value calculated from the following formula 7.
- I indicates an index value
- M a1 and M a2 are the normalized score of one of the two groups and the normalized score of the other (“first normalized score” and “second D 1, d 2, and d 3 are constants determined by nonlinear regression analysis.
- AUROC is a value calculated using the sample group of this example.
- the index values based on the above-described neural network were obtained as follows.
- a value calculated from the following formulas 8 and 9 is used.
- a 1 , B 1 , X 1 and X 2 each represent a constant determined by the neural network.
- I represents an index value
- a 2 , B 2, and X 2 represent constants determined by the neural network.
- X 2 f (A 1 ⁇ X 1 + B 1 ) (Formula 8)
- I f (A 2 ⁇ X 2 + B 2 ) (Formula 9)
- ⁇ Represents the inner product of the matrix
- X 1 is a 2 ⁇ 1 matrix
- a 1 is a 2 ⁇ 2 matrix
- B 1 is a 2 ⁇ 1 matrix
- X 2 is a 2 ⁇ 1 matrix. It is a matrix
- a 2 is a 1 ⁇ 2 matrix
- B 2 is a real number.
- Table 22 The values shown in Table 22 below were used for A 1 , B 1 , X 1, A 2 and B 2 .
- M a1 and M a2 in Table 22 represent the normalized score of one of the two groups and the normalized score of the other (“first normalized score” and “second normalized score”), respectively. Show.
- the values shown in Table 23 below were used for M a1 and M a2 . In any standardized score and index value, a significant difference was found between the NAFL patient group and the NASH patient group, which proved effective in discriminating between NAFL and NASH. Further, it has been found that it is effective to set the reference value (cut-off value) for determining whether or not it is NASH to the value shown in Table 24 below.
- AUROC is a value calculated using the sample group of this example.
- a preferable index value is a value calculated from the following formula 10.
- I indicates an index value
- N ⁇
- ⁇ and ⁇ denote constants determined by the support vector machine.
- ⁇ Represents an inner product of the matrices, ⁇ is a 2 ⁇ 1 matrix, ⁇ T is a transposed matrix of ⁇ , ⁇ is a 1 ⁇ N matrix, and ⁇ i is the real number of the i-th column of ⁇ .
- ⁇ is a 2 ⁇ N matrix
- ⁇ i is a 2 ⁇ 1 matrix of the i-th column of ⁇
- M a1 and M a2 in Table 25 are the normalized score of one of the two groups and the normalized score of the other (“first normalized score” and “second normalized score”), respectively. Show.
- the values shown in Table 26 below were used for M a1 and M a2 . In any standardized score and index value, a significant difference was found between the NAFL patient group and the NASH patient group, which proved effective in discriminating between NAFL and NASH.
- required from these results was compared with AUROC (0.834) of the NAFIC score which is a prior art, it was suggested that it is the diagnostic accuracy equivalent to or higher than the prior art.
- the NAFIC score AUROC is a value calculated using the sample group of this example.
- the index values based on the above-described nonlinear logistic regression equation were also obtained as follows.
- a value calculated from the following equation 11 is used.
- I indicates an index value
- M a1 and M a2 are the normalized score of one of the two groups and the normalized score of the other (“first normalized score” and “second E 1, e 2, and e 3 are constants determined by nonlinear regression analysis.
- AUROC is a value calculated using the sample group of this example.
- Test Example 2 Method for discriminating between NAFL and NASH (2) Measurement method 1 Normalization scores were determined in the same manner as in Test Example 1 except that the biomolecules used in determining the normalized score were 1 to 3 types of biomolecules shown in Table 30 below.
- the normalized score of the module 1 (M1) and the normalized score of the module 3 (M3) are respectively referred to as “first normalized score” and “second normalized score”, and M1 and M3 shown in Table 30 above.
- the index value was determined based on the above formula 2, and in any normalized score and index value, there was a significant difference between the NAFL patient group and the NASH patient group, It was found to be effective for discrimination between NAFL and NASH. Further, it has been found that it is effective to set the reference value (cutoff value) for determining whether or not it is NASH to a value shown in Table 31 below.
- AUROC is a value calculated using the sample group of this example.
- the normalized score of the module 1 (M1) and the normalized score of the module 3 (M3) are respectively referred to as “first normalized score” and “second normalized score”, and M1 and M3 shown in Table 12 above.
- the index values based on the decision tree 2 were also obtained for all combinations of the above, and in any normalized score and index value, there was a significant difference between the NAFL patient group and the NASH patient group, It was found to be effective in distinguishing between NAFL and NASH. Further, it has been found that it is effective to set the reference value (cutoff value) for determining whether or not it is NASH to a value shown in Table 32 below.
- AUROC is a value calculated using the sample group of this example.
- the normalized score of the module 1 (M1) and the normalized score of the module 3 (M3) are respectively referred to as “first normalized score” and “second normalized score”, and M1 and M3 shown in Table 12 above.
- the index values based on the above formula 3 were also obtained for all combinations of the above. As a result, a significant difference was observed between the NAFL patient group and the NASH patient group in any normalized score and index value. And NASH were found to be effective. Further, it has been found that it is effective to set the reference value (cutoff value) for determining whether or not NASH is the value shown in Table 33 below.
- AUROC is a value calculated using the sample group of this example.
- the normalized score of the module 1 (M1) and the normalized score of the module 3 (M3) are respectively referred to as “first normalized score” and “second normalized score”, and M1 and M3 shown in Table 12 above.
- the index values based on the above equation 4 were also obtained for all combinations of the above, and as a result, a significant difference was observed between the NAFL patient group and the NASH patient group in any normalized score and index value. And NASH were found to be effective. Further, it has been found that it is effective to set the reference value (cutoff value) for determining whether or not NASH is the value shown in Table 34 below.
- AUROC is a value calculated using the sample group of this example.
- the normalized score of the module 1 (M1) and the normalized score of the module 3 (M3) are respectively referred to as “first normalized score” and “second normalized score”, and M1 and M3 shown in Table 12 above.
- the index values based on the above formula 5 were also obtained for all combinations of the above. As a result, a significant difference was observed between the NAFL patient group and the NASH patient group in any normalized score and index value. And NASH were found to be effective. Further, it has been found that it is effective to set the reference value (cutoff value) for determining whether or not it is NASH to the value shown in Table 35 below.
- AUROC is a value calculated using the sample group of this example.
- the normalized score of the module 1 (M1) and the normalized score of the module 3 (M3) are respectively referred to as “first normalized score” and “second normalized score”, and M1 and M3 shown in Table 12 above.
- the index values based on the above formula 6 were also obtained for all combinations of the above. As a result, there was a significant difference between the NAFL patient group and the NASH patient group in any normalized score and index value. And NASH were found to be effective. Further, it has been found that it is effective to set the reference value (cutoff value) for determining whether or not it is NASH to a value shown in Table 36 below.
- AUROC is a value calculated using the sample group of this example.
- the normalized score of the module 1 (M1) and the normalized score of the module 3 (M3) are respectively referred to as “first normalized score” and “second normalized score”, and M1 and M3 shown in Table 12 above.
- the index values based on the above formula 7 were also obtained for all combinations of the above. As a result, a significant difference was observed between the NAFL patient group and the NASH patient group in any normalized score and index value. And NASH were found to be effective. Further, it has been found that it is effective to set the reference value (cutoff value) for determining whether or not NASH is the value shown in Table 37 below.
- AUROC is a value calculated using the sample group of this example.
- the normalized score of the module 1 (M1) and the normalized score of the module 3 (M3) are respectively referred to as “first normalized score” and “second normalized score”, and M1 and M3 shown in Table 12 above.
- the index values based on the above formulas 8 and 9 were also obtained for all combinations of the above. As a result, there was a significant difference between the NAFL patient group and the NASH patient group in any normalized score and index value. It was found that it was effective in distinguishing between NAFL and NASH. Further, it has been found that it is effective to set the reference value (cut-off value) for determining whether or not NASH is the value shown in Table 38 below.
- AUROC is a value calculated using the sample group of this example.
- the normalized score of the module 1 (M1) and the normalized score of the module 3 (M3) are respectively referred to as “first normalized score” and “second normalized score”, and M1 and M3 shown in Table 12 above.
- the index values based on the above formula 10 were also obtained for all combinations of the above. As a result, a significant difference was observed between the NAFL patient group and the NASH patient group at any normalized score and index value. And NASH were found to be effective. Further, it was found that it is effective to set the reference value (cutoff value) for determining whether or not it is NASH to a value shown in Table 39 below.
- AUROC is a value calculated using the sample group of this example.
- the normalized score of the module 1 (M1) and the normalized score of the module 3 (M3) are respectively referred to as “first normalized score” and “second normalized score”, and M1 and M3 shown in Table 12 above.
- the index values based on the above equation 11 were also obtained for all combinations of the above. As a result, a significant difference was observed between the NAFL patient group and the NASH patient group in any normalized score and index value. And NASH were found to be effective. Further, it was found effective to set the reference value (cut-off value) for determining whether or not NASH is the value shown in Table 40 below.
- AUROC is a value calculated using the sample group of this example.
- Measurement method 2 The amount of each of HA, VCAM1 and COL4-7S was measured by the method shown below to obtain a normalized score.
- the amount of HA was measured by a latex agglutination method using an in-vitro diagnostic agent “El Pier Ace HA” (manufactured by LSI Rulece).
- the amount of VCAM1 was measured by ELISA using “Human sVCAM-1 / CD106 Quantikine ELISA Kit” (manufactured by R & D Systems).
- the amount of COL4-7S was measured by a radioimmunoassay method using an in-vitro diagnostic agent “type IV collagen 7S kit” (manufactured by LSI Rulece).
- the respective normalized scores were obtained based on the above Equation 1.
- Table 41 shown below was used for mean (m i ), sd (m i ), mean (m i NASH ), and mean (m i NAFL ) in Formula 1.
- the value described in Table 41 is a value used even when a measurement method having the same performance as the method using the diagnostic agent or reagent is used.
- HA serum samples obtained from 44 NAFL patients and 95 NASH patients were measured.
- VCAM1 serum samples obtained from 68 NAFL affected persons and 127 NASH affected persons were measured.
- COL4-7S serum samples from 62 NAFL affected persons and 130 NASH affected persons were measured.
- the simple average of the average value and the average value of NASH sufferers NAFL affected individual and mean (m i), a simple average of the standard deviation of the standard deviation and NASH sufferers NAFL sufferer sd (m i ).
- m i a simple average of the standard deviation of the standard deviation and NASH sufferers NAFL sufferer sd
- latex (me i (m i ), sd (m i )) is latex.
- y has a value of mean (m i) or sd (m i) in the case of using the "Chemi Lumi hyaluronic acid", mean (m i) where x is the use of "Erupiaesu HA" or sd (m i ) Value.
- Fig. 2-1, Fig. 2-2, and Fig. 3 are graphs obtained by classifying and plotting the obtained normalized scores into NAFL patient groups and NASH patient groups.
- solid lines indicate both ends of “reference value range A” in Tables 42 and 43
- broken lines indicate both ends of “reference value range B” in Tables 42 and 43.
- any normalized score a significant difference was found between the NAFL patient group and the NASH patient group, which proved effective in discriminating between NAFL and NASH. Further, it has been found that it is effective to set the reference value (cutoff value) for determining whether or not it is NASH within the ranges shown in Tables 42 and 43 below.
- AUROC is a value calculated using the sample group of this example.
- Test Example 3 Method for discriminating between NAFL and NASH (3) As the first standardized score, the standardized score corresponding to M1 (PROS1, CLU) of Test Example 2 is used, and as the second standardized score, M3 (AST, PSAT), M3 (AST, LEP of Test Example 2 is used. ), M3 (AST, ICAM1,), M3 (AST, PSAT, ICAM1), M3 (AST, PSAT, ICAM1), M3 (AST, LEP, CK-18), M3 (AST, ICAM1, GSTA1) or M3 (AST) , PSAT, 6Ckine), the index value was determined by the same calculation method as “M1 + M3” in Test Example 1 except that the normalized score corresponding to “CSAT” was used.
- FIG. 4 shows a graph in which the obtained index values are classified and plotted into a NAFL patient group and a NASH patient group.
- the solid line indicates both ends of “reference value range A” in Table 43
- the broken line indicates both ends of “reference value range B” in Table 44.
- the index values were effective in distinguishing between NAFL and NASH. It was also found that it is effective to set the reference value (cutoff value) for determining whether or not NASH is in the range shown in the table below.
- AUROC is a value calculated using the sample group of this example.
- Test Example 4 Method for discriminating between Type-1 to Type-3 pathology and Type-4 pathology in the Mateoni classification
- the biomolecules shown in Table 45 below were used as the biomolecules used in obtaining the normalized score. Except for this, the normalized score was determined by the same method as in Measurement Method 1 or Measurement Method 2 in Test Example 2 above.
- FIG. 4 is a graph in which the normalized scores obtained are classified and plotted into a patient group (Type 1-3) corresponding to a pathology of Type-1 to Type-3 and a patient group corresponding to a pathology of Type-4 in the Mateoni classification It is shown in 5-1 and FIG. 5-2.
- solid lines indicate both ends of “reference value range A” in Table 46
- broken lines indicate both ends of “reference value range B” in Table 46.
- any normalized score there is a significant difference between the type 1-3 patient group and the type-4 patient group, and discrimination between the type-1 to type-3 pathology and the type-4 pathology It was found to be effective.
- Test Example 5 Method for discriminating between Stage 0 to Stage 2 pathology and Stage 3 or Stage 4 pathology in fibrosis Stage Normalized scores were determined using the same biomolecules and methods as in Test Example 4. The obtained normalized scores were classified into a patient group (F0-2) corresponding to the disease state of Stage 0 to Stage 2 and a patient group (F3-4) corresponding to the disease state of Stage 3 or Stage 4 in the stage of fibrosis and plotted. The graphs are shown in FIGS. 6-1 and 6-2. In the figure, solid lines indicate both ends of “reference value range A” in Table 47, and broken lines indicate both ends of “reference value range B” in Table 47.
- the disease state of Stage0 means the disease state of Type-1 or Type-2 in the Mateoni classification.
- Test Example 6 Method for Determining Progression of Liver Fibrosis Group 2 Biomolecules “VCAM1”, “VCAM1, HA”, “VCAM1, COL4”, “VCAM1, COL4-7S” and “HA, COL4- It was examined whether the degree of progression of liver fibrosis could be determined based on the respective normalized scores of “7S” and the measured value (blood concentration) of VCAM1.
- the fibrosis stage (0-4 points), a fibrosis stage based on liver biopsy, was used as an indicator of liver pathology (Kleiner et. Al., Design and validation of a histological scoring system for nonalcoholic fatty liver disease, Hepatology 41: 1313-21 (2005)).
- the normalized score was determined using the same method as in Test Example 1.
- the measured value of VCAM1 was quantified by a reagent “Human sVCAM-1 / CD106 Quantikine ELISA Kit” based on ELISA.
- FIB4 index (Hepatology. 2006 Jun; 43 (6): 1317-25.)
- Known as an index for evaluating liver fibrosis was determined from the subject's age, AST, ALT, and platelet count.
- the relationship between the fibrosis stage, the normalized score, the measured value of VCAM1, and the FIB4 index was examined.
- About the measured value of VCAM1 the value of the healthy person measured separately was also examined. The results are shown in FIG. In FIG.
- the horizontal axis indicates the fibrosis stage
- the vertical axis indicates the normalized score
- the horizontal line indicates the median value of each group. It was recognized that the normalized score and the measured value of VCAM1 increase as the fibrosis stage score increases. VCAM1 tended to show a smaller value in healthy subjects than in NAFLD patients.
- AUROC (Stage 0 vs. Stage 1-4) when discriminating between samples with a fibrosis stage of 0 and 1 or more, discriminating between samples with a fibrosis stage of 1 or less and samples with 2 or more AUROC (Stage 0-1 vs. Stage 2-4) when performed, and AUROC (Stage 0-2 vs. Stage 3) when discriminating between specimens with two or less fibrosis stages and three or more specimens -4) and compared the accuracy of each index value.
- the results are shown in Table 48.
- Test Example 7 Method for Determining Progression of Liver Inflammation Group 2 biomolecules “VCAM1,” “VCAM1, HA,” “VCAM1, COL4,” “VCAM1, COL4-7S,” and “HA, COL4” Based on the respective normalized scores of “ ⁇ 7S” and the measured value (blood concentration) of VCAM1, it was examined whether or not it was possible to evaluate the progress of inflammation of the liver.
- As an index of liver inflammation we used the pathological diagnosis score (0-3 points) of intralobular inflammation based on liver biopsy (Kleiner et. Al., Design and validation of a histological scoring system for nonalcoholic fatty liver disease, Hepatology 41: 1313-21 (2005)). The normalized score was determined using the same method as in Test Example 1.
- the measured value of VCAM1 was quantified by a reagent “Human sVCAM-1 / CD106 Quantikine ELISA Kit” based on ELISA.
- high-sensitivity CRP Hepatogastroenterology. 2014 Mar-Apr; 61 (130): 422-5
- the relationship between the score of inflammation in the leaflet of the liver, the normalized score, the measured value of VCAM1, and the high sensitivity CRP was examined.
- the measured value of VCAM1 the value of the healthy person measured separately was also examined. The results are shown in FIG. In FIG.
- the horizontal axis indicates the score of inflammation in the lobule of the liver
- the vertical axis indicates the normalized score
- the measured value of VCAM1 or the measured value of high sensitivity CRP indicates the horizontal line. It was observed that the normalized score and the measured value of VCAM1 increased as the liver lobule inflammation score increased. VCAM1 tended to show a smaller value in healthy subjects than in NAFLD patients.
- AUROC Inflammation 0 vs. Inflammation 1-3
- AUROC Inflammation 0-1 vs. Inflammation 2-3
- Table 49 With regard to the normalized scores of “VCAM1, HA”, “VCAM1, COL4-7S” and “HA, COL4-7S”, it is possible to discriminate between a sample having a score of 0 and a sample having a score of 1 or more.
- AUROC exceeded high-sensitivity CRP in both discriminating between samples of 1 or less and samples of 2 or more.
- AUROC exceeded the high sensitivity CRP in discriminating between a sample with a score of 1 point or less and a sample with a score of 2 points or more . From the above, it was suggested that the normalized score and the measured value of VCAM1 are useful for determining the degree of progression of liver inflammation.
- Test Example 8 Method for Determining the Progression of Balloon-Like Degeneration in Hepatocytes Group 2 biomolecules “VCAM1,” “VCAM1, HA,” “VCAM1, COL4,” “VCAM1, COL4-7S,” and “ Based on the normalized scores of “HA, COL4-7S” and the measured value (blood concentration) of VCAM1, it was examined whether it was possible to determine the progress of balloon-like degeneration of hepatocytes. As an indicator of balloon-like degeneration of hepatocytes, the pathological diagnosis score (0-2 points) of balloon-like degeneration based on liver biopsy was used (Kleiner et.
- VCAM1 was quantified by a reagent “Human sVCAM-1 / CD106 Quantikine ELISA Kit” based on ELISA. Further, CK18 M30 fragment (J Clin Gastroenterol. 2010 Jul; 44 (6): 440-7), which is known as an index for evaluating balloon-like degeneration of hepatocytes, was determined by ELISA “M30 Apoptosense ELISA”.
- AUROC balloon-like degeneration 0 vs. balloon-like degeneration 1-2
- a balloon-like degeneration score of 1 when the discrimination between a hepatocyte-balloon-like degeneration score of 0 and one or more samples was made
- AUROC balloon-like denaturation 0-1 vs. balloon-like denaturation 2
- Test Example 9 Method for Determining Nonalcoholic Fatty Liver Disease (NAFLD) Activity Group 2 biomolecules “VCAM1”, “VCAM1, HA”, “VCAM1, COL4”, “VCAM1, COL4-7S”, And “HA, COL4-7S”, and whether or not the activity of NAFLD can be evaluated based on the measured value (blood concentration) of VCAM1.
- NAFLD activity As an index of NAFLD activity, the pathological diagnosis score (0-8 points) of NAFLD activity based on liver biopsy was used (Kleiner et. Al., Design and validation of a histological scoring system for nonalcoholic fatty liver disease). , Hepatology 41: 1313-21 (2005)). The normalized score was determined using the same method as in Test Example 1.
- the measured value of VCAM1 was quantified by a reagent “Human sVCAM-1 / CD106 Quantikine ELISA Kit” based on ELISA. Further, CK18 M30 fragment (J Clin Gastroenterol. 2010 Jul; 44 (6): 440-7), which is known as an index for evaluating NAFLD activity, was determined by ELISA “M30 Apoptosense ELISA”. For 132 sera collected from a person whose pathological diagnosis score was recorded, the relationship between the NAFLD activity score, the normalized score, the measured value of VCAM1, and the CK18 M30 fragment was examined. About the measured value of VCAM1 and CK18 M30 fragment, the value of the healthy person measured separately was also examined. The results are shown in FIG. In FIG.
- the horizontal axis indicates the NAFLD activity score
- the vertical axis indicates the normalized score
- the measured value of VCAM1 or the measured value of CK18 M30 fragment indicates the horizontal line indicates the median value of each group. It was observed that the normalized score of group 2 containing VCAM1 and the measured value of VCAM1 increased as the NAFLD activity score increased. VCAM1 tended to show a smaller value in healthy subjects than in NAFLD patients.
- AUROC (NAS1 vs. NAS 2-8) when a sample with NAFLD activity score of 1 point and 2 or more samples was identified, samples with NAFLD activity score of 2 points or less and 3 points AUROC (NAS1-2 vs NAS 3-8) when discriminating from the above specimens, AUROC when discriminating between specimens with NAFLD activity score of 3 or less and specimens of 4 or more (NAS1-3 vs. NAS 4-8), AUROC (NAS1-4 vs. NAS 5-8) when the NAFLD activity score is discriminated from 4 or less samples and 5 or more samples, and AUROC (NAS1-5 vs.
- the activity score of AUROC and NAFLD when a NAFLD activity score of 2 points or less and a sample of 3 points or more are determined.
- AUROC and NAFLD activity score when discriminating between 3 or less samples and 4 or more samples and AUROC and NAFLD when scoring 4 or less samples and 5 or more samples The AUROC exceeded the CK18 M30 fragment when a sample with an activity score of 5 or less was distinguished from a sample with 6 or more. From the above, it was suggested that the normalized score and the measured value of VCAM1 are useful for determining NAFLD activity.
- Test Example 10 Method for Determining Progression of Liver Fibrosis, Progression of Liver Inflammation, Progression of Balloon-like Degeneration of Hepatocytes, and NAFLD Activity Based on Normalized Score of “HA, COL4” Group 2
- FIG. 14 shows the relationship between the normalized score of “HA, COL4” and the degree of progression of liver fibrosis.
- the horizontal axis represents the fibrosis stage
- the vertical axis represents the normalized score
- the horizontal line represents the median value of each group.
- the normalized score was found to increase as the fibrosis stage score increased.
- the results for the determination of the degree of progression of liver fibrosis are shown in Table 52.
- AUROC exceeded AUROC of FIB4 index under the same conditions. From the above, it was suggested that the normalized score of “HA, COL4-7S” is useful for determining the progress of liver fibrosis.
- FIG. 15 shows the relationship between the normalized score of “HA, COL4” and the degree of progression of liver inflammation.
- the horizontal axis indicates the score of inflammation in the lobule of the liver
- the vertical axis indicates the normalized score
- the horizontal line indicates the median value of each group.
- the normalized score was found to increase as the score of inflammation in the lobule of the liver increased.
- Table 53 shows the results of determination of the degree of progression of liver inflammation. In discriminating between specimens with a score of 1 or less in liver lobule inflammation and specimens with 2 or more scores, the AUROC of the normalized score exceeded the AUROC of high-sensitivity CRP under the same conditions. From the above, it was suggested that the normalized score of “HA, COL4” is useful for determining the degree of progression of liver inflammation.
- FIG. 16 shows the relationship between the normalized score of “HA, COL4” and balloon-like degeneration of hepatocytes.
- the horizontal axis indicates the score of balloon-like degeneration of hepatocytes
- the vertical axis indicates the normalized score
- the horizontal line indicates the median value of each group.
- the normalized score was found to increase as the score of balloon-like degeneration of hepatocytes increased.
- Table 54 shows the results of the determination of the degree of progression of hepatocyte balloon-like degeneration. In all determinations, the AUROC of the above normalized score exceeded the AUROC of the CK18 M30 fragment under the same conditions. From the above, it was suggested that the normalized score of “HA, COL4” is useful for determining the progress of balloon-like degeneration of hepatocytes.
- FIG. 17 shows the relationship between the normalized score of “HA, COL4” and NAFLD activity.
- the horizontal axis indicates NAFLD activity score
- the vertical axis indicates a normalized score
- the horizontal line indicates the median value of each group. It was observed that the normalized score and the NAFLD activity score increased as the score increased.
- the results for the determination of NAFLD activity are shown in Table 55. Discriminate between samples with NAFLD activity score of 4 or less and samples with NAFLD activity score of 5 or more, and between samples with NAFLD activity score of 5 or less and samples with 6 or more
- the AUROC of the above normalized score exceeded the AUROC of the CK18 M30 fragment under the same conditions. From the above, it was suggested that the normalized score of “HA, COL4” is useful for determining the activity of NAFLD.
Landscapes
- Life Sciences & Earth Sciences (AREA)
- Health & Medical Sciences (AREA)
- Engineering & Computer Science (AREA)
- Chemical & Material Sciences (AREA)
- Biomedical Technology (AREA)
- Molecular Biology (AREA)
- Immunology (AREA)
- Hematology (AREA)
- Urology & Nephrology (AREA)
- Physics & Mathematics (AREA)
- General Physics & Mathematics (AREA)
- Analytical Chemistry (AREA)
- Biochemistry (AREA)
- General Health & Medical Sciences (AREA)
- Pathology (AREA)
- Medicinal Chemistry (AREA)
- Food Science & Technology (AREA)
- Cell Biology (AREA)
- Biotechnology (AREA)
- Microbiology (AREA)
- Proteomics, Peptides & Aminoacids (AREA)
- Biophysics (AREA)
- Endocrinology (AREA)
- Ecology (AREA)
- Mathematical Physics (AREA)
- Theoretical Computer Science (AREA)
- Spectroscopy & Molecular Physics (AREA)
- Investigating Or Analysing Biological Materials (AREA)
Abstract
Description
また、NASHの病徴の一つである肝線維化は、NASHの予後に大きな影響を及ぼす(J Hepatol. 2005 Jan;42(1):132-8)ことから、NASHの診断及び治療において肝線維化を判別することが重要である。現在、肝線維化の有無の判別又はその進展度の評価においても、確定診断には肝生検が必要とされている。このような事情から、肝生検に拠らずに、肝線維化が生じているNASHを判別する方法及びその進展度を評価する手法もまた開発が待たれている。
(1)被験者から採取された血液に含まれる、マーカー分子の量を測定する工程であって、測定する上記マーカー分子が、
(A)下記群1、下記群2、下記群3又は下記群4のいずれか1つの群中の少なくとも1種のマーカー分子であるか、
PROS1、CLU、ANG、APOC3、APOD、CFHR1、コルチゾール、EGFR、HPN、IGFBP3、IL1B、IL23A、MET、MMP10、テトラネクチン、TTR、VDBP及びVEGFR-2からなる群1、
VCAM1、HA、CTSD、COL4、COL4-7S、ALB、AFP、AXL、CCL19、CGB、CSF1、FAS、Mac-2bp、CA19-9、NRCAM、OPG、VWF及びYKL-40からなる群2、
AST、PSAT、LEP、ICAM1、CK-18、GSTA1、ALT、INSIVD、INSMAP、6Ckine、AGT、CRP、CXCL10、FABP4、G6PI、HSP-60、P3NP及びテストステロンからなる群3、
AREG、BDNF、CD40-L、EREG、FGF2、HBEGF、IGFBP2、MMP9、PAI-1、PDGFB、PLGF、SAP、TGFA、TGFB1、THBS1及びVTNからなる群4、
又は、
(B)上記群1、上記群2、上記群3及び上記群4から選ばれる2つの群のうちの、一方から選択される少なくとも1つのマーカー分子及び他方から選択される少なくとも1つのマーカー分子、
である、工程と、
(2)同一の群の上記マーカー分子の量に基づいて算出される規格化スコアから指標値を求める工程、及び
(3)上記指標値を、基準値と比較することにより、被験者が非アルコール性脂肪肝炎(NASH)を罹患している可能性がある、又は、被験者が肝線維化の病態である可能性がある、と判定する工程を含む方法を提供するものである。
具体的には、本発明は以下に関する。
[1]非アルコール性脂肪肝(NAFL)と非アルコール性脂肪肝炎(NASH)とを判別する方法であって、
(1)被験者から採取された血液に含まれる、マーカー分子の量を測定する工程であって、測定する上記マーカー分子が、
(A)PROS1、CLU、ANG、APOC3、APOD、CFHR1、コルチゾール、EGFR、HPN、IGFBP3、IL1B、IL23A、MET、MMP10、テトラネクチン、TTR、VDBP及びVEGFR-2からなる群1から選ばれる少なくとも2つのマーカー分子、
VCAM1、HA、CTSD、COL4、COL4-7S、ALB、AFP、AXL、CCL19、CGB、CSF1、FAS、Mac-2bp、CA19-9、NRCAM、OPG、VWF及びYKL-40からなる群2から選ばれる少なくとも2つのマーカー分子、
AST、PSAT、LEP、ICAM1、CK-18、GSTA1、ALT、INSIVD、INSMAP、6Ckine、AGT、CRP、CXCL10、FABP4、G6PI、HSP-60、P3NP及びテストステロンからなる群3から選ばれる少なくとも2つのマーカー分子、若しくは、
AREG、BDNF、CD40-L、EREG、FGF2、HBEGF、IGFBP2、MMP9、PAI-1、PDGFB、PLGF、SAP、TGFA、TGFB1、THBS1及びVTNからなる群4から選ばれる少なくとも2つのマーカー分子、
又は、
(B)上記群1、上記群2、上記群3及び上記群4から選ばれる2つの群のうちの、一方から選択される少なくとも2つのマーカー分子及び他方から選択される少なくとも2つのマーカー分子、
である、工程と、
(2)上記マーカー分子の量に基づいて算出される規格化スコアから指標値を求める工程であって、同一の群の上記マーカー分子の量に基づく上記規格化スコアが下記式1から算出され、

(式1において、Mは規格化スコアを示し、Nはマーカー分子の数を示し、miは、測定された各マーカー分子の量を示し、mean(mi)は、予め決められた各マーカー分子の量の平均値を示し、sd(mi)は、予め決められた各マーカー分子の標準偏差を示し、mean(mi NASH)は、NASHを罹患している患者における予め決められた各マーカー分子の量の平均値を示し、mean(mi NAFL)は、NAFLを罹患している患者における予め決められた各マーカー分子の量の平均値を示す。)、
上記マーカー分子が(A)である場合、上記指標値が上記規格化スコアであり、
上記マーカー分子が(B)である場合、上記指標値が2つの群の規格化スコアから算出される、工程と、
(3)上記指標値が、基準値よりも大きい場合に、上記被験者がNASHを罹患している、又はその可能性があると判定する工程と、
を含む方法。
[2]上記(B)の場合であって、上記指標値が2つの群の規格化スコアから線形式又は非線形式を用いて算出される、上記[1]に記載の方法。
[3]非アルコール性脂肪肝(NAFL)と非アルコール性脂肪肝炎(NASH)とを判別する方法であって、
(1)被験者から採取された血液に含まれる、マーカー分子の量を測定する工程であって、測定する上記マーカー分子が、
(A)PROS1、CLU、ANG、APOC3、APOD、CFHR1、コルチゾール、EGFR、HPN、IGFBP3、IL1B、IL23A、MET、MMP10、テトラネクチン、TTR、VDBP及びVEGFR-2からなる群1から選ばれる少なくとも2つのマーカー分子、
VCAM1、HA、CTSD、COL4、COL4-7S、ALB、AFP、AXL、CCL19、CGB、CSF1、FAS、Mac-2bp、CA19-9、NRCAM、OPG、VWF及びYKL-40からなる群2から選ばれる少なくとも2つのマーカー分子、
AST、PSAT、LEP、ICAM1、CK-18、GSTA1、ALT、INSIVD、INSMAP、6Ckine、AGT、CRP、CXCL10、FABP4、G6PI、HSP-60、P3NP及びテストステロンからなる群3から選ばれる少なくとも2つのマーカー分子、若しくは、
AREG、BDNF、CD40-L、EREG、FGF2、HBEGF、IGFBP2、MMP9、PAI-1、PDGFB、PLGF、SAP、TGFA、TGFB1、THBS1及びVTNからなる群4から選ばれる少なくとも2つのマーカー分子、
又は、
(B)上記群1、上記群2、上記群3及び上記群4から選ばれる2つの群のうちの、一方から選択される少なくとも2つのマーカー分子及び他方から選択される少なくとも2つのマーカー分子、
である、工程と、
(2)上記マーカー分子の量に基づいて算出される規格化スコアから指標値を求める工程であって、同一の群の上記マーカー分子の量に基づく上記規格化スコアが下記式1から算出され、

(式1において、Mは規格化スコアを示し、Nはマーカー分子の数を示し、miは、測定された各マーカー分子の量を示し、mean(mi)は、予め決められた各マーカー分子の量の平均値を示し、sd(mi)は、予め決められた各マーカー分子の標準偏差を示し、mean(mi NASH)は、NASHを罹患している患者における予め決められた各マーカー分子の量の平均値を示し、mean(mi NAFL)は、NAFLを罹患している患者における予め決められた各マーカー分子の量の平均値を示す。)、
上記マーカー分子が(A)である場合、上記指標値が上記規格化スコアであり、
上記マーカー分子が(B)である場合、上記指標値が2つの群の規格化スコアから平均算出式を用いる方法、線形回帰式を用いる方法、線形判別式を用いる方法、ロジスティック回帰式を用いる方法、非線形平均算出式を用いる方法、非線形回帰式を用いる方法、非線形判別式を用いる方法、又は、非線形ロジスティック回帰式を用いる方法により算出される、工程と、
(3)上記指標値が、基準値よりも大きい場合に、上記被験者がNASHを罹患している、又はその可能性があると判定する工程と、
を含む方法。
[4]上記(B)の場合であり、ロジスティック回帰式を用いる方法として、上記指標値が2つの群の規格化スコアから下記式2により算出される、上記[1]~[3]のいずれかに記載の方法。
I=a1×Ma1+a2×Ma2 (式2)
(式2において、Iは指標値を示し、Ma1及びMa2はそれぞれ、上記2つの群のうちの一方の規格化スコア及び他方の規格化スコアを示し、a1及びa2は、ロジスティック回帰分析によって定められる定数を示す。)
[5]上記(B)の場合であり、非線形判別式を用いる方法として、上記指標値が2つの群の規格化スコアから下記決定木1~6のいずれかにより算出される、上記[1]~[3]のいずれかに記載の方法。
上記マーカー分子が、上記群1及び群2より選ばれる場合は、
M1a≧0.476ならばI=2、M1a<0.476かつM2a≧0.466ならばI=1 、M1a<0.476かつM2a<0.466ならばI=0 (決定木1)
上記マーカー分子が、上記群1及び群3より選ばれる場合は、
M3a≧0.409かつ M1a≧0.45ならばI=2、M3a≧0.409かつM1a<0.45ならばI=1、M3a<0.409ならばI=0 (決定木2)
上記マーカー分子が、上記群1及び群4より選ばれる場合は、
M4a≧0.547ならばI=2、M4a<0.547かつM1a≧0.468ならばI=1、M4a<0.547かつ M1a<0.468ならばI=0 (決定木3)
上記マーカー分子が、上記群2及び群3より選ばれる場合は、
M3a≧0.409かつM2a≧0.412ならばI=2、M3a≧0.409かつM2a<0.412ならばI=1、M3a<0.409ならばI=0 (決定木4)
上記マーカー分子が、上記群2及び群4より選ばれる場合は、
M4a≧0.547ならばI=2、M4a<0.547かつM2a≧0.413ならばI=1、M4a<0.547かつ M2a<0.413ならばI=0 (決定木5)
上記マーカー分子が、上記群3及び群4より選ばれる場合は、
M3a≧0.409ならばI=2、M3a<0.409かつM4a≧0.588ならばI=1、M3a<0.409かつM4a<0.588ならばI=0 (決定木6)
(決定木1~6において、Iは指標値を示し、M1a、M2a、M3a及びM4aはそれぞれ、上記群1、群2、群3、及び群4の規格化スコアを示す。)。
[6]上記(A)の場合であって、上記マーカー分子が上記群1のPROS1及びCLUである、上記[1]~[3]のいずれかに記載の方法。
[7]上記(A)の場合であって、上記マーカー分子が上記群2のVCAM1及びHAである、VCAM1及びCTSDである、VCAM1及びCOL4である、VCAM1及びCOL4-7Sである、HA及びCOL4-7Sである、HA及びCTSDである、HA及びCOL4である、CTSD及びCOL4である、又は、CTSD及びCOL4-7Sである、上記[1]~[3]のいずれかに記載の方法。
[8]上記(A)の場合であって、上記マーカー分子が上記群3のAST及びPSATである、AST及びLEPである、AST及びICAM1である、AST、PSAT及びLEPである、AST、PSAT及びICAM1である、AST、LEP及びCK-18である、AST、ICAM1及びGSTA1である、又は、AST、PSAT及び6Ckineである、上記[1]~[3]のいずれかに記載の方法。
[9]上記(B)の群1と群3の組合せの場合であって、群1より選択されるマーカー分子が上記群1のPROS1及びCLUであり、群3より選択されるマーカー分子がAST及びPSATである、AST及びLEPである、AST及びICAM1である、AST、PSAT及びLEPである、AST、PSAT及びICAM1である、AST、LEP及びCK-18である、AST、ICAM1及びGSTA1である、又は、AST、PSAT及び6Ckineである、上記[1]~[5]のいずれかに記載の方法。
[10]肝線維化を判別する方法であって、
被験者から採取された血液に含まれる、マーカー分子の量を測定する工程であって、測定する上記マーカー分子が、VCAM1、HA、CTSD、COL4、COL4-7S、ALB、AFP、AXL、CCL19、CGB、CSF1、FAS、Mac-2bp、CA19-9、NRCAM、OPG、VWF及びYKL-40からなる群2から選ばれる少なくとも2つのマーカー分子である、又は、VCAM1である、工程と、
上記マーカー分子の量に基づいて算出される規格化スコアが、基準値よりも大きい場合に、上記被験者が肝線維化の病態である、又はその可能性があると判定する工程であって、上記規格化スコアが下記式1から算出される工程、を含む方法。

(式1において、Mは規格化スコアを示し、Nはマーカー分子の数を示し、miは、測定された各マーカー分子の量を示し、mean(mi)は、予め決められた各マーカー分子の量の平均値を示し、sd(mi)は、予め決められた各マーカー分子の標準偏差を示し、mean(mi NASH)は、NASHを罹患している患者における予め決められた各マーカー分子の量の平均値を示し、mean(mi NAFL)は、NAFLを罹患している患者における予め決められた各マーカー分子の量の平均値を示す。)
[11]肝線維化を判別する方法であって、
上記マーカー分子が、VCAM1、HA、CTSD、COL4、COL4-7S、ALB、AFP、AXL、CCL19、CGB、CSF1、FAS、Mac-2bp、CA19-9、NRCAM、OPG、VWF及びYKL-40である、VCAM1である、VCAM1及びHAである、VCAM1及びCTSDである、VCAM1及びCOL4である、VCAM1及びCOL4-7Sである、HA及びCTSDである、CTSD及びCOL4である、HA及びCOL4である、HA及びCOL4-7Sである、又は、CTSD及びCOL4-7Sである、上記[10]に記載の方法。
[12]肝線維化の判別が、マテオーニ分類におけるType-1~Type-3の病態とType-4の病態との判別、又は、線維化Stageにおける、Stage0、Stage1又はStage2の病態と、Stage3又はStage4の病態との判別である、上記[10]又は[11]に記載の方法。
[13]肝疾患の病態の進展度を判定する方法であって、
被験者から採取された血液に含まれる、マーカー分子の量を測定する工程であって、測定する上記マーカー分子が、VCAM1である、VCAM1及びHAである、HA及びCOL4である、VCAM1及びCOL4である、HA及びCOL4-7Sである、又は、VCAM1及びCOL4-7Sである、工程と、
上記マーカー分子の量に基づいて算出される規格化スコアが大きい程、上記被験者における、肝臓の線維化の進展度、肝細胞の風船様変性の進展度、もしくは、肝臓の炎症の進展度が高い、又はそれらの可能性があると判定する工程であって、上記規格化スコアが下記式1から算出される工程、を含む方法。

(式1において、Mは規格化スコアを示し、Nはマーカー分子の数を示し、miは、測定された各マーカー分子の量を示し、mean(mi)は、予め決められた各マーカー分子の量の平均値を示し、sd(mi)は、予め決められた各マーカー分子の標準偏差を示し、mean(mi NASH)は、NASHを発症している患者における予め決められた各マーカー分子の量の平均値を示し、mean(mi NAFL)は、NAFLを発症している患者における予め決められた各マーカー分子の量の平均値を示す。)
[14]測定する上記マーカー分子が、VCAM1である、VCAM1及びHAである、VCAM1及びCOL4である、HA及びCOL4-7Sである、又は、VCAM1及びCOL4-7Sである[13]に記載の方法。
[15]非アルコール性脂肪性肝疾患(NAFLD)の病態の進展度を判定する方法であって、
被験者から採取された血液に含まれる、マーカー分子の量を測定する工程であって、測定する上記マーカー分子が、VCAM1である、VCAM1及びHAである、HA及びCOL4である、VCAM1及びCOL4である、HA及びCOL4-7Sである、又は、VCAM1及びCOL4-7Sである、工程と、
上記マーカー分子の量に基づいて算出される規格化スコアが大きい程、上記被験者における、肝臓の線維化の進展度、非アルコール性脂肪肝疾患の活動性の進展度、肝細胞の風船様変性の進展度、もしくは、肝臓の炎症の進展度が高い、又はそれらの可能性があると判定する工程であって、上記規格化スコアが下記式1から算出される工程、を含む方法。

(式1において、Mは規格化スコアを示し、Nはマーカー分子の数を示し、miは、測定された各マーカー分子の量を示し、mean(mi)は、予め決められた各マーカー分子の量の平均値を示し、sd(mi)は、予め決められた各マーカー分子の標準偏差を示し、mean(mi NASH)は、NASHを発症している患者における予め決められた各マーカー分子の量の平均値を示し、mean(mi NAFL)は、NAFLを発症している患者における予め決められた各マーカー分子の量の平均値を示す。)
[16]測定する上記マーカー分子が、VCAM1である、VCAM1及びHAである、VCAM1及びCOL4である、HA及びCOL4-7Sである、又は、VCAM1及びCOL4-7Sである[15]に記載の方法。
[17]上記[1]~[16]のいずれかに記載の方法に使用するためのキットであって、
上記マーカー分子を検出するための試薬と、
上記方法を実施するための説明書と、を含むキット。
[18]非アルコール性脂肪肝(NAFL)と非アルコール性脂肪肝炎(NASH)とを判別する方法であって、
被験者から採取された血液に含まれる、VCAM1の量を測定する工程と、
上記VCAM1の量が、基準値よりも大きい場合に、上記被験者がNASHを罹患している、又はその可能性があると判定する工程、を含む方法。
[19]肝線維化を判別する方法であって、
被験者から採取された血液に含まれる、VCAM1の量を測定する工程と、
上記VCAM1の量が、基準値よりも大きい場合に、上記被験者が肝線維化の病態である、又はその可能性があると判定する工程、を含む方法。
[20]肝疾患の病態の進展度を判定する方法であって、
被験者から採取された血液に含まれる、VCAM1の量を測定する工程と、
上記VCAM1の量が大きい程、上記被験者における、肝臓の線維化の進展度、肝細胞の風船様変性の進展度、もしくは、肝臓の炎症の進展度が高い、又はそれらの可能性があると判定する方法。
[21]非アルコール性脂肪性肝疾患(NAFLD)の病態の進展度を判定する方法であって、
被験者から採取された血液に含まれる、VCAM1の量を測定する工程と、
上記VCAM1の量が大きい程、上記被験者における、肝臓の線維化の進展度、非アルコール性脂肪肝疾患の活動性の進展度、肝細胞の風船様変性の進展度、もしくは、肝臓の炎症の進展度が高い、又はそれらの可能性があると判定する方法。
[22]上記[18]~[21]のいずれかに記載の方法に使用するためのキットであって、
VCAM1を検出するための試薬を含む、キット。
[23]上記[1]~[16]のいずれかに記載の方法に使用するためのプログラムであって、
コンピュータに、
被験者から採取された血液に含まれる上記マーカー分子の量の測定データから上記式1に基づいて規格化スコアを算出し、算出された規格化スコアから指標値を求める、規格化ステップと、
求められた指標値を、基準値と比較する、比較ステップと、
比較した結果に基づき、肝疾患の病態を有するか否かを判定する、判定ステップと、
を実行させるためのプログラム。
[24]上記[18]~[21]のいずれかに記載の方法に使用するためのプログラムであって、
コンピュータに、
被験者から採取された血液に含まれるVCAM1の量を、基準値と比較する、比較ステップと、
比較した結果に基づき、肝疾患の病態を有するか否かを判定する、判定ステップと、
を実行させるためのプログラム。
[25]コンピュータに、被験者から採取された血液に含まれる上記マーカー分子の量又は上記VCAM1の量の測定データを取得する、取得ステップを更に実行させる、上記[23]又は[24]に記載のプログラム。
[26]上記[1]~[16]、及び[18]~[21]のいずれかに記載の方法に使用するための測定装置であって、
試料を設置するための試料設置部と、上記試料に光を照射するための光源部と、上記試料を透過した光を検出する検出部と、を備える測定装置。
[27]上記[1]~[16]のいずれかに記載の方法に使用するための肝疾患判定システムであって、
被験者から採取された血液に含まれる上記マーカー分子の量を測定する測定装置と、測定した上記マーカー分子の量に基づいて肝疾患の病態を判定する肝疾患判定装置とを備え、
上記測定装置が試料を設置するための試料設置部と、上記試料に光を照射するための光源部と、上記試料を透過した光を検出する検出部と、を備え、
上記肝疾患判定装置が、上記測定装置からの測定データを取得する取得手段と、上記測定データから上記式1に基づいて規格化スコアを算出し、算出された規格化スコアから指標値を求める規格化手段と、求められた指標値を基準値と比較する比較手段と、比較した結果に基づき、肝疾患の病態を有するか否かを判定する判定手段と、を備える、肝疾患判定システム。
[28]上記[18]~[21]のいずれかに記載の方法に使用するための肝疾患判定システムであって、
被験者から採取された血液に含まれるVCAM1の量を測定する測定装置と、測定した上記VCAM1の量に基づいて肝疾患の病態を判定する肝疾患判定装置とを備え、
上記測定装置が試料を設置するための試料設置部と、上記試料に光を照射するための光源部と、上記試料を透過した光を検出する検出部と、を備え、
上記肝疾患判定装置が、上記測定装置からの測定データを取得する取得手段と、上記VCAM1の量を基準値と比較する比較手段と、比較した結果に基づき、肝疾患の病態を有するか否かを判定する判定手段と、を備える、肝疾患判定システム。
[29]非アルコール性脂肪肝炎(NASH)を罹患している、肝臓の線維化の病態である、肝臓の線維化の進展度が高い、肝細胞の風船様変性の病態の進展度が高い、肝臓の炎症の進展度が高い、肝肥大の病態である、肝細胞の壊死の病態である、肝細胞のアポトーシスの病態である、肝細胞の変性の病態である、肝臓の脂肪化の病態である、又はそれらの可能性があるかを判定するための診断薬であって、VCAM1を検出するための試薬を含有する診断薬。
[30]上記VCAM1を検出するための試薬が、抗体である、上記[29]に記載の診断薬。
[31]非アルコール性脂肪肝炎(NASH)、肝臓の線維化、肝細胞の風船様変性、肝臓の炎症、肝肥大、肝細胞の壊死、肝細胞のアポトーシス、肝細胞の変性、又は、肝臓の脂肪化のインビトロ検出のための、VCAM1を検出するための試薬の使用。
[32]他の診断薬と併用する、上記[31]に記載の使用。
[33]他の診断薬がHA、COL4、又は、COL4-7Sを検出するため診断薬である、上記[32]に記載の使用。
[34]コンピュータに、
被験者から採取された血液に含まれるマーカー分子の量の測定データから求められた指標値を、基準値と比較する、比較ステップであって、上記マーカー分子がVCAM1を含む、ステップと、
比較した結果に基づき、肝疾患の病態を有するか否かを判定する、判定ステップと、
を実行させるためのプログラム又はその記録媒体。
[35]コンピュータに、被験者から採取された血液に含まれるマーカー分子の量の測定データを取得する、取得ステップを更に実行させる、上記[34]に記載のプログラム又はその記録媒体。
[36]コンピュータに、上記測定データから規格化スコアを算出し、算出された規格化スコアから指標値を求める、規格化ステップをさらに実行させる、上記[34]又は[35]に記載のプログラム又はその記録媒体。
[37]上記マーカー分子がHA、COL4、又は、COL4-7Sを更に含む、上記[34]~[36]のいずれかに記載のプログラム又はその記録媒体。
[38]非アルコール性脂肪肝(NAFL)と非アルコール性脂肪肝炎(NASH)とを判別する方法、又は、NAFL及びNASHの診断のためのデータを収集する方法であって、
(1)被験者から採取された血液に含まれる、マーカー分子の量を測定する工程であって、上記マーカー分子が、
(A)PROS1、CLU、ANG、APOC3、APOD、CFHR1、コルチゾール、EGFR、HPN、IGFBP3、IL1B、IL23A、MET、MMP10、テトラネクチン、TTR、VDBP及びVEGFR-2からなる群1の全てのマーカー分子、
VCAM1、HA、CTSD、COL4、COL4-7S、ALB、AFP、AXL、CCL19、CGB、CSF1、FAS、Mac-2bp、CA19-9、NRCAM、OPG、VWF及びYKL-40からなる群2の全てのマーカー分子、AST、PSAT、LEP、ICAM1、CK-18、GSTA1、ALT、INSIVD、INSMAP、6Ckine、AGT、CRP、CXCL10、FABP4、G6PI、HSP-60、P3NP及びテストステロンからなる群3の全てのマーカー分子、若しくは、
AREG、BDNF、CD40-L、EREG、FGF2、HBEGF、IGFBP2、MMP9、PAI-1、PDGFB、PLGF、SAP、TGFA、TGFB1、THBS1及びVTNからなる群4の全てのマーカー分子、
又は、
(B)上記群1、上記群2、上記群3及び上記群4から選ばれる2つの群の全てのマーカー分子、
である、工程と、
(2)同一の群の上記マーカー分子の量に基づいて算出される規格化スコアから指標値を求める工程であって、上記規格化スコアが下記式1から算出され、

(式1において、Mは規格化スコアを示し、Nはマーカー分子の数を示し、miは、測定された各マーカー分子の量を示し、mean(mi)は、予め決められた各マーカー分子の量の平均値を示し、sd(mi)は、予め決められた各マーカー分子の標準偏差を示し、mean(mi NASH)は、NASHを罹患している患者における予め決められた各マーカー分子の量の平均値を示し、mean(mi NAFL)は、NAFLを罹患している患者における予め決められた各マーカー分子の量の平均値を示す。)、
上記マーカー分子が(A)である場合、上記指標値が上記規格化スコアであり、
上記マーカー分子が(B)である場合、上記指標値が下記式2から算出される、工程と、
I=a1×Ma1+a2×Ma2 (式2)
(式2において、Iは指標値を示し、Ma1及びMa2はそれぞれ、上記2つの群のうちの一方の規格化スコア及び他方の規格化スコアを示し、a1及びa2は、ロジスティック回帰分析によって定められる定数を示す。)、
(3)上記指標値が、基準値よりも大きい場合に、上記被験者がNASHを罹患している、又はその可能性があると判定する工程、又は、上記指標値が、基準値よりも大きい場合に、上記被験者がNASHを罹患している可能性があるという基準に基づいて、上記被験者がNASHを罹患しているか否かを判定するためのデータを収集する工程と、
を含む方法。
[39]上記(A)の場合であって、上記マーカー分子が上記群1の全ての分子である、上記[38]に記載の方法。
[40]上記(A)の場合であって、上記マーカー分子が上記群2の全ての分子である、上記[38]に記載の方法。
[41]上記(A)の場合であって、上記マーカー分子が上記群3の全ての分子である、上記[38]に記載の方法。
[42]上記(A)の場合であって、上記マーカー分子が上記群4の全ての分子である、上記[38]に記載の方法。
[43]上記(B)の場合であって、上記群1、上記群2、上記群3及び上記群4から選ばれる2つの群から選択される全てのマーカー分子である、上記[38]に記載の方法。
[44]上記(B)の場合であって、線形式が平均算出式、線形回帰式、線形判別式、又は、ロジスティック回帰式である、上記[2]に記載の方法。
[45]上記(B)の場合であって、平均算出式が相加平均である、上記[44]に記載の方法。
[46]上記(B)の場合であって、線形判別式が線形判別分析である、上記[44]に記載の方法。
[47]上記(B)の場合であって、非線形式が非線形平均算出式、非線形回帰式、非線形判別式、又は非線形ロジスティック回帰式である、上記[2]に記載の方法。
[48]上記(B)の場合であって、非線形平均算出式が相乗平均である、上記[47]に記載の方法。
[49]上記(B)の場合であって、非線形回帰式が線形式の掛算、又は、ニューラルネットワークである、上記[47]に記載の方法。
[50]上記(B)の場合であって、非線形判別式が決定木、又は、サポートベクターマシンである、上記[47]に記載の方法。
[51]非アルコール性脂肪肝炎(NASH)の治療薬の効果を判定する方法であって、
NASH患者に対して上記治療薬の適用前と適用後とにおいてそれぞれ、上記患者から採取された血液に含まれる、マーカー分子の量を測定する工程であって、測定する上記マーカー分子が、VCAM1である、VCAM1及びHAである、HA及びCOL4である、VCAM1及びCOL4である、HA及びCOL4-7Sである、又は、VCAM1及びCOL4-7Sである、工程と、
上記マーカー分子の量に基づいて上記治療薬の適用前と適用後のそれぞれ規格化スコアを算出し、適用後の規格化スコアが、適用前の規格化スコアよりも減少している場合、上記治療薬を適用した効果があった可能性があると判定する工程であって、上記規格化スコアが下記式1から算出される工程、を含む方法。

(式1において、Mは規格化スコアを示し、Nはマーカー分子の数を示し、miは、測定された各マーカー分子の量を示し、mean(mi)は、予め決められた各マーカー分子の量の平均値を示し、sd(mi)は、予め決められた各マーカー分子の標準偏差を示し、mean(mi NASH)は、NASHを発症している患者における予め決められた各マーカー分子の量の平均値を示し、mean(mi NAFL)は、NAFLを発症している患者における予め決められた各マーカー分子の量の平均値を示す。)
[52]測定する上記マーカー分子が、VCAM1である、VCAM1及びHAである、VCAM1及びCOL4である、HA及びCOL4-7Sである、又は、VCAM1及びCOL4-7Sである[51]に記載の方法。
[53]非アルコール性脂肪肝炎(NASH)の治療薬の効果を判定する方法であって、
NASH患者に対して上記治療薬の適用前と適用後とにおいてそれぞれ、上記患者から採取された血液に含まれる、VCAM1の量を測定する工程と、
適用後のVCAM1の量が適用前のVCAM1の量よりも減少している場合、上記治療薬を適用した効果があった可能性があると判定する方法。
[54]非アルコール性脂肪肝(NAFL)又は非アルコール性脂肪肝炎(NASH)の治療薬の効果を判定する方法であって、
NAFL又はNASH患者に対して上記治療薬の適用前と適用後とにおいてそれぞれ、
(1)被験者から採取された血液に含まれる、マーカー分子の量を測定する工程であって、測定する上記マーカー分子が、
(A)PROS1、CLU、ANG、APOC3、APOD、CFHR1、コルチゾール、EGFR、HPN、IGFBP3、IL1B、IL23A、MET、MMP10、テトラネクチン、TTR、VDBP及びVEGFR-2からなる群1から選ばれる少なくとも2つのマーカー分子、
VCAM1、HA、CTSD、COL4、COL4-7S、ALB、AFP、AXL、CCL19、CGB、CSF1、FAS、Mac-2bp、CA19-9、NRCAM、OPG、VWF及びYKL-40からなる群2から選ばれる少なくとも2つのマーカー分子、
AST、PSAT、LEP、ICAM1、CK-18、GSTA1、ALT、INSIVD、INSMAP、6Ckine、AGT、CRP、CXCL10、FABP4、G6PI、HSP-60、P3NP及びテストステロンからなる群3から選ばれる少なくとも2つのマーカー分子、若しくは、
AREG、BDNF、CD40-L、EREG、FGF2、HBEGF、IGFBP2、MMP9、PAI-1、PDGFB、PLGF、SAP、TGFA、TGFB1、THBS1及びVTNからなる群4から選ばれる少なくとも2つのマーカー分子、
又は、
(B)上記群1、上記群2、上記群3及び上記群4から選ばれる2つの群のうちの、一方から選択される少なくとも2つのマーカー分子及び他方から選択される少なくとも2つのマーカー分子、
である、工程と、
(2)上記マーカー分子の量に基づいて算出される規格化スコアから指標値を求める工程であって、同一の群の上記マーカー分子の量に基づく上記規格化スコアが下記式1から算出され、
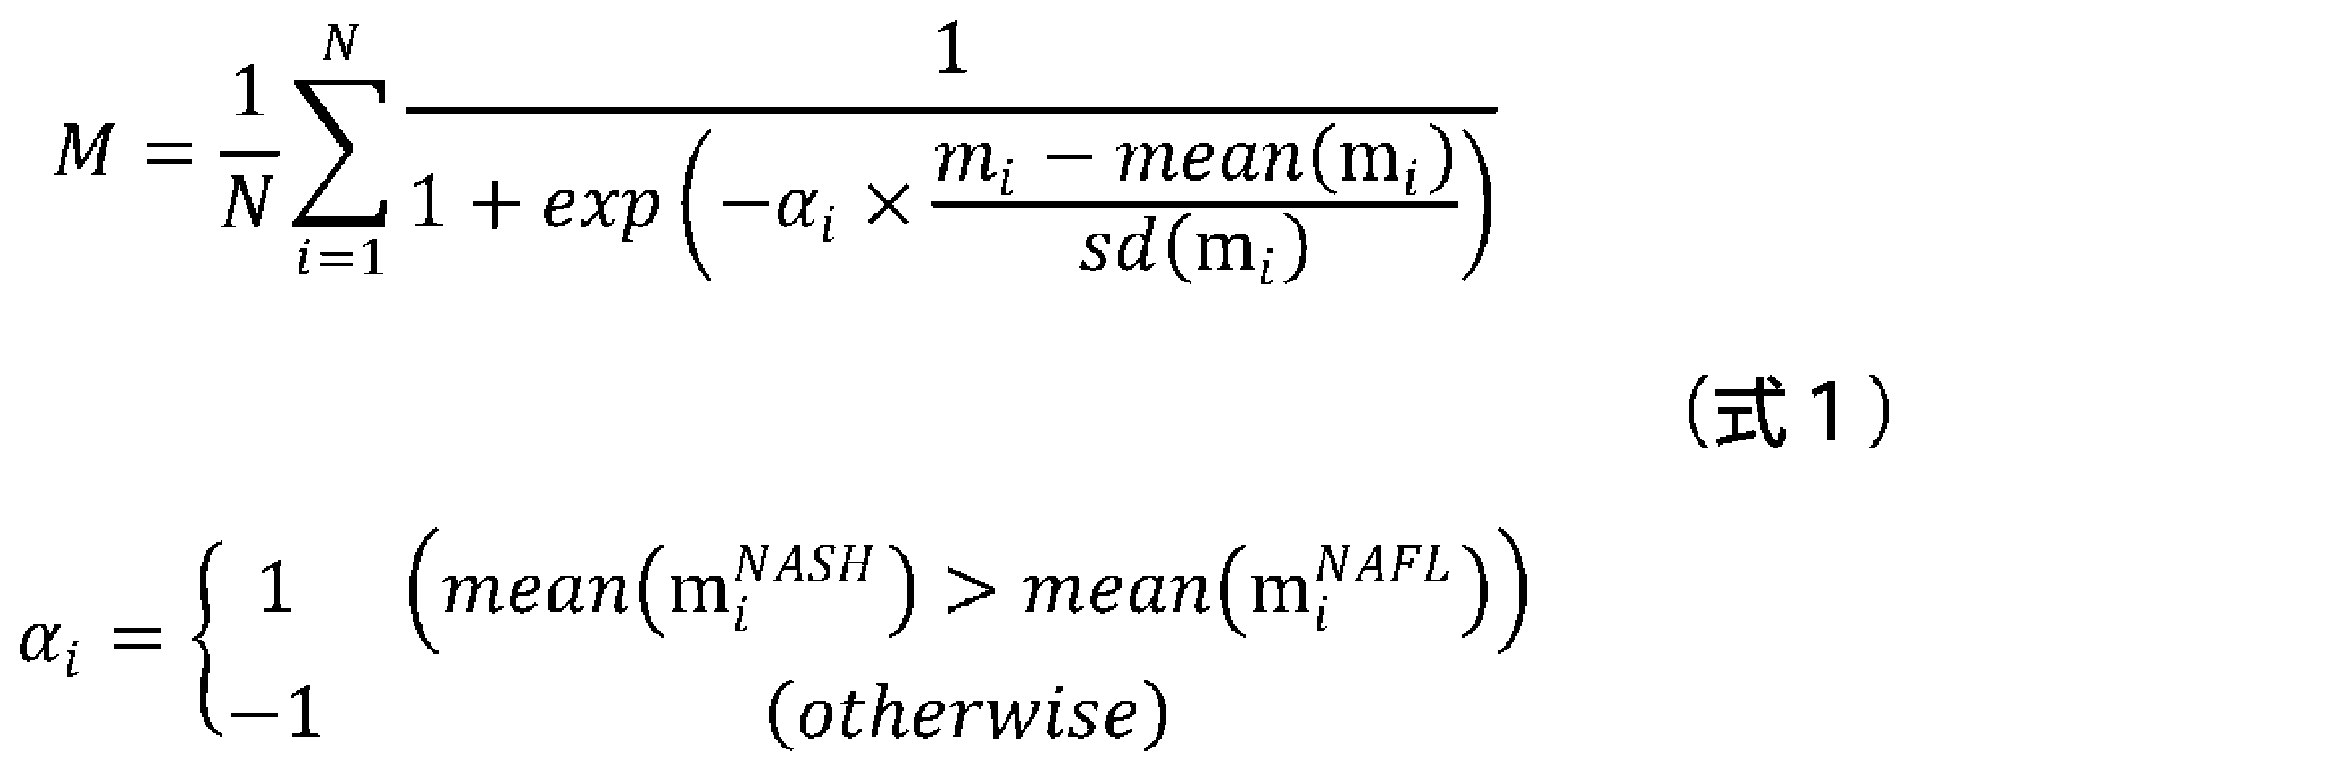
(式1において、Mは規格化スコアを示し、Nはマーカー分子の数を示し、miは、測定された各マーカー分子の量を示し、mean(mi)は、予め決められた各マーカー分子の量の平均値を示し、sd(mi)は、予め決められた各マーカー分子の標準偏差を示し、mean(mi NASH)は、NASHを罹患している患者における予め決められた各マーカー分子の量の平均値を示し、mean(mi NAFL)は、NAFLを罹患している患者における予め決められた各マーカー分子の量の平均値を示す。)、
上記マーカー分子が(A)である場合、上記指標値が上記規格化スコアであり、
上記マーカー分子が(B)である場合、上記指標値が2つの群の規格化スコアから算出される、工程と、
(3)適用後の規格化スコアが、適用前の規格化スコアよりも減少している場合、上記治療薬を適用した効果があった可能性があると判定する工程と、
を含む方法。
(1)被験者から採取された血液に含まれる、マーカー分子の量を測定する工程と、
(2)同一の群の上記マーカー分子の量に基づいて算出される規格化スコアに基づいて指標値を求める工程と、
(3)上記指標値が、基準値よりも大きい場合に、上記被験者がNASHを発症している、又はその可能性があると判定する工程と、を含む。
被験者から採取された血液としては、全血、血清、血漿等が挙げられ、血清又は血漿が好ましく用いられる。
(A1)群1から選ばれる少なくとも2つのマーカー分子、群2から選ばれる少なくとも2つのマーカー分子、群3から選ばれる少なくとも2つのマーカー分子、若しくは、群4から選ばれる少なくとも2つのマーカー分子、又は、
(B1)上記群1、上記群2、上記群3及び上記群4から選ばれる2つの群のうちの、一方から選択される少なくとも2つのマーカー分子及び他方から選択れる少なくとも2つのマーカー分子、が挙げられる。
(A2)群1の全てのマーカー分子、群2の全てのマーカー分子、群3の全てのマーカー分子、若しくは、群4の全てのマーカー分子、又は、
(B2)上記群1、上記群2、上記群3及び上記群4から選ばれる2つの群の全てのマーカー分子、が挙げられる。
同一の群のマーカー分子の量に基づいて規格化スコアを算出する工程には、測定したマーカー分子の量に由来するデータを規格化する工程、規格化されたデータの分布を変換する工程、変換した分布から求められる代表値を規格化スコアとして選択する工程が含まれる。

sd(mi)には、各マーカー分子の量の標準偏差であって、NAFLD罹患者の検体を測定して得られる標準偏差、公知の測定データに基づくNAFLD罹患者の標準偏差、公知の測定データに基づく判別又は評価しようとする人が含まれる地域住民の標準偏差、公知の測定データに基づく判別又は評価しようとする人種の標準偏差等を用いることができる。NAFLD罹患者の標準偏差を用いる場合には、罹患者集団全体の標準偏差、罹患者集団のうちのNAFL罹患者の標準偏差とNASH患者の標準偏差との単純平均値、NAFL罹患者の標準偏差とNASH患者の標準偏差とのそれぞれに任意の加重をかけたうえで平均することで得られる加重平均値等を用いることができる。公知の測定データに基づくNAFLD罹患者の標準偏差を用いる場合には、公知の測定データに基づくNAFLD罹患者の標準偏差、公知の測定データに基づくNAFL罹患者の標準偏差とNASH患者の標準偏差との単純平均値、公知の測定データに基づくNAFL罹患者の標準偏差とNASH罹患患者の標準偏差とのそれぞれに任意の加重をかけたうえで平均することで得られる加重平均値等を用いることができる。公知の測定データとしては、論文で公表されている生体分子の測定値、体外診断薬の添付文書に記載されている値、診療ガイドラインに記載されている値等を用いることができる。複数のデータを合算して用いることもできる。好ましくは、NAFLD罹患者の検体を測定して得られる、罹患者集団全体の標準偏差、又は罹患者集団のうちのNAFL罹患者の標準偏差とNASH患者の標準偏差との単純平均値が挙げられる。より好ましくはNAFLD罹患者の検体を測定して得られる、罹患者集団のうちのNAFL罹患者の標準偏差とNASH患者の標準偏差との単純平均値が挙げられる。
I=a1×Ma1+a2×Ma2 (式2)
上記マーカー分子が、上記群1及び群2より選ばれる場合は、
M1a≧0.476ならばI=2、M1a<0.476かつM2a≧0.466ならばI=1 、M1a<0.476かつM2a<0.466ならばI=0 (決定木1)
上記マーカー分子が、上記群1及び群3より選ばれる場合は、
M3a≧0.409かつ M1a≧0.45ならばI=2、M3a≧0.409かつM1a<0.45ならばI=1、M3a<0.409ならばI=0 (決定木2)
上記マーカー分子が、上記群1及び群4より選ばれる場合は、
M4a≧0.547ならばI=2、M4a<0.547かつM1a≧0.468ならばI=1、M4a<0.547かつ M1a<0.468ならばI=0 (決定木3)
上記マーカー分子が、上記群2及び群3より選ばれる場合は、
M3a≧0.409かつM2a≧0.412ならばI=2、M3a≧0.409かつM2a<0.412ならばI=1、M3a<0.409ならばI=0 (決定木4)
上記マーカー分子が、上記群2及び群4より選ばれる場合は、
M4a≧0.547ならばI=2、M4a<0.547かつM2a≧0.413ならばI=1、M4a<0.547かつ M2a<0.413ならばI=0 (決定木5)
上記マーカー分子が、上記群3及び群4より選ばれる場合は、
M3a≧0.409ならばI=2、M3a<0.409かつM4a≧0.588ならばI=1、M3a<0.409かつM4a<0.588ならばI=0 (決定木6)
(決定木1~6において、Iは指標値を示し、M1a、M2a、M3a及びM4aはそれぞれ、上記群1、群2、群3、及び群4の規格化スコアを示す。)。
本明細書における「基準値」とは、2つの状態を判別するための基準となる値(カットオフ値)であり、任意に設定することができる。基準値は、NAFL罹患者における指標値であってもよいし、あらかじめ設定された値であってもよい。あらかじめ設定された値としては、保有するNAFL罹患者及びNASH罹患者の指標値によって導かれるROC曲線から推定される、基準値と感度(NASH罹患者の正診率)及び特異度(NAFL罹患者の正診率)の関係に基づき、使用者が必要とする感度と特異度となるような指標値を、上記基準値として設定できる。
マーカー分子が群1の少なくとも2つのマーカー分子である場合、基準値は例えば、0.149~0.907の間で設定される値である。
マーカー分子が群2の少なくとも2つのマーカー分子である場合、基準値は例えば、0.087~0.848の間で設定される値である。
マーカー分子が群3の少なくとも2つのマーカー分子である場合、基準値は例えば、0.164~0.909の間で設定される値である。
マーカー分子が群4の少なくとも2つのマーカー分子である場合、基準値は例えば、0.073~0.854の間で設定される値である。
マーカー分子が群1の全てのマーカー分子である場合、基準値は例えば、0.359~0.586の間で設定される値であり、NASH罹患者の正診率の向上という観点では好ましくは0.359~0.486の間で設定される値であり、NAFL罹患者の正診率の向上という観点では好ましくは0.486~0.586の間で設定される値である。
マーカー分子が群2の全てのマーカー分子である場合、基準値は例えば、0.357~0.509の間で設定される値であり、NASH罹患者の正診率の向上という観点では好ましくは0.357~0.419の間で設定される値であり、NAFL罹患者の正診率の向上という観点では好ましくは0.419~0.509の間で設定される値である。
マーカー分子が群3の全てのマーカー分子である場合、基準値は例えば、0.378~0.545の間で設定される値であり、NASH罹患者の正診率の向上という観点では好ましくは0.378~0.45の間で設定される値であり、NAFL罹患者の正診率の向上という観点では好ましくは0.45~0.545の間で設定される値である。
マーカー分子が群4の全てのマーカー分子である場合、基準値は例えば、0.272~0.583の間で設定される値であり、NASH罹患者の正診率の向上という観点では好ましくは0.272~0.489の間で設定される値であり、NAFL罹患者の正診率の向上という観点では好ましくは0.489~0.583の間で設定される値である。
マーカー分子が群1の少なくとも2つのマーカー分子及び群3の少なくとも2つのマーカー分子である場合、基準値は例えば、5.987~34.702の間で設定される値である。
マーカー分子が群1の少なくとも2つのマーカー分子及び群4の少なくとも2つのマーカー分子である場合、基準値は例えば、1.932~14.239の間で設定される値である。
マーカー分子が群2の少なくとも2つのマーカー分子及び群3の少なくとも2つのマーカー分子である場合、基準値は例えば、2.836~19.664の間で設定される値である。
マーカー分子が群2の少なくとも2つのマーカー分子及び群4の少なくとも2つのマーカー分子である場合、基準値は例えば、1.387~14.334の間で設定される値である。
マーカー分子が群3の少なくとも2つのマーカー分子及び群4の少なくとも2つのマーカー分子である場合、基準値は例えば、3.044~20.554の間で設定される値である。
マーカー分子が群1及び群2の全てのマーカー分子である場合、基準値は例えば、12.025~15.396の間で設定される値であり、NASH罹患者の正診率の向上という観点では好ましくは12.025~13.795の間で設定される値であり、NAFL罹患者の正診率の向上という観点では好ましくは13.795~15.396の間で設定される値である。
マーカー分子が群1及び群3の全てのマーカー分子である場合、基準値は例えば、15.915~20.712の間で設定される値であり、NASH罹患者の正診率の向上という観点では好ましくは15.915~18.297の間で設定される値であり、NAFL罹患者の正診率の向上という観点では好ましくは18.297~20.712の間で設定される値である。
マーカー分子が群1及び群4の全てのマーカー分子である場合、基準値は例えば、6.219~8.967の間で設定される値であり、NASH罹患者の正診率の向上という観点では好ましくは6.219~7.533の間で設定される値であり、NAFL罹患者の正診率の向上という観点では好ましくは7.533~8.967の間で設定される値である。
マーカー分子が群2及び群3の全てのマーカー分子である場合、基準値は例えば、8.497~11.466の間で設定される値であり、好ましくは8.497~10.129の間で設定される値であり、NAFL罹患者の正診率の向上という観点では好ましくは10.129~11.466の間で設定される値である。
マーカー分子が群2及び群4の全てのマーカー分子である場合、基準値は例えば、5.889~8.934の間で設定される値であり、NASH罹患者の正診率の向上という観点では好ましくは5.889~7.445の間で設定される値であり、NAFL罹患者の正診率の向上という観点では好ましくは7.445~8.934の間で設定される値である。
マーカー分子が群3及び群4の全てのマーカー分子である場合、基準値は例えば、9.023~12.548の間で設定される値であり、NASH罹患者の正診率の向上という観点では好ましくは9.023~10.665の間で設定される値であり、NAFL罹患者の正診率の向上という観点では好ましくは10.665~12.548の間で設定される値である。
群2の場合、マーカー分子は、VCAM1を含んでいてもよいし、VCAM1であってもよいし、VCAM1及びHAであってもよいし、VCAM1及びHAを含んでいてもよいし、VCAM1及びCTSDであってもよいし、VCAM1及びCTSDを含んでいてもよいし、VCAM1及びCOL4であってもよいし、VCAM1及びCOL4を含んでいてもよいし、VCAM1及びCOL4-7Sであってもよいし、VCAM1及びCOL4-7Sを含んでいてもよいし、HA及びCOL4-7Sであってもよいし、HA及びCOL4-7Sを含んでいてもよいし、HA及びCTSDであってもよいし、HA及びCTSDを含んでいてもよいし、HA及びCOL4であってもよいし、HA及びCOL4を含んでいてもよいし、CTSD及びCOL4であってもよいし、CTSD及びCOL4を含んでいてもよいし、CTSD及びCOL4-7Sであってもよいし、CTSD及びCOL4-7Sを含んでいてもよい。
群3の場合、マーカー分子は、AST及びPSATであってもよいし、AST及びPSATを含んでいてもよいし、AST及びLEPであってもよいし、AST及びLEPを含んでいてもよいし、AST及びICAM1であってもよいし、AST及びICAM1を含んでいてもよいし、AST、PSAT及びLEPであってもよいし、AST、PSAT及びLEPを含んでいてもよいし、AST、PSAT及びICAM1であってもよいし、AST、PSAT及びICAM1を含んでいてもよいし、AST、LEP及びCK-18であってもよいし、AST、LEP及びCK-18を含んでいてもよいし、AST、ICAM1及びGSTA1であってもよいし、AST、ICAM1及びGSTA1を含んでいてもよいし、AST、PSAT及び6Ckineであってもよいし、AST、PSAT及び6Ckineを含んでいてもよい。
マーカー分子がPROS1及びCLUである場合、基準値は例えば、0.256~0.634の間で設定される値であり、NASH罹患者の正診率の向上という観点では好ましくは0.256~0.42の間で設定される値であり、NAFL罹患者の正診率の向上という観点では好ましくは0.42~0.634の間で設定される値である。
マーカー分子が、VCAM1である、VCAM1及びHAである、VCAM1及びCTSDである、VCAM1及びCOL4である、VCAM1及びCOL4-7Sである、HA及びCOL4-7Sである、HA及びCTSDである、HA及びCOL4である、CTSD及びCOL4である、又は、CTSD及びCOL4-7Sである場合、基準値は例えば、0.256~0.644の間で設定される値であり、NASH罹患者の正診率の向上という観点では好ましくは0.256~0.42の間で設定される値であり、NAFL罹患者の正診率の向上という観点では好ましくは0.389~0.644の間で設定される値である。
マーカー分子がVCAM1である場合、基準値は例えば、0.28~0.644の間で設定される値であり、NASH罹患者の正診率の向上という観点では好ましくは0.28~0.389の間で設定される値であり、NAFL罹患者の正診率の向上という観点では好ましくは0.389~0.644の間で設定される値である。
マーカー分子がVCAM1及びHAである場合、基準値は例えば、0.326~0.617の間で設定される値であり、NASH罹患者の正診率の向上という観点では好ましくは0.326~0.398の間で設定される値であり、NAFL罹患者の正診率の向上という観点では好ましくは0.398~0.617の間で設定される値である。
マーカー分子がVCAM1及びCTSDである場合、基準値は例えば、0.277~0.604の間で設定される値であり、NASH罹患者の正診率の向上という観点では好ましくは0.277~0.408の間で設定される値であり、NAFL罹患者の正診率の向上という観点では好ましくは0.408~0.604の間で設定される値である。
マーカー分子がVCAM1及びCOL4である場合、基準値は例えば、0.319~0.617の間で設定される値であり、NASH罹患者の正診率の向上という観点では好ましくは0.319~0.407の間で設定される値であり、NAFL罹患者の正診率の向上という観点では好ましくは0.407~0.617の間で設定される値である。
マーカー分子がVCAM1及びCOL4-7Sである場合、基準値は例えば、0.303~0.543の間で設定される値であり、NASH罹患者の正診率の向上という観点では好ましくは0.303~0.416の間で設定される値であり、NAFL罹患者の正診率の向上という観点では好ましくは0.416~0.543の間で設定される値である。
マーカー分子がHA及びCOL4-7Sである場合、基準値は例えば、0.326~0.509の間で設定される値であり、NASH罹患者の正診率の向上という観点では好ましくは0.326~0.398の間で設定される値であり、NAFL罹患者の正診率の向上という観点では好ましくは0.398~0.509の間で設定される値である。
マーカー分子がHA及びCOL4である場合、基準値は例えば、0.343~0.487の間で設定される値であり、NASH罹患者の正診率の向上という観点では好ましくは0.343~0.395の間で設定される値であり、NAFL罹患者の正診率の向上という観点では好ましくは0.395~0.487の間で設定される値である。
マーカー分子がHA及びCTSDである場合、基準値は例えば、0.305~0.545の間で設定される値であり、NASH罹患者の正診率の向上という観点では好ましくは0.305~0.411の間で設定される値であり、NAFL罹患者の正診率の向上という観点では好ましくは0.411~0.545の間で設定される値である。
マーカー分子がCTSD及びCOL4である場合、基準値は例えば、0.307~0.536の間で設定される値であり、NASH罹患者の正診率の向上という観点では好ましくは0.307~0.415の間で設定される値であり、NAFL罹患者の正診率の向上という観点では好ましくは0.415~0.536の間で設定される値である。
マーカー分子がCTSD及びCOL4-7Sである場合、基準値は例えば、0.271~0.575の間で設定される値であり、NASH罹患者の正診率の向上という観点では好ましくは0.271~0.419の間で設定される値であり、NAFL罹患者の正診率の向上という観点では好ましくは0.419~0.575の間で設定される値である。
マーカー分子がVCAM1及びHAである場合、基準値は例えば、0.326~0.684の間で設定される値であり、NASH罹患者の正診率の向上という観点では好ましくは0.326~0.39の間で設定される値であり、NAFL罹患者の正診率の向上という観点では好ましくは0.39~0.684の間で設定される値である。
マーカー分子がVCAM1及びCOL4-7Sである場合、基準値は例えば、0.293~0.548の間で設定される値であり、NASH罹患者の正診率の向上という観点では好ましくは0.293~0.394の間で設定される値であり、NAFL罹患者の正診率の向上という観点では好ましくは0.394~0.548の間で設定される値である。
マーカー分子がHA及びCOL4-7Sである場合、基準値は例えば、0.308~0.662の間で設定される値であり、NASH罹患者の正診率の向上という観点では好ましくは0.308~0.394の間で設定される値であり、NAFL罹患者の正診率の向上という観点では好ましくは0.394~0.662の間で設定される値である。
マーカー分子が、AST及びPSATである、AST及びLEPである、AST及びICAM1である、AST、PSAT及びLEPである、AST、PSAT及びICAM1である、AST、LEP及びCK-18である、AST、ICAM1及びGSTA1である、又は、AST、PSAT及び6Ckineである場合、基準値は例えば、0.284~0.629の間で設定される値であり、NASH罹患者の正診率の向上という観点では好ましくは0.284~0.439の間で設定される値であり、NAFL罹患者の正診率の向上という観点では好ましくは0.393~0.629の間で設定される値である。
マーカー分子がAST及びPSATである場合、基準値は例えば、0.284~0.544の間で設定される値であり、NASH罹患者の正診率の向上という観点では好ましくは0.284~0.397の間で設定される値であり、NAFL罹患者の正診率の向上という観点では好ましくは0.397~0.544の間で設定される値である。
マーカー分子がAST及びLEPである場合、基準値は例えば、0.309~0.629の間で設定される値であり、NASH罹患者の正診率の向上という観点では好ましくは0.309~0.412の間で設定される値であり、NAFL罹患者の正診率の向上という観点では好ましくは0.412~0.629の間で設定される値である。
マーカー分子がAST及びICAM1である場合、基準値は例えば、0.302~0.546の間で設定される値であり、NASH罹患者の正診率の向上という観点では好ましくは0.302~0.406の間で設定される値であり、NAFL罹患者の正診率の向上という観点では好ましくは0.406~0.546の間で設定される値である。
マーカー分子がAST、PSAT及びLEPである場合、基準値は例えば、0.303~0.619の間で設定される値であり、NASH罹患者の正診率の向上という観点では好ましくは0.303~0.418の間で設定される値であり、NAFL罹患者の正診率の向上という観点では好ましくは0.418~0.619の間で設定される値である。
マーカー分子がAST、PSAT及びICAM1である場合、基準値は例えば、0.301~0.551の間で設定される値であり、NASH罹患者の正診率の向上という観点では好ましくは0.301~0.406の間で設定される値であり、NAFL罹患者の正診率の向上という観点では好ましくは0.406~0.551の間で設定される値である。
マーカー分子がAST、LEP及びCK-18である場合、基準値は例えば、0.297~0.625の間で設定される値であり、NASH罹患者の正診率の向上という観点では好ましくは0.297~0.439の間で設定される値であり、NAFL罹患者の正診率の向上という観点では好ましくは0.439~0.625の間で設定される値である。
マーカー分子がAST、ICAM1及びGSTA1である場合、基準値は例えば、0.302~0.573の間で設定される値であり、NASH罹患者の正診率の向上という観点では好ましくは0.302~0.393の間で設定される値であり、NAFL罹患者の正診率の向上という観点では好ましくは0.393~0.573の間で設定される値である。
マーカー分子がAST、PSAT及び6Ckineである場合、基準値は例えば、0.291~0.535の間で設定される値であり、NASH罹患者の正診率の向上という観点では好ましくは0.291~0.416の間で設定される値であり、NAFL罹患者の正診率の向上という観点では好ましくは0.416~0.535の間で設定される値である。
例えば、群2を代表するマーカー分子がVCAM1であり、VCAM1の測定値(例えば、血清中の濃度)を指標値としてもよい。VCAM1の量の測定にELISA法「Human sVCAM-1/CD106 Quantikine ELISA Kit」が用いられる場合においては、基準値(血清中の濃度(ng/ml))は例えば、551.1~1280.1の間で設定される値であり、NASH罹患者の正診率の向上という観点では好ましくは693.5~925.3の間で設定される値である。
マーカー分子が、PROS1及びCLUである、並びに、AST及びPSATである、AST及びLEPである、AST及びICAM1である、AST、PSAT及びLEPである、AST、PSAT及びICAM1である、AST、LEP及びCK-18である、AST、ICAM1及びGSTA1である、又は、AST、PSAT及び6Ckineである場合、基準値は例えば、13.493~21.205の間で設定される値であり、NASH罹患者の正診率の向上という観点では好ましくは13.493~18.331の間で設定される値であり、NAFL罹患者の正診率の向上という観点では好ましくは16.789~21.205の間で設定される値である。
マーカー分子が、PROS1及びCLUである、並びに、AST及びPSATである場合、基準値は例えば、13.493~21.02の間で設定される値であり、NASH罹患者の正診率の向上という観点では好ましくは13.493~17.141の間で設定される値であり、NAFL罹患者の正診率の向上という観点では好ましくは17.141~21.02の間で設定される値である。
マーカー分子が、PROS1及びCLUである、並びに、AST及びLEPである場合、基準値は例えば、14.228~20.755の間で設定される値であり、NASH罹患者の正診率の向上という観点では好ましくは14.228~18.145の間で設定される値であり、NAFL罹患者の正診率の向上という観点では好ましくは18.145~20.755の間で設定される値である。
マーカー分子が、PROS1及びCLUである、並びに、AST及びICAM1である場合、基準値は例えば、13.663~20.831の間で設定される値であり、NASH罹患者の正診率の向上という観点では好ましくは13.663~17.406の間で設定される値であり、NAFL罹患者の正診率の向上という観点では好ましくは17.406~20.831の間で設定される値である。
マーカー分子が、PROS1及びCLUである、並びに、AST、PSAT及びLEPである場合、基準値は例えば、14.229~20.843の間で設定される値であり、NASH罹患者の正診率の向上という観点では好ましくは14.229~18.331の間で設定される値であり、NAFL罹患者の正診率の向上という観点では好ましくは18.331~20.843の間で設定される値である。
マーカー分子が、PROS1及びCLUである、並びに、AST、PSAT及びICAM1である場合、基準値は例えば、13.929~21.053の間で設定される値であり、NASH罹患者の正診率の向上という観点では好ましくは13.929~17.749の間で設定される値であり、NAFL罹患者の正診率の向上という観点では好ましくは17.749~21.053の間で設定される値である。
マーカー分子が、PROS1及びCLUである、並びに、AST、LEP及びCK-18である場合、基準値は例えば、13.544~21.168の間で設定される値であり、NASH罹患者の正診率の向上という観点では好ましくは13.544~18.319の間で設定される値であり、NAFL罹患者の正診率の向上という観点では好ましくは18.319~21.168の間で設定される値である。
マーカー分子が、PROS1及びCLUである、並びに、AST、ICAM1及びGSTA1である場合、基準値は例えば、13.788~20.882の間で設定される値であり、NASH罹患者の正診率の向上という観点では好ましくは13.788~17.643の間で設定される値であり、NAFL罹患者の正診率の向上という観点では好ましくは17.643~20.882の間で設定される値である。
マーカー分子が、PROS1及びCLUである、並びに、AST、PSAT及び6Ckineである場合、基準値は例えば、13.844~21.205の間で設定される値であり、NASH罹患者の正診率の向上という観点では好ましくは13.844~16.789の間で設定される値であり、NAFL罹患者の正診率の向上という観点では好ましくは16.789~21.205の間で設定される値である。
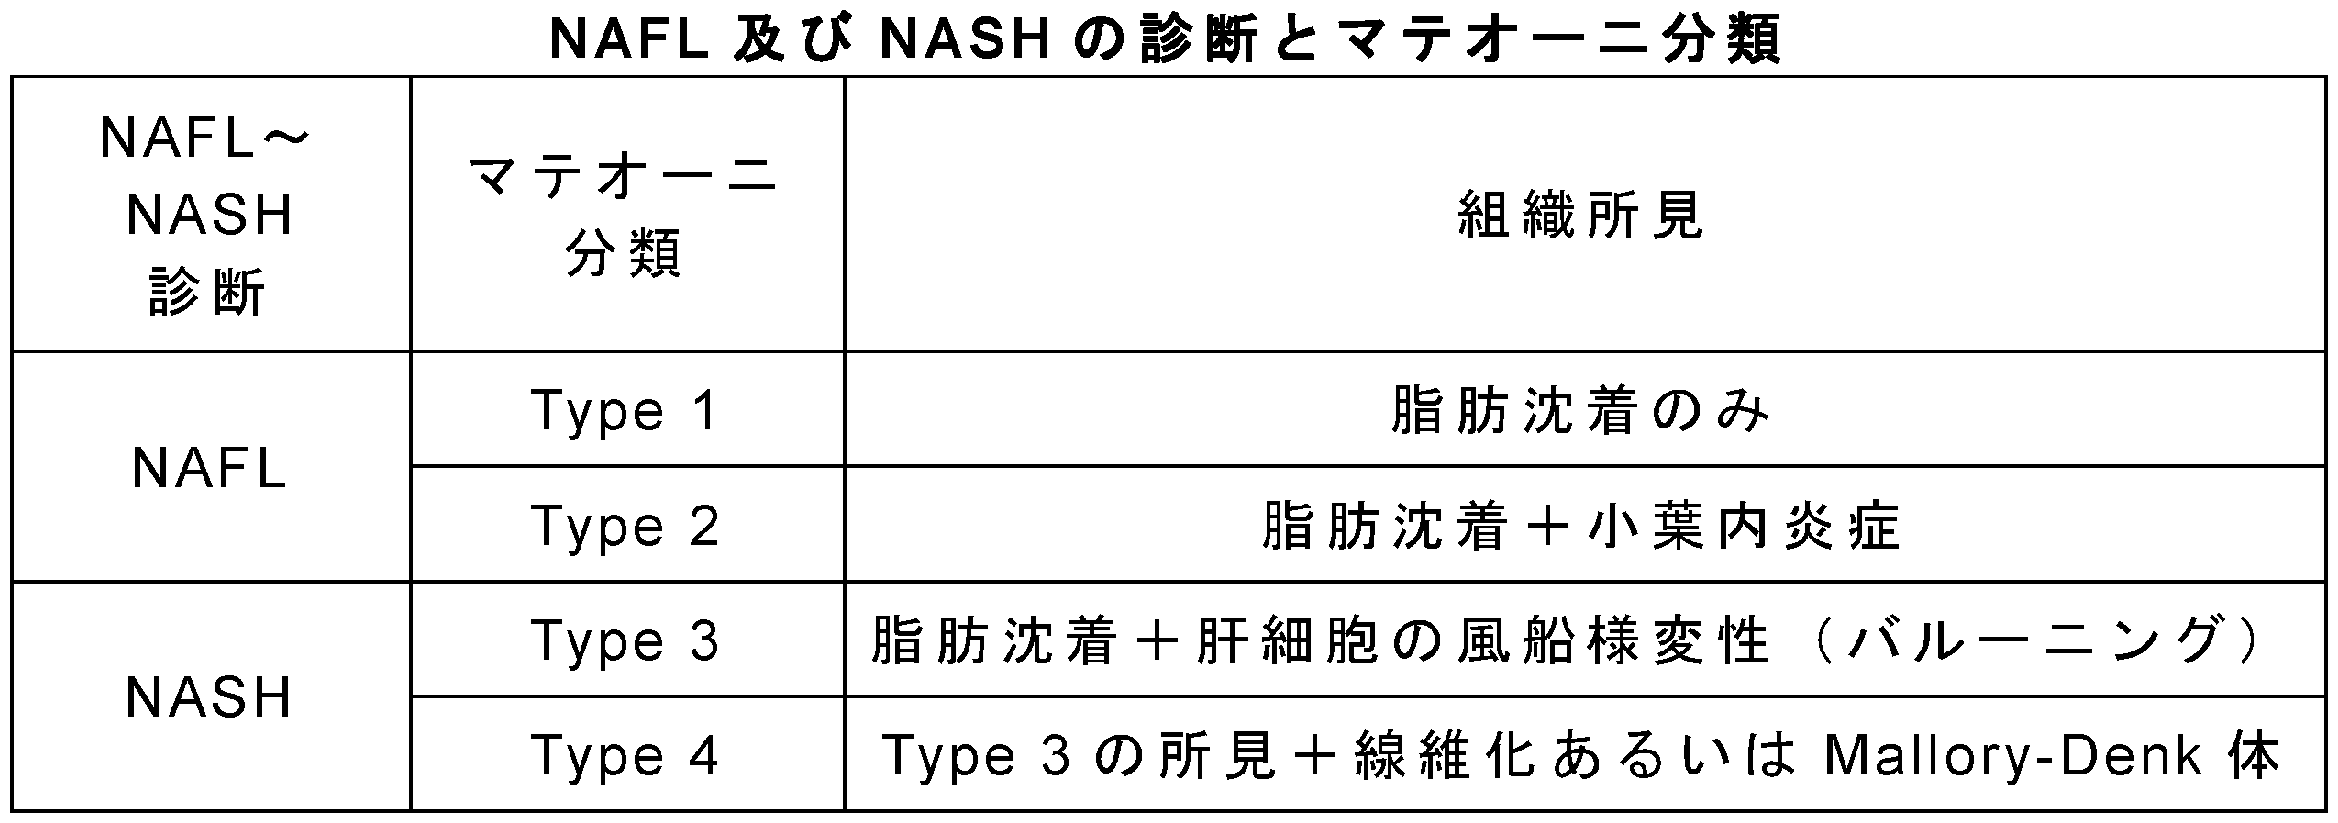

マーカー分子が群2の少なくとも2つのマーカー分子である場合、基準値は例えば、0.087~0.848の間で設定される値である。
マーカー分子が、上記群2の全てのマーカー分子である、VCAM1である、VCAM1及びHAである、VCAM1及びCTSDである、VCAM1及びCOL4である、VCAM1及びCOL4-7Sである、HA及びCOL4-7Sである、HA及びCTSDである、HA及びCOL4である、CTSD及びCOL4である、又は、CTSD及びCOL4-7Sである場合、基準値は例えば、0.303~0.617の間で設定される値であり、Type-4の病態の正診率の向上という観点では好ましくは0.303~0.475の間で設定される値であり、Type-1~Type-3の病態の正診率の向上という観点では好ましくは0.408~0.536の間で設定される値である。
マーカー分子が上記群2の全てのマーカー分子である場合、基準値は例えば、0.401~0.536の間で設定される値であり、Type-4の病態の正診率の向上という観点では好ましくは0.401~0.45の間で設定される値であり、Type-1~Type-3の病態の正診率の向上という観点では好ましくは0.45~0.536の間で設定される値である。
マーカー分子がVCAM1である場合、基準値は例えば、0.303~0.538の間で設定される値であり、Type-4の病態の正診率の向上という観点では好ましくは0.303~0.421の間で設定される値であり、Type-1~Type-3の病態の正診率の向上という観点では好ましくは0.421~0.538の間で設定される値である。
マーカー分子がVCAM1及びHAである場合、基準値は例えば、0.328~0.617の間で設定される値であり、Type-4の病態の正診率の向上という観点では好ましくは0.328~0.418の間で設定される値であり、Type-1~Type-3の病態の正診率の向上という観点では好ましくは0.418~0.617の間で設定される値である。
マーカー分子がVCAM1及びCTSDである場合、基準値は例えば、0.313~0.581の間で設定される値であり、Type-4の病態の正診率の向上という観点では好ましくは0.313~0.432の間で設定される値であり、Type-1~Type-3の病態の正診率の向上という観点では好ましくは0.432~0.581の間で設定される値である。
マーカー分子がVCAM1及びCOL4である場合、基準値は例えば、0.343~0.558の間で設定される値であり、Type-4の病態の正診率の向上という観点では好ましくは0.343~0.457の間で設定される値であり、Type-1~Type-3の病態の正診率の向上という観点では好ましくは0.457~0.558の間で設定される値である。
マーカー分子がVCAM1及びCOL4-7Sである場合、基準値は例えば、0.358~0.602の間で設定される値であり、Type-4の病態の正診率の向上という観点では好ましくは0.358~0.438の間で設定される値であり、Type-1~Type-3の病態の正診率の向上という観点では好ましくは0.438~0.602の間で設定される値である。
マーカー分子がHA及びCOL4-7Sである場合、基準値は例えば、0.354~0.562の間で設定される値であり、Type-4の病態の正診率の向上という観点では好ましくは0.354~0.451の間で設定される値であり、Type-1~Type-3の病態の正診率の向上という観点では好ましくは0.451~0.562の間で設定される値である。
マーカー分子がHA及びCOL4である場合、基準値は例えば、0.36~0.522の間で設定される値であり、Type-4の病態の正診率の向上という観点では0.36~0.408の間で設定される値であり、Type-1~Type-3の病態の正診率の向上という観点では好ましくは0.408~0.522の間で設定される値である。
マーカー分子がHA及びCTSDである場合、基準値は例えば、0.311~0.545の間で設定される値であり、Type-4の病態の正診率の向上という観点では好ましくは0.311~0.432の間で設定される値であり、Type-1~Type-3の病態の正診率の向上という観点では好ましくは0.432~0.545の間で設定される値である。
マーカー分子がCTSD及びCOL4である場合、基準値は例えば、0.317~0.544の間で設定される値であり、Type-4の病態の正診率の向上という観点では好ましくは0.317~0.436の間で設定される値であり、Type-1~Type-3の病態の正診率の向上という観点では好ましくは0.436~0.544の間で設定される値である。
マーカー分子がCTSD及びCOL4-7Sである場合、基準値は例えば、0.364~0.604の間で設定される値であり、Type-4の病態の正診率の向上という観点では好ましくは0.364~0.475の間で設定される値であり、Type-1~Type-3の病態の正診率の向上という観点では好ましくは0.475~0.604の間で設定される値である。
マーカー分子がVCAM1及びHAである場合、基準値は例えば、0.357~0.572の間で設定される値であり、Type-4の病態の正診率の向上という観点では好ましくは0.357~0.403の間で設定される値であり、Type-1~Type-3の病態の正診率の向上という観点では好ましくは0.403~0.572の間で設定される値である。
マーカー分子がVCAM1及びCOL4-7Sである場合、基準値は例えば、0.356~0.603の間で設定される値であり、Type-4の病態の正診率の向上という観点では好ましくは0.356~0.426の間で設定される値であり、Type-1~Type-3の病態の正診率の向上という観点では好ましくは0.426~0.603の間で設定される値である。
マーカー分子がHA及びCOL4-7Sである場合、基準値は例えば、0.331~0.563の間で設定される値であり、Type-4の病態の正診率の向上という観点では好ましくは0.331~0.42の間で設定される値であり、Type-1~Type-3の病態の正診率の向上という観点では好ましくは0.42~0.563の間で設定される値である。
VCAM1の量の測定にELISA法「Human sVCAM-1/CD106 Quantikine ELISA Kit」が用いられる場合においては、基準値(血清中の濃度(ng/ml))は例えば、618.1~1239.5の間で設定される値であり、Type-4の病態の正診率の向上という観点では好ましくは618.1~840.0の間で設定される値であり、Type-1~Type-3の病態の正診率の向上という観点では好ましくは840.0~1239.5の間で設定される値である。
例えば以下の値が挙げられる。
マーカー分子が群2の少なくとも2つのマーカー分子である場合、基準値は例えば、0.087~0.848の間で設定される値である。
マーカー分子が、上記群2の全てのマーカー分子である、VCAM1である、VCAM1及びHAである、VCAM1及びCTSDである、VCAM1及びCOL4である、VCAM1及びCOL4-7Sである、HA及びCOL4-7Sである、HA及びCTSDである、HA及びCOL4である、CTSD及びCOL4である、又は、CTSD及びCOL4-7Sである場合、基準値は例えば、0.353~0.766の間で設定される値であり、Stage3又はStage4の病態の正診率の向上という観点では好ましくは0.353~0.574の間で設定される値であり、Stage0、Stage1又はStage2の病態の正診率の向上という観点では好ましくは0.453~0.766の間で設定される値である。
マーカー分子が上記群2の全てのマーカー分子である場合、基準値は例えば、0.421~0.632の間で設定される値であり、Stage3又はStage4の病態の正診率の向上という観点では好ましくは0.421~0.544の間で設定される値であり、Stage0、Stage1又はStage2の病態の正診率の向上という観点では好ましくは0.544~0.632の間で設定される値である。
マーカー分子がVCAM1である場合、基準値は例えば、0.371~0.587の間で設定される値であり、Stage3又はStage4の病態の正診率の向上という観点では好ましくは0.371~0.453の間で設定される値であり、Stage0、Stage1又はStage2の病態の正診率の向上という観点では好ましくは0.453~0.587の間で設定される値である。
マーカー分子がVCAM1及びHAである場合、基準値は例えば、0.389~0.766の間で設定される値であり、Stage3又はStage4の病態の正診率の向上という観点では好ましくは0.389~0.519の間で設定される値であり、Stage0、Stage1又はStage2の病態の正診率の向上という観点では好ましくは0.519~0.766の間で設定される値である。
マーカー分子がVCAM1及びCTSDである場合、基準値は例えば、0.406~0.718の間で設定される値であり、Stage3又はStage4の病態の正診率の向上という観点では好ましくは0.406~0.524の間で設定される値であり、Stage0、Stage1又はStage2の病態の正診率の向上という観点では好ましくは0.524~0.718の間で設定される値である。
マーカー分子がVCAM1及びCOL4である場合、基準値は例えば、0.407~0.678の間で設定される値であり、Stage3又はStage4の病態の正診率の向上という観点では好ましくは0.407~0.534の間で設定される値であり、Stage0、Stage1又はStage2の病態の正診率の向上という観点では好ましくは0.534~0.678の間で設定される値である。
マーカー分子がVCAM1及びCOL4-7Sである場合、基準値は例えば、0.413~0.685の間で設定される値であり、Stage3又はStage4の病態の正診率の向上という観点では好ましくは0.413~0.574の間で設定される値であり、Stage0、Stage1又はStage2の病態の正診率の向上という観点では好ましくは0.574~0.685の間で設定される値である。
マーカー分子がHA及びCOL4-7Sである場合、基準値は例えば、0.398~0.7の間で設定される値であり、Stage3又はStage4の病態の正診率の向上という観点では好ましくは0.398~0.539の間で設定される値であり、Stage0、Stage1又はStage2の病態の正診率の向上という観点では好ましくは0.539~0.7の間で設定される値である。
マーカー分子がHA及びCOL4である場合、基準値は例えば、0.392~0.683の間で設定される値であり、Stage3又はStage4の病態の正診率の向上という観点では好ましくは0.392~0.463の間で設定される値であり、Stage0、Stage1又はStage2の病態の正診率の向上という観点では好ましくは0.463~0.683の間で設定される値である。
マーカー分子がHA及びCTSDである場合、基準値は例えば、0.373~0.69の間で設定される値であり、Stage3又はStage4の病態の正診率の向上という観点では好ましくは0.373~0.465の間で設定される値であり、Stage0、Stage1又はStage2の病態の正診率の向上という観点では好ましくは0.465~0.69の間で設定される値である。
マーカー分子がCTSD及びCOL4である場合、基準値は例えば、0.353~0.635の間で設定される値であり、Stage3又はStage4の病態の正診率の向上という観点では好ましくは0.353~0.469の間で設定される値であり、Stage0、Stage1又はStage2の病態の正診率の向上という観点では好ましくは0.469~0.635の間で設定される値である。
マーカー分子がCTSD及びCOL4-7Sである場合、基準値は例えば、0.403~0.676の間で設定される値であり、Stage3又はStage4の病態の正診率の向上という観点では好ましくは0.403~0.559の間で設定される値であり、Stage0、Stage1又はStage2の病態の正診率の向上という観点では好ましくは0.559~0.676の間で設定される値である。
マーカー分子がVCAM1及びHAである場合、基準値は例えば、0.381~0.759の間で設定される値であり、Stage3又はStage4の病態の正診率の向上という観点では好ましくは0.381~0.526の間で設定される値であり、Stage0、Stage1又はStage2の病態の正診率の向上という観点では好ましくは0.526~0.759の間で設定される値である。
マーカー分子がVCAM1及びCOL4-7Sである場合、基準値は例えば、0.394~0.71の間で設定される値であり、Stage3又はStage4の病態の正診率の向上という観点では好ましくは0.394~0.565の間で設定される値であり、Stage0、Stage1又はStage2の病態の正診率の向上という観点では好ましくは0.565~0.71の間で設定される値である。
マーカー分子がHA及びCOL4-7Sである場合、基準値は例えば、0.373~0.698の間で設定される値であり、Stage3又はStage4の病態の正診率の向上という観点では好ましくは0.373~0.563の間で設定される値であり、Stage0、Stage1又はStage2の病態の正診率の向上という観点では好ましくは0.563~0.698の間で設定される値である。
VCAM1の量の測定にELISA法「Human sVCAM-1/CD106 Quantikine ELISA Kit」が用いられる場合においては、基準値(血清中の濃度(ng/ml))は例えば、789.8~1344.2の間で設定される値であり、Stage3又はStage4の病態の正診率の向上という観点では好ましくは789.8~1029.3の間で設定される値であり、Stage0、Stage1又はStage2の病態の正診率の向上という観点では好ましくは1029.3~1344.2の間で設定される値である。

また、本実施形態の別の他の側面では、本実施形態に係る上記方法に使用するためのキットであって、VCAM1を検出するための試薬を含むキットを提供する。上記キットは、非アルコール性脂肪肝炎(NASH)を罹患している、肝臓の線維化の病態である、肝臓の線維化の進展度が高い、肝細胞の風船様変性の病態の進展度が高い、肝臓の炎症の進展度が高い、肝肥大の病態である、肝細胞の壊死の病態である、肝細胞のアポトーシスの病態である、肝細胞の変性の病態である、肝臓の脂肪化の病態である、又はそれらの可能性があるかを判定するための診断薬として把握することもできる。
本実施形態に係る方法に使用するためのプログラムは、コンピュータを、上述した取得手段D1、規格化手段D2、比較手段D3、判定手段D4、及び表示手段D5として機能させるものである。別の側面では、上記プログラムは、コンピュータに後述する取得ステップS1、規格化ステップS2、比較ステップS3、判定ステップS4及び表示ステップS5を実行させる。コンピュータに上記プログラムを読み込ませることにより、コンピュータは肝疾患判定装置11として動作する。上記プログラムは、例えば、記録媒体に格納されて提供される。なお、記録媒体としては、フレキシブルディスク、CD、DVD等の記録媒体、ROM等の記録媒体、又は半導体メモリ等が例示される。
次に、肝疾患判定装置11により行われる肝疾患の判定方法について説明する。図13は、肝疾患の判定方法のフローチャートである。肝疾患判定装置11により行われる上記判定方法により、肝疾患の病態を有するか否かの判定を定量的且つ自動的に精度高く行うことができる。
最初に、取得手段D1が測定装置1からの測定データ(被験者から採取された血液に含まれる上記マーカー分子の量の測定データ)を取得する。
次に、規格化手段D2が、取得手段D1によって取得した上記測定データから上記式1に基づいて規格化スコアを算出し、算出された規格化スコアから指標値を求める。上記測定データは、取得手段D1によって取得する代わりに、予め得られた測定データを肝疾患判定装置11に入力してもよい。また、上記規格化スコアをそのまま指標値としてもよい。
次に、比較手段D3が、規格化手段D2によって求められた指標値を、基準値と比較する。測定するマーカー分子が1種類である場合、規格化ステップS2を行うことなく、取得手段D1によって取得した上記測定データを指標値として用いて比較ステップS3を行ってもよい。
次に、判定手段D4が、比較した結果に基づき、肝疾患の病態を有するか否かを判定する。例えば、指標値が、基準値よりも大きい場合に、被験者が、非アルコール性脂肪肝炎(NASH)を罹患している、肝臓の線維化の病態である、肝臓の線維化の進展度、肝細胞の風船様変性の病態の進展度、もしくは、肝臓の炎症の進展度が高い、肝肥大の病態である、肝細胞の壊死の病態である、肝細胞のアポトーシスの病態である、肝細胞の変性の病態である、肝臓の脂肪化の病態である、又はそれらの可能性があると判定する。
次に、表示手段D5が、判定ステップS4にて判定した結果を表示する。例えば、対象が肝疾患の病態を有するか否か等が表示手段D5によって表示される。
予めマテオーニ分類によってNASHの患者及びNAFLの患者に分類された132名の患者について、下記表4に示した生体分子(マーカー分子)の血液中の量を測定した。上記生体分子のうち、ALB、ALT、AST、COL4-7S及びINSIVDは、日本において薬事承認されている体外診断用医薬品を用いて測定した。具体的には、ALBは色素結合法の1種であるBCP改良法によって測定した。ALT及びASTは酵素活性測定法によって測定した。COL4-7SはRIA法によって測定した。INSIVDはCLIA法によって測定した。CK-18は市販の評価キット(M30 Apoptosense(登録商標) ELISA)によって測定した。HAは市販の評価キット(Hyaluronan Quantikine ELISA Kit)によって測定した。Mac-2bpは市販の評価キット(Human Mac-2 binding protein (Mac-2bp) Assay Kit - IBL)によって測定した。市販の評価キットを用いた際に、マルチモードマイクロプレートリーダー「Spectramax M5」(Molecular Devices社製)を用いた。P3NPは市販の評価キット(ELISA Kit for Procollagen III N-Terminal Propeptide (PIIINP))によって測定した。その他の生体分子は、Myriad RBM社の提供する多重免疫測定サービスHuman DiscoveryMAP(登録商標) 250+(v. 2.0)を利用して測定した。

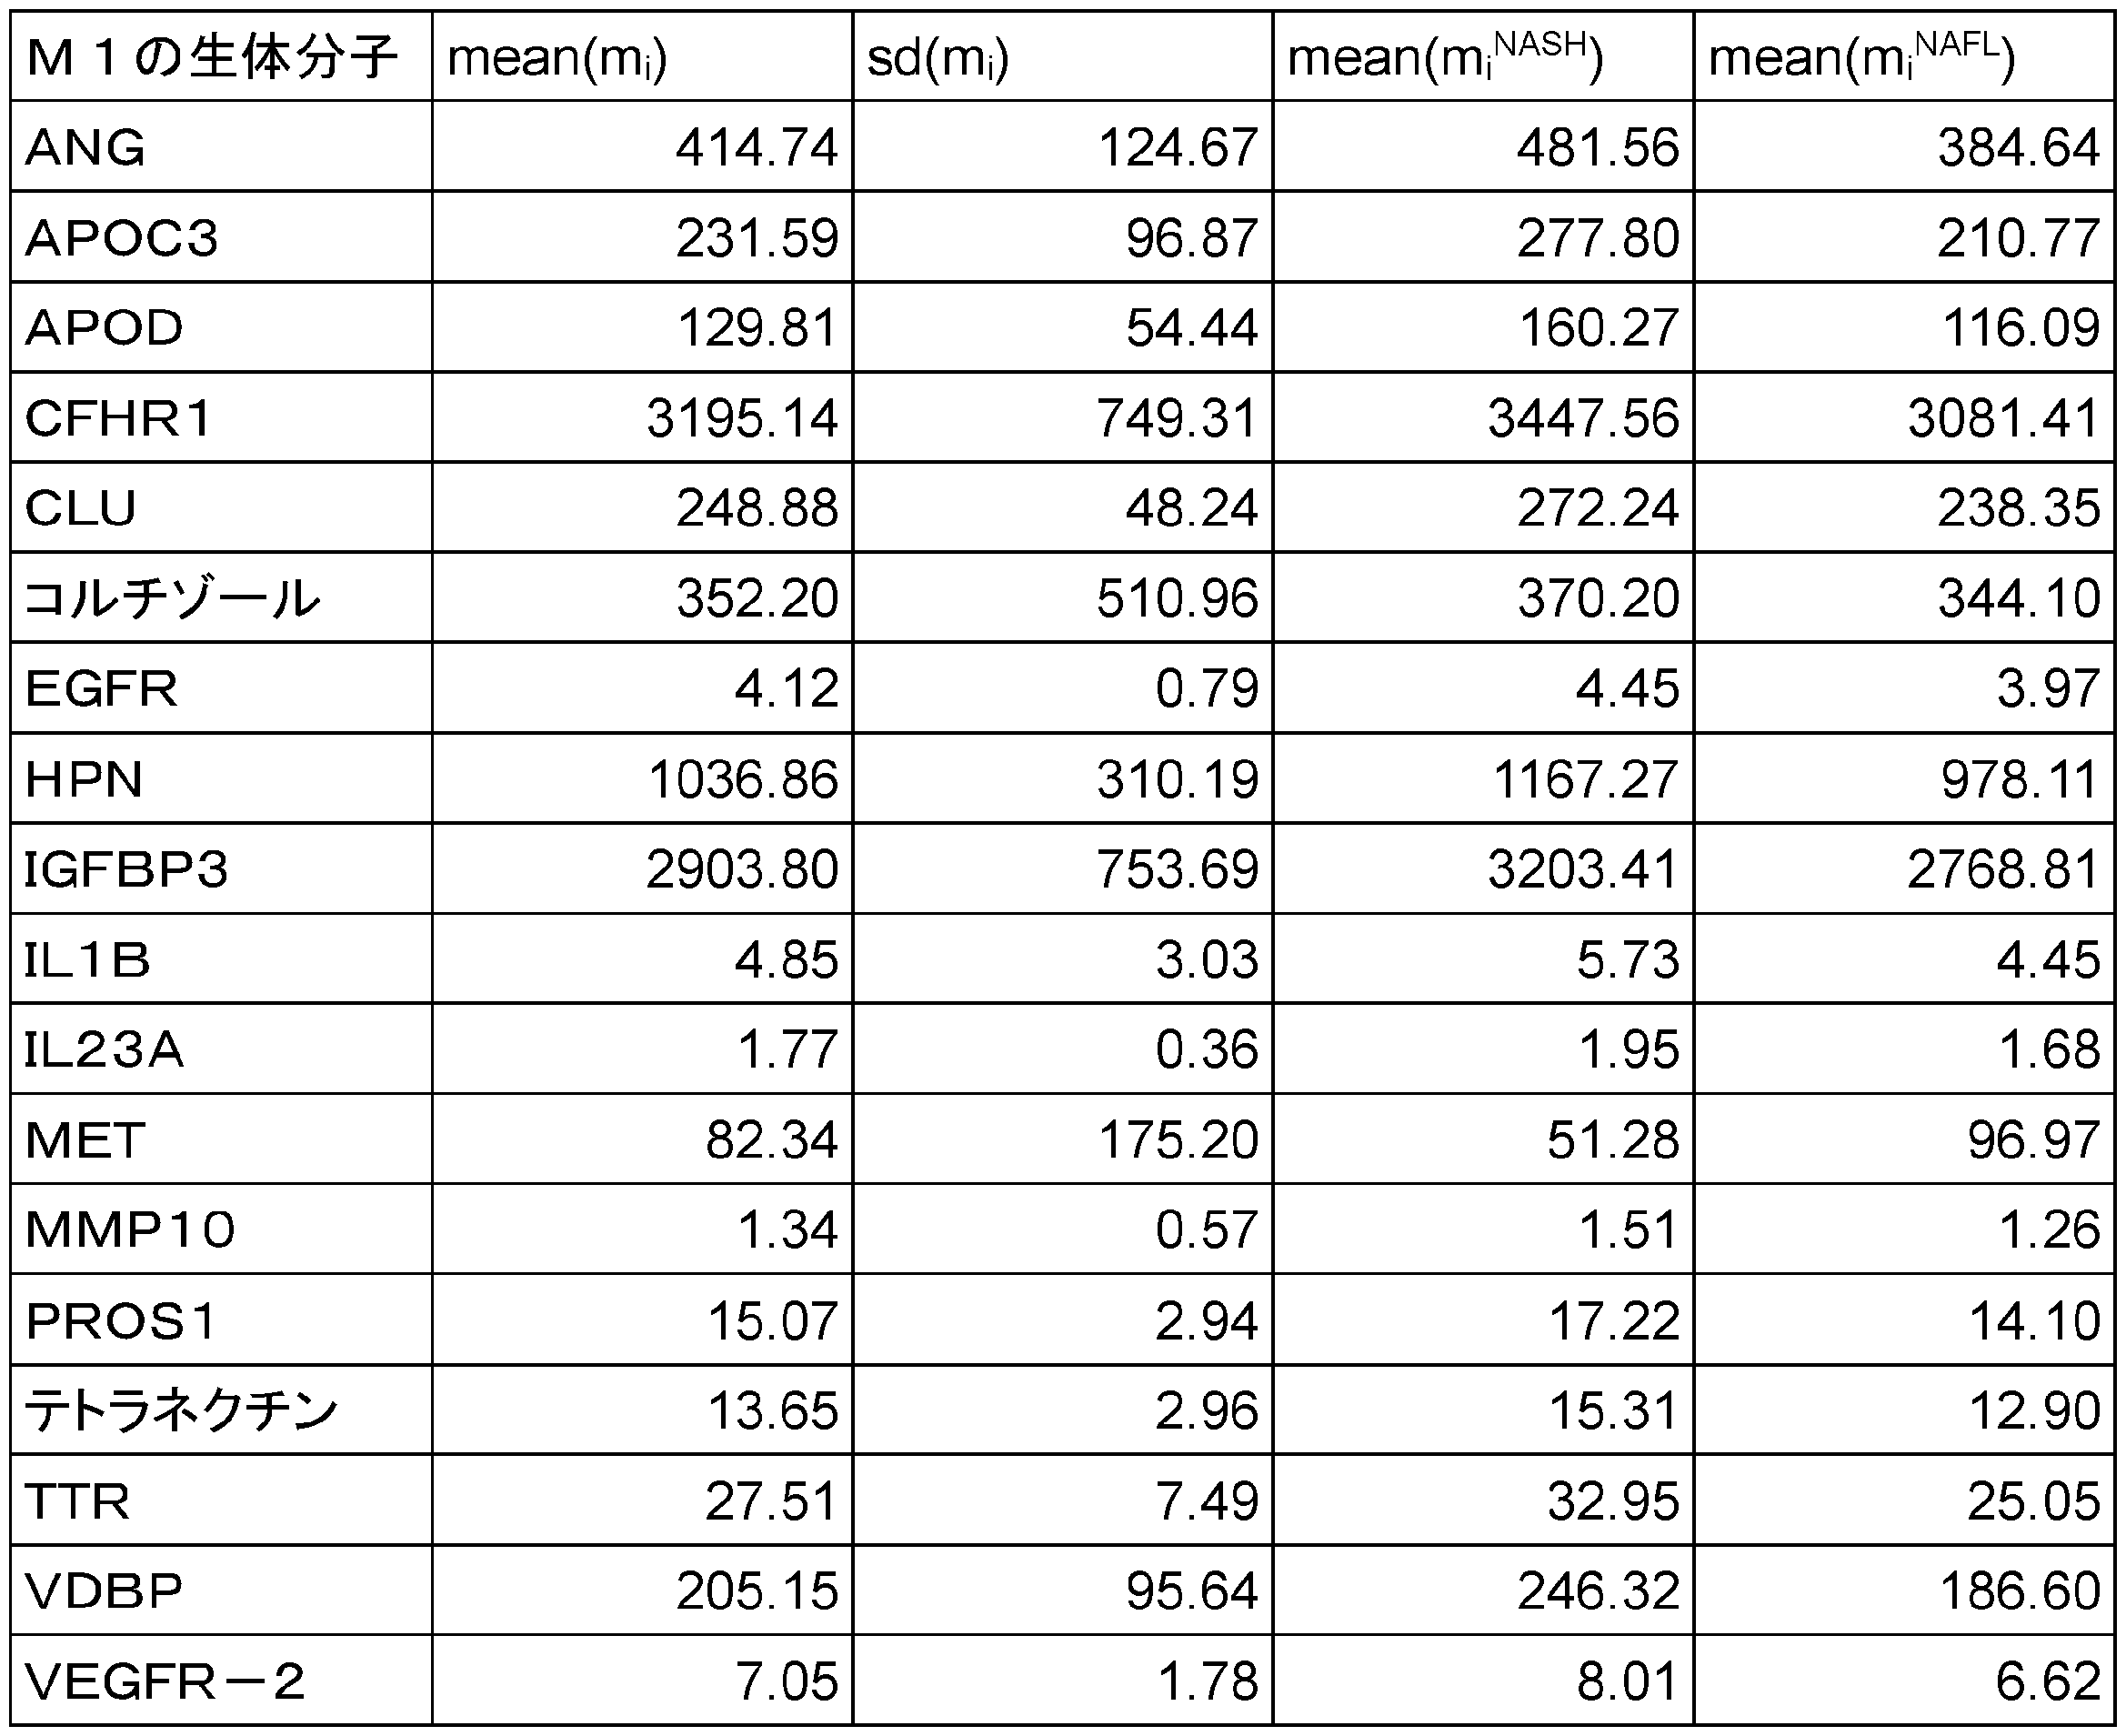

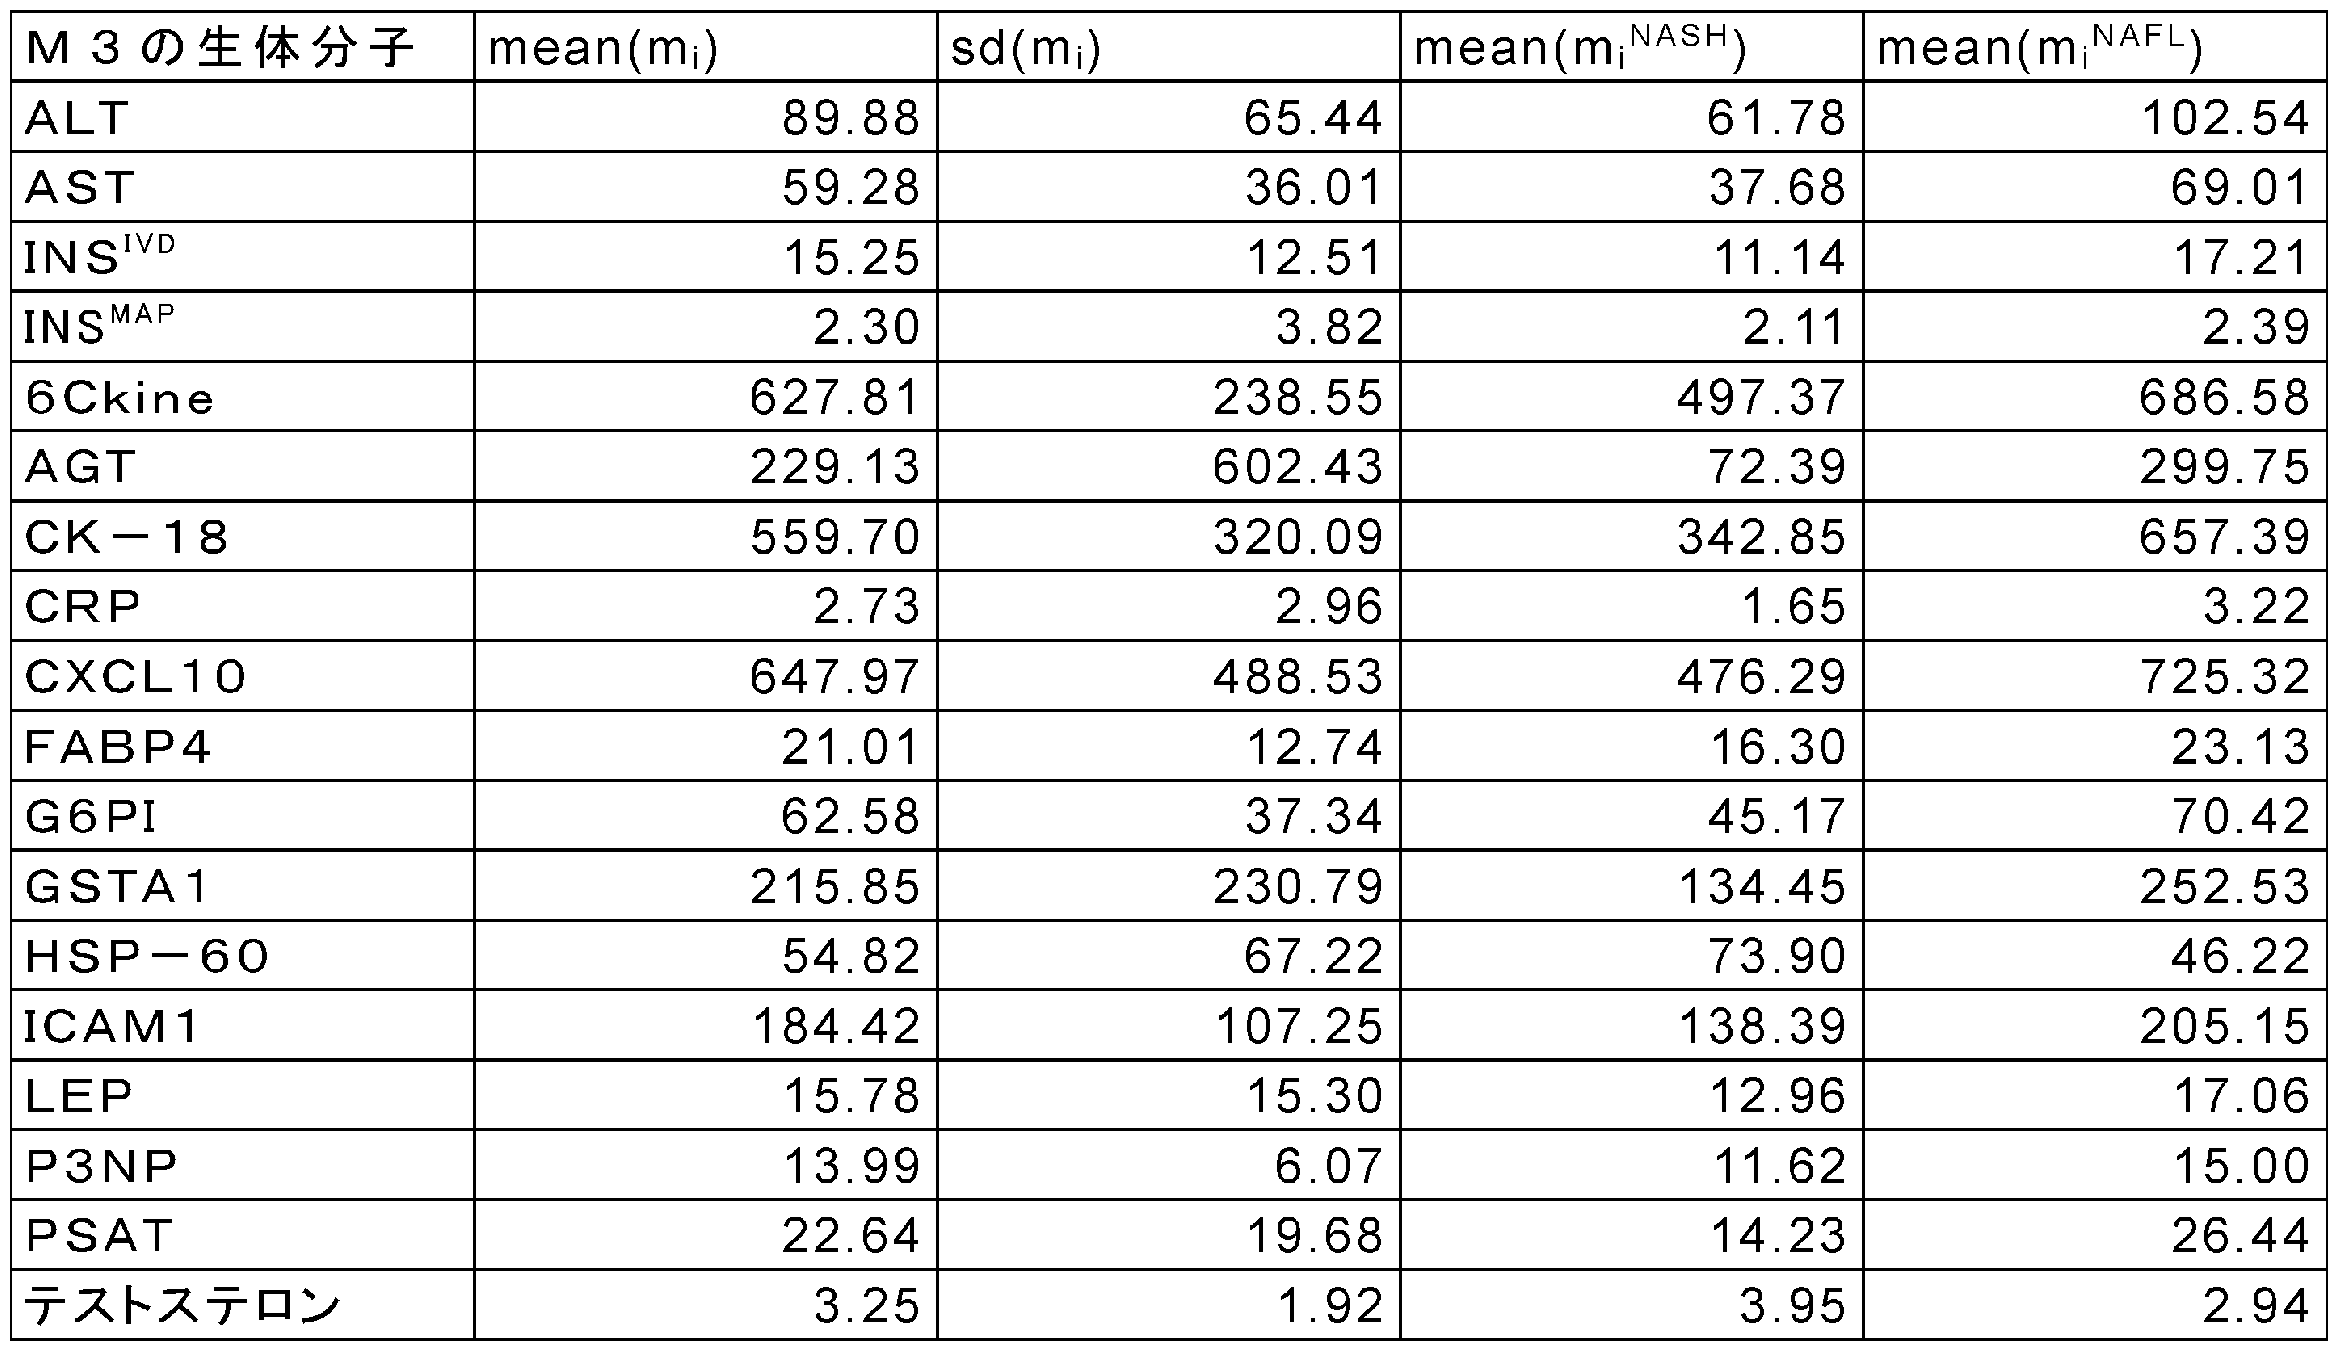

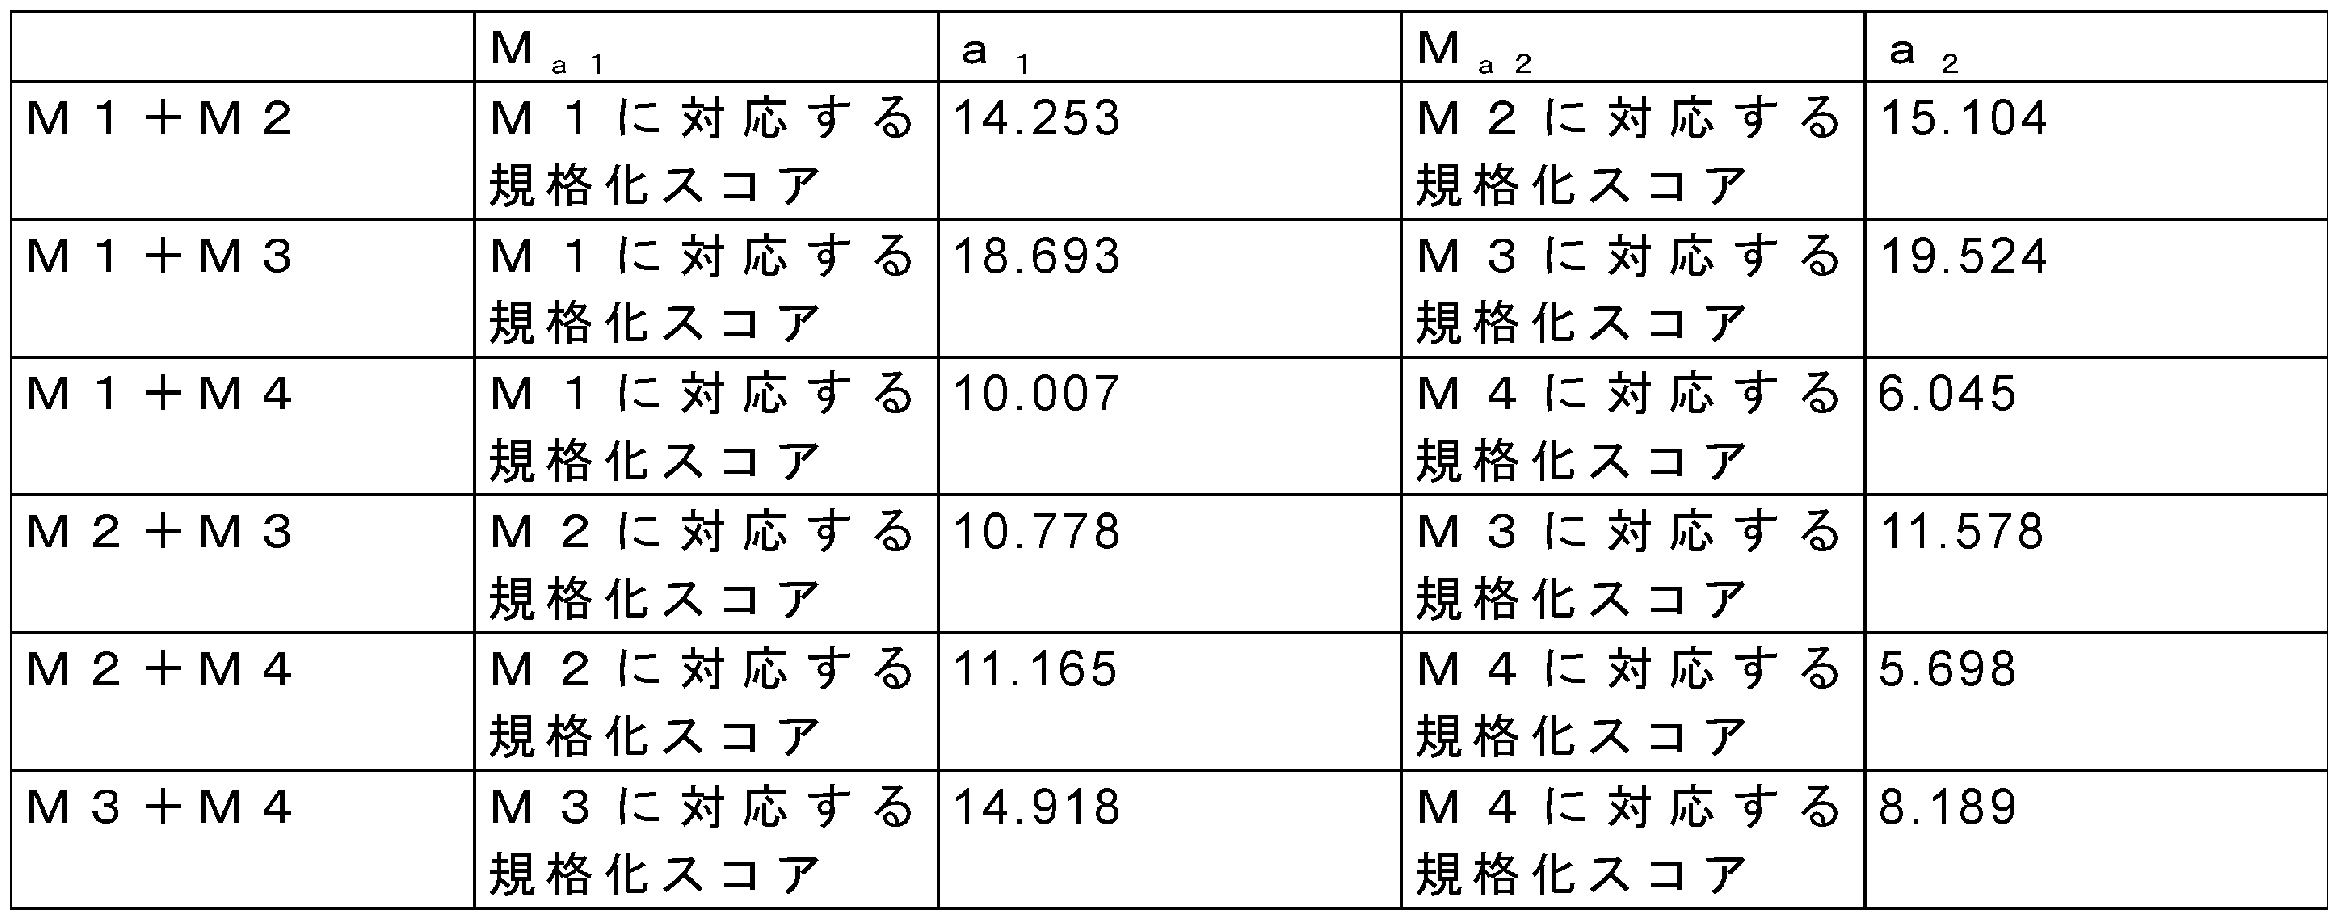
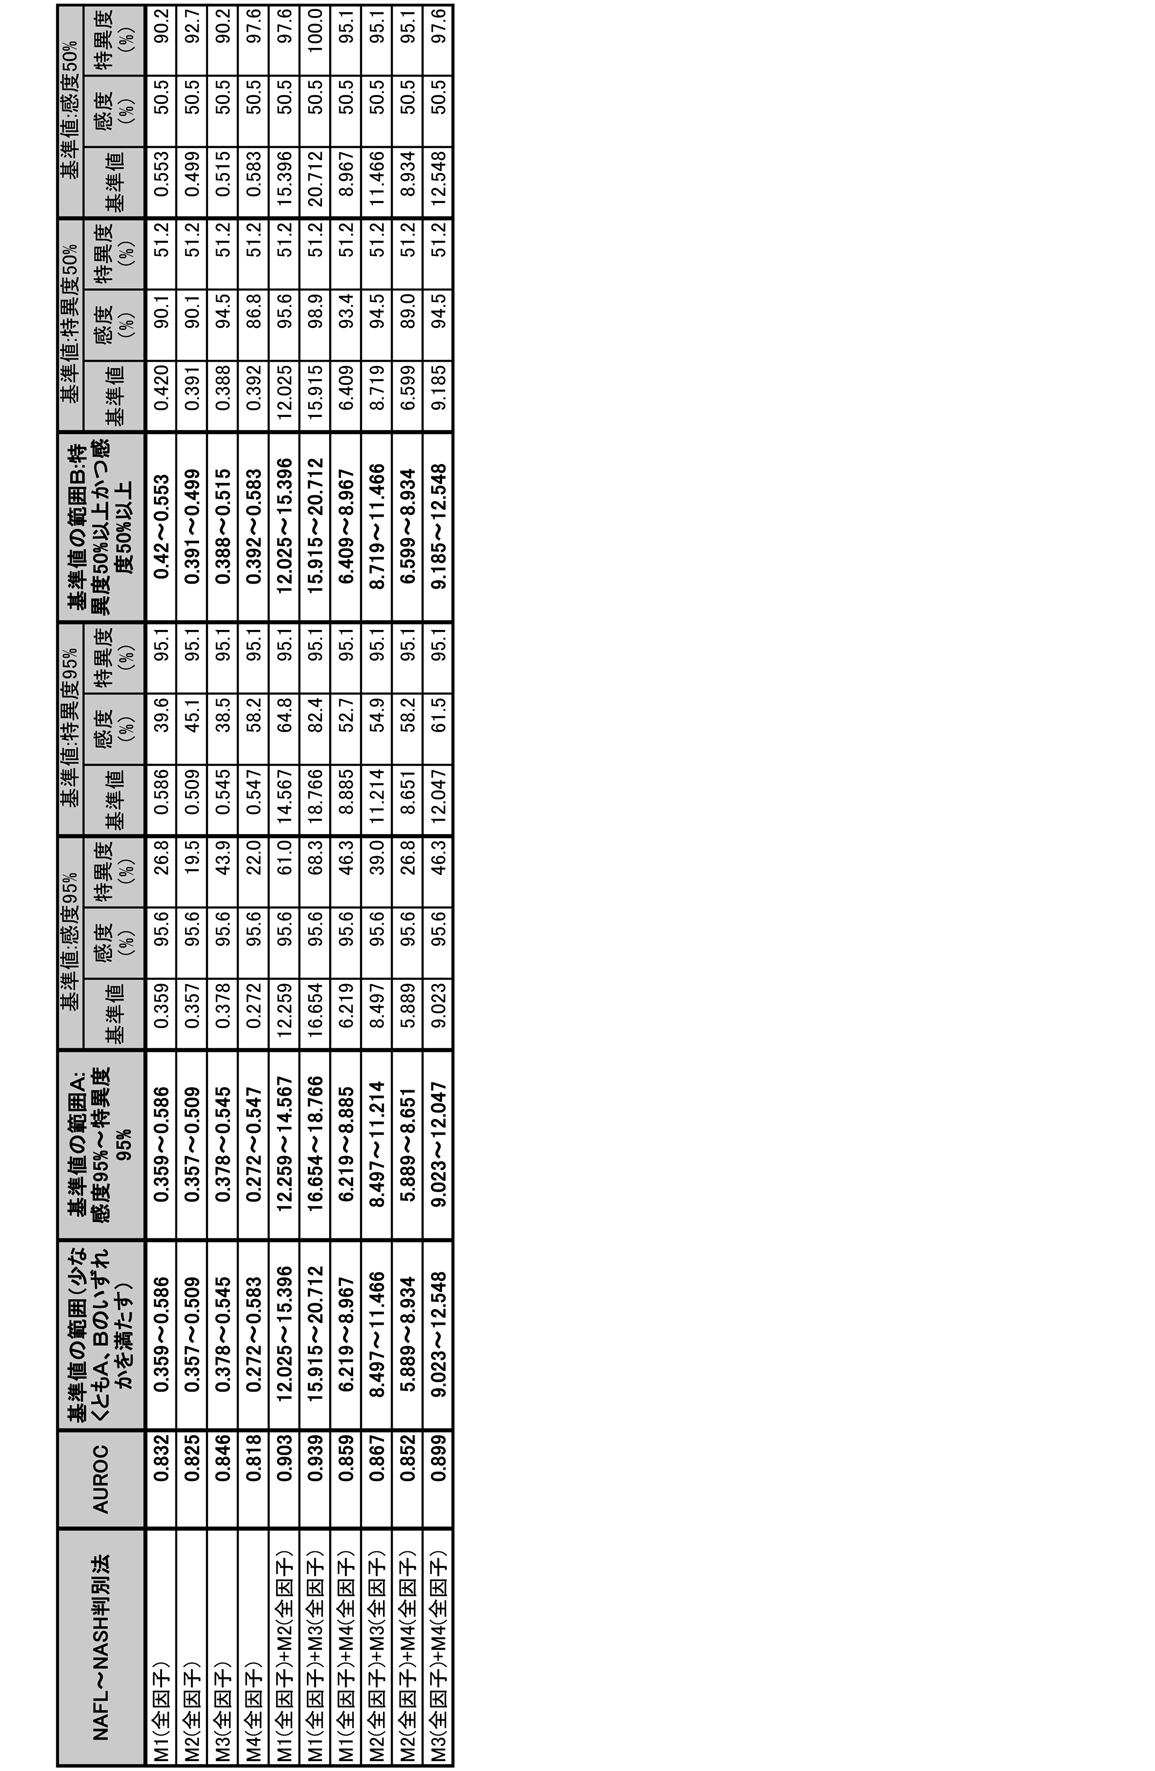
上記マーカー分子が、上記群1及び群2より選ばれる場合は、
M1a≧0.476ならばI=2、M1a<0.476かつM2a≧0.466ならばI=1 、M1a<0.476かつM2a<0.466ならばI=0 (決定木1)
上記マーカー分子が、上記群1及び群3より選ばれる場合は、
M3a≧0.409かつ M1a≧0.45ならばI=2、M3a≧0.409かつM1a<0.45ならばI=1、M3a<0.409ならばI=0 (決定木2)
上記マーカー分子が、上記群1及び群4より選ばれる場合は、
M4a≧0.547ならばI=2、M4a<0.547かつM1a≧0.468ならばI=1、M4a<0.547かつ M1a<0.468ならばI=0 (決定木3)
上記マーカー分子が、上記群2及び群3より選ばれる場合は、
M3a≧0.409かつM2a≧0.412ならばI=2、M3a≧0.409かつM2a<0.412ならばI=1、M3a<0.409ならばI=0 (決定木4)
上記マーカー分子が、上記群2及び群4より選ばれる場合は、
M4a≧0.547ならばI=2、M4a<0.547かつM2a≧0.413ならばI=1、M4a<0.547かつ M2a<0.413ならばI=0 (決定木5)
上記マーカー分子が、上記群3及び群4より選ばれる場合は、
M3a≧0.409ならばI=2、M3a<0.409かつM4a≧0.588ならばI=1、M3a<0.409かつM4a<0.588ならばI=0 (決定木6)
(決定木1~6において、Iは指標値を示し、M1a、M2a、M3a及びM4aはそれぞれ、上記群1、群2、群3、及び群4の規格化スコアを示す。)。
いずれの指標値においても、NAFLの患者群とNASHの患者群との間に有意な差がみられ、NAFLとNASHとの判別に有効であることがわかった。また基準値として、下記表11に示される値が有効であることが分かった。また、これらの結果から求められたAUROCを、従来技術であるNAFICスコアのAUROC(0.834)と比較したところ、従来技術と同等又はそれ以上の診断精度であることが示唆された。なお、NAFICスコアのAUROCは、本実施例の検体群を用いて算出した値である。

好ましい指標値は下記式3から算出される値が用いられる。式3において、Iは指標値を示し、Ma1及びMa2はそれぞれ、上記2つの群のうちの一方の規格化スコア及び他方の規格化スコア(「第1の規格化スコア」及び「第2の規格化スコア」)を示す。
I=(Ma1+Ma2)/2 (式3)
ここで、式3におけるMa1(第1の規格化スコア)、Ma2(第2の規格化スコア)は、下記表12に示される値を用いた。
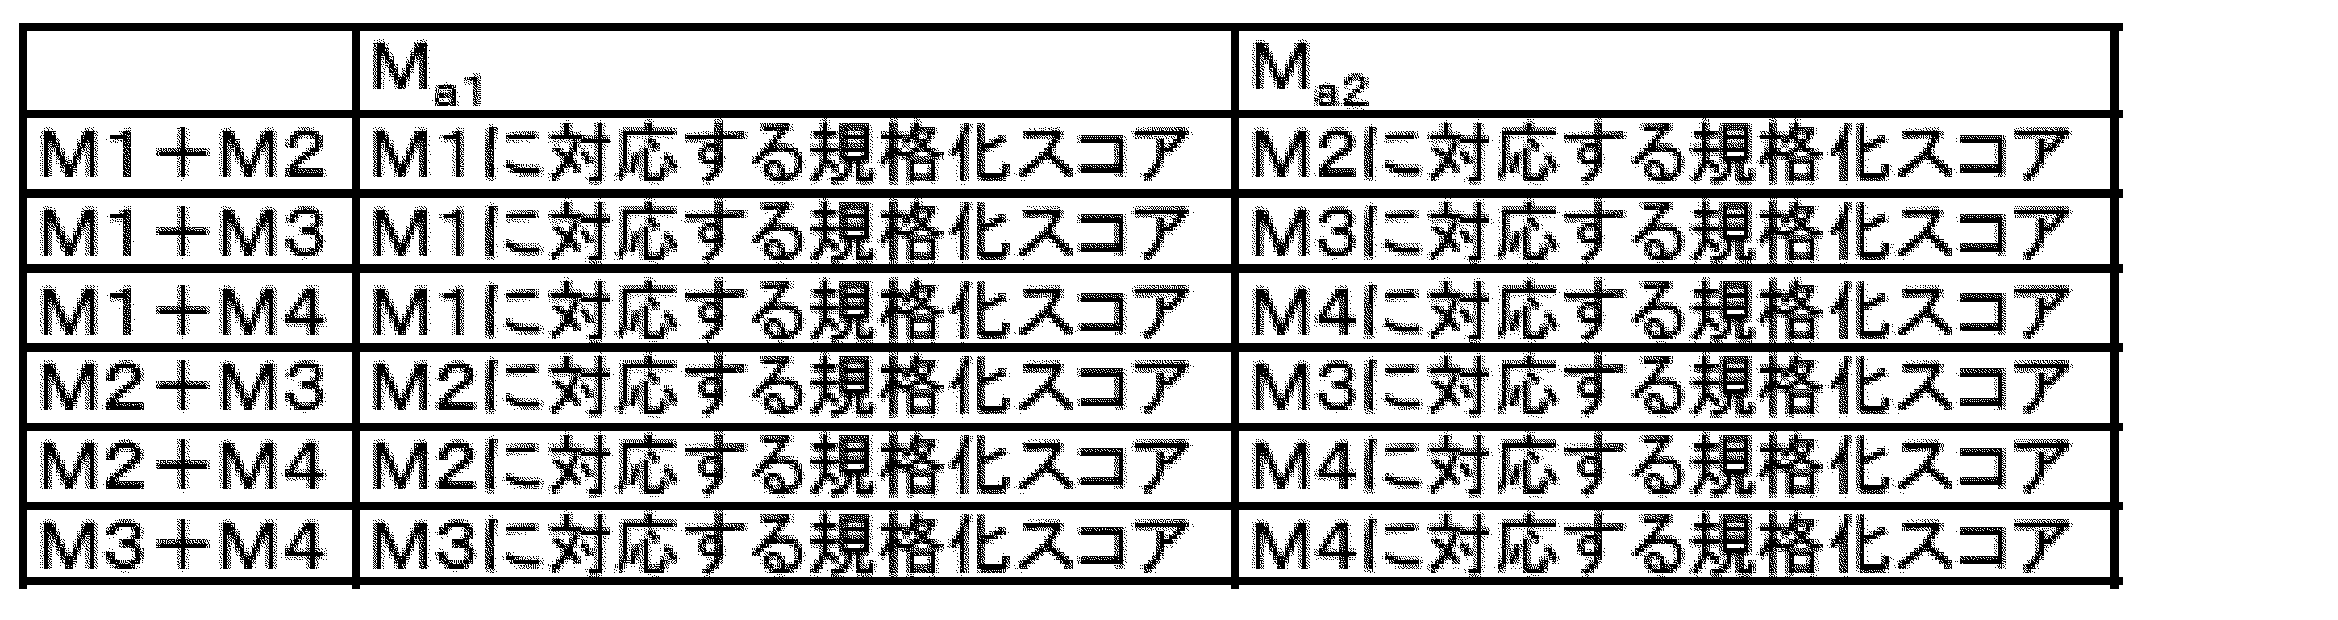
いずれの規格化スコア、指標値においても、NAFLの患者群とNASHの患者群との間に有意な差がみられ、NAFLとNASHとの判別に有効であることがわかった。また、NASHであるかどうかを判別するための基準値(カットオフ値)は、下記表13に示される値に設定することが有効であることが分かった。また、これらの結果から求められたAUROCを、従来技術であるNAFICスコアのAUROC(0.834)と比較したところ、従来技術と同等又はそれ以上の診断精度であることが示唆された。なお、NAFICスコアのAUROCは、本実施例の検体群を用いて算出した値である。
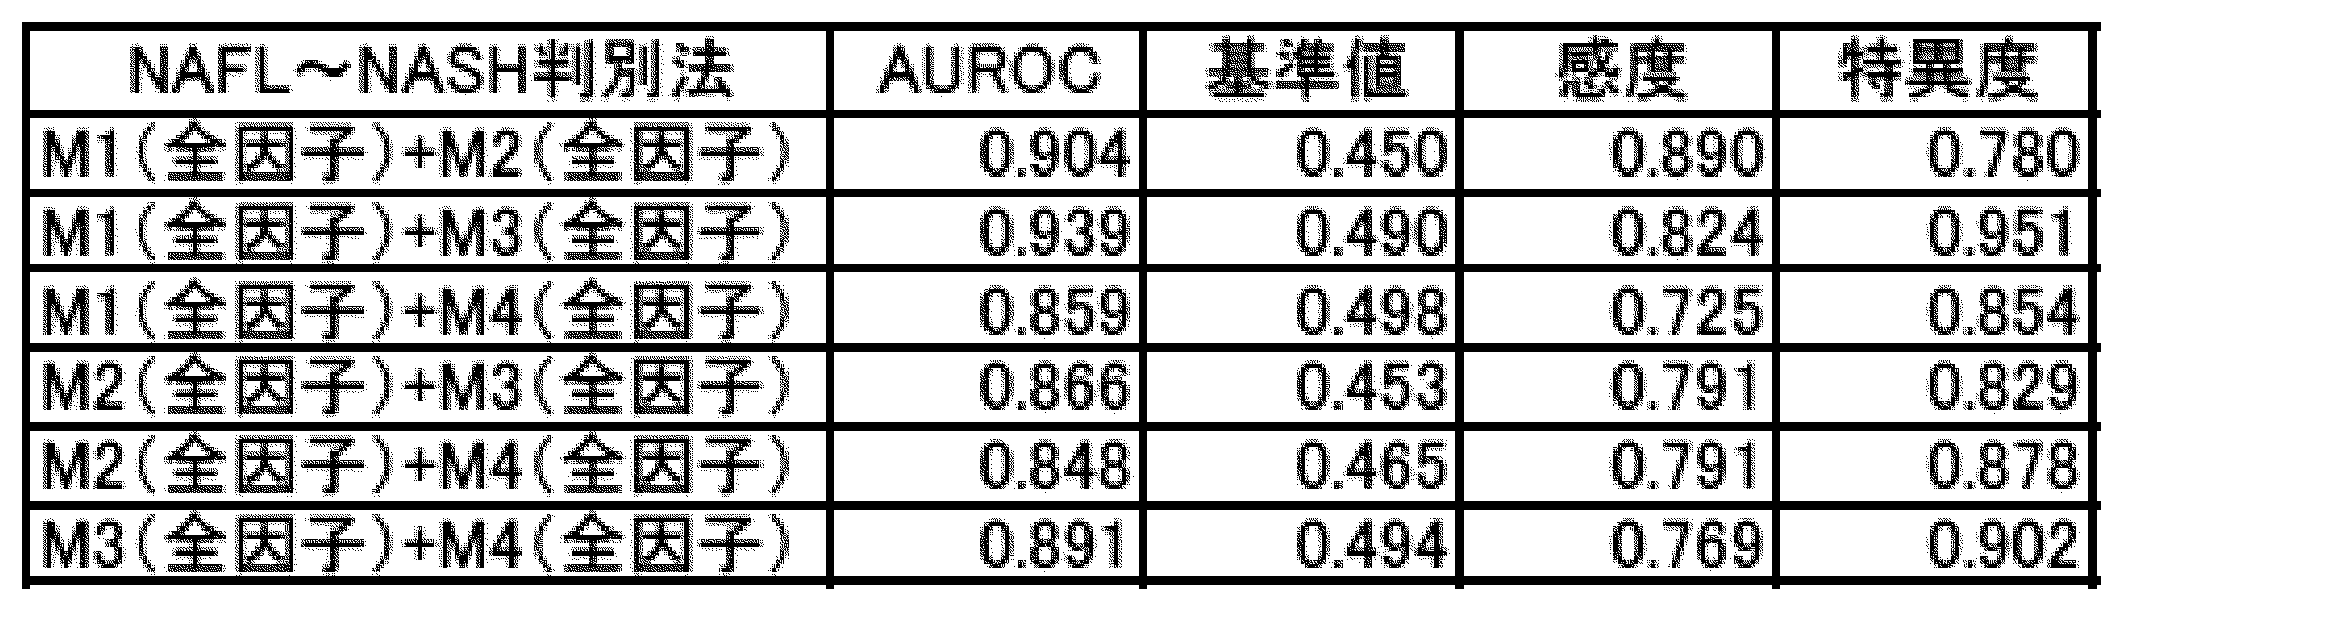
好ましい指標値は下記式4から算出される値が用いられる。式4において、Iは指標値を示し、Ma1及びMa2はそれぞれ、上記2つの群のうちの一方の規格化スコア及び他方の規格化スコア(「第1の規格化スコア」及び「第2の規格化スコア」)を示し、b1及びb2は、線形回帰分析によって定められる定数を示す。
I=b1×Ma1+b2×Ma2 (式4)
ここで、式4におけるMa1(第1の規格化スコア)、Ma2(第2の規格化スコア)、b1及びb2は、下記表14に示される値を用いた。

いずれの規格化スコア、指標値においても、NAFLの患者群とNASHの患者群との間に有意な差がみられ、NAFLとNASHとの判別に有効であることがわかった。また、NASHであるかどうかを判別するための基準値(カットオフ値)は、下記表15に示される値に設定することが有効であることが分かった。また、これらの結果から求められたAUROCを、従来技術であるNAFICスコアのAUROC(0.834)と比較したところ、従来技術と同等又はそれ以上の診断精度であることが示唆された。なお、NAFICスコアのAUROCは、本実施例の検体群を用いて算出した値である。

好ましい指標値は下記式5から算出される値が用いられる。式5において、Iは指標値を示し、Ma1及びMa2はそれぞれ、上記2つの群のうちの一方の規格化スコア及び他方の規格化スコア(「第1の規格化スコア」及び「第2の規格化スコア」)を示し、C1及びC2は、線形判別分析によって定められる定数を示す。
I=c1×Ma1+c2×Ma2 (式5)
ここで、式5におけるMa1(第1の規格化スコア)、Ma2(第2の規格化スコア)、c1及びc2は、下記表16に示される値を用いた。
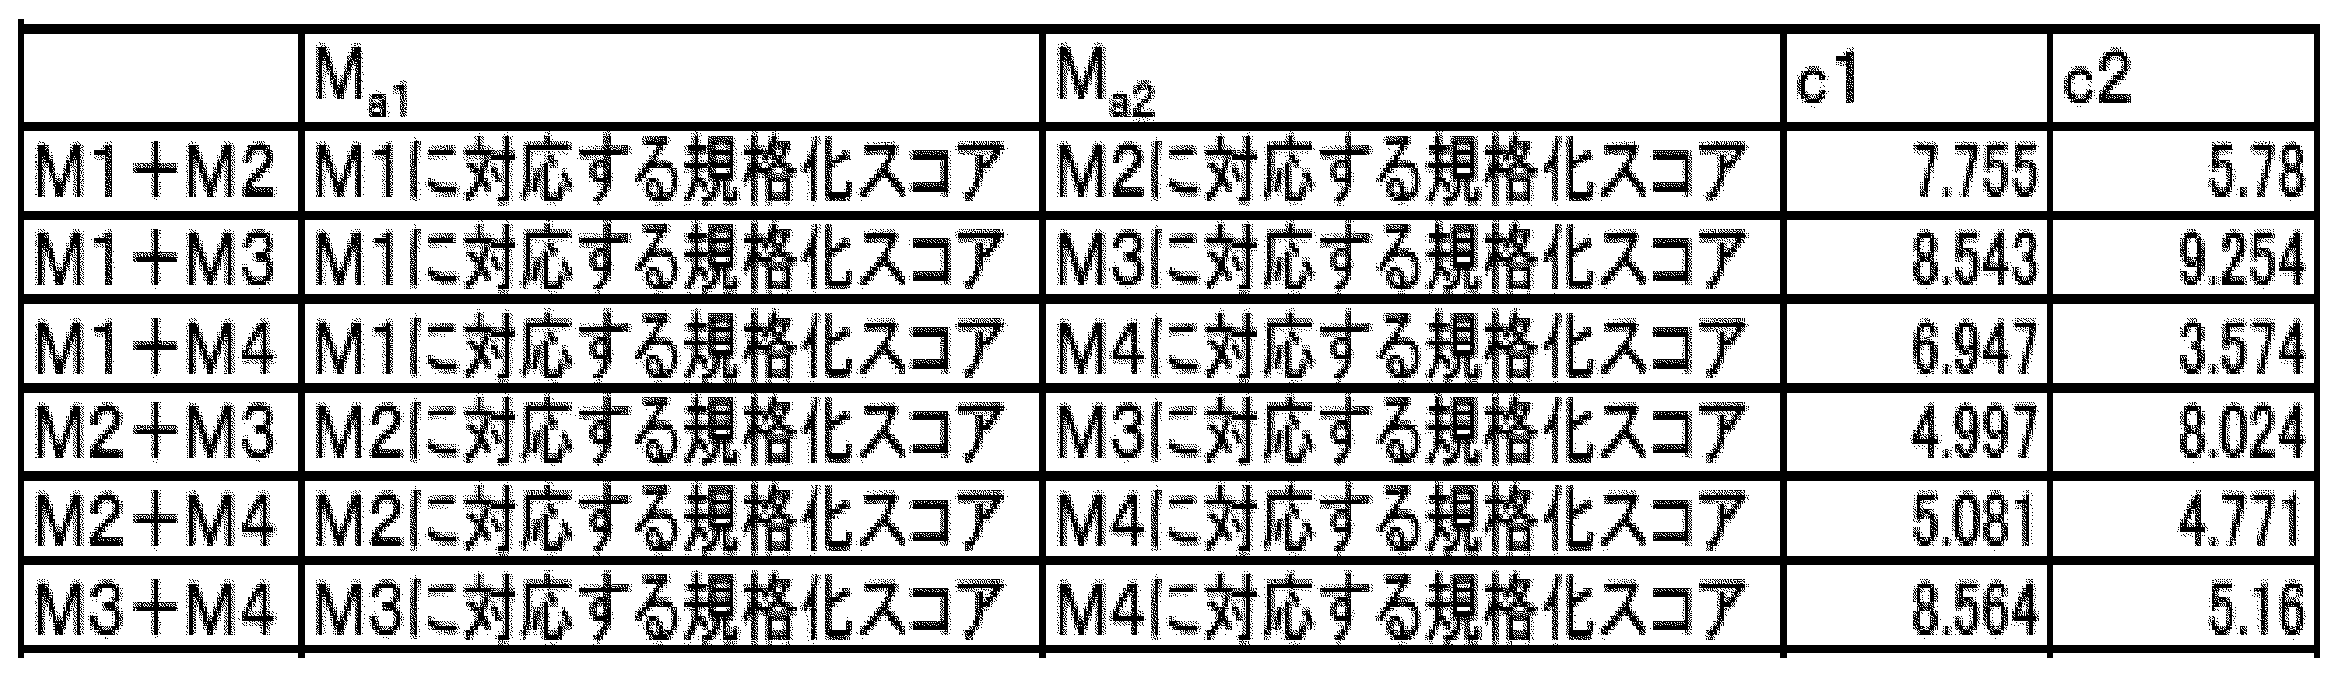
いずれの規格化スコア、指標値においても、NAFLの患者群とNASHの患者群との間に有意な差がみられ、NAFLとNASHとの判別に有効であることがわかった。また、NASHであるかどうかを判別するための基準値(カットオフ値)は、下記表17に示される値に設定することが有効であることが分かった。また、これらの結果から求められたAUROCを、従来技術であるNAFICスコアのAUROC(0.834)と比較したところ、従来技術と同等又はそれ以上の診断精度であることが示唆された。なお、NAFICスコアのAUROCは、本実施例の検体群を用いて算出した値である。
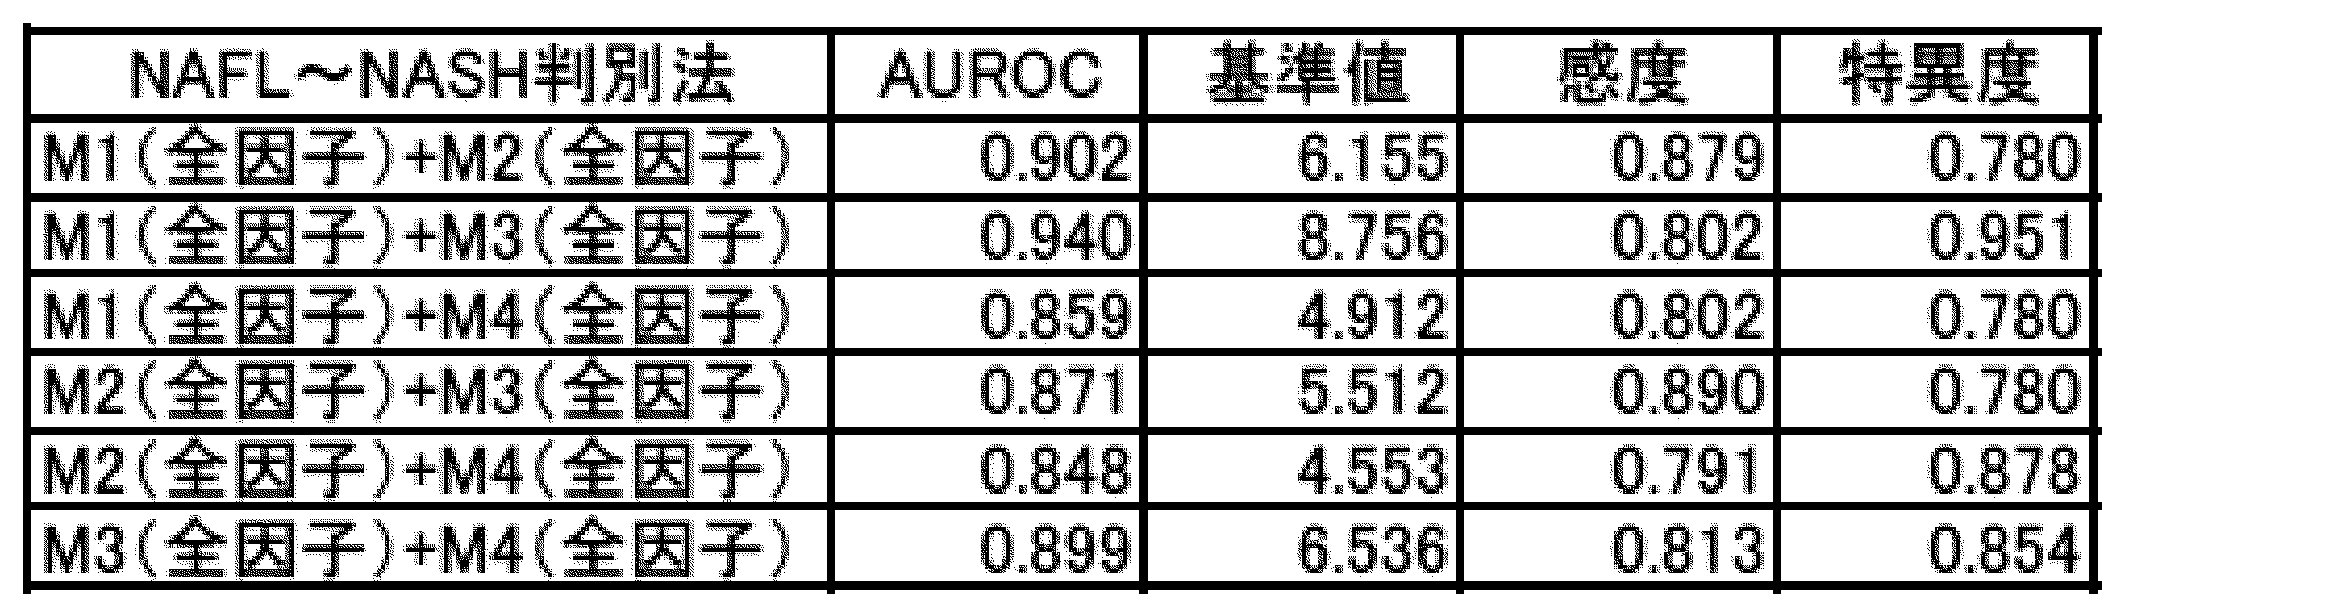
好ましい指標値は下記式6から算出される値が用いられる。式6において、Iは指標値を示し、Ma1及びMa2はそれぞれ、上記2つの群のうちの一方の規格化スコア及び他方の規格化スコア(「第1の規格化スコア」及び「第2の規格化スコア」)を示す。

ここで、式6におけるMa1(第1の規格化スコア)、Ma2(第2の規格化スコア)は、下記表18に示される値を用いた。
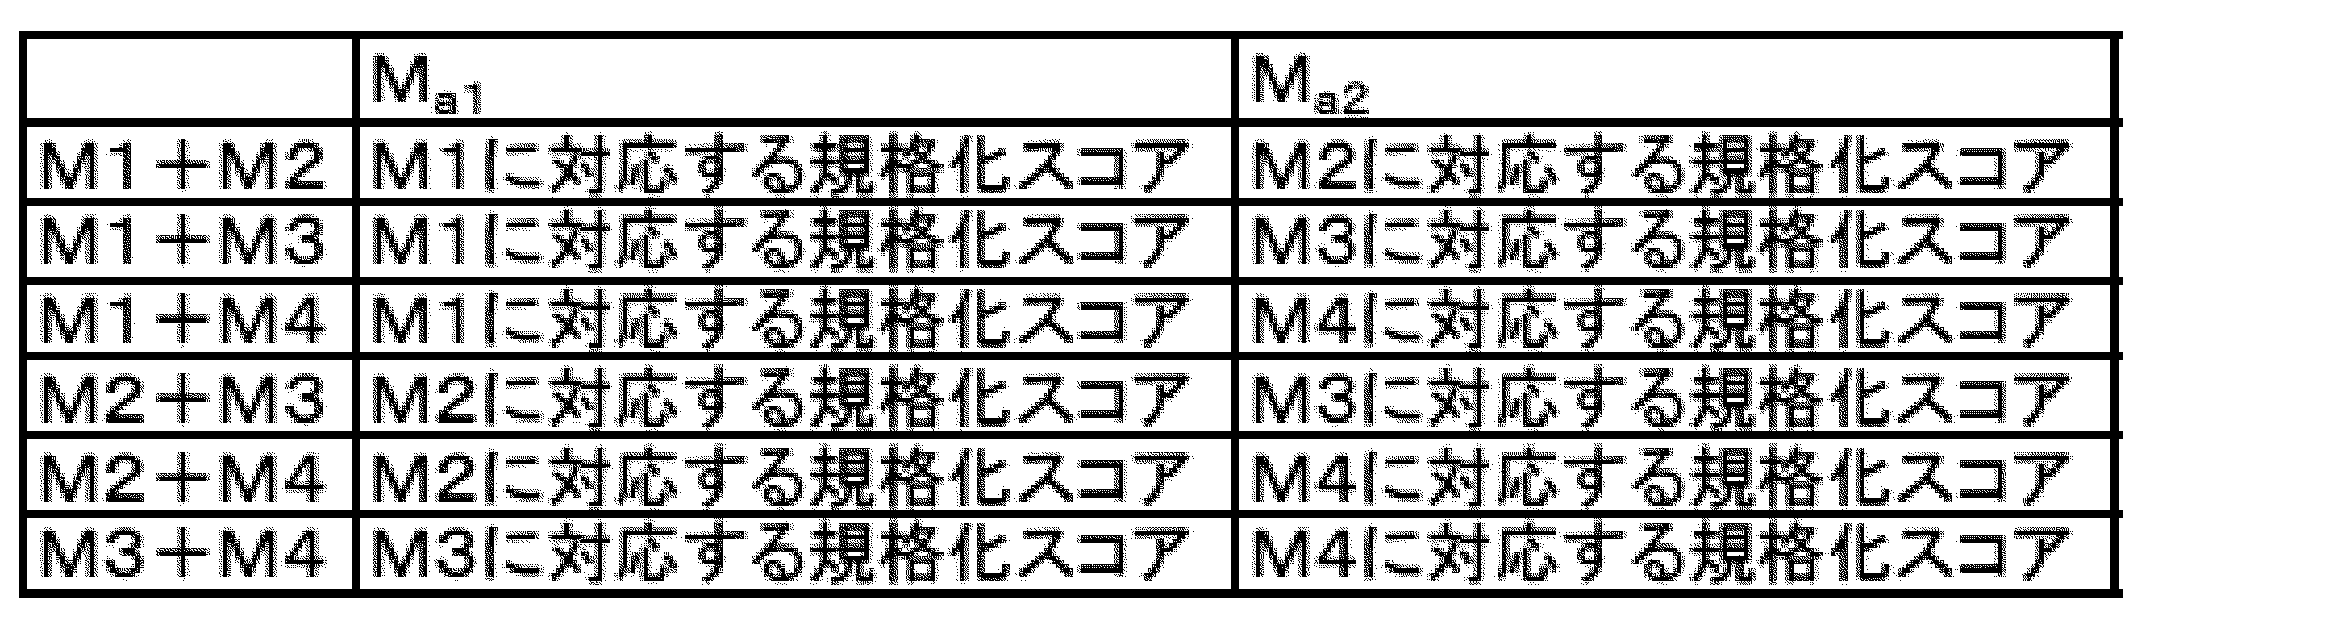
いずれの規格化スコア、指標値においても、NAFLの患者群とNASHの患者群との間に有意な差がみられ、NAFLとNASHとの判別に有効であることがわかった。また、NASHであるかどうかを判別するための基準値(カットオフ値)は、下記表19に示される値に設定することが有効であることが分かった。また、これらの結果から求められたAUROCを、従来技術であるNAFICスコアのAUROC(0.834)と比較したところ、従来技術と同等又はそれ以上の診断精度であることが示唆された。なお、NAFICスコアのAUROCは、本実施例の検体群を用いて算出した値である。
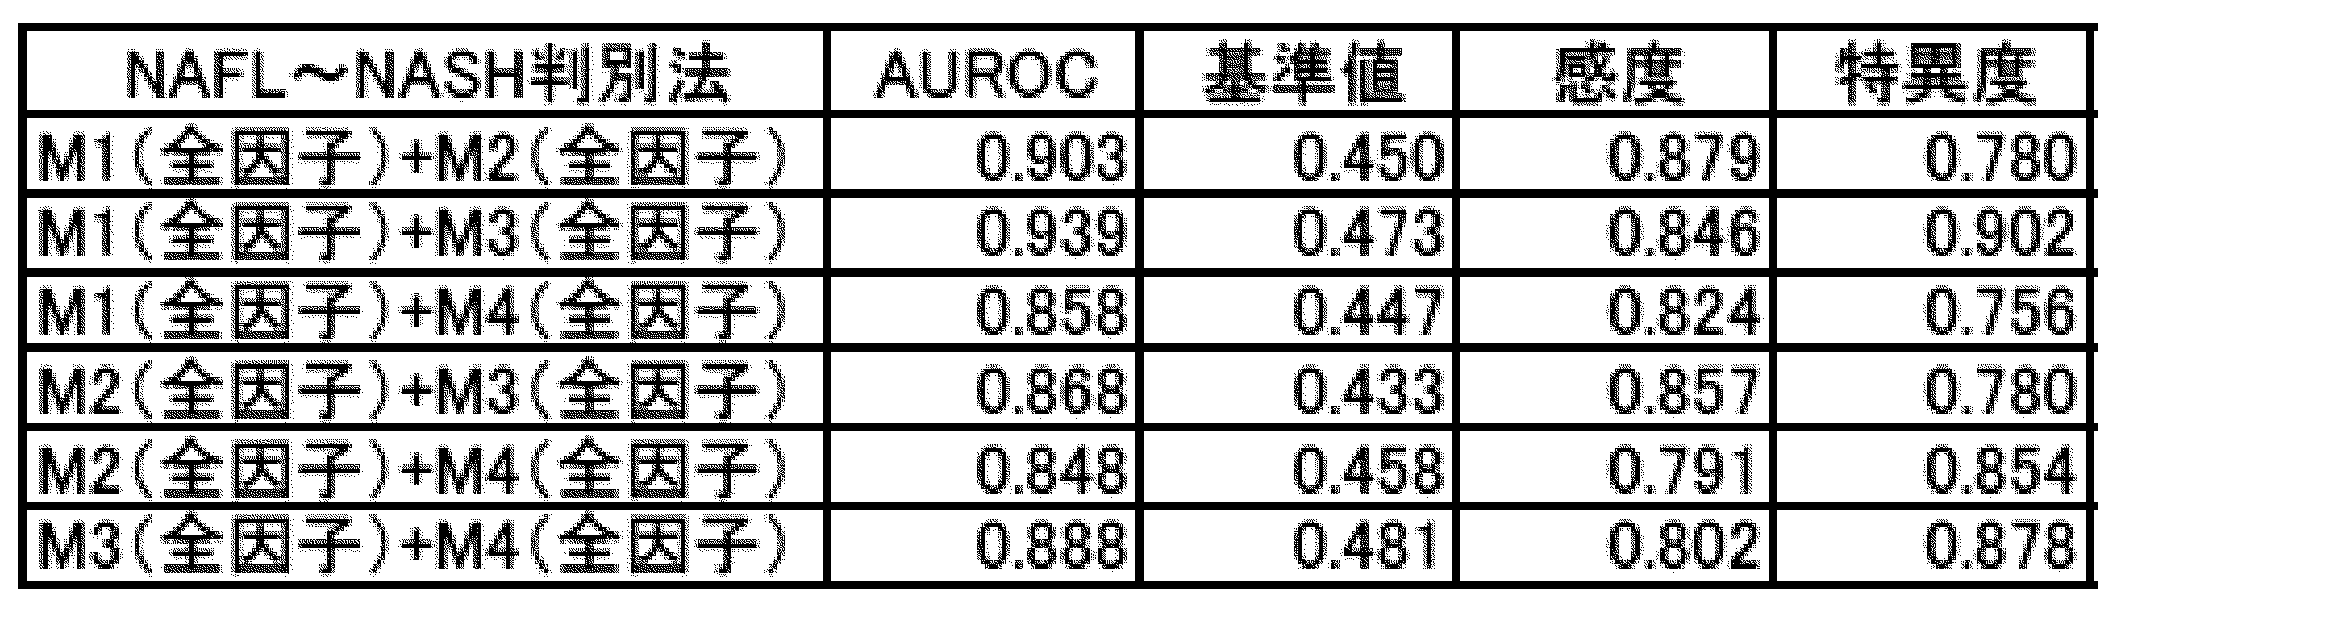
好ましい指標値は下記式7から算出される値が用いられる。式7において、Iは指標値を示し、Ma1及びMa2はそれぞれ、上記2つの群のうちの一方の規格化スコア及び他方の規格化スコア(「第1の規格化スコア」及び「第2の規格化スコア」)を示し、d1、d2及びd3は、非線形回帰分析によって定められる定数を示す。
I=d1×Ma1+d2×Ma2+d3×Ma1×Ma2 (式7)
ここで、式7におけるMa1(第1の規格化スコア)、Ma2(第2の規格化スコア)、d1、d2及びd3は、下記表20に示される値を用いた。

いずれの規格化スコア、指標値においても、NAFLの患者群とNASHの患者群との間に有意な差がみられ、NAFLとNASHとの判別に有効であることがわかった。また、NASHであるかどうかを判別するための基準値(カットオフ値)は、下記表21に示される値に設定することが有効であることが分かった。また、これらの結果から求められたAUROCを、従来技術であるNAFICスコアのAUROC(0.834)と比較したところ、従来技術と同等又はそれ以上の診断精度であることが示唆された。なお、NAFICスコアのAUROCは、本実施例の検体群を用いて算出した値である。
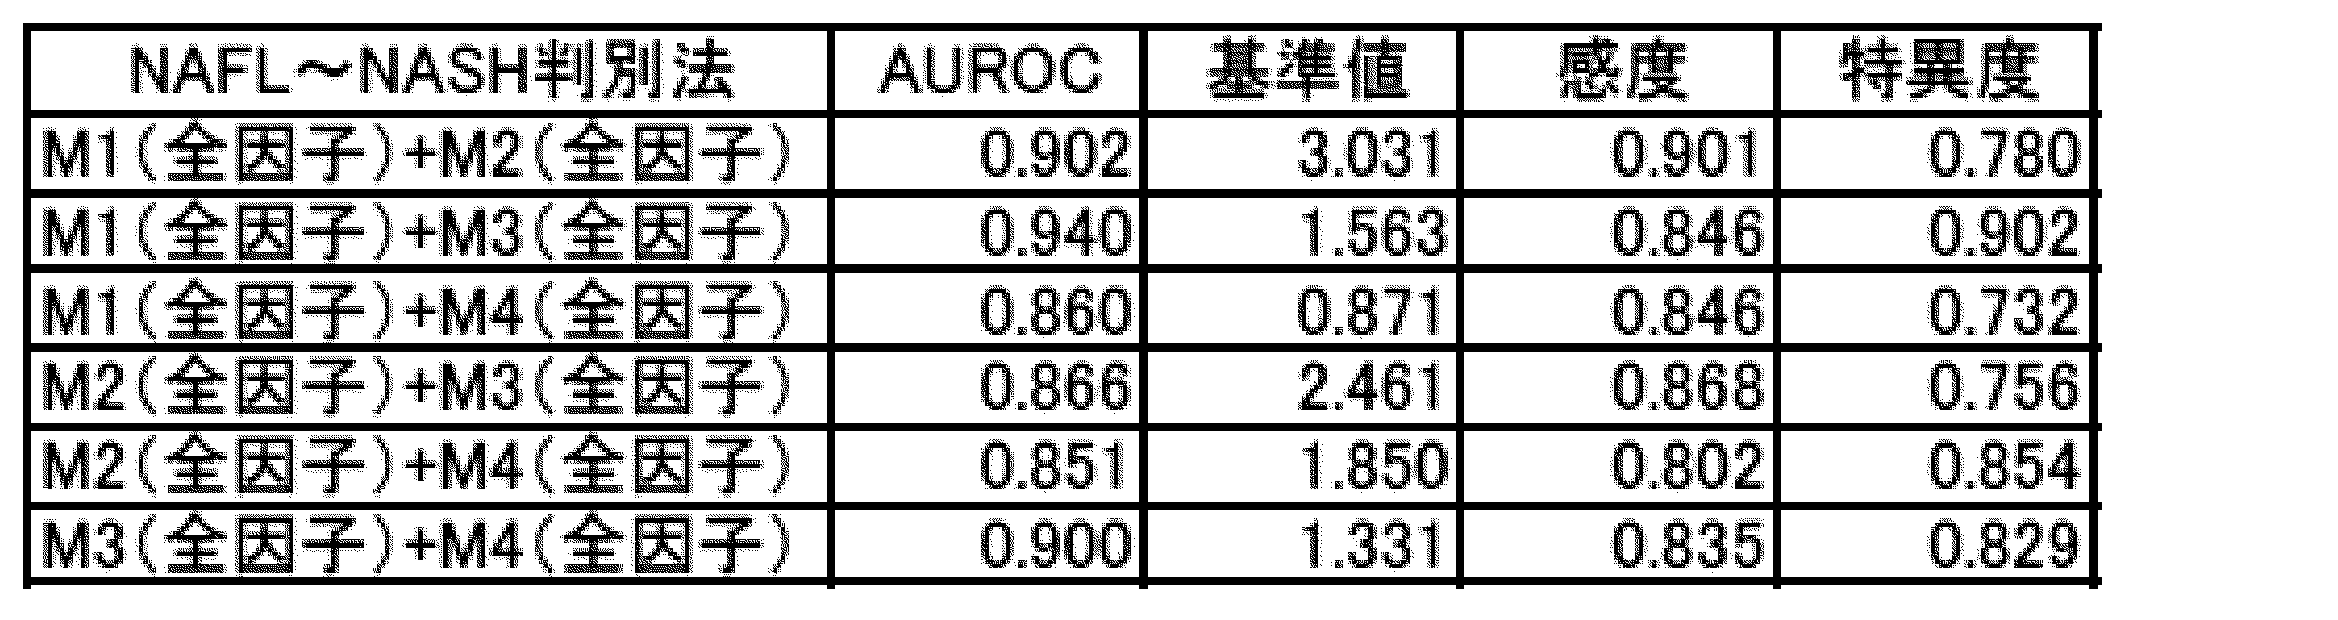
好ましい指標値は下記式8及び式9から算出される値が用いられる。式8において、A1、B1、X1及びX2はそれぞれ、ニューラルネットワークによって定められる定数を示す。式9において、Iは指標値を示し、A2、B2及びX2は、ニューラルネットワークによって定められる定数を示す。
X2=f(A1・X1+B1) (式8)
I=f(A2・X2+B2) (式9)
ここで、

A1、B1、X1、A2及びB2には、下記表22に示される値を用いた。
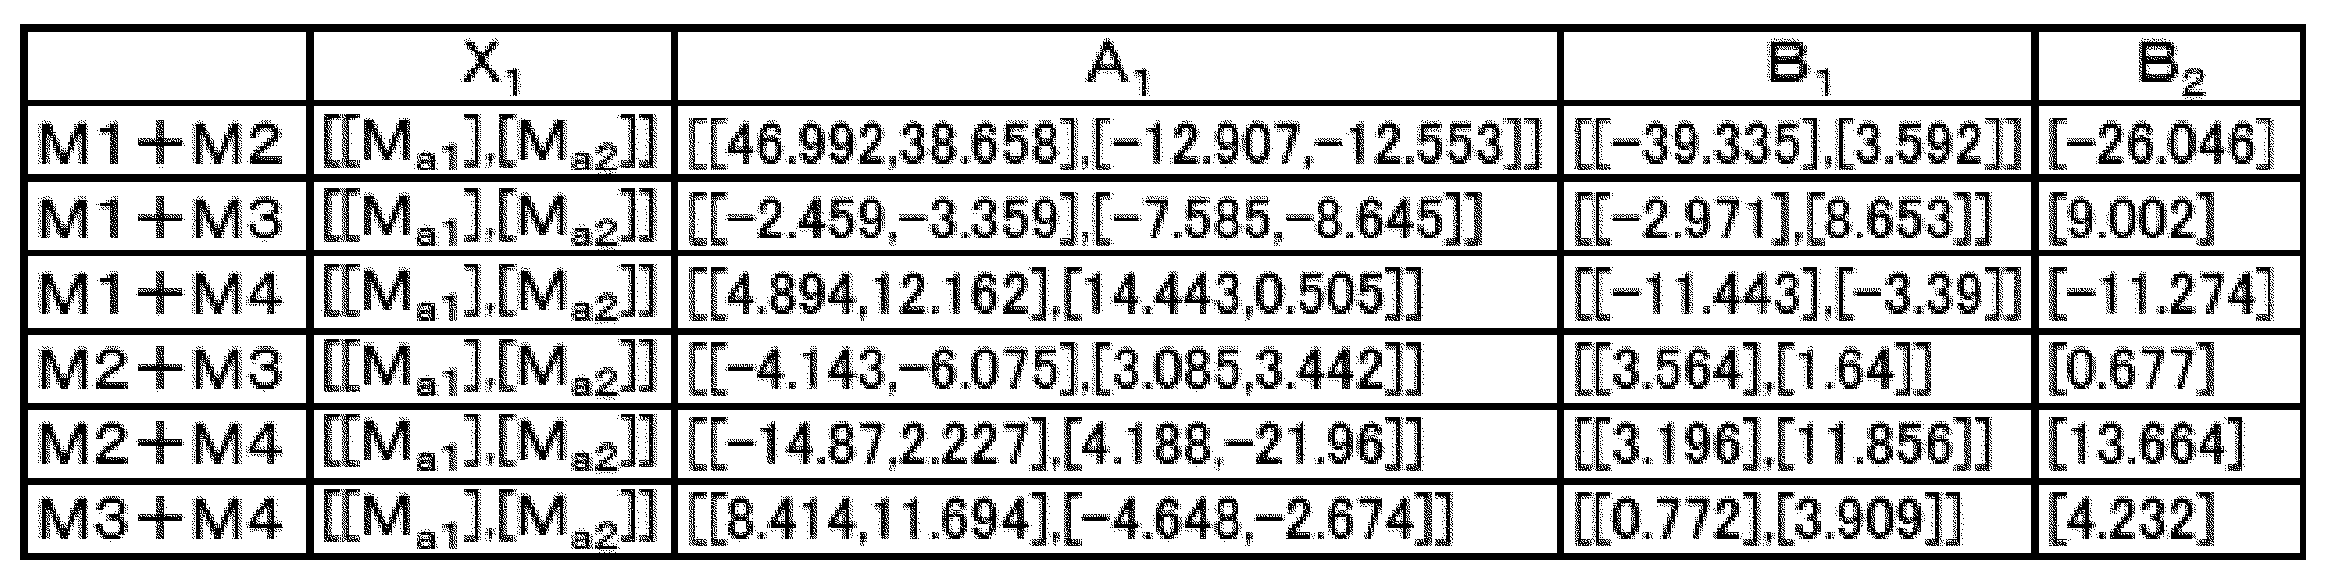
上記表22におけるMa1及びMa2はそれぞれ、上記2つの群のうちの一方の規格化スコア及び他方の規格化スコア(「第1の規格化スコア」及び「第2の規格化スコア」)を示す。Ma1及びMa2には、下記表23に示される値を用いた。
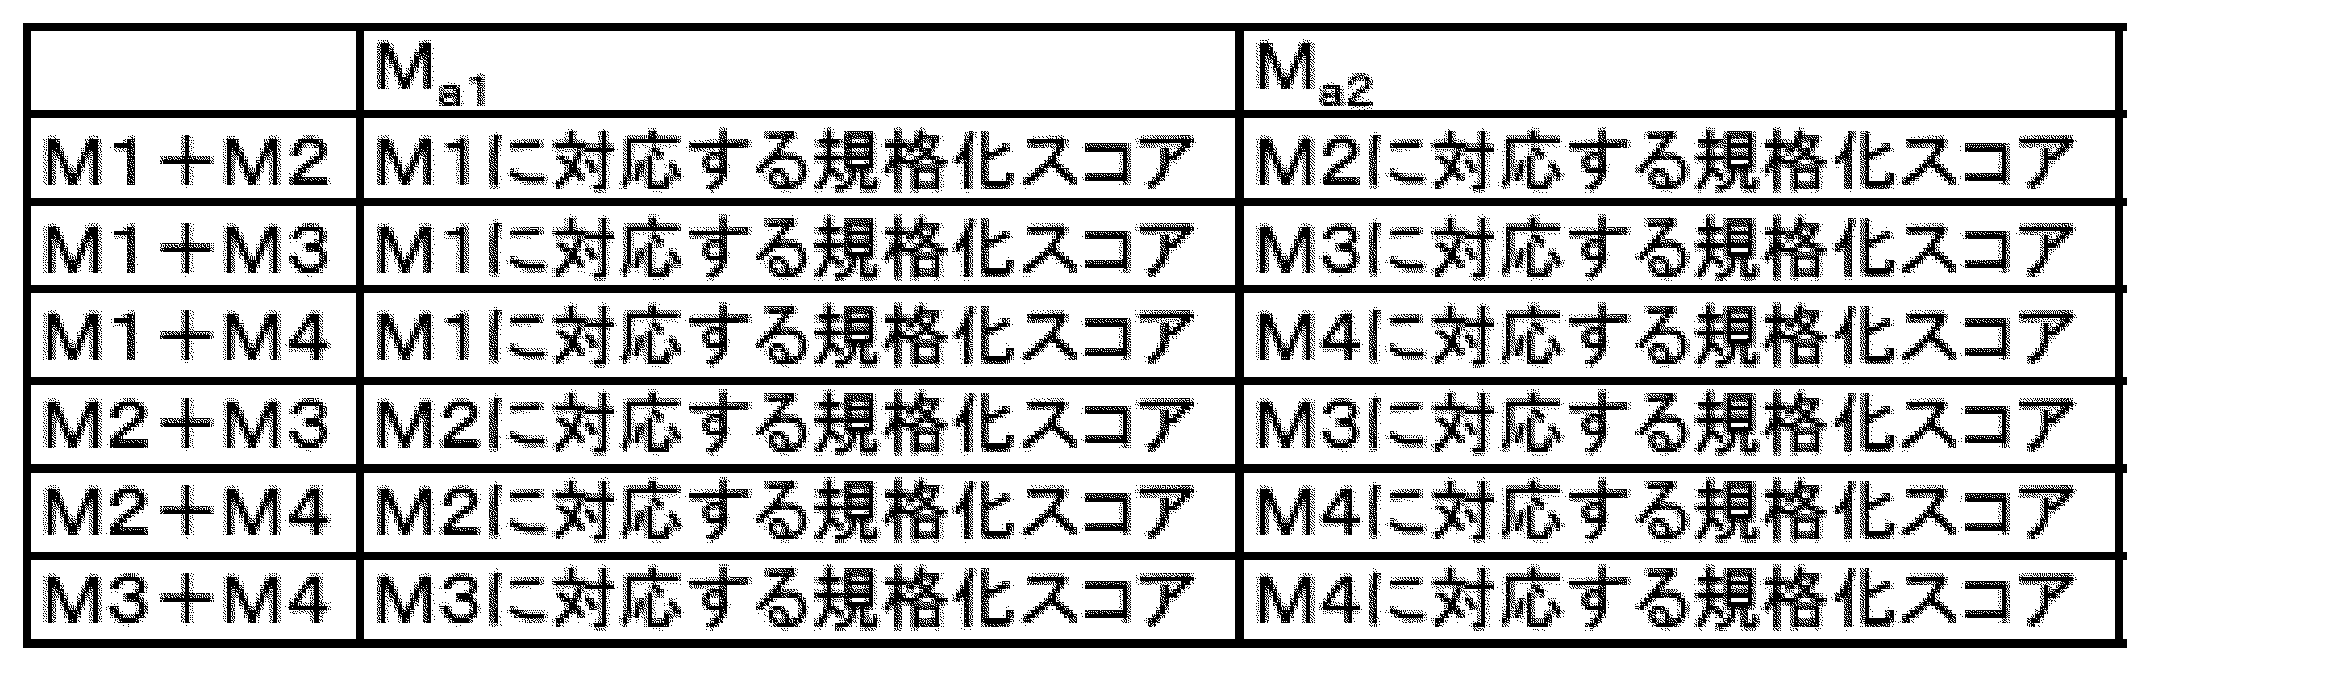
いずれの規格化スコア、指標値においても、NAFLの患者群とNASHの患者群との間に有意な差がみられ、NAFLとNASHとの判別に有効であることがわかった。また、NASHであるかどうかを判別するための基準値(カットオフ値)は、下記表24に示される値に設定することが有効であることが分かった。また、これらの結果から求められたAUROCを、従来技術であるNAFICスコアのAUROC(0.834)と比較したところ、従来技術と同等又はそれ以上の診断精度であることが示唆された。なお、NAFICスコアのAUROCは、本実施例の検体群を用いて算出した値である。

好ましい指標値は下記式10から算出される値が用いられる。式10において、Iは指標値を示し、N、α、χ 及びν は、サポートベクターマシンによって定められる定数を示す。
ここで、
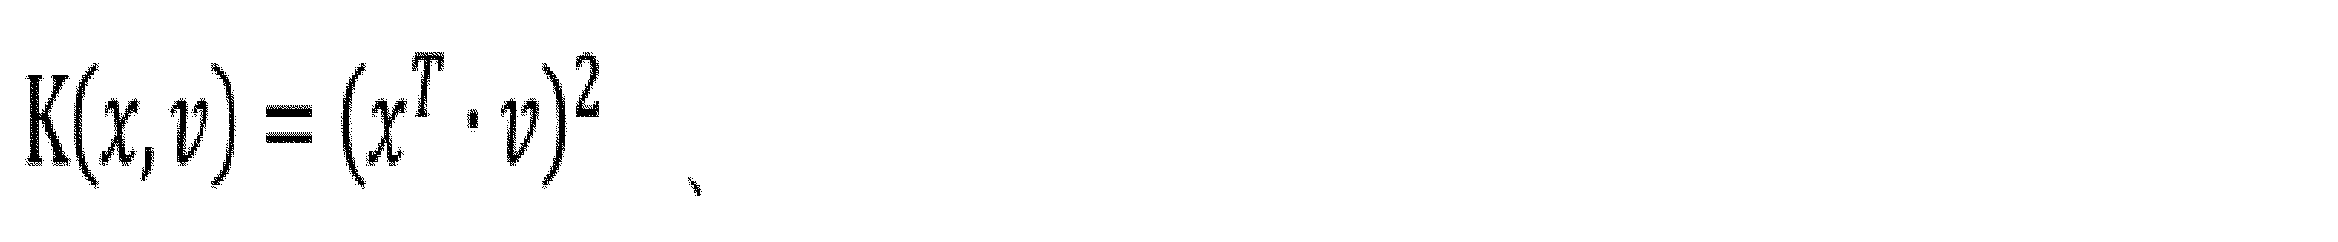

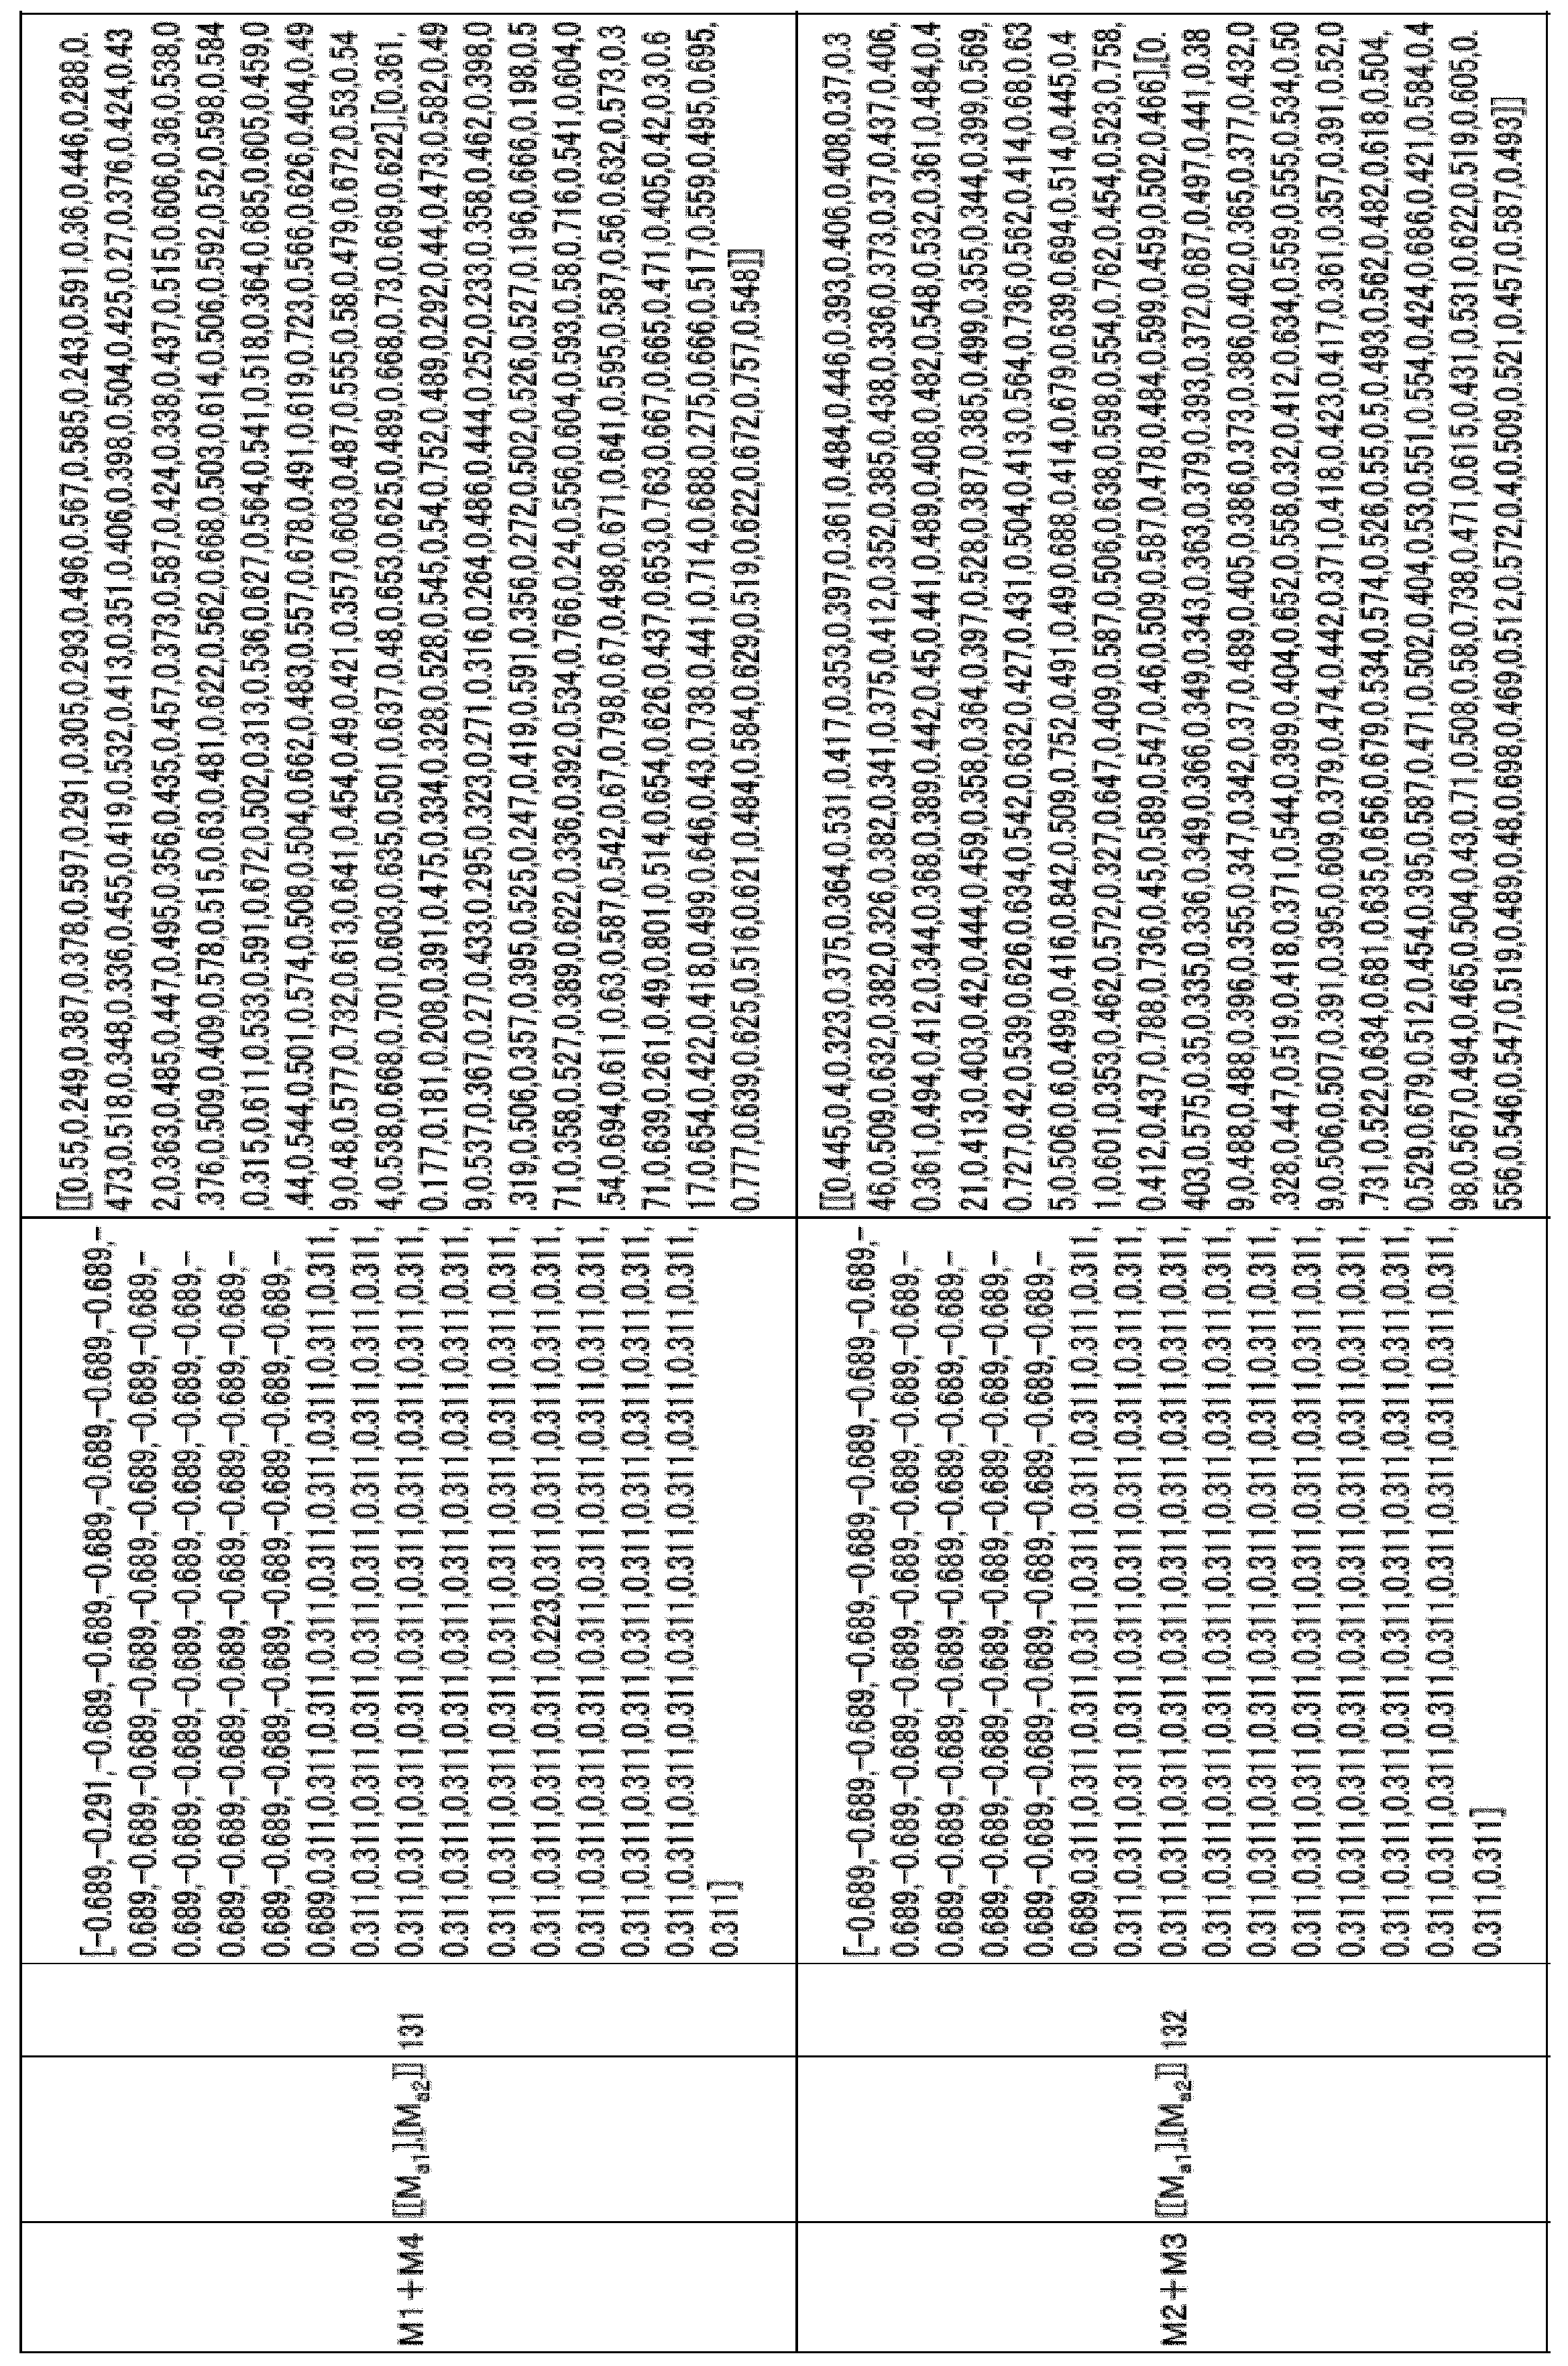
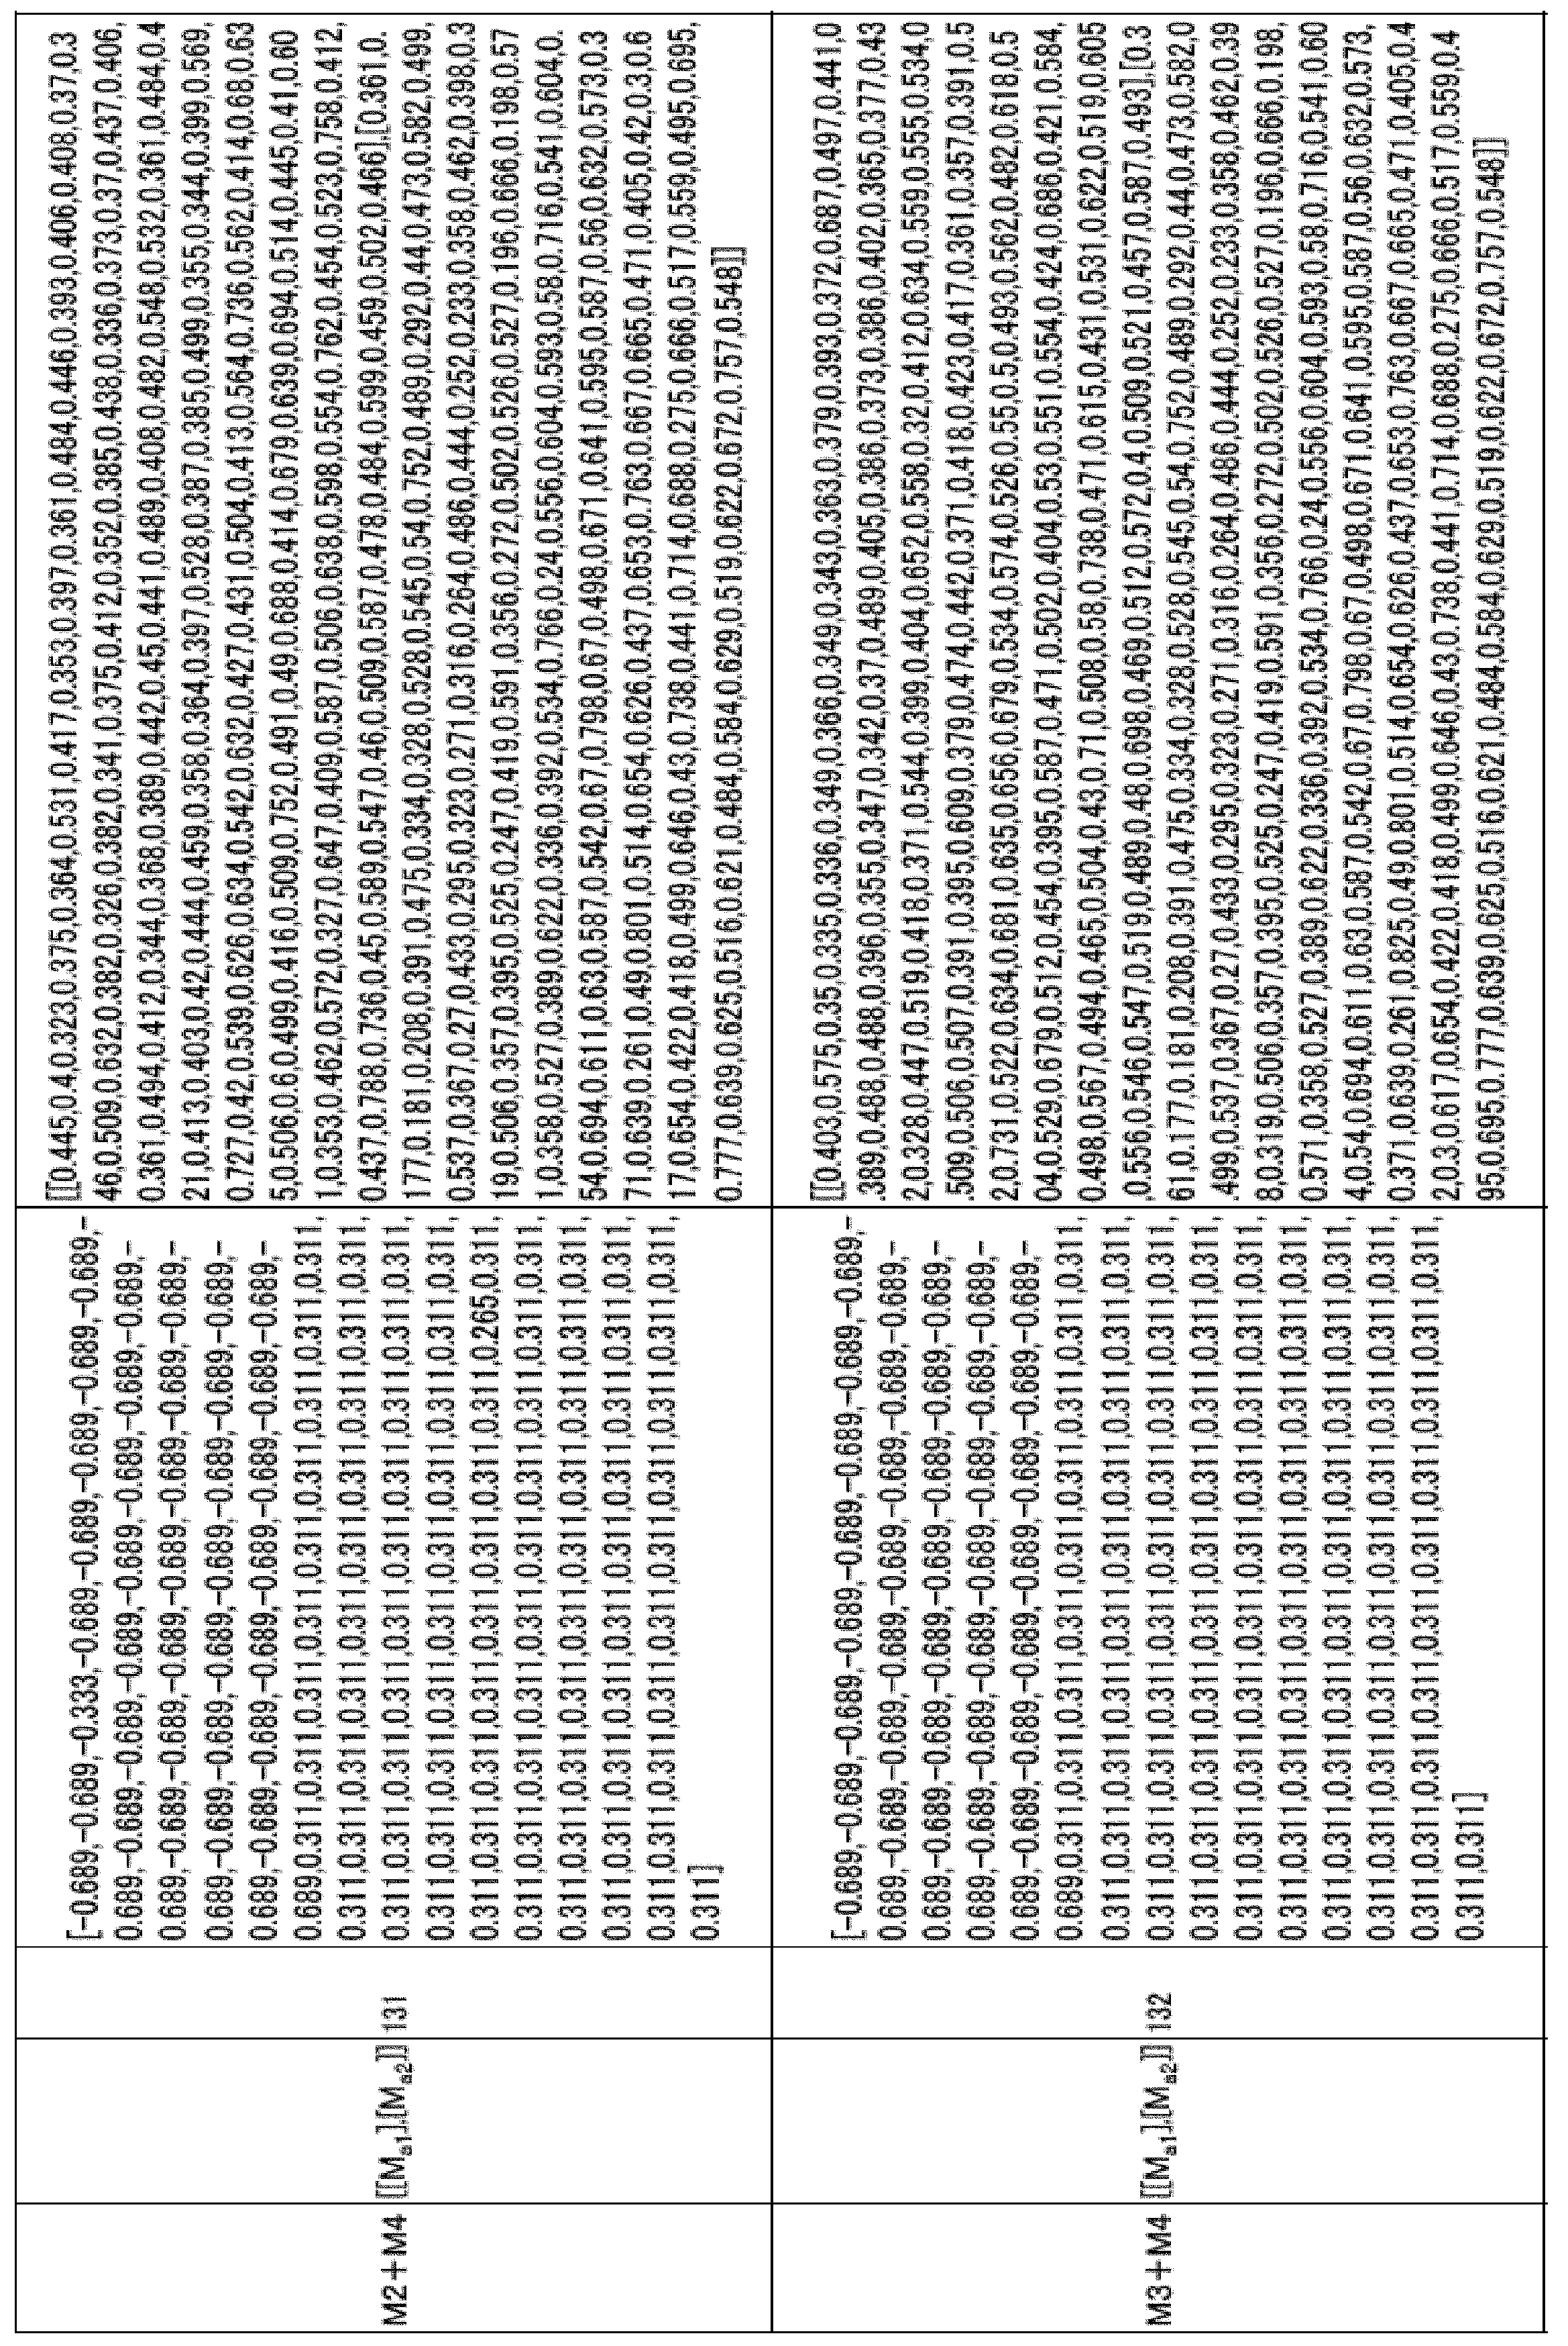
上記表25におけるMa1及びMa2はそれぞれ、上記2つの群のうちの一方の規格化スコア及び他方の規格化スコア(「第1の規格化スコア」及び「第2の規格化スコア」)を示す。Ma1及びMa2には、下記表26に示される値を用いた。

いずれの規格化スコア、指標値においても、NAFLの患者群とNASHの患者群との間に有意な差がみられ、NAFLとNASHとの判別に有効であることがわかった。また、NASHであるかどうかを判別するための基準値(カットオフ値)は、下記表27に示される値に設定することが有効であることが分かった。また、これらの結果から求められたAUROCを、従来技術であるNAFICスコアのAUROC(0.834)と比較したところ、従来技術と同等又はそれ以上の診断精度であることが示唆された。なお、NAFICスコアのAUROCは、本実施例の検体群を用いて算出した値である。
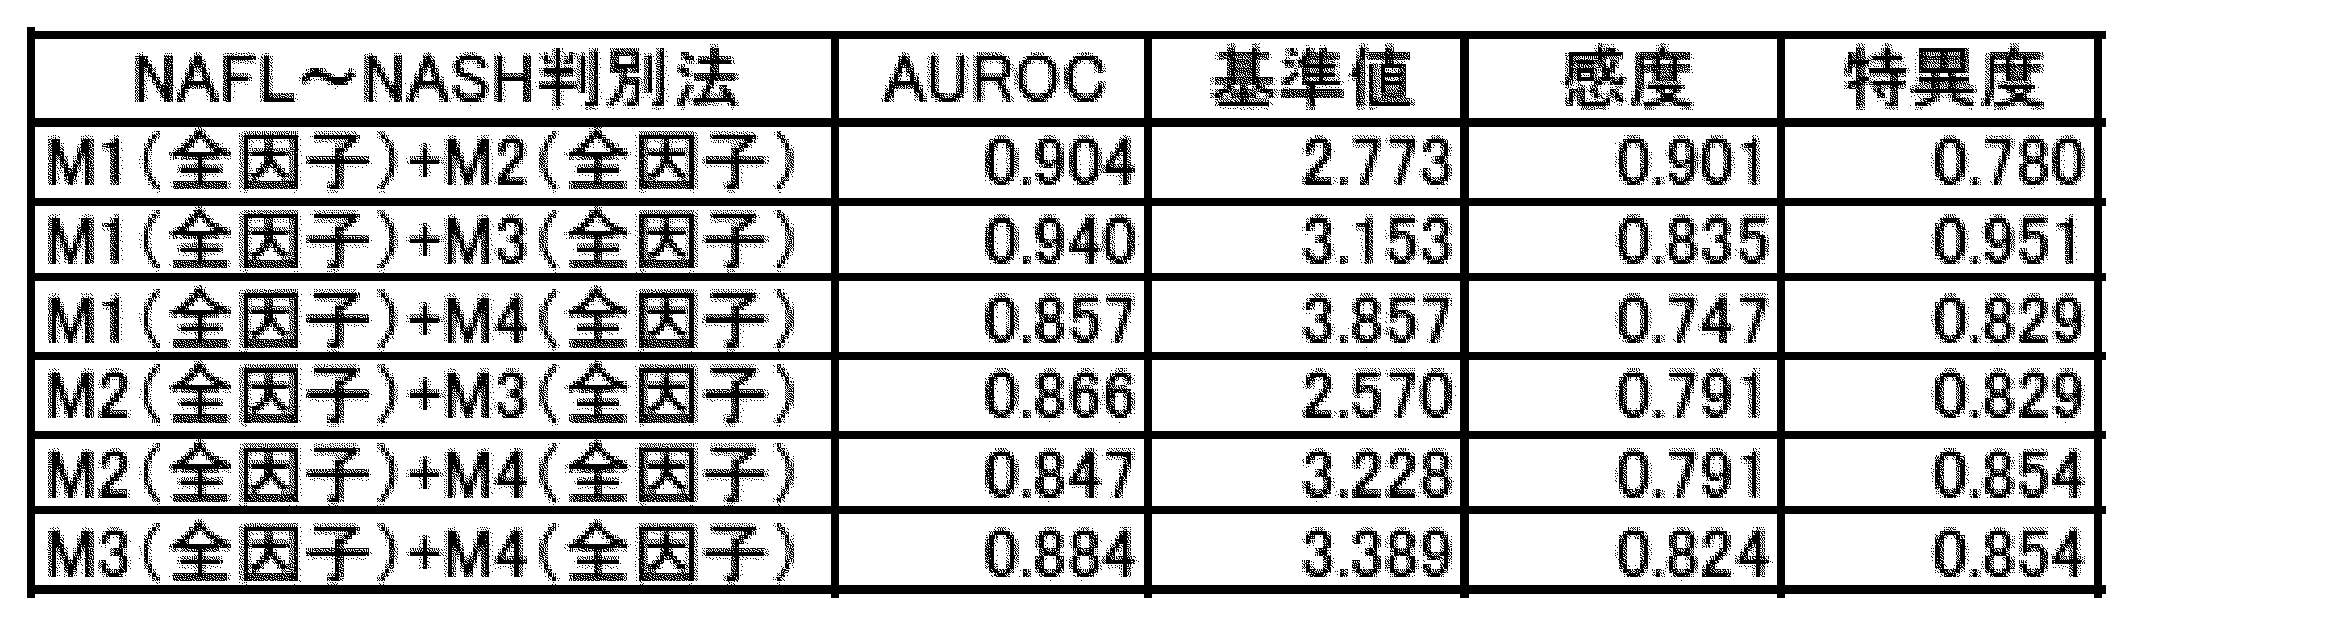
好ましい指標値は下記式11から算出される値が用いられる。式11において、Iは指標値を示し、Ma1及びMa2はそれぞれ、上記2つの群のうちの一方の規格化スコア及び他方の規格化スコア(「第1の規格化スコア」及び「第2の規格化スコア」)を示し、e1、e2及びe3は、非線形回帰分析によって定められる定数を示す。
I=e1×Ma1+e2×Ma2+e3×Ma1×Ma2 (式11)
ここで、式11におけるMa1(第1の規格化スコア)、Ma2(第2の規格化スコア)、e1、e2及びe3は、下記表28に示される値を用いた。
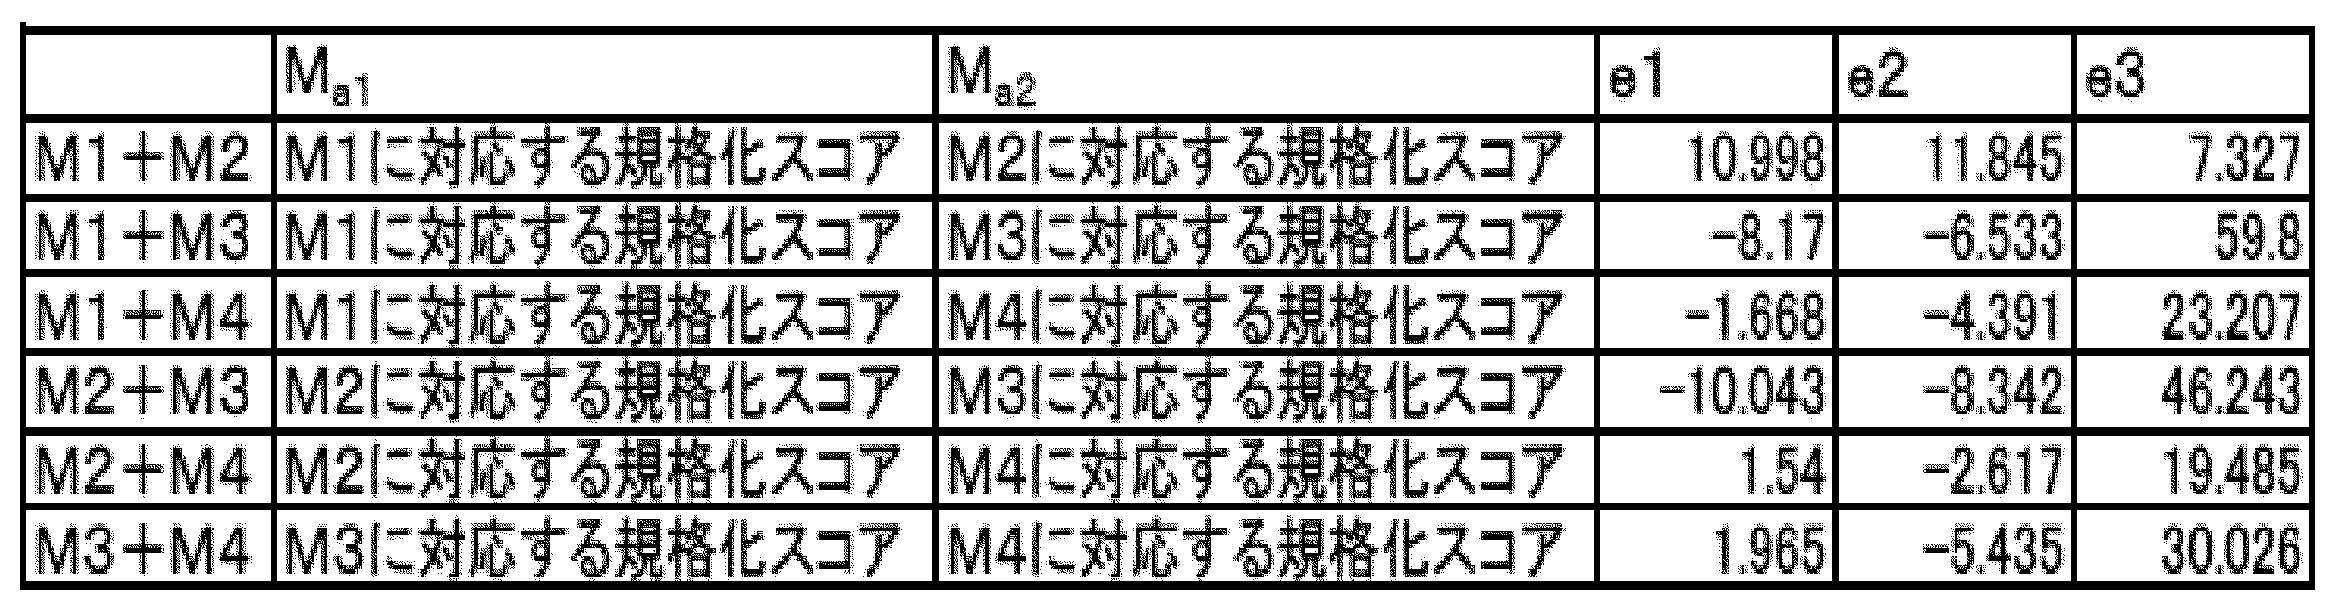
いずれの規格化スコア、指標値においても、NAFLの患者群とNASHの患者群との間に有意な差がみられ、NAFLとNASHとの判別に有効であることがわかった。また、NASHであるかどうかを判別するための基準値(カットオフ値)は、下記表29に示される値に設定することが有効であることが分かった。また、これらの結果から求められたAUROCを、従来技術であるNAFICスコアのAUROC(0.834)と比較したところ、従来技術と同等又はそれ以上の診断精度であることが示唆された。なお、NAFICスコアのAUROCは、本実施例の検体群を用いて算出した値である。

測定法1
規格化スコアを求める際に用いた生体分子を、下記表30に示す1~3種類の生体分子を用いたこと以外は、上記試験例1と同様の方法で規格化スコアを求めた。

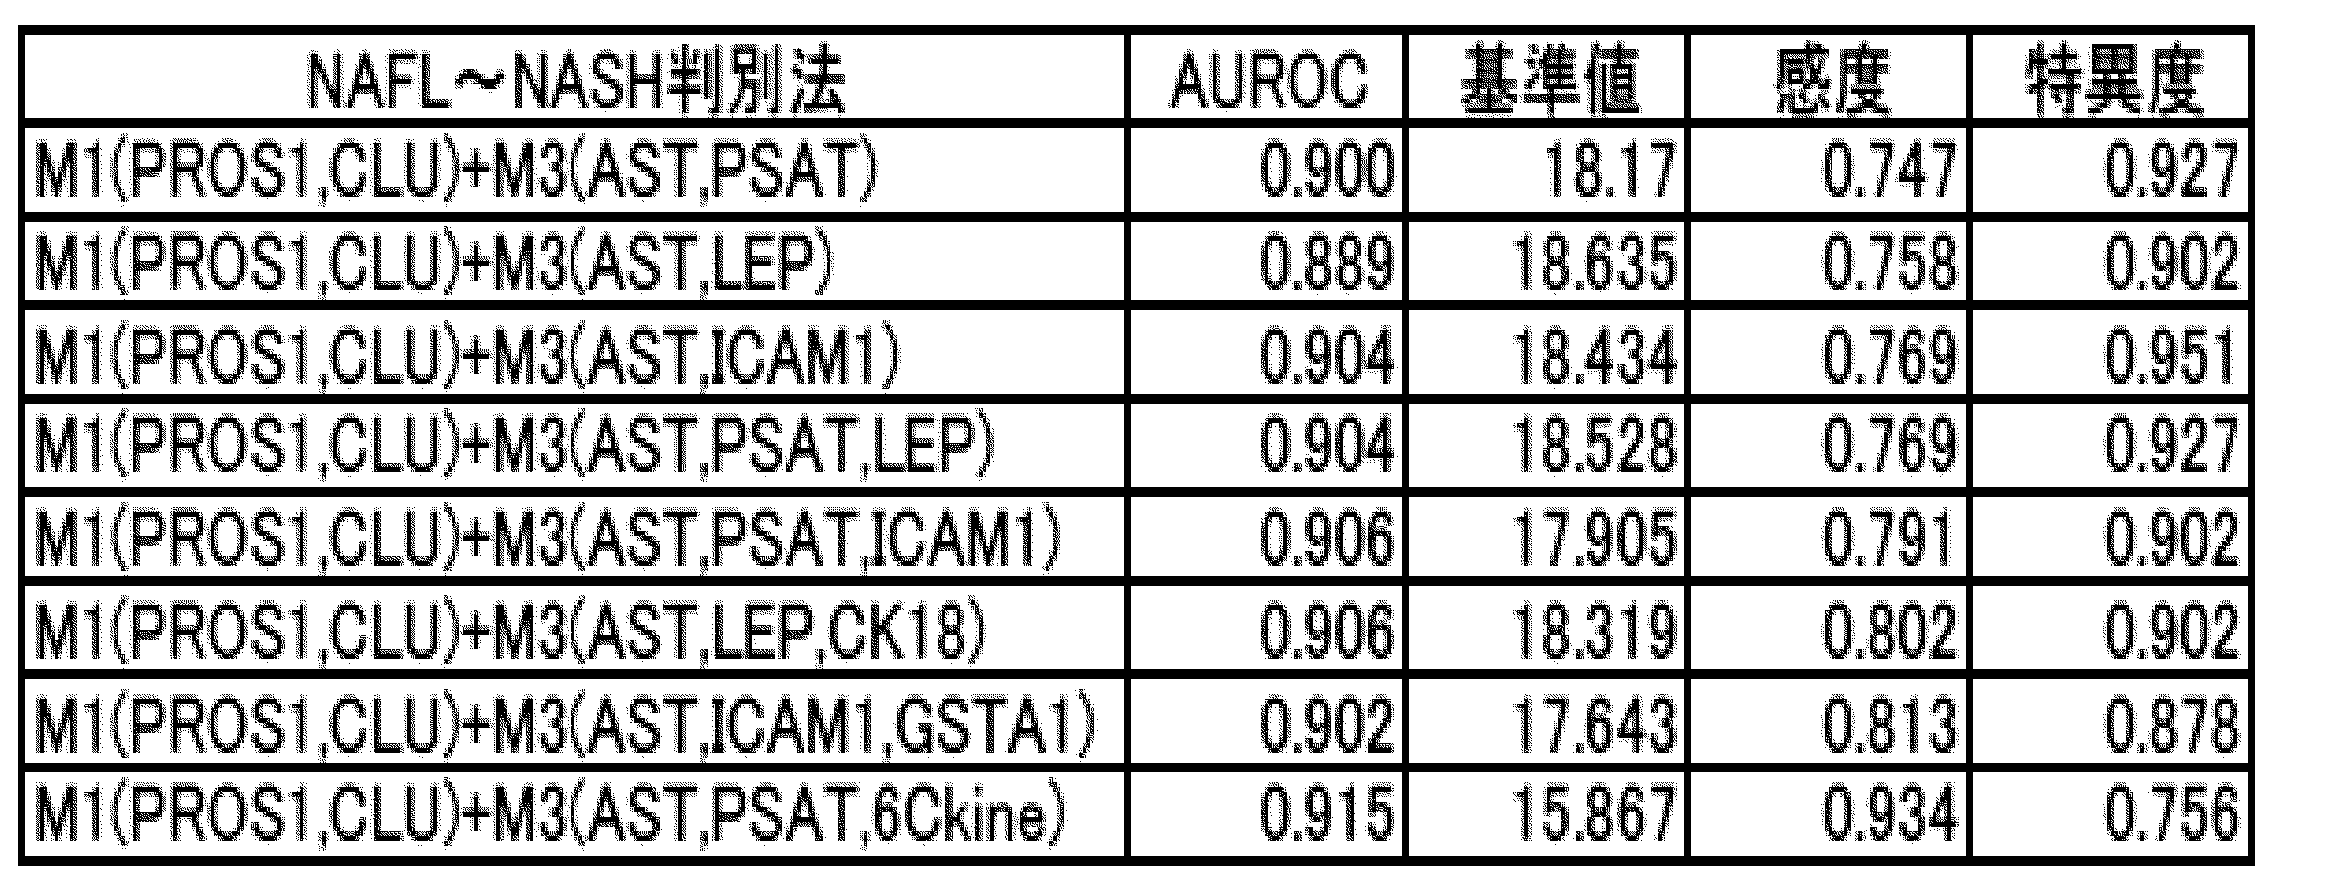

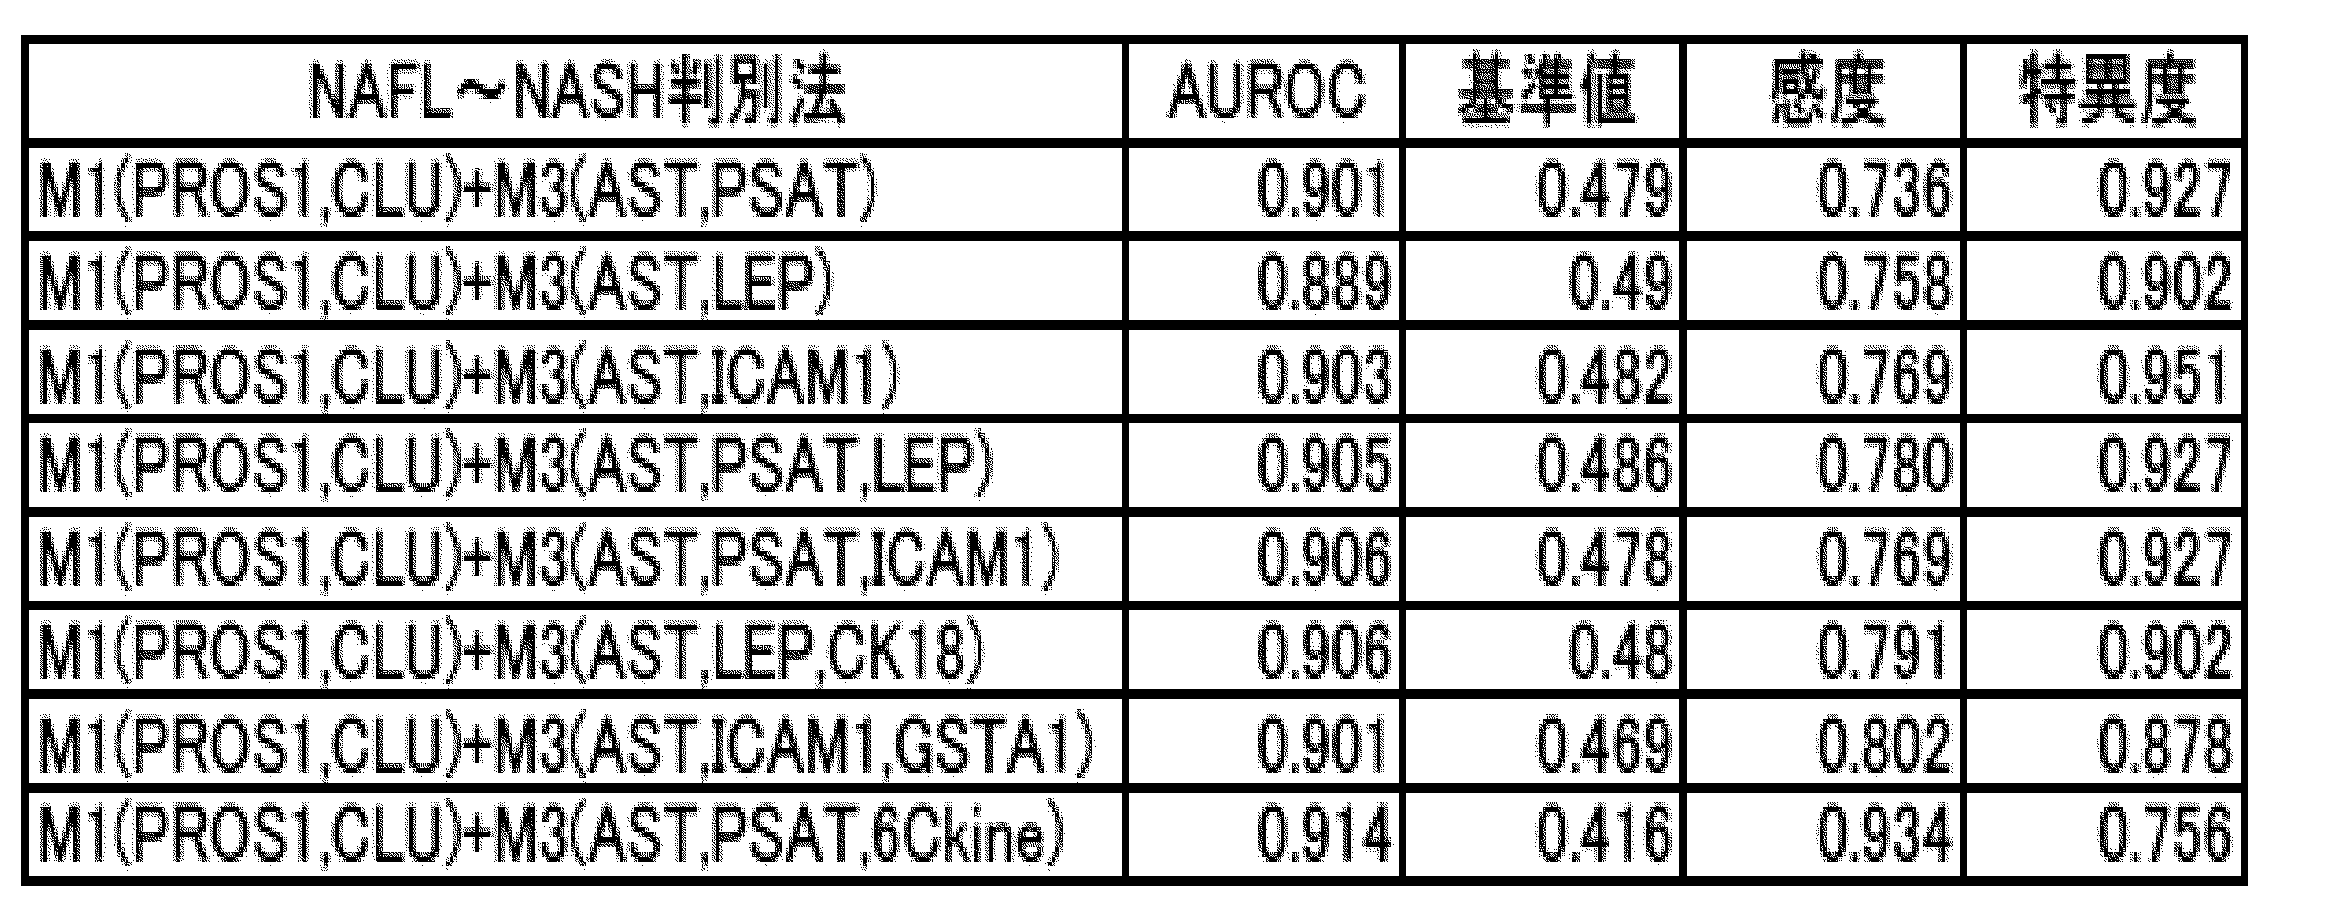


HA、VCAM1及びCOL4-7Sそれぞれの量を以下に示す方法で測定し、規格化スコアを求めた。HAの量は、体外診断薬「エルピアエースHA」(LSIメディエンス社製)を用いたラテックス凝集法によって測定した。VCAM1の量は、「Human sVCAM-1/CD106 Quantikine ELISA Kit」(R&D Systems社製)を用いたELISA法によって測定した。さらに、COL4-7Sの量は、体外診断薬「IV型コラーゲン・7Sキット」(LSIメディエンス社製)を用いたラジオイムノアッセイ法によって測定した。測定された各生体分子の量から、上記式1に基づいて、それぞれの規格化スコアを求めた。ここで、式1におけるmean(mi)、sd(mi)、mean(mi NASH)、及びmean(mi NAFL)は、以下示す表41の値を用いた。なお、表41に記載の値は、上記診断薬又は試薬を用いた方法と同等の性能を有する測定法が用いられる場合においても用いられる値である。HAにおいてはNAFL罹患者44人及びNASH罹患者95人から得られた血清試料を測定した。VCAM1においてはNAFL罹患者68人及びNASH罹患者127人から得られた血清試料を測定した。COL4-7Sについては、NAFL罹患者62人及びNASH罹患者130人から得られた血清試料を測定した。それぞれの分子について、NAFL罹患者の平均値及びNASH罹患者の平均値の単純平均をmean(mi)とし、NAFL罹患者の標準偏差及びNASH罹患者の標準偏差の単純平均をsd(mi)とした。また、HAの測定に体外診断薬「ケミルミヒアルロン酸」(シーメンスヘルスケア・ダイアグノスティクス社製)を用いたCLIA法によって測定する場合のmean(mi)、sd(mi)には、ラテックス凝集法において用いるmean(mi)、sd(mi)の値を、添付文書に記載される相関式(y=1.36x-10.3)に代入して得られた値を用いて設定した。ここで、yは「ケミルミヒアルロン酸」を用いる場合のmean(mi)又はsd(mi)の値を示し、xは「エルピアエースHA」を用いる場合のmean(mi)又はsd(mi)の値を示す。


第1の規格化スコアとして、試験例2のM1(PROS1、CLU)に対応する規格化スコアを、第2の規格化スコアとして、試験例2のM3(AST、PSAT)、M3(AST、LEP)、M3(AST、ICAM1)、M3(AST、PSAT、LEP)、M3(AST、PSAT、ICAM1)、M3(AST、LEP、CK-18)、M3(AST、ICAM1、GSTA1)又はM3(AST、PSAT、6Ckine)に対応する規格化スコアを用いたこと以外は、試験例1の「M1+M3」同様の計算方法で指標値を求めた。

規格化スコアを求める際に用いた生体分子を、下記表45に示す生体分子を用いたこと以外は、上記試験例2の測定法1又は測定法2と同様の方法で規格化スコアを求めた。
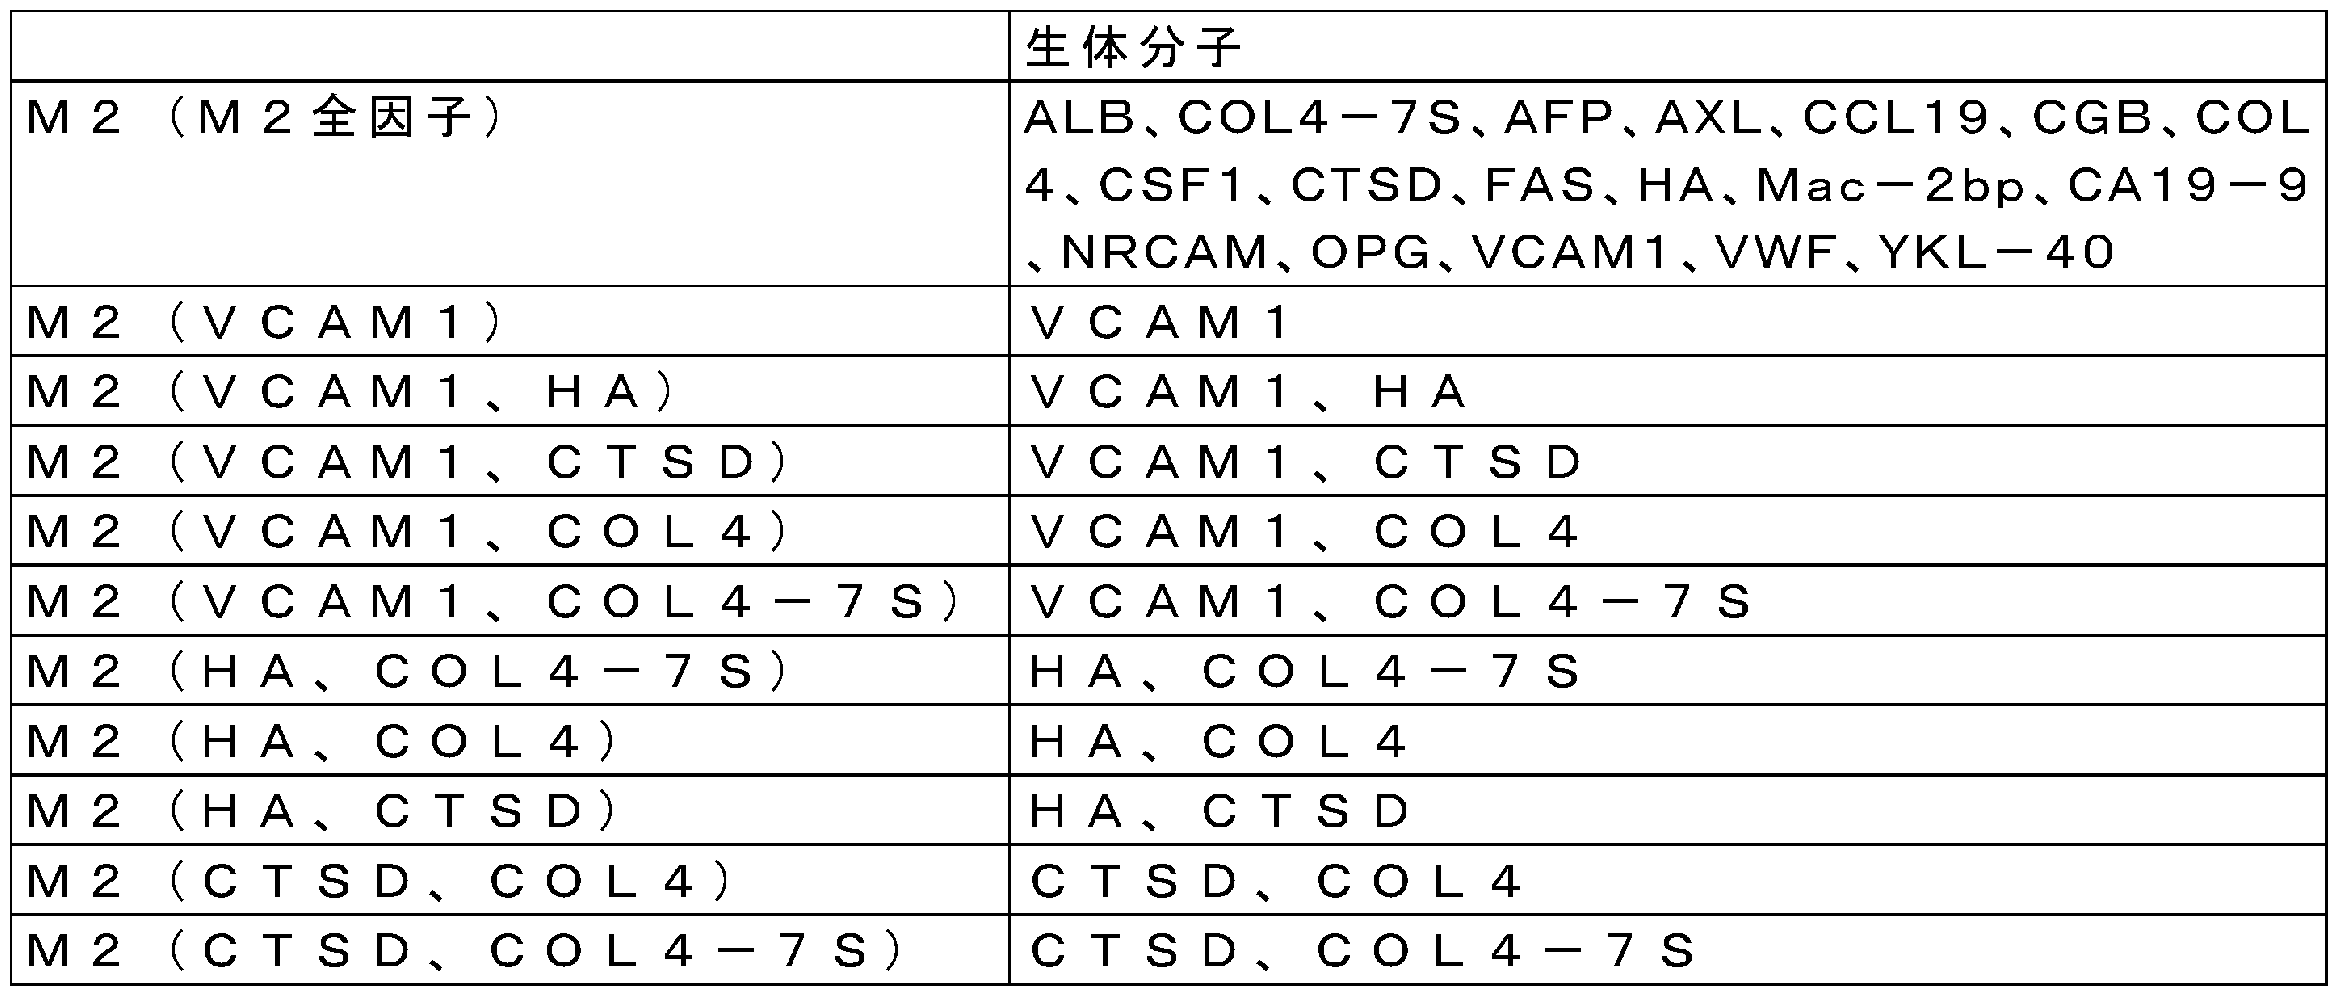

試験例4と同様の生体分子及び方法で規格化スコアを求めた。求められた規格化スコアを、線維化のStageにおけるStage0~Stage2の病態に該当する患者群(F0-2)とStage3又はStage4の病態に該当する患者群(F3-4)に分類してプロットしたグラフを図6-1及び図6-2に示す。図中、実線は表47における「基準値の範囲A」の両端を示し、破線は表47における「基準値の範囲B」の両端を示す。ここで、Stage0の病態とは、マテオーニ分類におけるType-1又はType-2の病態を意味する。いずれの規格化スコアにおいても、F0-2の患者群とF3-4の患者群との間に有意な差がみられ、Stage0~Stage2の病態と、Stage3又はStage4の病態との判別に有効であることがわかった。また、F3-4の病態に該当するかどうかを判別するための基準値(カットオフ値)は、下記表47に示される範囲に設定することが有効であることが分かった。また、これらの結果から求められたAUROCを、従来技術であるFIB4 indexのAUROC(0.858)と比較したところ、従来技術よりも優れた診断精度であることが示唆された。
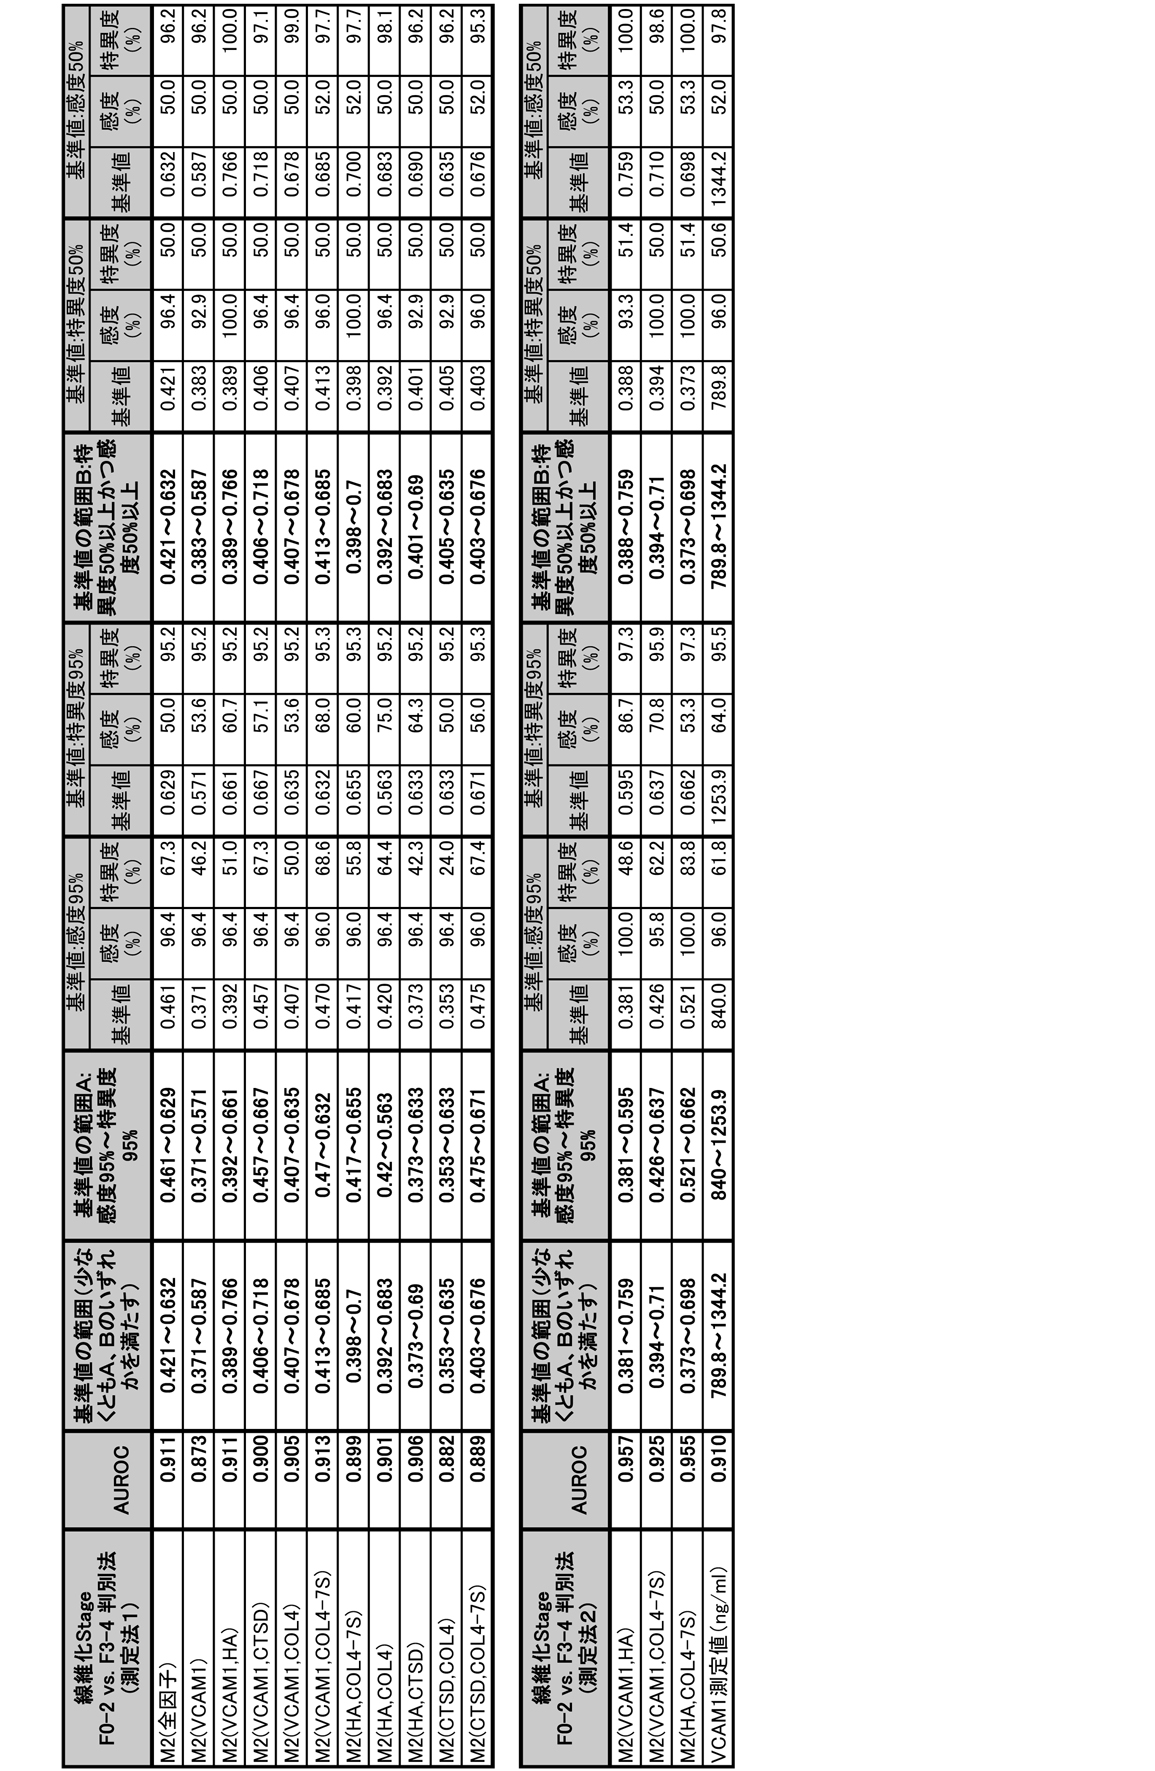
群2の生体分子である「VCAM1」、「VCAM1、HA」、「VCAM1、COL4」、「VCAM1、COL4-7S」及び「HA、COL4-7S」のそれぞれの規格化スコア、並びに、VCAM1の測定値(血中濃度)に基づいて、肝線維化の進展度を判定することが可能かどうかを検討した。肝臓の病理の指標として、肝生検に基づく肝線維化の病理診断スコア、Fibrosis stage(0~4点)を用いた(Kleiner et. al., Design and validation of a histological scoring system for nonalcoholic fatty liver disease, Hepatology 41:1313-21 (2005))。規格化スコアは試験例1と同様の方法を用いて求めた。VCAM1の測定値は、ELISA法に拠る試薬「Human sVCAM-1/CD106 Quantikine ELISA Kit」によって定量した。また、肝線維化を評価する指標として知られるFIB4 index(Hepatology. 2006 Jun;43(6):1317-25.)を、被験者の年齢、AST、ALT及び血小板数から求めた。病理診断スコアが記録された人から採取された血清132検体について、Fibrosis stageと、上記規格化スコア、VCAM1の測定値、及びFIB4 indexとの関連を調べた。VCAM1の測定値については、別途測定した健常者の値も併せて検討した。結果を図7に示す。図7中、横軸はFibrosis Stageを示し、縦軸は規格化スコア、VCAM1の測定値又はFIB4 indexを示し、横線は各群の中央値を示す。上記規格化スコア及びVCAM1の測定値は、Fibrosis stageのスコアが大きくなるに従い、大きくなることが認められた。またVCAM1は、健常者ではNAFLD患者よりも小さい値を示す傾向が認められた。

群2の生体分子である「VCAM1」、「VCAM1、HA」、「VCAM1、COL4」、「VCAM1、COL4-7S」、及び「HA、COL4-7S」のそれぞれの規格化スコア、並びに、VCAM1の測定値(血中濃度)に基づいて、肝臓の炎症の進展度を評価することが可能かどうかを調べた。肝臓の炎症の指標として、肝生検に基づく小葉内炎症の病理診断スコア(0~3点)を用いた(Kleiner et. al., Design and validation of a histological scoring system for nonalcoholic fatty liver disease, Hepatology 41:1313-21 (2005))。規格化スコアは試験例1と同様の方法を用いて求めた。VCAM1の測定値は、ELISA法に拠る試薬「Human sVCAM-1/CD106 Quantikine ELISA Kit」によって定量した。また、肝臓の炎症を評価する指標として知られる高感度CRP(Hepatogastroenterology. 2014 Mar-Apr;61(130):422-5)は、ラテックス凝集法によって求めた。病理診断スコアが記録された人から採取された血清132検体について、肝臓の小葉内炎症のスコアと、上記規格化スコア、VCAM1の測定値、及び高感度CRPとの関連を調べた。VCAM1の測定値については、別途測定した健常者の値も併せて検討した。結果を図8に示す。図8中、横軸は肝臓の小葉内炎症のスコアを示し、縦軸は規格化スコア、VCAM1の測定値又は高感度CRPの測定値を示し、横線は各群の中央値を示す。上記規格化スコア及びVCAM1の測定値は、肝臓の小葉内炎症のスコアが大きくなるに従い、大きくなることが認められた。またVCAM1は、健常者ではNAFLD患者よりも小さい値を示す傾向が認められた。
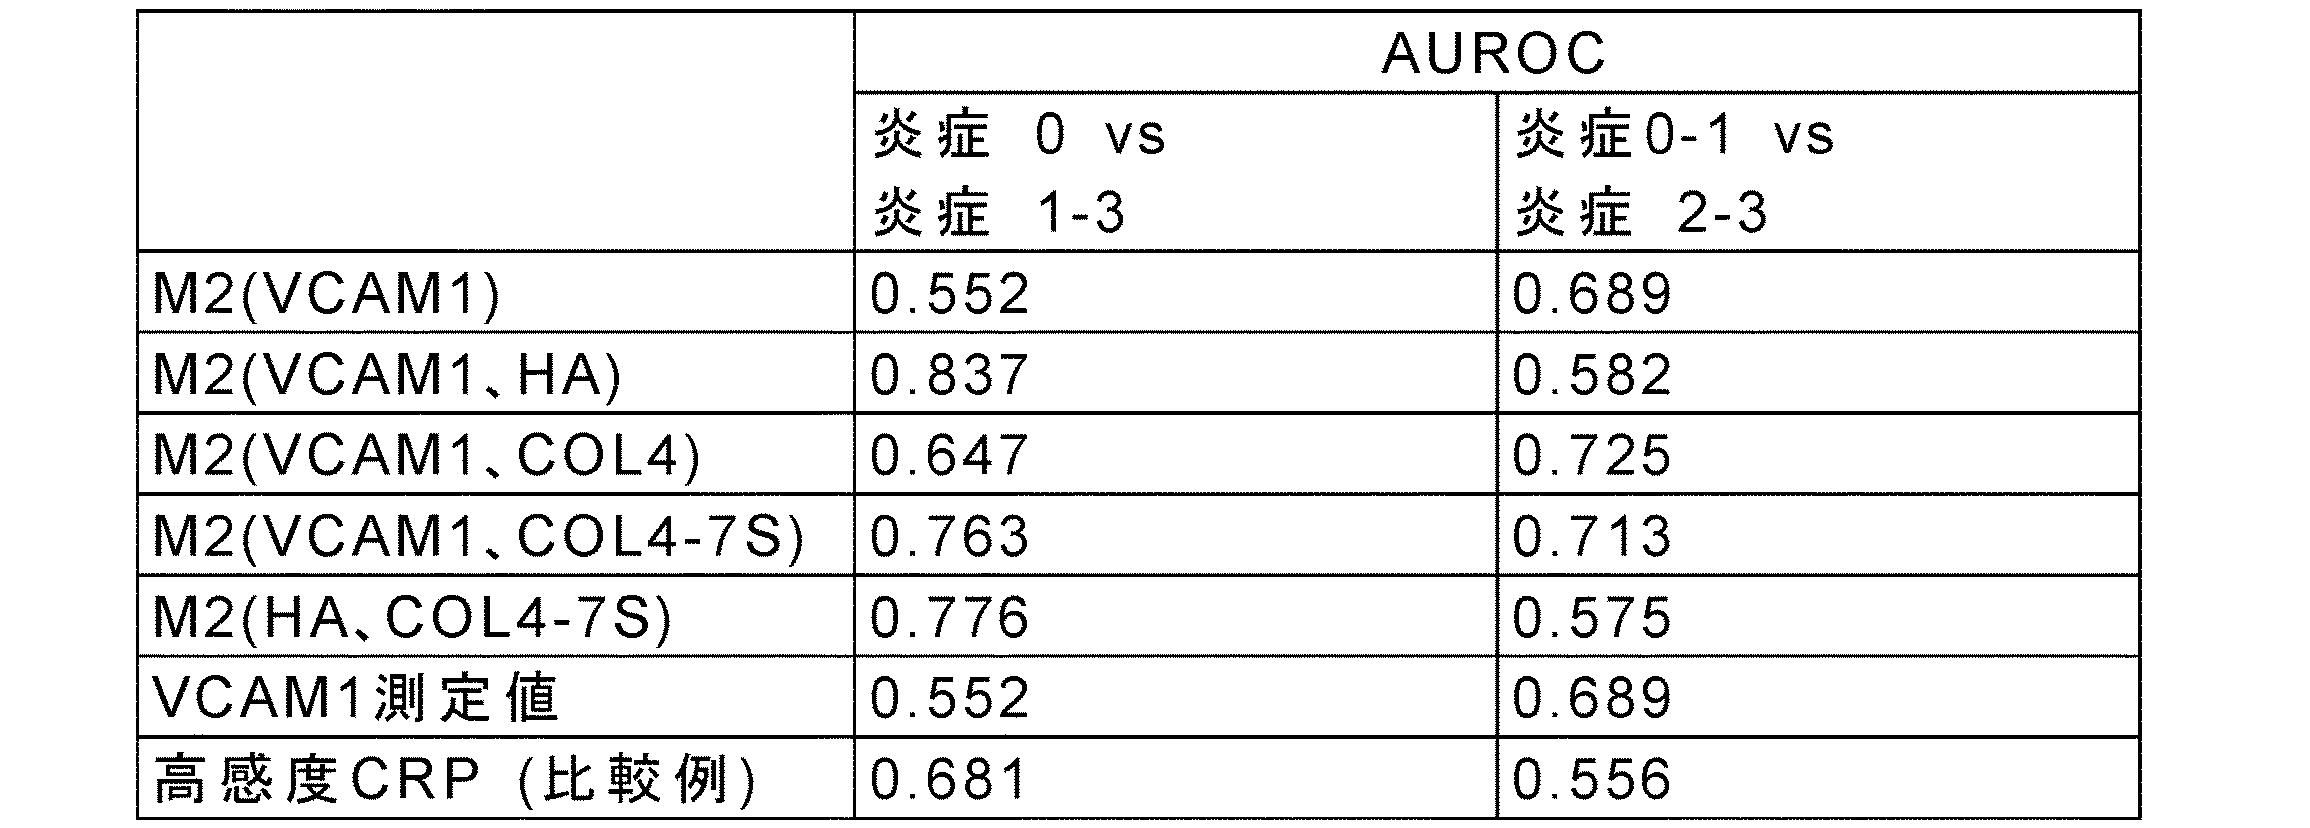
群2の生体分子である「VCAM1」、「VCAM1、HA」、「VCAM1、COL4」、「VCAM1、COL4-7S」、及び「HA、COL4-7S」のそれぞれの規格化スコア、並びに、VCAM1の測定値(血中濃度)に基づいて、肝細胞の風船様変性の進展度を判定することが可能かどうかを調べた。肝細胞の風船様変性の指標として、肝生検に基づく風船様変性の病理診断スコア(0~2点)を用いた(Kleiner et. al., Design and validation of a histological scoring system for nonalcoholic fatty liver disease, Hepatology 41:1313-21 (2005))。規格化スコアは試験例1と同様の方法を用いて求めた。VCAM1の測定値は、ELISA法に拠る試薬「Human sVCAM-1/CD106 Quantikine ELISA Kit」によって定量した。また、肝細胞の風船様変性を評価する指標として知られるCK18 M30 fragment(J Clin Gastroenterol. 2010 Jul;44(6):440-7)は、ELISA法「M30 Apoptosense ELISA」によって求めた。病理診断スコアが記録された人から採取された血清132検体について、肝細胞の風船様変性のスコアと、上記規格化スコア、VCAM1の測定値、及びCK18 M30 fragmentとの関連を調べた。VCAM1の測定値およびCK18 M30 fragmentについては、別途測定した健常者の値も併せて検討した。結果を図9に示す。図9中、横軸は肝細胞の風船様変性のスコアを示し、縦軸は規格化スコア、VCAM1の測定値又はCK18 M30 fragmentの測定値を示し、横線は各群の中央値を示す。上記規格化スコア及びVCAM1の測定値は、肝細胞の風船様変性のスコアが大きくなるに従い、大きくなることが認められた。またVCAM1は、健常者ではNAFLD患者よりも小さい値を示す傾向が認められた。

群2の生体分子である「VCAM1」、「VCAM1、HA」、「VCAM1、COL4」、「VCAM1、COL4-7S」、及び「HA、COL4-7S」のそれぞれの規格化スコア、並びに、VCAM1の測定値(血中濃度)に基づいて、NAFLDの活動性を評価することが可能かどうかを調べた。NAFLDの活動性の指標として、肝生検に基づくNAFLDの活動性の病理診断スコア(0~8点)を用いた(Kleiner et. al., Design and validation of a histological scoring system for nonalcoholic fatty liver disease, Hepatology 41:1313-21 (2005))。規格化スコアは試験例1と同様の方法を用いて求めた。VCAM1の測定値は、ELISA法に拠る試薬「Human sVCAM-1/CD106 Quantikine ELISA Kit」によって定量した。また、NAFLDの活動性を評価する指標として知られるCK18 M30 fragment(J Clin Gastroenterol. 2010 Jul;44(6):440-7)は、ELISA法「M30 Apoptosense ELISA」によって求めた。病理診断スコアが記録された人から採取された血清132検体について、NAFLDの活動性のスコアと、上記規格化スコア、VCAM1の測定値、及びCK18 M30 fragmentとの関連を調べた。VCAM1の測定値及びCK18 M30 fragmentについては、別途測定した健常者の値も併せて検討した。結果を図10に示す。図10中、横軸はNAFLDの活動性のスコアを示し、縦軸は規格化スコア、VCAM1の測定値又はCK18 M30 fragmentの測定値を示し、横線は各群の中央値を示す。VCAM1を含む群2の規格化スコア及びVCAM1の測定値は、NAFLDの活動性のスコアが大きくなるに従い、大きくなることが認められた。またVCAM1は、健常者ではNAFLD患者よりも小さい値を示す傾向が認められた。

群2の生体分子である「HA、COL4」の規格化スコアに基づいて、肝線維化の進展度、肝臓の炎症の進展度、肝細胞の風船様変性の進展度およびNAFLD活動性を判定することが可能かどうかを調べた。方法は、それぞれ上記試験例6、試験例7、試験例8および試験例9と同じ方法を用いた。
肝線維化の進展度の判定についての結果を、表52に示す。すべての判別においてAUROCが、同じ条件でのFIB4 indexのAUROCを上回っていた。以上のことから、「HA、COL4-7S」の規格化スコアは、肝線維化の進展度を判定するのに有用であることが示唆された。

肝臓の炎症の進展度の判定についての結果を表53に示す。肝臓の小葉内炎症のスコアが1点以下の検体と2点以上の検体との判別において、上記規格化スコアのAUROCが同じ条件での高感度CRPのAUROCを上回った。以上のことから、「HA、COL4」の規格化スコアは、肝臓の炎症の進展度を判定するのに有用であることが示唆された。

肝細胞の風船様変性の進展度の判定についての結果を表54に示す。全ての判別において、上記規格化スコアのAUROCが同じ条件でのCK18 M30 fragmentのAUROCを上回った。以上のことから、「HA、COL4」の規格化スコアは、肝細胞の風船様変性の進展度を判定するのに有用であることが示唆された。
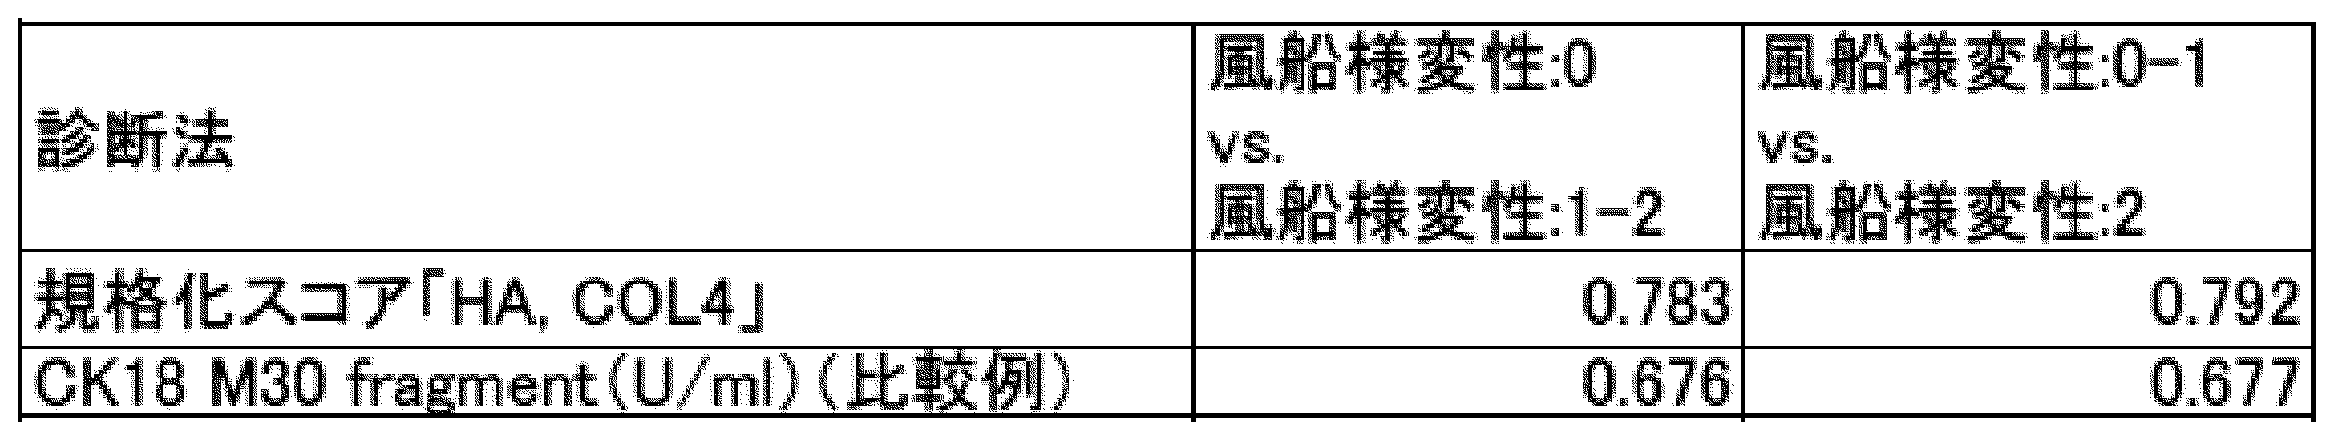
NAFLD活動性の判定についての結果を表55に示す。NAFLDの活動性のスコアが4点以下の検体と5点以上の検体との判別を行ったとき、及びNAFLDの活動性のスコアが5点以下の検体と6点以上の検体との判別を行ったときにおいて、上記規格化スコアのAUROCが同じ条件でのCK18 M30 fragmentのAUROCを上回った。以上のことから、「HA、COL4」の規格化スコアは、NAFLDの活動性を判定するのに有用であることが示唆された。
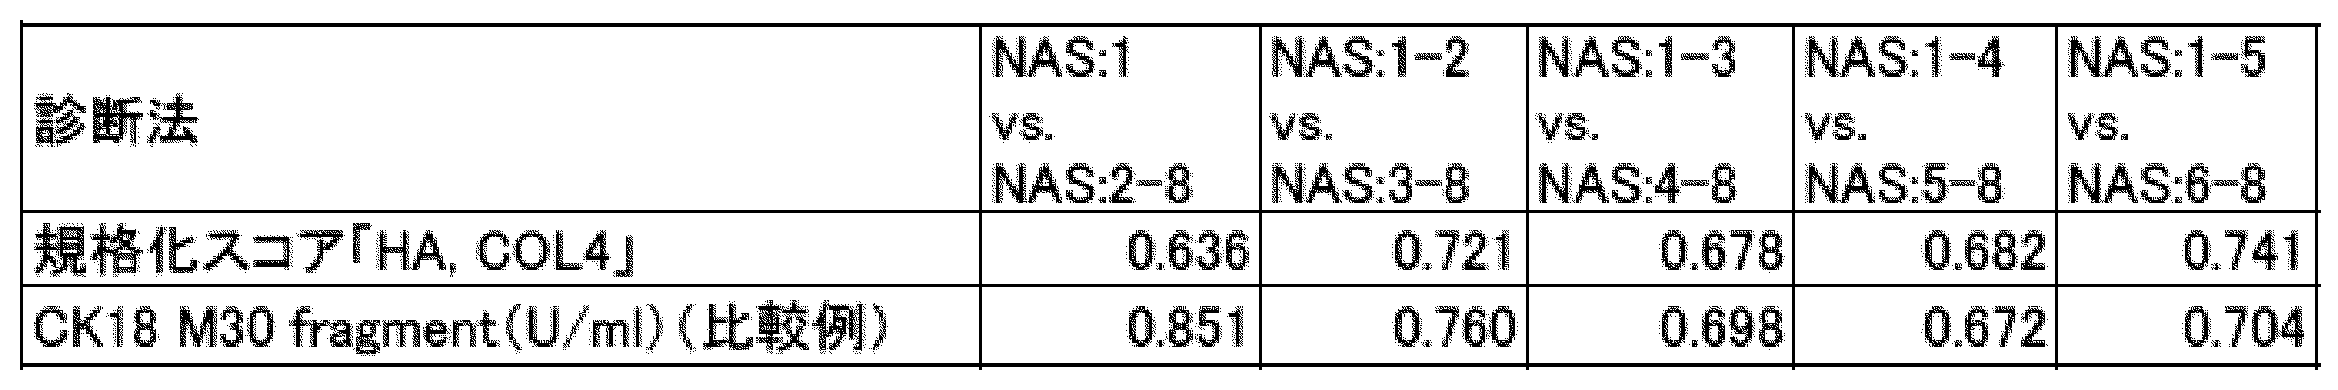
Claims (38)
- 非アルコール性脂肪肝(NAFL)と非アルコール性脂肪肝炎(NASH)とを判別する方法であって、
(1)被験者から採取された血液に含まれる、マーカー分子の量を測定する工程であって、測定する前記マーカー分子が、
(A)PROS1、CLU、ANG、APOC3、APOD、CFHR1、コルチゾール、EGFR、HPN、IGFBP3、IL1B、IL23A、MET、MMP10、テトラネクチン、TTR、VDBP及びVEGFR-2からなる群1から選ばれる少なくとも2つのマーカー分子、
VCAM1、HA、CTSD、COL4、COL4-7S、ALB、AFP、AXL、CCL19、CGB、CSF1、FAS、Mac-2bp、CA19-9、NRCAM、OPG、VWF及びYKL-40からなる群2から選ばれる少なくとも2つのマーカー分子、
AST、PSAT、LEP、ICAM1、CK-18、GSTA1、ALT、INSIVD、INSMAP、6Ckine、AGT、CRP、CXCL10、FABP4、G6PI、HSP-60、P3NP及びテストステロンからなる群3から選ばれる少なくとも2つのマーカー分子、若しくは、
AREG、BDNF、CD40-L、EREG、FGF2、HBEGF、IGFBP2、MMP9、PAI-1、PDGFB、PLGF、SAP、TGFA、TGFB1、THBS1及びVTNからなる群4から選ばれる少なくとも2つのマーカー分子、
又は、
(B)前記群1、前記群2、前記群3及び前記群4から選ばれる2つの群のうちの、一方から選択される少なくとも2つのマーカー分子及び他方から選択される少なくとも2つのマーカー分子、
である、工程と、
(2)前記マーカー分子の量に基づいて算出される規格化スコアから指標値を求める工程であって、同一の群の前記マーカー分子の量に基づく前記規格化スコアが下記式1から算出され、

(式1において、Mは規格化スコアを示し、Nはマーカー分子の数を示し、miは、測定された各マーカー分子の量を示し、mean(mi)は、予め決められた各マーカー分子の量の平均値を示し、sd(mi)は、予め決められた各マーカー分子の標準偏差を示し、mean(mi NASH)は、NASHを罹患している患者における予め決められた各マーカー分子の量の平均値を示し、mean(mi NAFL)は、NAFLを罹患している患者における予め決められた各マーカー分子の量の平均値を示す。)、
前記マーカー分子が(A)である場合、前記指標値が前記規格化スコアであり、
前記マーカー分子が(B)である場合、前記指標値が2つの群の規格化スコアから算出される、工程と、
(3)前記指標値が、基準値よりも大きい場合に、前記被験者がNASHを罹患している、又はその可能性があると判定する工程と、
を含む方法。 - 前記(B)の場合であって、前記指標値が2つの群の規格化スコアから線形式又は非線形式を用いて算出される、請求項1に記載の方法。
- 非アルコール性脂肪肝(NAFL)と非アルコール性脂肪肝炎(NASH)とを判別する方法であって、
(1)被験者から採取された血液に含まれる、マーカー分子の量を測定する工程であって、測定する前記マーカー分子が、
(A)PROS1、CLU、ANG、APOC3、APOD、CFHR1、コルチゾール、EGFR、HPN、IGFBP3、IL1B、IL23A、MET、MMP10、テトラネクチン、TTR、VDBP及びVEGFR-2からなる群1から選ばれる少なくとも2つのマーカー分子、
VCAM1、HA、CTSD、COL4、COL4-7S、ALB、AFP、AXL、CCL19、CGB、CSF1、FAS、Mac-2bp、CA19-9、NRCAM、OPG、VWF及びYKL-40からなる群2から選ばれる少なくとも2つのマーカー分子、
AST、PSAT、LEP、ICAM1、CK-18、GSTA1、ALT、INSIVD、INSMAP、6Ckine、AGT、CRP、CXCL10、FABP4、G6PI、HSP-60、P3NP及びテストステロンからなる群3から選ばれる少なくとも2つのマーカー分子、若しくは、
AREG、BDNF、CD40-L、EREG、FGF2、HBEGF、IGFBP2、MMP9、PAI-1、PDGFB、PLGF、SAP、TGFA、TGFB1、THBS1及びVTNからなる群4から選ばれる少なくとも2つのマーカー分子、
又は、
(B)前記群1、前記群2、前記群3及び前記群4から選ばれる2つの群のうちの、一方から選択される少なくとも2つのマーカー分子及び他方から選択される少なくとも2つのマーカー分子、
である、工程と、
(2)前記マーカー分子の量に基づいて算出される規格化スコアから指標値を求める工程であって、同一の群の前記マーカー分子の量に基づく前記規格化スコアが下記式1から算出され、

(式1において、Mは規格化スコアを示し、Nはマーカー分子の数を示し、miは、測定された各マーカー分子の量を示し、mean(mi)は、予め決められた各マーカー分子の量の平均値を示し、sd(mi)は、予め決められた各マーカー分子の標準偏差を示し、mean(mi NASH)は、NASHを罹患している患者における予め決められた各マーカー分子の量の平均値を示し、mean(mi NAFL)は、NAFLを罹患している患者における予め決められた各マーカー分子の量の平均値を示す。)、
前記マーカー分子が(A)である場合、前記指標値が前記規格化スコアであり、
前記マーカー分子が(B)である場合、前記指標値が2つの群の規格化スコアから平均算出式を用いる方法、線形回帰式を用いる方法、線形判別式を用いる方法、ロジスティック回帰式を用いる方法、非線形平均算出式を用いる方法、非線形回帰式を用いる方法、非線形判別式を用いる方法、又は、非線形ロジスティック回帰式を用いる方法により算出される、工程と、
(3)前記指標値が、基準値よりも大きい場合に、前記被験者がNASHを罹患している、又はその可能性があると判定する工程と、
を含む方法。 - 前記(B)の場合であり、ロジスティック回帰式を用いる方法として、前記指標値が2つの群の規格化スコアから下記式2により算出される、請求項1~3のいずれか一項に記載の方法。
I=a1×Ma1+a2×Ma2 (式2)
(式2において、Iは指標値を示し、Ma1及びMa2はそれぞれ、前記2つの群のうちの一方の規格化スコア及び他方の規格化スコアを示し、a1及びa2は、ロジスティック回帰分析によって定められる定数を示す。) - 前記(B)の場合であり、非線形判別式を用いる方法として、前記指標値が2つの群の規格化スコアから下記決定木1~6のいずれかにより算出される、請求項1~3のいずれか一項に記載の方法。
前記マーカー分子が、前記群1及び群2より選ばれる場合は、
M1a≧0.476ならばI=2、M1a<0.476かつM2a≧0.466ならばI=1 、M1a<0.476かつM2a<0.466ならばI=0 (決定木1)
前記マーカー分子が、前記群1及び群3より選ばれる場合は、
M3a≧0.409かつ M1a≧0.45ならばI=2、M3a≧0.409かつM1a<0.45ならばI=1、M3a<0.409ならばI=0 (決定木2)
前記マーカー分子が、前記群1及び群4より選ばれる場合は、
M4a≧0.547ならばI=2、M4a<0.547かつM1a≧0.468ならばI=1、M4a<0.547かつ M1a<0.468ならばI=0 (決定木3)
前記マーカー分子が、前記群2及び群3より選ばれる場合は、
M3a≧0.409かつM2a≧0.412ならばI=2、M3a≧0.409かつM2a<0.412ならばI=1、M3a<0.409ならばI=0 (決定木4)
前記マーカー分子が、前記群2及び群4より選ばれる場合は、
M4a≧0.547ならばI=2、M4a<0.547かつM2a≧0.413ならばI=1、M4a<0.547かつ M2a<0.413ならばI=0 (決定木5)
前記マーカー分子が、前記群3及び群4より選ばれる場合は、
M3a≧0.409ならばI=2、M3a<0.409かつM4a≧0.588ならばI=1、M3a<0.409かつM4a<0.588ならばI=0 (決定木6)
(決定木1~6において、Iは指標値を示し、M1a、M2a、M3a及びM4aはそれぞれ、前記群1、群2、群3、及び群4の規格化スコアを示す。)。 - 前記(A)の場合であって、前記マーカー分子が前記群1のPROS1及びCLUである、請求項1~3のいずれか一項に記載の方法。
- 前記(A)の場合であって、前記マーカー分子が前記群2のVCAM1及びHAである、VCAM1及びCTSDである、VCAM1及びCOL4である、VCAM1及びCOL4-7Sである、HA及びCOL4-7Sである、HA及びCTSDである、HA及びCOL4である、CTSD及びCOL4である、又は、CTSD及びCOL4-7Sである、請求項1~3のいずれか一項に記載の方法。
- 前記(A)の場合であって、前記マーカー分子が前記群3のAST及びPSATである、AST及びLEPである、AST及びICAM1である、AST、PSAT及びLEPである、AST、PSAT及びICAM1である、AST、LEP及びCK-18である、AST、ICAM1及びGSTA1である、又は、AST、PSAT及び6Ckineである、請求項1~3のいずれか一項に記載の方法。
- 前記(B)の群1と群3の組合せの場合であって、群1より選択されるマーカー分子がPROS1及びCLUであり、群3より選択されるマーカー分子がAST及びPSATである、AST及びLEPである、AST及びICAM1である、AST、PSAT及びLEPである、AST、PSAT及びICAM1である、AST、LEP及びCK-18である、AST、ICAM1及びGSTA1である、又は、AST、PSAT及び6Ckineである、請求項1~5のいずれか一項に記載の方法。
- 肝線維化を判別する方法であって、
被験者から採取された血液に含まれる、マーカー分子の量を測定する工程であって、測定する前記マーカー分子が、VCAM1、HA、CTSD、COL4、COL4-7S、ALB、AFP、AXL、CCL19、CGB、CSF1、FAS、Mac-2bp、CA19-9、NRCAM、OPG、VWF及びYKL-40からなる群2から選ばれる少なくとも2つのマーカー分子である、又は、VCAM1である、工程と、
前記マーカー分子の量に基づいて算出される規格化スコアが、基準値よりも大きい場合に、前記被験者が肝線維化の病態である、又はその可能性があると判定する工程であって、前記規格化スコアが下記式1から算出される工程、を含む方法。

(式1において、Mは規格化スコアを示し、Nはマーカー分子の数を示し、miは、測定された各マーカー分子の量を示し、mean(mi)は、予め決められた各マーカー分子の量の平均値を示し、sd(mi)は、予め決められた各マーカー分子の標準偏差を示し、mean(mi NASH)は、NASHを罹患している患者における予め決められた各マーカー分子の量の平均値を示し、mean(mi NAFL)は、NAFLを罹患している患者における予め決められた各マーカー分子の量の平均値を示す。) - 肝線維化を判別する方法であって、
前記マーカー分子が、VCAM1、HA、CTSD、COL4、COL4-7S、ALB、AFP、AXL、CCL19、CGB、CSF1、FAS、Mac-2bp、CA19-9、NRCAM、OPG、VWF及びYKL-40である、VCAM1である、VCAM1及びHAである、VCAM1及びCTSDである、VCAM1及びCOL4である、VCAM1及びCOL4-7Sである、HA及びCTSDである、CTSD及びCOL4である、HA及びCOL4である、HA及びCOL4-7Sである、又は、CTSD及びCOL4-7Sである、請求項10に記載の方法。 - 肝線維化の判別が、マテオーニ分類におけるType-1~Type-3の病態とType-4の病態との判別、又は、線維化Stageにおける、Stage0、Stage1又はStage2の病態と、Stage3又はStage4の病態との判別である、請求項10又は11に記載の方法。
- 肝疾患の病態の進展度を判定する方法であって、
被験者から採取された血液に含まれる、マーカー分子の量を測定する工程であって、測定する前記マーカー分子が、VCAM1である、VCAM1及びHAである、HA及びCOL4である、VCAM1及びCOL4である、HA及びCOL4-7Sである、又は、VCAM1及びCOL4-7Sである、工程と、
前記マーカー分子の量に基づいて算出される規格化スコアが大きい程、前記被験者における、肝臓の線維化の進展度、肝細胞の風船様変性の進展度、もしくは、肝臓の炎症の進展度が高い、又はそれらの可能性があると判定する工程であって、前記規格化スコアが下記式1から算出される工程、を含む方法。

(式1において、Mは規格化スコアを示し、Nはマーカー分子の数を示し、miは、測定された各マーカー分子の量を示し、mean(mi)は、予め決められた各マーカー分子の量の平均値を示し、sd(mi)は、予め決められた各マーカー分子の標準偏差を示し、mean(mi NASH)は、NASHを発症している患者における予め決められた各マーカー分子の量の平均値を示し、mean(mi NAFL)は、NAFLを発症している患者における予め決められた各マーカー分子の量の平均値を示す。) - 非アルコール性脂肪性肝疾患(NAFLD)の病態の進展度を判定する方法であって、
被験者から採取された血液に含まれる、マーカー分子の量を測定する工程であって、測定する前記マーカー分子が、VCAM1である、VCAM1及びHAである、HA及びCOL4である、VCAM1及びCOL4である、HA及びCOL4-7Sである、又は、VCAM1及びCOL4-7Sである、工程と、
前記マーカー分子の量に基づいて算出される規格化スコアが大きい程、前記被験者における、肝臓の線維化の進展度、非アルコール性脂肪肝疾患の活動性の進展度、肝細胞の風船様変性の進展度、もしくは、肝臓の炎症の進展度が高い、又はそれらの可能性があると判定する工程であって、前記規格化スコアが下記式1から算出される工程、を含む方法。
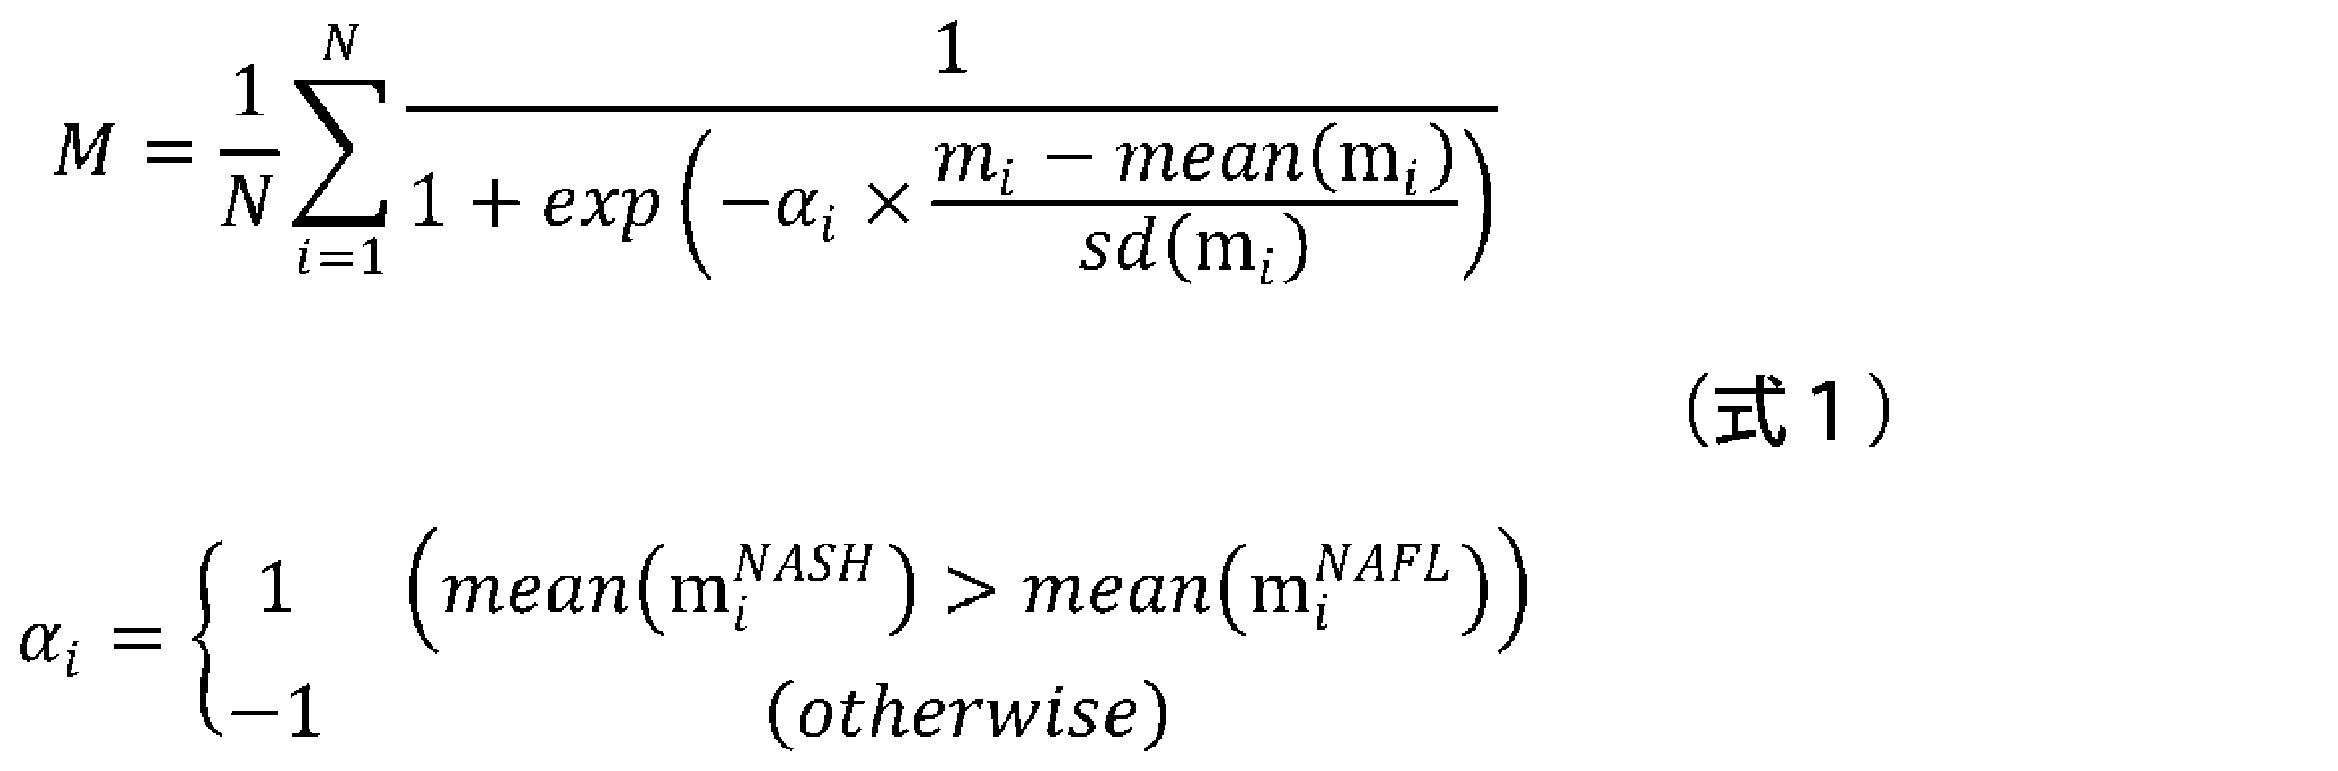
(式1において、Mは規格化スコアを示し、Nはマーカー分子の数を示し、miは、測定された各マーカー分子の量を示し、mean(mi)は、予め決められた各マーカー分子の量の平均値を示し、sd(mi)は、予め決められた各マーカー分子の標準偏差を示し、mean(mi NASH)は、NASHを発症している患者における予め決められた各マーカー分子の量の平均値を示し、mean(mi NAFL)は、NAFLを発症している患者における予め決められた各マーカー分子の量の平均値を示す。) - 請求項1~14のいずれか一項に記載の方法に使用するためのキットであって、
前記マーカー分子を検出するための試薬と、
前記方法を実施するための説明書と、を含むキット。 - 非アルコール性脂肪肝(NAFL)と非アルコール性脂肪肝炎(NASH)とを判別する方法であって、
被験者から採取された血液に含まれる、VCAM1の量を測定する工程と、
前記VCAM1の量が、基準値よりも大きい場合に、前記被験者がNASHを罹患している、又はその可能性があると判定する工程、を含む方法。 - 肝線維化を判別する方法であって、
被験者から採取された血液に含まれる、VCAM1の量を測定する工程と、
前記VCAM1の量が、基準値よりも大きい場合に、前記被験者が肝線維化の病態である、又はその可能性があると判定する工程、を含む方法。 - 肝疾患の病態の進展度を判定する方法であって、
被験者から採取された血液に含まれる、VCAM1の量を測定する工程と、
前記VCAM1の量が大きい程、前記被験者における、肝臓の線維化の進展度、肝細胞の風船様変性の進展度、もしくは、肝臓の炎症の進展度が高い、又はそれらの可能性があると判定する方法。 - 非アルコール性脂肪性肝疾患(NAFLD)の病態の進展度を判定する方法であって、
被験者から採取された血液に含まれる、VCAM1の量を測定する工程と、
前記VCAM1の量が大きい程、前記被験者における、肝臓の線維化の進展度、非アルコール性脂肪肝疾患の活動性の進展度、肝細胞の風船様変性の進展度、もしくは、肝臓の炎症の進展度が高い、又はそれらの可能性があると判定する方法。 - 請求項16~19のいずれか一項に記載の方法に使用するためのキットであって、
VCAM1を検出するための試薬を含む、キット。 - 請求項1~14のいずれか一項に記載の方法に使用するためのプログラムであって、
コンピュータに、
被験者から採取された血液に含まれる前記マーカー分子の量の測定データから前記式1に基づいて規格化スコアを算出し、算出された規格化スコアから指標値を求める、規格化ステップと、
求められた指標値を、基準値と比較する、比較ステップと、
比較した結果に基づき、肝疾患の病態を有するか否かを判定する、判定ステップと、
を実行させるためのプログラム。 - 請求項16~19のいずれか一項に記載の方法に使用するためのプログラムであって、
コンピュータに、
被験者から採取された血液に含まれるVCAM1の量を、基準値と比較する、比較ステップと、
比較した結果に基づき、肝疾患の病態を有するか否かを判定する、判定ステップと、
を実行させるためのプログラム。 - コンピュータに、被験者から採取された血液に含まれる前記マーカー分子の量又は前記VCAM1の量の測定データを取得する、取得ステップを更に実行させる、請求項21又は22に記載のプログラム。
- 請求項1~14、及び16~19のいずれか一項に記載の方法に使用するための測定装置であって、
試料を設置するための試料設置部と、前記試料に光を照射するための光源部と、前記試料を透過した光を検出する検出部と、を備える測定装置。 - 請求項1~14のいずれか一項に記載の方法に使用するための肝疾患判定システムであって、
被験者から採取された血液に含まれる前記マーカー分子の量を測定する測定装置と、測定した前記マーカー分子の量に基づいて肝疾患の病態を判定する肝疾患判定装置とを備え、
前記測定装置が試料を設置するための試料設置部と、前記試料に光を照射するための光源部と、前記試料を透過した光を検出する検出部と、を備え、
前記肝疾患判定装置が、前記測定装置からの測定データを取得する取得手段と、前記測定データから前記式1に基づいて規格化スコアを算出し、算出された規格化スコアから指標値を求める規格化手段と、求められた指標値を基準値と比較する比較手段と、比較した結果に基づき、肝疾患の病態を有するか否かを判定する判定手段と、を備える、肝疾患判定システム。 - 請求項16~19のいずれか一項に記載の方法に使用するための肝疾患判定システムであって、
被験者から採取された血液に含まれるVCAM1の量を測定する測定装置と、測定した前記VCAM1の量に基づいて肝疾患の病態を判定する肝疾患判定装置とを備え、
前記測定装置が試料を設置するための試料設置部と、前記試料に光を照射するための光源部と、前記試料を透過した光を検出する検出部と、を備え、
前記肝疾患判定装置が、前記測定装置からの測定データを取得する取得手段と、前記VCAM1の量を基準値と比較する比較手段と、比較した結果に基づき、肝疾患の病態を有するか否かを判定する判定手段と、を備える、肝疾患判定システム。 - 非アルコール性脂肪肝炎(NASH)を罹患している、肝臓の線維化の病態である、肝臓の線維化の進展度が高い、肝細胞の風船様変性の病態の進展度が高い、肝臓の炎症の進展度が高い、肝肥大の病態である、肝細胞の壊死の病態である、肝細胞のアポトーシスの病態である、肝細胞の変性の病態である、肝臓の脂肪化の病態である、又はそれらの可能性があるかを判定するための診断薬であって、VCAM1を検出するための試薬を含有する診断薬。
- 前記VCAM1を検出するための試薬が、抗体である、請求項27に記載の診断薬。
- 非アルコール性脂肪肝炎(NASH)、肝臓の線維化、肝細胞の風船様変性、肝臓の炎症、肝肥大、肝細胞の壊死、肝細胞のアポトーシス、肝細胞の変性、又は、肝臓の脂肪化のインビトロ検出のための、VCAM1を検出するための試薬の使用。
- 他の診断薬と併用する、請求項29に記載の使用。
- 他の診断薬がHA、COL4、又は、COL4-7Sを検出するため診断薬である、請求項30に記載の使用。
- コンピュータに、
被験者から採取された血液に含まれるマーカー分子の量の測定データから求められた指標値を、基準値と比較する、比較ステップであって、前記マーカー分子がVCAM1を含む、ステップと、
比較した結果に基づき、肝疾患の病態を有するか否かを判定する、判定ステップと、
を実行させるためのプログラム。 - コンピュータに、被験者から採取された血液に含まれるマーカー分子の量の測定データを取得する、取得ステップを更に実行させる、請求項32に記載のプログラム。
- コンピュータに、前記測定データから規格化スコアを算出し、算出された規格化スコアから指標値を求める、規格化ステップをさらに実行させる、請求項32又は33に記載のプログラム。
- 前記マーカー分子がHA、COL4、又は、COL4-7Sを更に含む、請求項32~33のいずれか一項に記載のプログラム。
- 非アルコール性脂肪肝炎(NASH)の治療薬の効果を判定する方法であって、
NASH患者に対して前記治療薬の適用前と適用後とにおいてそれぞれ、前記患者から採取された血液に含まれる、マーカー分子の量を測定する工程であって、測定する前記マーカー分子が、VCAM1である、VCAM1及びHAである、HA及びCOL4である、VCAM1及びCOL4である、HA及びCOL4-7Sである、又は、VCAM1及びCOL4-7Sである、工程と、
前記マーカー分子の量に基づいて前記治療薬の適用前と適用後のそれぞれ規格化スコアを算出し、適用後の規格化スコアが、適用前の規格化スコアよりも減少している場合、前記治療薬を適用した効果があった可能性があると判定する工程であって、前記規格化スコアが下記式1から算出される工程、を含む方法。

(式1において、Mは規格化スコアを示し、Nはマーカー分子の数を示し、miは、測定された各マーカー分子の量を示し、mean(mi)は、予め決められた各マーカー分子の量の平均値を示し、sd(mi)は、予め決められた各マーカー分子の標準偏差を示し、mean(mi NASH)は、NASHを発症している患者における予め決められた各マーカー分子の量の平均値を示し、mean(mi NAFL)は、NAFLを発症している患者における予め決められた各マーカー分子の量の平均値を示す。) - 非アルコール性脂肪肝炎(NASH)の治療薬の効果を判定する方法であって、
NASH患者に対して前記治療薬の適用前と適用後とにおいてそれぞれ、前記患者から採取された血液に含まれる、VCAM1の量を測定する工程と、
適用後のVCAM1の量が適用前のVCAM1の量よりも減少している場合、前記治療薬を適用した効果があった可能性があると判定する方法。 - 非アルコール性脂肪肝(NAFL)又は非アルコール性脂肪肝炎(NASH)の治療薬の効果を判定する方法であって、
NAFL又はNASH患者に対して前記治療薬の適用前と適用後とにおいてそれぞれ、
(1)被験者から採取された血液に含まれる、マーカー分子の量を測定する工程であって、測定する前記マーカー分子が、
(A)PROS1、CLU、ANG、APOC3、APOD、CFHR1、コルチゾール、EGFR、HPN、IGFBP3、IL1B、IL23A、MET、MMP10、テトラネクチン、TTR、VDBP及びVEGFR-2からなる群1から選ばれる少なくとも2つのマーカー分子、
VCAM1、HA、CTSD、COL4、COL4-7S、ALB、AFP、AXL、CCL19、CGB、CSF1、FAS、Mac-2bp、CA19-9、NRCAM、OPG、VWF及びYKL-40からなる群2から選ばれる少なくとも2つのマーカー分子、
AST、PSAT、LEP、ICAM1、CK-18、GSTA1、ALT、INSIVD、INSMAP、6Ckine、AGT、CRP、CXCL10、FABP4、G6PI、HSP-60、P3NP及びテストステロンからなる群3から選ばれる少なくとも2つのマーカー分子、若しくは、
AREG、BDNF、CD40-L、EREG、FGF2、HBEGF、IGFBP2、MMP9、PAI-1、PDGFB、PLGF、SAP、TGFA、TGFB1、THBS1及びVTNからなる群4から選ばれる少なくとも2つのマーカー分子、
又は、
(B)前記群1、前記群2、前記群3及び前記群4から選ばれる2つの群のうちの、一方から選択される少なくとも2つのマーカー分子及び他方から選択される少なくとも2つのマーカー分子、
である、工程と、
(2)前記マーカー分子の量に基づいて算出される規格化スコアから指標値を求める工程であって、同一の群の前記マーカー分子の量に基づく前記規格化スコアが下記式1から算出され、

(式1において、Mは規格化スコアを示し、Nはマーカー分子の数を示し、miは、測定された各マーカー分子の量を示し、mean(mi)は、予め決められた各マーカー分子の量の平均値を示し、sd(mi)は、予め決められた各マーカー分子の標準偏差を示し、mean(mi NASH)は、NASHを罹患している患者における予め決められた各マーカー分子の量の平均値を示し、mean(mi NAFL)は、NAFLを罹患している患者における予め決められた各マーカー分子の量の平均値を示す。)、
前記マーカー分子が(A)である場合、前記指標値が前記規格化スコアであり、
前記マーカー分子が(B)である場合、前記指標値が2つの群の規格化スコアから算出される、工程と、
(3)適用後の規格化スコアが、適用前の規格化スコアよりも減少している場合、前記治療薬を適用した効果があった可能性があると判定する工程と、
を含む方法。
Priority Applications (8)
| Application Number | Priority Date | Filing Date | Title |
|---|---|---|---|
| EP16776705.2A EP3282256A4 (en) | 2015-04-10 | 2016-04-08 | METHOD FOR THE DISTINCTION OF THE SYMPTOM OF LIVER DISEASE |
| CA2982097A CA2982097A1 (en) | 2015-04-10 | 2016-04-08 | Method for discriminating symptom of hepatic disease |
| CN201680019641.9A CN107407682A (zh) | 2015-04-10 | 2016-04-08 | 判别肝疾病的病态的方法 |
| US15/565,027 US20180100867A1 (en) | 2015-04-10 | 2016-04-08 | Method for Discriminating Symptom of Hepatic Disease |
| KR1020177031939A KR20170134641A (ko) | 2015-04-10 | 2016-04-08 | 간 질환의 병태를 판별하는 방법 |
| JP2017511103A JPWO2016163539A1 (ja) | 2015-04-10 | 2016-04-08 | 肝疾患の病態を判別する方法 |
| SG11201708301TA SG11201708301TA (en) | 2015-04-10 | 2016-04-08 | Method for discriminating symptom of hepatic disease |
| PH12017501841A PH12017501841A1 (en) | 2015-04-10 | 2017-10-06 | Method for discriminating symptom of hepatic disease |
Applications Claiming Priority (2)
| Application Number | Priority Date | Filing Date | Title |
|---|---|---|---|
| JP2015081175 | 2015-04-10 | ||
| JP2015-081175 | 2015-04-10 |
Publications (1)
| Publication Number | Publication Date |
|---|---|
| WO2016163539A1 true WO2016163539A1 (ja) | 2016-10-13 |
Family
ID=57073203
Family Applications (1)
| Application Number | Title | Priority Date | Filing Date |
|---|---|---|---|
| PCT/JP2016/061609 Ceased WO2016163539A1 (ja) | 2015-04-10 | 2016-04-08 | 肝疾患の病態を判別する方法 |
Country Status (10)
| Country | Link |
|---|---|
| US (1) | US20180100867A1 (ja) |
| EP (1) | EP3282256A4 (ja) |
| JP (1) | JPWO2016163539A1 (ja) |
| KR (1) | KR20170134641A (ja) |
| CN (1) | CN107407682A (ja) |
| CA (1) | CA2982097A1 (ja) |
| PH (1) | PH12017501841A1 (ja) |
| SG (1) | SG11201708301TA (ja) |
| TW (1) | TW201643760A (ja) |
| WO (1) | WO2016163539A1 (ja) |
Cited By (6)
| Publication number | Priority date | Publication date | Assignee | Title |
|---|---|---|---|---|
| JP2018066631A (ja) * | 2016-10-19 | 2018-04-26 | 日本化薬株式会社 | Nashやnafldの進展度の検査方法及び炎症疾患や癌の検査方法 |
| JP2018080943A (ja) * | 2016-11-14 | 2018-05-24 | 株式会社特殊免疫研究所 | Nashの検出方法 |
| JP2020527716A (ja) * | 2017-07-19 | 2020-09-10 | バイオ—ラッド ヨーロッパ ゲーエムベーハー | 非アルコール性脂肪性肝炎及び肝線維症ステータスを同時に評価するバイオマーカの組み合わせ |
| JP2021099248A (ja) * | 2019-12-20 | 2021-07-01 | 国立大学法人東京農工大学 | 非アルコール性脂肪肝炎マーカー及びその利用 |
| JP2021156648A (ja) * | 2020-03-25 | 2021-10-07 | 富士レビオ株式会社 | 被験者のスクリ−ニング方法及び鑑別方法 |
| WO2022014580A1 (ja) * | 2020-07-13 | 2022-01-20 | 国立大学法人信州大学 | 非アルコール性脂肪性肝疾患マーカー、非アルコール性脂肪性肝疾患を検出するための方法、それに用いる試薬及び分析用キット |
Families Citing this family (15)
| Publication number | Priority date | Publication date | Assignee | Title |
|---|---|---|---|---|
| FR2971256B1 (fr) | 2011-02-09 | 2024-09-27 | Bio Rad Pasteur | Combinaison de biomarqueurs pour la detection et l'evaluation d'une fibrose hepatique |
| GB201614455D0 (en) * | 2016-08-24 | 2016-10-05 | Univ Oxford Innovation Ltd | Biomarkers |
| CN108171200B (zh) * | 2018-01-12 | 2022-05-17 | 西安电子科技大学 | 基于sar图像统计分布和dbn的sar图像分类方法 |
| RU2675341C1 (ru) * | 2018-06-01 | 2018-12-18 | федеральное государственное бюджетное образовательное учреждение высшего образования "Северо-Западный государственный медицинский университет им. И.И. Мечникова" Министерства здравоохранения Российской Федерации | Способ определения степени фиброза печени |
| CN108932976A (zh) * | 2018-06-11 | 2018-12-04 | 西安医学院 | 一种非酒精性脂肪性肝病无创性诊断程序 |
| WO2020018974A1 (en) * | 2018-07-20 | 2020-01-23 | Lipocine Inc. | Liver disease |
| EP3879270B1 (en) * | 2018-11-09 | 2024-07-31 | Sekisui Medical Co., Ltd. | Method for distinguishing viral liver cancer from viral hepatitis or viral liver cirrhosis |
| TWI678709B (zh) * | 2018-11-15 | 2019-12-01 | 義守大學 | 藉由神經網路協助資料探勘與大數據之資料辨識進行疾病預測的方法 |
| CN110265139A (zh) * | 2019-02-01 | 2019-09-20 | 中国医药大学附设医院 | 肝纤维化评估模型、肝纤维化评估系统及其评估方法 |
| WO2022025069A1 (ja) * | 2020-07-28 | 2022-02-03 | 株式会社シンクメディカル | 疾患リスク評価方法、疾患リスク評価装置、及び疾患リスク評価プログラム |
| CN113160983A (zh) * | 2021-04-09 | 2021-07-23 | 南京医科大学附属逸夫医院 | 一种代谢相关脂肪性肝病临床预测模型 |
| CN113380415A (zh) * | 2021-05-20 | 2021-09-10 | 昆明医科大学第二附属医院 | 一种酒精使用障碍临床预后不良预测模型及其构建方法 |
| CA3218787A1 (en) * | 2021-05-31 | 2022-12-08 | Jan Roeland Occo Hanemaaijer | Protein biomarkers for non-alcoholic fatty liver disease (nafld) |
| KR102763266B1 (ko) * | 2021-11-30 | 2025-02-04 | 충남대학교산학협력단 | Axl을 포함하는 지방간 예방 또는 치료용 조성물 |
| WO2024123172A1 (en) * | 2022-12-07 | 2024-06-13 | Nederlandse Organisatie Voor Toegepast-Natuurwetenschappelijk Onderzoek Tno | Protein biomarkers for prognosis of liver fibrosis |
Citations (6)
| Publication number | Priority date | Publication date | Assignee | Title |
|---|---|---|---|---|
| JP2005519271A (ja) * | 2002-02-28 | 2005-06-30 | プロミシアス ラボラトリーズ, インコーポレイテッド | 肝線維症の診断方法 |
| WO2007122799A1 (ja) * | 2006-03-29 | 2007-11-01 | Yamasa Corporation | 肝障害の検出方法、判定方法及び予測方法 |
| JP2007315752A (ja) * | 2004-08-16 | 2007-12-06 | Ajinomoto Co Inc | 肝線維化ステージの判定方法 |
| WO2009090882A1 (ja) * | 2008-01-18 | 2009-07-23 | The University Of Tokyo | 非アルコール性脂肪性肝疾患の診断方法 |
| WO2010073870A1 (ja) * | 2008-12-24 | 2010-07-01 | 学校法人 慶應義塾 | 肝臓疾患マーカー、その測定方法、装置及び医薬品の検定方法 |
| JP2011252868A (ja) * | 2010-06-04 | 2011-12-15 | Yamaguchi Univ | Nafldの進展度合いを判定する方法 |
Family Cites Families (8)
| Publication number | Priority date | Publication date | Assignee | Title |
|---|---|---|---|---|
| WO2007136822A2 (en) * | 2006-05-19 | 2007-11-29 | George Mason Intellectual Properties, Inc. | Methods to diagnose non-alcoholic steatohepatitis |
| EP3285072B1 (en) * | 2006-08-08 | 2020-04-15 | Metabolon, Inc. | Markers of non-alcoholic fatty liver disease (nafld) and non-alcoholic steatohepatitis (nash) and methods of use thereof |
| US7824871B2 (en) * | 2007-06-14 | 2010-11-02 | George Mason Intellectual Properties | Methods of diagnosing non-alcoholic steatohepatitis (NASH) |
| US20090163474A1 (en) * | 2007-10-19 | 2009-06-25 | Wyeth | FXR Agonists for the Treatment of Nonalcoholic Fatty Liver and Cholesterol Gallstone Diseases |
| CN105243295B (zh) * | 2010-11-30 | 2018-08-17 | 香港中文大学 | 与癌症相关的遗传或分子畸变的检测 |
| WO2012105590A1 (ja) * | 2011-02-01 | 2012-08-09 | アステラス製薬株式会社 | 非アルコール性脂肪肝炎の鑑別マーカー及び当該マーカーを指標とした非アルコール性脂肪肝炎の診断方法 |
| CN102854306B (zh) * | 2011-12-23 | 2013-08-07 | 中国人民解放军第三〇九医院 | 用于预警肾移植后排斥反应的试剂盒及其使用方法 |
| WO2014160275A2 (en) * | 2013-03-14 | 2014-10-02 | Battell Memorial Institute | Biomarkers for liver fibrosis |
-
2016
- 2016-04-08 TW TW105111186A patent/TW201643760A/zh unknown
- 2016-04-08 CA CA2982097A patent/CA2982097A1/en not_active Abandoned
- 2016-04-08 US US15/565,027 patent/US20180100867A1/en not_active Abandoned
- 2016-04-08 KR KR1020177031939A patent/KR20170134641A/ko not_active Withdrawn
- 2016-04-08 CN CN201680019641.9A patent/CN107407682A/zh active Pending
- 2016-04-08 WO PCT/JP2016/061609 patent/WO2016163539A1/ja not_active Ceased
- 2016-04-08 EP EP16776705.2A patent/EP3282256A4/en not_active Withdrawn
- 2016-04-08 SG SG11201708301TA patent/SG11201708301TA/en unknown
- 2016-04-08 JP JP2017511103A patent/JPWO2016163539A1/ja not_active Withdrawn
-
2017
- 2017-10-06 PH PH12017501841A patent/PH12017501841A1/en unknown
Patent Citations (6)
| Publication number | Priority date | Publication date | Assignee | Title |
|---|---|---|---|---|
| JP2005519271A (ja) * | 2002-02-28 | 2005-06-30 | プロミシアス ラボラトリーズ, インコーポレイテッド | 肝線維症の診断方法 |
| JP2007315752A (ja) * | 2004-08-16 | 2007-12-06 | Ajinomoto Co Inc | 肝線維化ステージの判定方法 |
| WO2007122799A1 (ja) * | 2006-03-29 | 2007-11-01 | Yamasa Corporation | 肝障害の検出方法、判定方法及び予測方法 |
| WO2009090882A1 (ja) * | 2008-01-18 | 2009-07-23 | The University Of Tokyo | 非アルコール性脂肪性肝疾患の診断方法 |
| WO2010073870A1 (ja) * | 2008-12-24 | 2010-07-01 | 学校法人 慶應義塾 | 肝臓疾患マーカー、その測定方法、装置及び医薬品の検定方法 |
| JP2011252868A (ja) * | 2010-06-04 | 2011-12-15 | Yamaguchi Univ | Nafldの進展度合いを判定する方法 |
Non-Patent Citations (2)
| Title |
|---|
| YOSHIMURA K ET AL.: "Identification of novel noninvasive markers for diagnosing nonalcoholic steatohepatitis and related fibrosis by data mining.", HEPATOLOGY., vol. 63, no. 2, February 2016 (2016-02-01), pages 462 - 473, XP055321829 * |
| YOSHIO SUMIDA ET AL.: "Noninvasive scoring systems for the diagnosis of NASH/NAFLD", KAN TAN SUI, vol. 60, no. 6, 28 June 2010 (2010-06-28), pages 963 - 970, XP009507332 * |
Cited By (9)
| Publication number | Priority date | Publication date | Assignee | Title |
|---|---|---|---|---|
| JP2018066631A (ja) * | 2016-10-19 | 2018-04-26 | 日本化薬株式会社 | Nashやnafldの進展度の検査方法及び炎症疾患や癌の検査方法 |
| JP2018080943A (ja) * | 2016-11-14 | 2018-05-24 | 株式会社特殊免疫研究所 | Nashの検出方法 |
| JP2020527716A (ja) * | 2017-07-19 | 2020-09-10 | バイオ—ラッド ヨーロッパ ゲーエムベーハー | 非アルコール性脂肪性肝炎及び肝線維症ステータスを同時に評価するバイオマーカの組み合わせ |
| JP7273022B2 (ja) | 2017-07-19 | 2023-05-12 | バイオ―ラッド ヨーロッパ ゲーエムベーハー | 非アルコール性脂肪性肝炎及び肝線維症ステータスを同時に評価するバイオマーカの組み合わせ |
| JP2021099248A (ja) * | 2019-12-20 | 2021-07-01 | 国立大学法人東京農工大学 | 非アルコール性脂肪肝炎マーカー及びその利用 |
| JP7383282B2 (ja) | 2019-12-20 | 2023-11-20 | 国立大学法人東京農工大学 | 非アルコール性脂肪肝炎マーカー及びその利用 |
| JP2021156648A (ja) * | 2020-03-25 | 2021-10-07 | 富士レビオ株式会社 | 被験者のスクリ−ニング方法及び鑑別方法 |
| JP7446882B2 (ja) | 2020-03-25 | 2024-03-11 | 富士レビオ株式会社 | 被験者のスクリ-ニング方法及び鑑別方法 |
| WO2022014580A1 (ja) * | 2020-07-13 | 2022-01-20 | 国立大学法人信州大学 | 非アルコール性脂肪性肝疾患マーカー、非アルコール性脂肪性肝疾患を検出するための方法、それに用いる試薬及び分析用キット |
Also Published As
| Publication number | Publication date |
|---|---|
| SG11201708301TA (en) | 2017-11-29 |
| EP3282256A4 (en) | 2019-03-06 |
| JPWO2016163539A1 (ja) | 2018-04-19 |
| EP3282256A1 (en) | 2018-02-14 |
| TW201643760A (zh) | 2016-12-16 |
| CN107407682A (zh) | 2017-11-28 |
| KR20170134641A (ko) | 2017-12-06 |
| PH12017501841A1 (en) | 2018-02-26 |
| US20180100867A1 (en) | 2018-04-12 |
| CA2982097A1 (en) | 2016-10-13 |
Similar Documents
| Publication | Publication Date | Title |
|---|---|---|
| WO2016163539A1 (ja) | 肝疾患の病態を判別する方法 | |
| JP7104689B2 (ja) | 有害事象を示すマーカーとしてのヒストンおよび/またはproADM | |
| JP6692422B2 (ja) | 尿中代謝物による疾病診断法 | |
| Qiao et al. | Serum gp73 is also a biomarker for diagnosing cirrhosis in population with chronic HBV infection | |
| CN112805789A (zh) | 诊断肝脂肪变性的方法 | |
| Linkov et al. | Reliability of tumor markers, chemokines, and metastasis-related molecules in serum | |
| CN104272112B (zh) | 用于帮助诊断中风的基于生物标记的方法和生物芯片 | |
| JP6072768B2 (ja) | 川崎病の診断マーカーおよび治療標的 | |
| US20230358764A1 (en) | Diagnostic methods for liver disorders | |
| Peterson et al. | Antibodies to phosphatidylserine/prothrombin complex in antiphospholipid syndrome: analytical and clinical perspectives | |
| CN105021827B (zh) | 检测血清血管生成素样蛋白2含量的物质在制备检测肝脏炎症和纤维化程度产品中的应用 | |
| Nishikawa et al. | Proposal of a predictive model for advanced fibrosis containing Wisteria floribunda agglutinin‐positive Mac‐2‐binding protein in chronic hepatitis C | |
| JP4927825B2 (ja) | 初期段階の心機能異常を診断または予測するための装置および方法 | |
| CN119959543A (zh) | 用于辅助诊断食管癌淋巴结转移的免疫生物标志物及其应用 | |
| WO2013119279A2 (en) | Assays and methods for the diagnosis of ovarian cancer | |
| Pokrovsky et al. | Multiplex analysis of ovarian cancer patients using glycan microarray | |
| JP2019514026A (ja) | 一般集団におけるlvhへの進行因子の同定のための可溶性st2 | |
| Zhang et al. | A method of quantitative chemiluminescence immunoassay for the concentration of Growth differentiation factor-15 | |
| Guang et al. | Evaluation of Biomarkers from Routine Laboratory Indicators for Establishing Molecular Age Score with Considering Survival Probability. | |
| HK1242774A1 (en) | Method for discriminating symptom of hepatic disease | |
| JP2023519654A (ja) | 脳卒中の評価のためのret(トランスフェクション再編成) | |
| Hsia et al. | Urinary biomarker of oxidative stress correlating with outcome in critically septic patients | |
| CN120468433A (zh) | 一种用来预测低氧反应的蛋白质标志物及其试剂盒 | |
| JP2011520115A (ja) | 胎盤増殖因子及び可溶性flt1に基づいて糖尿病患者の腎不全を予測するための手段及び方法 | |
| Algobashy et al. | Leptin, vitamin D, and APRI values during the six months post-liver transplantation |
Legal Events
| Date | Code | Title | Description |
|---|---|---|---|
| 121 | Ep: the epo has been informed by wipo that ep was designated in this application |
Ref document number: 16776705 Country of ref document: EP Kind code of ref document: A1 |
|
| ENP | Entry into the national phase |
Ref document number: 2017511103 Country of ref document: JP Kind code of ref document: A |
|
| ENP | Entry into the national phase |
Ref document number: 2982097 Country of ref document: CA |
|
| WWE | Wipo information: entry into national phase |
Ref document number: 15565027 Country of ref document: US Ref document number: 12017501841 Country of ref document: PH |
|
| WWE | Wipo information: entry into national phase |
Ref document number: 11201708301T Country of ref document: SG |
|
| NENP | Non-entry into the national phase |
Ref country code: DE |
|
| ENP | Entry into the national phase |
Ref document number: 20177031939 Country of ref document: KR Kind code of ref document: A |