WO2016194338A1 - 画像処理方法および画像処理装置 - Google Patents
画像処理方法および画像処理装置 Download PDFInfo
- Publication number
- WO2016194338A1 WO2016194338A1 PCT/JP2016/002526 JP2016002526W WO2016194338A1 WO 2016194338 A1 WO2016194338 A1 WO 2016194338A1 JP 2016002526 W JP2016002526 W JP 2016002526W WO 2016194338 A1 WO2016194338 A1 WO 2016194338A1
- Authority
- WO
- WIPO (PCT)
- Prior art keywords
- image
- region
- interest
- bright spot
- luminance value
- Prior art date
- Legal status (The legal status is an assumption and is not a legal conclusion. Google has not performed a legal analysis and makes no representation as to the accuracy of the status listed.)
- Ceased
Links
Images

Classifications
-
- G—PHYSICS
- G01—MEASURING; TESTING
- G01N—INVESTIGATING OR ANALYSING MATERIALS BY DETERMINING THEIR CHEMICAL OR PHYSICAL PROPERTIES
- G01N21/00—Investigating or analysing materials by the use of optical means, i.e. using sub-millimetre waves, infrared, visible or ultraviolet light
- G01N21/62—Systems in which the material investigated is excited whereby it emits light or causes a change in wavelength of the incident light
- G01N21/63—Systems in which the material investigated is excited whereby it emits light or causes a change in wavelength of the incident light optically excited
- G01N21/64—Fluorescence; Phosphorescence
- G01N21/645—Specially adapted constructive features of fluorimeters
- G01N21/6456—Spatial resolved fluorescence measurements; Imaging
-
- G—PHYSICS
- G06—COMPUTING OR CALCULATING; COUNTING
- G06T—IMAGE DATA PROCESSING OR GENERATION, IN GENERAL
- G06T7/00—Image analysis
- G06T7/0002—Inspection of images, e.g. flaw detection
- G06T7/0012—Biomedical image inspection
-
- G—PHYSICS
- G01—MEASURING; TESTING
- G01N—INVESTIGATING OR ANALYSING MATERIALS BY DETERMINING THEIR CHEMICAL OR PHYSICAL PROPERTIES
- G01N21/00—Investigating or analysing materials by the use of optical means, i.e. using sub-millimetre waves, infrared, visible or ultraviolet light
- G01N21/62—Systems in which the material investigated is excited whereby it emits light or causes a change in wavelength of the incident light
- G01N21/63—Systems in which the material investigated is excited whereby it emits light or causes a change in wavelength of the incident light optically excited
- G01N21/64—Fluorescence; Phosphorescence
- G01N21/6428—Measuring fluorescence of fluorescent products of reactions or of fluorochrome labelled reactive substances, e.g. measuring quenching effects, using measuring "optrodes"
-
- G—PHYSICS
- G06—COMPUTING OR CALCULATING; COUNTING
- G06T—IMAGE DATA PROCESSING OR GENERATION, IN GENERAL
- G06T1/00—General purpose image data processing
-
- G—PHYSICS
- G06—COMPUTING OR CALCULATING; COUNTING
- G06T—IMAGE DATA PROCESSING OR GENERATION, IN GENERAL
- G06T5/00—Image enhancement or restoration
- G06T5/70—Denoising; Smoothing
-
- G—PHYSICS
- G06—COMPUTING OR CALCULATING; COUNTING
- G06T—IMAGE DATA PROCESSING OR GENERATION, IN GENERAL
- G06T5/00—Image enhancement or restoration
- G06T5/73—Deblurring; Sharpening
- G06T5/75—Unsharp masking
-
- G—PHYSICS
- G06—COMPUTING OR CALCULATING; COUNTING
- G06T—IMAGE DATA PROCESSING OR GENERATION, IN GENERAL
- G06T7/00—Image analysis
- G06T7/10—Segmentation; Edge detection
- G06T7/11—Region-based segmentation
-
- G—PHYSICS
- G06—COMPUTING OR CALCULATING; COUNTING
- G06T—IMAGE DATA PROCESSING OR GENERATION, IN GENERAL
- G06T7/00—Image analysis
- G06T7/10—Segmentation; Edge detection
- G06T7/136—Segmentation; Edge detection involving thresholding
-
- G—PHYSICS
- G01—MEASURING; TESTING
- G01N—INVESTIGATING OR ANALYSING MATERIALS BY DETERMINING THEIR CHEMICAL OR PHYSICAL PROPERTIES
- G01N21/00—Investigating or analysing materials by the use of optical means, i.e. using sub-millimetre waves, infrared, visible or ultraviolet light
- G01N21/62—Systems in which the material investigated is excited whereby it emits light or causes a change in wavelength of the incident light
- G01N21/63—Systems in which the material investigated is excited whereby it emits light or causes a change in wavelength of the incident light optically excited
- G01N21/64—Fluorescence; Phosphorescence
- G01N21/6428—Measuring fluorescence of fluorescent products of reactions or of fluorochrome labelled reactive substances, e.g. measuring quenching effects, using measuring "optrodes"
- G01N2021/6439—Measuring fluorescence of fluorescent products of reactions or of fluorochrome labelled reactive substances, e.g. measuring quenching effects, using measuring "optrodes" with indicators, stains, dyes, tags, labels, marks
-
- G—PHYSICS
- G06—COMPUTING OR CALCULATING; COUNTING
- G06T—IMAGE DATA PROCESSING OR GENERATION, IN GENERAL
- G06T2207/00—Indexing scheme for image analysis or image enhancement
- G06T2207/10—Image acquisition modality
- G06T2207/10056—Microscopic image
-
- G—PHYSICS
- G06—COMPUTING OR CALCULATING; COUNTING
- G06T—IMAGE DATA PROCESSING OR GENERATION, IN GENERAL
- G06T2207/00—Indexing scheme for image analysis or image enhancement
- G06T2207/10—Image acquisition modality
- G06T2207/10064—Fluorescence image
-
- G—PHYSICS
- G06—COMPUTING OR CALCULATING; COUNTING
- G06T—IMAGE DATA PROCESSING OR GENERATION, IN GENERAL
- G06T2207/00—Indexing scheme for image analysis or image enhancement
- G06T2207/20—Special algorithmic details
- G06T2207/20021—Dividing image into blocks, subimages or windows
-
- G—PHYSICS
- G06—COMPUTING OR CALCULATING; COUNTING
- G06T—IMAGE DATA PROCESSING OR GENERATION, IN GENERAL
- G06T2207/00—Indexing scheme for image analysis or image enhancement
- G06T2207/20—Special algorithmic details
- G06T2207/20036—Morphological image processing
-
- G—PHYSICS
- G06—COMPUTING OR CALCULATING; COUNTING
- G06T—IMAGE DATA PROCESSING OR GENERATION, IN GENERAL
- G06T2207/00—Indexing scheme for image analysis or image enhancement
- G06T2207/20—Special algorithmic details
- G06T2207/20172—Image enhancement details
-
- G—PHYSICS
- G06—COMPUTING OR CALCULATING; COUNTING
- G06T—IMAGE DATA PROCESSING OR GENERATION, IN GENERAL
- G06T2207/00—Indexing scheme for image analysis or image enhancement
- G06T2207/30—Subject of image; Context of image processing
- G06T2207/30004—Biomedical image processing
- G06T2207/30024—Cell structures in vitro; Tissue sections in vitro
Definitions
- This disclosure relates to an image processing method for extracting a detection target in an observation image.
- Detecting cells infected with pathogenic bacteria or cells having a predetermined protein is important in the fields of food and medicine.
- the health condition of animals and plants can be known by examining the infection rate of pathogenic bacteria.
- the number of pathogenic bacteria in cells is measured by image analysis of fluorescence observation images of pathogenic bacteria labeled with a fluorescent dye.
- the number of cells is measured, for example, by image analysis of fluorescence observation images of cells stained with a fluorescent dye different from the fluorescent dye that labels pathogenic bacteria.
- the number of cells is measured by image analysis of bright field observation images of cells. The infection rate of the pathogen is calculated using the measured number of pathogens and the number of cells.
- Patent Document 1 and Patent Document 2 are known as prior art documents related to the present disclosure.
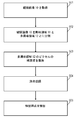
- the observation image including the detected bright spot is divided into an interest area and a non-interest area.
- a first image is obtained by replacing the luminance value of the non-interesting area with a predetermined luminance value.
- a second image is obtained by executing bright spot enhancement processing on the first image.
- a detected bright spot is extracted from the second image.
- Detected bright spots in the observation image can be accurately extracted by this image processing method.
- FIG. 1 is a diagram showing an observation image of the image processing method according to the embodiment.
- FIG. 2 is a diagram illustrating a flow of the image processing method according to the embodiment.
- FIG. 3A is a diagram illustrating an image obtained by the image processing method according to the embodiment.
- FIG. 3B is a diagram illustrating an image obtained by the image processing method according to the embodiment.
- FIG. 3C is a diagram illustrating an image obtained by the image processing method according to the embodiment.
- FIG. 3D is a diagram illustrating an image obtained by the image processing method according to the embodiment.
- FIG. 3E is a diagram illustrating an image obtained by the image processing method according to the embodiment.
- FIG. 4 is a block diagram of the image processing apparatus according to the embodiment.
- the image processing method in the present embodiment can be used for, for example, a fluorescence observation image obtained by photographing a sample and a detection target included in the sample.
- Specimens are collected from living organisms such as cells and tissues.
- the cells are red blood cells and IPS cells (Induced Pluripotent Stem Cells).
- the detection target is a parasite such as a malaria protozoan, hemoplasma protozoan, or Babesia protozoa present in the sample, a virus, a protein, a cell nucleus, or a foreign substance.
- the image processing method will be described on the assumption that the sample is red blood cells and the detection target is a parasite existing inside the red blood cells.
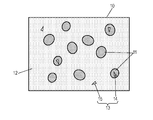
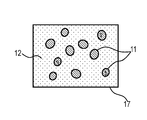
- FIG. 1 shows an observation image 10 used in the image processing method in the embodiment.
- the observation image 10 is, for example, a fluorescence observation image obtained by photographing a sample modified with a fluorescent dye and a detection target with a fluorescence detection apparatus.
- the sample is specifically bound to a fluorescent dye that emits fluorescence with excitation light having a predetermined wavelength.
- the fluorescent dye includes, for example, an antigen that selectively binds to a protein specific to the sample.
- the fluorescence detection apparatus can photograph only the sample.
- the detection target is specifically bound to a fluorescent dye that emits fluorescence with excitation light having a predetermined wavelength.
- it is desirable that the wavelength of the excitation light at which the fluorescent dye indicating the sample emits fluorescence is different from the wavelength of the excitation light at which the fluorescent dye indicating the detection target emits fluorescence.
- the fluorescence detection apparatus can image only the detection object.
- the fluorescence detection apparatus includes an optical system that irradiates excitation light having two types of wavelengths. The observation image 10 is taken using two-wavelength excitation light.
- the observation image 10 is an image obtained by superimposing a plurality of images captured with different excitation lights. Note that one of the plurality of images to be superimposed may be a transmitted light observation image using a phase difference or the like.
- the transmitted light observation image is, for example, an image obtained by photographing a sample.
- the observation image 10 has an area of interest 11 and a non-interest area 12.
- the region of interest 11 is a region where red blood cells as samples exist.
- the non-interest region 12 is a region other than the region of interest 11 in the observation image 10.
- the observation image 10 has a fluorescent bright spot 13 emitted from the fluorescent dye.
- the bright spot 13 includes a detected bright spot 14 indicating a detection target object and a non-detection bright spot 15 indicating a non-detection target object.
- the parasite that is the detection target exists in the red blood cells. Therefore, the detected bright spot 14 is the bright spot 13 existing in the region of interest 11. Further, the non-detection bright spot 15 which is detection noise is a bright spot 13 existing in the non-interesting region 12.
- the image processing method in the embodiment is executed to extract the detected bright spot 14.
- FIG. 2 is a flowchart of the image processing method in the embodiment.
- 3A to 3E show images obtained by the image processing method according to the embodiment.
- FIG. 3A shows the observation image 10 acquired in step S01.
- the plurality of pixels of the observation image 10 have luminance value data respectively corresponding to the plurality of pixels.
- the luminance value of the pixel of the observation image 10 decreases in the order of the luminance value of the pixel at the position of the detection target, the luminance value of the pixel at the background position, and the luminance value of the pixel at the position of the sample.
- the order of the luminance values is determined according to the method of acquiring the observation image 10.
- the order of the luminance values used in the image processing method is not particularly limited.
- the region of the observation image 10 is divided into an interest region 11 and a non-interest region 12 (step S02).
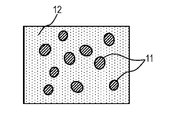
- FIG. 3B shows the observation image 10 obtained in step S02.
- the region of interest 11 is a region where the sample exists in the observation image 10.
- a region other than the region of interest 11 is a non-interest region 12. That is, the non-interest region 12 is a region where no sample exists.
- the non-interest region 12 is a background region such as an inspection plate, for example.
- the division of the region of interest 11 and the non-interest region 12 is performed using the luminance value of the observation image 10.
- the observation area 10 is binarized with a predetermined luminance threshold value, thereby discriminating the region of interest 11 and the non-interest region 12.
- the luminance threshold value for dividing the region of interest 11 and the non-interest region 12 can be set to a value between the luminance value of the sample and the luminance value of the background. In this case, for example, it is determined that a pixel having a luminance value less than the threshold is included in the region of interest 11, and a pixel having a luminance value higher than the threshold is determined to be included in the non-interest region 12.
- the region of interest 11 may be specified by two threshold values including an upper limit value and a lower limit value.
- a pixel having a luminance value greater than or equal to the lower limit value and less than the upper limit value is determined to be included in the region of interest 11
- a pixel having a luminance value greater than or equal to the upper limit value or less than the lower limit value is included in the non-interest region 12. It is determined that Thereby, the region of interest 11 can be specified more accurately.
- the region of interest 11 may be specified by further using a size threshold.
- a size threshold when one candidate region composed of a plurality of pixels determined to be included in the region of interest 11 based on the luminance value has a size equal to or larger than the size threshold, the candidate region is the region of interest 11.
- Judge that there is. If the candidate area has a size less than the size threshold, it is determined that the candidate area is included in the non-interest area 12 instead of the interest area 11.
- a region that occurs due to a luminance drop due to random noise and is smaller than the size of the sample can be regarded as the non-interest region 12. Therefore, erroneous discrimination of the region of interest 11 can be suppressed.
- the size of the region of interest is the area of the region of interest.
- the area is represented by the number of consecutive pixels having a predetermined luminance value or more.
- the luminance threshold and the size threshold used for dividing the region are set in advance according to the sample.
- the binarized image may have a lack of area in the interior or outline of the area where the sample exists.
- the lack of the region is caused by the fluorescence signal of the detection target existing inside the sample and the sample being partially transmitted and having a luminance equivalent to the background.
- the missing area affects the subsequent detection of the detected bright spot. Therefore, it is necessary to correct the image by filling in the missing area.
- the missing region is corrected by performing a morphological process on the binarized image.
- the morphological process is a process of updating data of one pixel in an image with reference to pixels around the one pixel. Specifically, a pixel determined to be a non-interest region 12 by binarization is converted so that it is regarded as the region of interest 11 when a predetermined number or more of the pixels adjacent to the pixel belong to the region of interest 11.
- a smoothing method includes a Gaussian mask or a bilateral mask.
- the Gaussian mask smoothes the brightness value of the entire image using the brightness value of that pixel and the brightness values of surrounding pixels weighted with a Gaussian distribution according to the distance from that pixel. It is a process to convert.
- the bilateral mask includes, for a luminance value of one pixel, a luminance value of the pixel and luminance values of surrounding pixels weighted by a Gaussian distribution in consideration of a distance from the pixel and a luminance value. This process is used to smooth the luminance value of the entire image.
- all the bright spots including the fluorescence signal of the detection target existing inside the sample may be extracted in advance with a predetermined threshold.
- the extracted luminance value is replaced with a predetermined luminance value between the background luminance value and the luminance threshold value used for dividing the sample region.
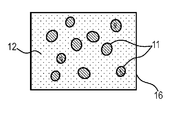
- FIG. 3C shows an image 16 in which the luminance value of the non-interesting region 12 of the observation image 10 is replaced with a predetermined luminance value in step S03.
- the predetermined luminance value is, for example, an average luminance value of a partial region of the observation image 10, an entire average luminance value, or a luminance value calculated from those average luminance values.
- the luminance value calculated from the average luminance value is, for example, a value that is larger than the average luminance value and smaller than the detected bright spot.
- the luminance values of all the pixels in the non-interesting region 12 may be replaced with predetermined luminance values. Moreover, you may substitute the luminance value of the pixel which has a luminance value larger than a predetermined
- the non-detection bright spot 15 existing in the non-interesting region 12 is removed by the process of step S03.
- step S04 bright point enhancement processing is performed on the image 16 obtained in step S03 (step S04).
- the bright spot emphasis processing the weak fluorescence in the observation image 10 can be clarified and the detected bright spot 14 can be easily extracted.
- FIG. 3D shows an image 17 that has been subjected to bright spot enhancement processing.
- the bright spot enhancement process is performed, for example, with an unsharp mask.
- the unsharp mask is used as a process for enhancing a weak fluorescent signal.
- the bright spot enhancement process will be described using an unsharp mask using a Gaussian mask.
- the unsharp mask includes, for example, the luminance value L1 of the pixel of the image 16, the luminance value Ga of the pixel of the image 16 smoothed by the Gaussian mask, and the weighting coefficient Ha for each pixel of the observation image 10 to be analyzed.
- This is a process of replacing the luminance value L2 of the pixel of the image 17 by the following expression.
- L2 L1 + (L1-Ha ⁇ Ga) / (1-Ha) Note that the operation in step S03 is necessary to perform unsharp masking at the edge of the region of interest 11 in step S04.
- the unsharp mask cannot be executed at the boundary between the region of interest 11 and the non-interest region 12.
- the unsharp mask can be executed by performing an operation of putting a predetermined luminance value in the non-interested region 12.
- the bright spot emphasis processing may be performed by a method using a bandpass filter or a maximum filter by Fourier transform.
- the bright spot emphasis processing by the band pass filter enhances a high frequency component peculiar to the detected bright spot 14 by performing Fourier transform.
- the bright spot emphasis processing by the maximum filter replaces the luminance value of the pixel within the predetermined range with the maximum luminance value among the pixels within the predetermined range.
- step S05 the detected bright spot 14 highlighted in the image 17 is extracted (step S05). Thereby, the detection target in the observation image 10 can be detected.
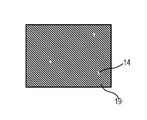
- FIG. 3E shows the image 19 obtained in step S05.
- Detected bright spot 14 is detected using a threshold value of luminance value.
- the luminance threshold is a value between the predetermined luminance value used for replacing the luminance value of the non-interesting region 12 in step S03 and the luminance value of the detected bright spot 14. That is, for example, the processing unit 22 determines that a pixel having a luminance value equal to or higher than the luminance threshold is included in the detected bright spot 14, and a pixel having a luminance value lower than the threshold is not included in the detected bright spot 14. judge.
- the luminance value of the detected bright spot 14 is, for example, an average value of luminance values of pixels indicating the detection target.
- the detected bright spot 14 may be detected by further using a size threshold.
- the processing unit 22 determines that one candidate region composed of a plurality of pixels determined to be included in the detected bright spot 14 based on the luminance value is not more than the upper limit threshold and not less than the lower limit threshold. In the case where it has, the candidate area is determined to be the detected bright spot 14. When the candidate area has an area larger than the upper threshold or when the candidate area has an area smaller than the lower threshold, it is determined that the candidate area is not the detected bright spot 14.
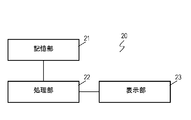
- FIG. 4 is a block diagram of the image processing apparatus 20 that executes the image processing method according to the embodiment.
- the image processing apparatus 20 includes a storage unit 21 that stores the observation image 10 and a processing unit 22 that executes an image processing method on the observation image 10.
- the processing unit 22 includes a CPU that executes an image processing method program.
- the program is stored in, for example, the memory of the processing unit 22.
- the program may be stored in the storage unit 21 or an external storage device.
- the image processing apparatus 20 may include a display unit 23 that displays the measured number of detected bright spots 14, the number of samples, the calculated infection rate, and the like.
- the display unit 23 is, for example, a display.
- the image processing method program may be executed by a personal computer.
- a fluorescent dye that labels a detection target such as a pathogenic bacterium also binds to a substance other than the detection target.
- the fluorescence emitted by the fluorescent dye combined with something other than the detection target becomes noise on the observation image. Noise causes an erroneous extraction of a detection target. Therefore, in order to accurately extract the detection target, it is necessary to determine whether the fluorescent spot indicating the detection target is in a region of interest meaning inside the cell or a non-interest region meaning outside the cell. .
- the conventional image processing method described above it is difficult to accurately determine the position of the bright spot. For this reason, the conventional method cannot accurately extract the detection bright spot indicating the detection target in the observation image.
- the image processing method according to the embodiment is a process that divides the region of interest 11 and the non-interest region 12 and eliminates noise outside the region of interest, and an unsharp mask process, which is difficult with the conventional image processing method And both. Therefore, by the image processing method in the embodiment, the detected bright spot 14 in the observation image can be extracted with high accuracy, and the detection target can be accurately detected.
- the region of interest 11 is set as the sample existing region and the detection bright spot 14 indicating the detection target existing in the sample is extracted.
- the region of interest 11 can be set according to the region where the detection target exists. For example, by setting the region of interest 11 as outside the sample, a bright spot indicating a detection target existing outside the sample may be extracted.
- the observation image 10 is not limited to the fluorescence observation image.
- the observation image 10 may be an observation image that does not include fluorescence, for example.
- the image processing method of the present disclosure is particularly useful for processing observation images of cells and tissues.
Landscapes
- Engineering & Computer Science (AREA)
- Physics & Mathematics (AREA)
- General Physics & Mathematics (AREA)
- Health & Medical Sciences (AREA)
- Theoretical Computer Science (AREA)
- Nuclear Medicine, Radiotherapy & Molecular Imaging (AREA)
- General Health & Medical Sciences (AREA)
- Immunology (AREA)
- Chemical & Material Sciences (AREA)
- Computer Vision & Pattern Recognition (AREA)
- Biochemistry (AREA)
- Pathology (AREA)
- Life Sciences & Earth Sciences (AREA)
- Analytical Chemistry (AREA)
- Quality & Reliability (AREA)
- Radiology & Medical Imaging (AREA)
- Medical Informatics (AREA)
- Chemical Kinetics & Catalysis (AREA)
- Optics & Photonics (AREA)
- Investigating, Analyzing Materials By Fluorescence Or Luminescence (AREA)
- Apparatus Associated With Microorganisms And Enzymes (AREA)
- Measuring Or Testing Involving Enzymes Or Micro-Organisms (AREA)
- Image Processing (AREA)
- Image Analysis (AREA)
Abstract
Description
L2=L1+(L1-Ha×Ga)/(1-Ha)
なお、ステップS03の操作は、ステップS04において興味領域11の縁部でアンシャープマスクを行うために必要である。例えば、ステップS02において、興味領域11を切り取り、非興味領域12のピクセルが輝度値を有しない状態にした場合、興味領域11と非興味領域12の境目でアンシャープマスクを実行することができない。一方、実施の形態における画像処理方法では、非興味領域12に所定の輝度値を入れる操作を行うことにより、アンシャープマスクを実行することができる。
11 興味領域
12 非興味領域
13 輝点
14 検出輝点
15 非検出輝点
16 画像(第一の画像)
17 画像(第二の画像)
20 画像処理装置
21 記憶部
22 処理部
23 表示部
Claims (7)
- 検出輝点を含む観察画像を興味領域と非興味領域とに分割するステップと、
前記非興味領域の輝度値を所定の輝度値に置換することにより第一の画像を得るステップと、
前記第一の画像に輝点強調の処理を実行することにより第二の画像を得るステップと、
前記第二の画像において前記検出輝点を抽出するステップと、
を含む画像処理方法。 - 前記観察画像を前記興味領域と前記非興味領域とに分割する前記ステップは、輝度の閾値と大きさの閾値とを用いて前記観察画像を前記興味領域と前記非興味領域とに分割するステップを含む、請求項1に記載の画像処理方法。
- 前記観察画像を前記興味領域と前記非興味領域とに分割する前記ステップは、モルフォロジー処理を用いて前記興味領域の輪郭線を補正するステップを含む、請求項1に記載の画像処理方法。
- 前記第二の画像を得る前記ステップは、前記第一の画像にアンシャープマスクによる輝点強調の処理を実行することにより前記第二の画像を得るステップを含む、請求項1に記載の画像処理方法。
- 前記所定の輝度値は、前記観察画像の平均輝度を基に算出した値である、請求項1に記載の画像処理方法。
- 前記検出輝点を抽出する前記ステップは、輝度値の閾値と大きさの閾値とを用いて前記検出輝点を抽出するステップを含む、請求項1に記載の画像処理方法。
- 検出輝点を含む観察画像を記憶する記憶部と、
前記観察画像の領域を興味領域と非興味領域とに分割し、
前記非興味領域の輝度値を所定の輝度値に置換することにより第一の画像を得て、
前記第一の画像に対して輝点強調の処理を実行することにより第二の画像を得て、
前記第二の画像において前記検出輝点を抽出する、
ように構成された処理部と、
を備えた画像処理装置。
Priority Applications (3)
| Application Number | Priority Date | Filing Date | Title |
|---|---|---|---|
| JP2017521683A JPWO2016194338A1 (ja) | 2015-06-04 | 2016-05-25 | 画像処理方法および画像処理装置 |
| EP16802780.3A EP3306306A4 (en) | 2015-06-04 | 2016-05-25 | Image processing method and image processing device |
| US15/554,428 US20180052108A1 (en) | 2015-06-04 | 2016-05-25 | Image processing method and image processing device |
Applications Claiming Priority (2)
| Application Number | Priority Date | Filing Date | Title |
|---|---|---|---|
| JP2015114005 | 2015-06-04 | ||
| JP2015-114005 | 2015-06-04 |
Publications (1)
| Publication Number | Publication Date |
|---|---|
| WO2016194338A1 true WO2016194338A1 (ja) | 2016-12-08 |
Family
ID=57440794
Family Applications (1)
| Application Number | Title | Priority Date | Filing Date |
|---|---|---|---|
| PCT/JP2016/002526 Ceased WO2016194338A1 (ja) | 2015-06-04 | 2016-05-25 | 画像処理方法および画像処理装置 |
Country Status (4)
| Country | Link |
|---|---|
| US (1) | US20180052108A1 (ja) |
| EP (1) | EP3306306A4 (ja) |
| JP (1) | JPWO2016194338A1 (ja) |
| WO (1) | WO2016194338A1 (ja) |
Cited By (4)
| Publication number | Priority date | Publication date | Assignee | Title |
|---|---|---|---|---|
| US10605731B2 (en) | 2017-04-14 | 2020-03-31 | Sysmex Corporation | Fluorescence image analyzing apparatus, image processing method of fluorescence image, and computer program |
| WO2021149356A1 (ja) * | 2020-01-21 | 2021-07-29 | コニカミノルタ株式会社 | マラリア検査方法及びマラリア検査装置 |
| JP2022101163A (ja) * | 2020-12-24 | 2022-07-06 | シスメックス株式会社 | 蛍光画像表示方法及び蛍光画像分析装置 |
| JP2025041855A (ja) * | 2021-06-17 | 2025-03-26 | ブイビーシー ホールディングス エルエルシー | コンフルエンシー推定のためのセグメンテーションベースの画像処理 |
Families Citing this family (3)
| Publication number | Priority date | Publication date | Assignee | Title |
|---|---|---|---|---|
| US10761027B2 (en) * | 2016-01-19 | 2020-09-01 | Konica Minolta, Inc. | Image processing apparatus and computer-readable recording medium storing program |
| CN107731159B (zh) * | 2017-11-27 | 2019-12-03 | 合肥鑫晟光电科技有限公司 | 图像处理方法、装置、显示设备及计算机可读存储介质 |
| US12277685B2 (en) * | 2019-08-28 | 2025-04-15 | Nec Corporation | Image processing apparatus, image processing method, and computer recording medium for synthesizing a corrected image with a target image to be processed to generate a new image |
Citations (5)
| Publication number | Priority date | Publication date | Assignee | Title |
|---|---|---|---|---|
| WO2008099580A1 (ja) * | 2007-02-13 | 2008-08-21 | Nec Corporation | 細胞特徴量算出装置および細胞特徴量算出方法 |
| JP2009009290A (ja) * | 2007-06-27 | 2009-01-15 | Kddi Corp | 類似画像検索装置 |
| JP2010102507A (ja) * | 2008-10-23 | 2010-05-06 | Fujifilm Corp | 背景置換装置、背景置換プログラム、背景置換方法、および撮影システム |
| JP2013057631A (ja) * | 2011-09-09 | 2013-03-28 | Konica Minolta Medical & Graphic Inc | 生体物質発現レベル評価システム |
| JP2013235517A (ja) * | 2012-05-10 | 2013-11-21 | Sharp Corp | 画像処理装置、画像表示装置、コンピュータプログラム及び記録媒体 |
Family Cites Families (1)
| Publication number | Priority date | Publication date | Assignee | Title |
|---|---|---|---|---|
| IL134557A0 (en) * | 1997-08-28 | 2001-04-30 | Qualia Computing Inc | Method and system for automated detection of clustered microcalcifications from digital mammograms |
-
2016
- 2016-05-25 WO PCT/JP2016/002526 patent/WO2016194338A1/ja not_active Ceased
- 2016-05-25 US US15/554,428 patent/US20180052108A1/en not_active Abandoned
- 2016-05-25 EP EP16802780.3A patent/EP3306306A4/en not_active Withdrawn
- 2016-05-25 JP JP2017521683A patent/JPWO2016194338A1/ja active Pending
Patent Citations (5)
| Publication number | Priority date | Publication date | Assignee | Title |
|---|---|---|---|---|
| WO2008099580A1 (ja) * | 2007-02-13 | 2008-08-21 | Nec Corporation | 細胞特徴量算出装置および細胞特徴量算出方法 |
| JP2009009290A (ja) * | 2007-06-27 | 2009-01-15 | Kddi Corp | 類似画像検索装置 |
| JP2010102507A (ja) * | 2008-10-23 | 2010-05-06 | Fujifilm Corp | 背景置換装置、背景置換プログラム、背景置換方法、および撮影システム |
| JP2013057631A (ja) * | 2011-09-09 | 2013-03-28 | Konica Minolta Medical & Graphic Inc | 生体物質発現レベル評価システム |
| JP2013235517A (ja) * | 2012-05-10 | 2013-11-21 | Sharp Corp | 画像処理装置、画像表示装置、コンピュータプログラム及び記録媒体 |
Non-Patent Citations (1)
| Title |
|---|
| See also references of EP3306306A4 * |
Cited By (6)
| Publication number | Priority date | Publication date | Assignee | Title |
|---|---|---|---|---|
| US10605731B2 (en) | 2017-04-14 | 2020-03-31 | Sysmex Corporation | Fluorescence image analyzing apparatus, image processing method of fluorescence image, and computer program |
| US11237107B2 (en) | 2017-04-14 | 2022-02-01 | Sysmex Corporation | Fluorescence image analyzing apparatus, image processing method of fluorescence image, and computer program |
| WO2021149356A1 (ja) * | 2020-01-21 | 2021-07-29 | コニカミノルタ株式会社 | マラリア検査方法及びマラリア検査装置 |
| JP2022101163A (ja) * | 2020-12-24 | 2022-07-06 | シスメックス株式会社 | 蛍光画像表示方法及び蛍光画像分析装置 |
| JP2025041855A (ja) * | 2021-06-17 | 2025-03-26 | ブイビーシー ホールディングス エルエルシー | コンフルエンシー推定のためのセグメンテーションベースの画像処理 |
| JP7780616B2 (ja) | 2021-06-17 | 2025-12-04 | ブイビーシー ホールディングス エルエルシー | コンフルエンシー推定のためのセグメンテーションベースの画像処理 |
Also Published As
| Publication number | Publication date |
|---|---|
| US20180052108A1 (en) | 2018-02-22 |
| EP3306306A1 (en) | 2018-04-11 |
| EP3306306A4 (en) | 2018-04-11 |
| JPWO2016194338A1 (ja) | 2018-03-22 |
Similar Documents
| Publication | Publication Date | Title |
|---|---|---|
| WO2016194338A1 (ja) | 画像処理方法および画像処理装置 | |
| AU2022200112B2 (en) | Methods and apparatus for detecting an entity in a bodily sample | |
| Alomari et al. | Automatic detection and quantification of WBCs and RBCs using iterative structured circle detection algorithm | |
| CN113450383B (zh) | 一种免疫层析试纸定量分析方法、装置、设备和介质 | |
| WO2017061112A1 (ja) | 画像処理方法および画像処理装置 | |
| US11257301B2 (en) | Image analysis apparatus, image analysis method, and image analysis program | |
| WO2014087689A1 (ja) | 画像処理装置、画像処理システム及びプログラム | |
| Anggraini et al. | Automated status identification of microscopic images obtained from malaria thin blood smears using Bayes decision: a study case in Plasmodium falciparum | |
| US20170186173A1 (en) | Cell area determination method, cell imaging system, and cell image processing apparatus | |
| Punitha et al. | Detection of malarial parasite in blood using image processing | |
| Poornima et al. | Detection of dengue fever with platelets count using image processing techniques | |
| Nautre et al. | Detection of malaria parasites in thin red blood smear using a segmentation approach with U-Net | |
| Sreelatha et al. | An improved automatic detection of true comets for DNA damage analysis | |
| Kotyk et al. | Detection of dead stained microscopic cells based on color intensity and contrast | |
| US12140545B2 (en) | Information processing device for analyzing a specimen | |
| US11029208B2 (en) | Microspectroscope having automatic sample detection function | |
| JP2017198609A (ja) | 画像処理方法、画像処理装置、プログラム | |
| KR102613961B1 (ko) | 골수가 도말된 슬라이드 샘플 이미지의 셀 존 결정 방법 및 셀 존의 고배율 촬상 방법 | |
| JP2010210290A (ja) | Dnaが断片化されたアポトーシス細胞の検出方法、細胞画像解析装置、プログラム、及びアポトーシスのステージの評価方法 | |
| Rachana et al. | Automatic segmentation technique of tuberculosis bacilli in Ziehl-Neelsen-stained tissue images |
Legal Events
| Date | Code | Title | Description |
|---|---|---|---|
| 121 | Ep: the epo has been informed by wipo that ep was designated in this application |
Ref document number: 16802780 Country of ref document: EP Kind code of ref document: A1 |
|
| ENP | Entry into the national phase |
Ref document number: 2017521683 Country of ref document: JP Kind code of ref document: A |
|
| REEP | Request for entry into the european phase |
Ref document number: 2016802780 Country of ref document: EP |
|
| WWE | Wipo information: entry into national phase |
Ref document number: 15554428 Country of ref document: US |
|
| NENP | Non-entry into the national phase |
Ref country code: DE |