WO2017064783A1 - 質量分析装置 - Google Patents
質量分析装置 Download PDFInfo
- Publication number
- WO2017064783A1 WO2017064783A1 PCT/JP2015/079114 JP2015079114W WO2017064783A1 WO 2017064783 A1 WO2017064783 A1 WO 2017064783A1 JP 2015079114 W JP2015079114 W JP 2015079114W WO 2017064783 A1 WO2017064783 A1 WO 2017064783A1
- Authority
- WO
- WIPO (PCT)
- Prior art keywords
- time
- mass spectrometer
- peak
- analysis
- mass
- Prior art date
- Legal status (The legal status is an assumption and is not a legal conclusion. Google has not performed a legal analysis and makes no representation as to the accuracy of the status listed.)
- Ceased
Links
Images




Classifications
-
- H—ELECTRICITY
- H01—ELECTRIC ELEMENTS
- H01J—ELECTRIC DISCHARGE TUBES OR DISCHARGE LAMPS
- H01J49/00—Particle spectrometers or separator tubes
- H01J49/0027—Methods for using particle spectrometers
- H01J49/0031—Step by step routines describing the use of the apparatus
-
- G—PHYSICS
- G01—MEASURING; TESTING
- G01N—INVESTIGATING OR ANALYSING MATERIALS BY DETERMINING THEIR CHEMICAL OR PHYSICAL PROPERTIES
- G01N30/00—Investigating or analysing materials by separation into components using adsorption, absorption or similar phenomena or using ion-exchange, e.g. chromatography or field flow fractionation
- G01N30/02—Column chromatography
- G01N30/62—Detectors specially adapted therefor
- G01N30/72—Mass spectrometers
-
- G—PHYSICS
- G01—MEASURING; TESTING
- G01N—INVESTIGATING OR ANALYSING MATERIALS BY DETERMINING THEIR CHEMICAL OR PHYSICAL PROPERTIES
- G01N30/00—Investigating or analysing materials by separation into components using adsorption, absorption or similar phenomena or using ion-exchange, e.g. chromatography or field flow fractionation
- G01N30/02—Column chromatography
- G01N30/86—Signal analysis
- G01N30/8624—Detection of slopes or peaks; baseline correction
- G01N30/8631—Peaks
- G01N30/8637—Peak shape
-
- H—ELECTRICITY
- H01—ELECTRIC ELEMENTS
- H01J—ELECTRIC DISCHARGE TUBES OR DISCHARGE LAMPS
- H01J49/00—Particle spectrometers or separator tubes
- H01J49/004—Combinations of spectrometers, tandem spectrometers, e.g. MS/MS, MSn
-
- G—PHYSICS
- G01—MEASURING; TESTING
- G01N—INVESTIGATING OR ANALYSING MATERIALS BY DETERMINING THEIR CHEMICAL OR PHYSICAL PROPERTIES
- G01N30/00—Investigating or analysing materials by separation into components using adsorption, absorption or similar phenomena or using ion-exchange, e.g. chromatography or field flow fractionation
- G01N30/02—Column chromatography
- G01N2030/022—Column chromatography characterised by the kind of separation mechanism
- G01N2030/027—Liquid chromatography
Definitions
- CID collision induced dissociation
- the present invention relates to a mass spectrometer that performs analysis.
- the mass spectrometer according to the present invention is particularly suitable for a chromatograph mass spectrometer using a mass spectrometer as a detector for a liquid chromatograph (LC) or a gas chromatograph (GC).
- MS / MS analysis or MS n analysis which is a method of mass spectrometry, is a useful method for identifying a compound having a large molecular weight and analyzing its chemical structure, and has been widely used in various fields in recent years.
- a well-known mass spectrometer that performs MS / MS analysis is a triple quadrupole mass spectrometer in which a quadrupole mass filter is arranged before and after a collision cell that performs CID.
- the Q-TOF mass spectrometer in which the quadrupole mass filter in the latter stage is replaced with a time-of-flight mass analyzer in the triple quadrupole mass spectrometer is more than the triple quadrupole mass spectrometer.
- mass spectrometers can perform MS n analysis where n is 2, but in addition to ion trap time-of-flight mass spectrometers that combine ion traps that can hold ions and time-of-flight mass spectrometers, etc. It is possible to perform MS n analysis in which n is 3 or more by dissociating ions having a specific mass-to-charge ratio in a plurality of stages in the ion trap. In the following description, a mass spectrometer capable of performing MS n analysis where n is 2 or more is simply referred to as a mass spectrometer.
- a lower threshold of signal strength is often used.
- MS 2 analysis is performed using ions corresponding to the peak as precursor ions. It has become.
- ions derived from impurities such as a sample solvent having a large amount exist, there is a possibility that meaningless MS 2 analysis using the ions as precursor ions may be performed.
- the concentration of the target component introduced into the mass spectrometer changes to a mountain shape with the passage of time. Therefore, if the lower limit value of the signal intensity is set low as a precursor ion selection condition, MS 2 analysis is performed when the signal intensity of the target component does not become sufficiently high, and the MS 2 spectrum with low product ion signal intensity. However, it may interfere with the qualitative and structural analysis of the target component. In order to avoid this, the lower limit value of the signal intensity may be set to a certain level as a precursor ion selection condition. However, when the concentration of the target component is lower than expected, the signal intensity can reach the lower limit value. In addition, the MS 2 analysis for the target component may not be performed.
- the present invention has been made in view of the above problems, and its main purpose is to automatically select a precursor ion derived from a target component based on a mass spectrum obtained by mass spectrometry and perform MS n analysis.
- the MS n analysis can be performed when the concentration of the target component becomes relatively high, whereby a good MS n spectrum can be obtained. It is providing the mass spectrometer which can acquire.
- Another object of the present invention is to avoid the execution of MS n analysis on unnecessary high-concentration substances such as substances existing in the mobile phase of LC, while the substance that the analyst actually wants to observe is high concentration. It is an object of the present invention to provide a mass spectrometer capable of performing MS n analysis by selecting an ion derived from the substance as a precursor ion when present.
- MS n-1 analysis (n is an integer of 2 or more) determining the precursor ion based on the MS n-1 spectrum data obtained by the MS n-1
- a mass spectrometer that performs MS n analysis on the precursor ion subsequent to analysis, wherein the sample is introduced so that the concentration of the contained component changes in a peak shape over time, a) a condition setting unit for the analyzer to set the precursor ion selection conditions; b) based on the MS n-1 spectrum data obtained by MS n-1 analysis, and time determining unit that determines a permission start time to allow the execution of the MS n analysis for components that are analyzed at that time, c) a precursor ion selector that selects, as a precursor ion, a peak that satisfies the precursor ion selection conditions in MS n-1 spectral data obtained by MS n-1 analysis after the permission start time; d) an analysis control unit that controls each unit to perform MS n analysis on the precursor
- an LC or GC is connected to the mass spectrometer according to the present invention, and a sample including components temporally separated by the LC or GC is introduced into the mass spectrometer.
- a sample by flow injection analysis is introduced into the mass spectrometer.
- the sample is introduced into the present mass spectrometer so that the concentration of the contained component changes in a peak shape over time.
- the mass spectrometer according to the present invention is a mass spectrometer capable of performing MS 2 analysis such as a triple quadrupole mass spectrometer and a Q-TOF mass spectrometer, as well as MS n analysis where n is 3 or more. Including an ion trap time-of-flight mass spectrometer and an ion trap mass spectrometer.
- the time determination unit for example, every time an MS 1 spectrum in a predetermined mass-to-charge ratio range is obtained by performing normal mass analysis without ion dissociation operation,
- the permission start time is the time of the start point of the period during which MS n-1 analysis is allowed to be performed subsequent to MS n -1 analysis for ions derived from the component, and the signal intensity is the peak top of the peak. It is desirable to set the permission start time when the signal strength is relatively higher than a certain level with respect to the signal strength.
- MS 2 analysis using the ion corresponding to the selected peak as a precursor ion is immediately performed, that is, MS n ⁇ 1
- the precursor ion selection unit waits until the permission start time elapses and selects a peak that meets the precursor ion selection condition, and the analysis control unit selects the selected peak.
- MS n analysis is performed using the corresponding ions as precursor ions.
- the time determination unit based on a plurality of MS n-1 spectral data obtained continuously in time, the concentration of the contained component in a peak shape over time
- a peak start point estimation unit for estimating a peak start point on the chromatogram corresponding to the change to the point, and a time point when a predetermined delay time has elapsed from the peak start point may be determined as the permitted start time.
- the delay time is set to the delay time. It is good to adjust appropriately according to the width of the peak.
- the time determination unit may determine the delay time based on the estimated half-value width of the peak on the chromatogram.
- the full width at half maximum of the peak on the chromatogram varies depending on the separation conditions such as the type of mobile phase and flow rate. Therefore, in the case of a configuration in which a chromatograph such as LC or GC is connected to the front stage of the mass spectrometer, the time determination unit estimates the half width of the peak on the chromatogram based on the separation conditions in the chromatograph. It can be set as the structure further provided with an estimation part. In LC-MS and GC-MS that combine LC and GC with mass spectrometers, these separation conditions are generally set by the user in advance as measurement conditions, so they are set as part of the measurement conditions. By using the separation conditions, it is possible to estimate the half width of the peak on the chromatogram.
- the time determination unit may further include a half-value width estimation unit that estimates the half-value width of the peak on the chromatogram based on a plurality of MS n-1 spectrum data.
- the MS n analysis can always be executed with a certain degree of signal strength.
- the peak start point estimation unit when the signal intensity calculated based on the MS n-1 spectrum data exceeds a predetermined threshold, the peak start point estimation unit is configured to detect the signal intensity and the previous MS n.
- the peak start time may be estimated based on one or more signal intensities calculated based on ⁇ 1 spectrum data.
- the time determination unit based on a plurality of MS n-1 spectrum data obtained continuously in time, the concentration of the content component peaks over time
- the curve of the rising portion of the peak on the chromatogram corresponding to the change in shape may be estimated, the inflection point of the curve may be obtained, and the time point of the inflection point may be determined as the permission start time.
- the inflection point of the curve at the rising portion of the chromatogram peak appears when the signal intensity becomes a certain level or more relative to the signal intensity at the peak top of the peak. Therefore, by the permission start time of inflection point, it may perform MS n analysis and precursor ions of sufficient signal strength ions.
- the time determination unit may be configured to determine the permission start time after excluding data corresponding to the excluded ion information when MS n-1 spectrum data is obtained by MS n-1 analysis.
- the time determination unit excludes the data corresponding to the excluded ion information from the MS n-1 spectrum data, and then creates a chromatogram corresponding to the change in concentration of the contained component in a peak shape over time. Based on the chromatogram, the permission start time for permitting execution of the MS n analysis for the component being analyzed at that time may be determined.
- excluded ion information may be determined so as to exclude ions derived from impurities observed with high signal intensity.
- excluded ion information can be determined so as to exclude ions derived from components contained in the mobile phase used in the LC. That's fine.
- the excluded ion information may be determined so as to exclude ions derived from the standard substance.
- the MS n analysis when the concentration of the target component changes in a peak shape over time, the MS n analysis can be performed when the concentration of the target component becomes relatively high. . Thereby, a good MS n spectrum with high product ion signal intensity can be obtained. Further, according to the preferred configuration of the mass spectrometer according to the present invention, it is possible to avoid the execution of MS n analysis for unnecessary components such as components existing in the mobile phase of LC, and the user wants to actually observe. The possibility of performing MS n analysis on the target component can be increased.
- the flowchart which shows an example of the processing operation at the time of performing data collection by DDA in LC-MS of a present Example.
- the chromatogram for demonstrating the precursor ion selection process in LC-MS of a present Example.
- the mass spectrum for demonstrating the precursor ion selection process in LC-MS of a present Example.
- the chromatogram which shows the other example of a precursor ion selection process.
- FIG. 1 is a configuration diagram of a main part of the LC-MS of the present embodiment.
- the liquid feed pump 11 sucks the mobile phase (solvent) from the mobile phase container 10 and sends it to the injector 12 at a constant flow rate.
- the sample liquid injected into the mobile phase at a predetermined timing in the injector 12 is introduced into the column 13 by the flow of the mobile phase, and various components contained in the sample liquid are separated and eluted while passing through the column 13. .
- the eluate containing the separated components is supplied to the ion source of the mass analyzer 2 which is a Q-TOF type mass spectrometer.
- an ionization chamber 21, a first intermediate vacuum chamber 22, a second intermediate vacuum chamber 23, a first analysis chamber 24, and a second analysis chamber 25 are provided inside the chamber 20, and are substantially at atmospheric pressure.
- the degree of vacuum increases in order from the ionization chamber 21 that is the atmosphere to the second analysis chamber 25 that is the high vacuum atmosphere. That is, the mass spectrometer 2 has a multistage differential exhaust system configuration.
- the ionization chamber 21 is provided with an ESI spray 26 that performs ionization by electrospray ionization (ESI) as an ion source, and the ionization chamber 21 and the first intermediate vacuum chamber 22 communicate with each other through a heated desolvation tube 27.
- the first intermediate vacuum chamber 22 and the second intermediate vacuum chamber 23 are provided with ion guides 28 and 30 for converging ions and transporting them to the subsequent stage, respectively. 23 communicates with the skimmer 29 through a small hole formed in the top.
- a quadrupole mass filter 31 and a collision cell 32 having a multipole ion guide 33 disposed therein are installed in the first analysis chamber 24 .
- an orthogonal acceleration reflectron type time-of-flight mass analyzer 36 and an ion detector 37 are installed in the second analysis chamber 25 .
- the time-of-flight mass analyzer 36 includes an orthogonal acceleration unit 361, a flight space 362, and a reflector 363.
- An ion guide 35 is provided between the collision cell 32 and the orthogonal acceleration unit 361 with an ion passage hole 34 formed in a wall surface separating the first and second analysis chambers 24 and 25 interposed therebetween.
- the analysis control unit 5 includes a control sequence storage unit 51, and controls the operation of each unit included in the LC unit 1 and the mass analysis unit 2 in order to perform measurement described later.
- the data processing unit 4 to which the detection signal from the ion detector 37 is input includes a spectral data collection unit 40, a precursor ion selection determination processing unit 41, and a precursor ion selection condition storage unit as functional blocks characteristic of the apparatus of this embodiment. 42, the half-width database 43, and the like.
- the central control unit 6 including the control sequence creation unit 61 as a functional block is responsible for overall control of the entire system and input / output control through the input unit 7 and the display unit 8.
- the analysis control unit 5 is configured around a microcomputer including a CPU, RAM, ROM, timer, and the like, and is incorporated in an apparatus main body including the LC unit 1 and the mass analysis unit 2.
- all or some of the functions included in the central control unit 6 and the data processing unit 4 execute dedicated software installed on a personal computer (or workstation) connected to the apparatus main body on the computer. Is achieved.
- the general operation when performing MS 2 analysis in the mass spectrometer 2 is as follows.
- the ESI spray 26 sprays the eluate into the ionization chamber 21 while imparting a biased charge to the eluate.
- the charged fine droplets are atomized by contact with atmospheric gas, and the components contained in the droplets are ionized in the process of evaporation of the solvent in the droplets.
- the generated ions are introduced into the quadrupole mass filter 31 through the desolvation tube 27 and the ion guides 28 and 30.
- a voltage that allows only ions having a specific mass-to-charge ratio to pass through is applied to the rod electrode that constitutes the quadrupole mass filter 31, whereby a specific mass-to-charge ratio among various ions derived from the sample components is applied.
- CID gas such as Ar
- precursor ion product ions of various dissociates upon contact with the CID gas is produced.
- the generated product ions are sent to the orthogonal acceleration unit 361 through the ion guide 35.
- the orthogonal acceleration unit 361 accelerates the ion flow in a direction substantially orthogonal to the flow at a predetermined time interval and sends it out to the flight space 362.
- the flight space 362 has no electric or magnetic field.
- the ions ejected from the orthogonal acceleration unit 361 fly in the electric field flight space 362 and then are turned back by the reflected electric field.
- the ions After flying in the flight space 362 again, the ions finally reach the ion detector 37.
- the ions having substantially the same ion flight start time are separated according to the mass-to-charge ratio during the flight, and reach the ion detector 37 in order from the ions having the lowest mass-to-charge ratio.
- the flight time of each ion is determined by setting the ion acceleration time (that is, the ion flight start time) in the orthogonal acceleration unit 361 to zero. And a time-of-flight spectrum showing the relationship between signal strength and signal strength. Since the relationship between the mass-to-charge ratio and the flight time can be obtained theoretically or experimentally in advance, by converting the flight time to the mass-to-charge ratio based on the relationship, the MS 2 spectrum can be converted from the flight time spectrum. Can be requested.
- MS 2 spectrum in a predetermined mass-to-charge ratio range can be obtained each time the orthogonal acceleration unit 361 accelerates ions in a pulse manner, and this is repeated at a predetermined time interval, so that the LC unit 1 can transfer to the mass analyzing unit 2.
- MS 2 spectra can be obtained for various components that are sequentially contained in the introduced eluate over time.
- the MS 2 spectrum obtained at this time is obtained by performing scan measurement (product ion scan measurement) in a predetermined mass-to-charge ratio range with a quadrupole mass filter at the subsequent stage in a triple quadrupole mass spectrometer. It is substantially the same as the product ion spectrum obtained.
- the mass spectrometer 2 can obtain an MS 2 spectrum of a specific precursor ion derived from a sample component, and can execute a precursor ion selection for ions derived from the sample component by the quadrupole mass filter 31. (That is, the ions are allowed to pass through), and the ion dissociation operation is not performed in the collision cell 32, so that mass analysis similar to that of a normal time-of-flight mass spectrometer that is not a Q-TOF type is performed. A mass spectrum can also be acquired.
- FIG. 2 is a flowchart showing an example of processing operation when data is collected by DDA in this LC-MS
- FIG. 3 is a chromatogram for explaining precursor ion selection processing in LC-MS of this embodiment
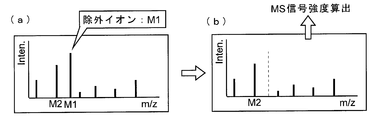
- FIG. It is a mass spectrum for demonstrating the precursor ion selection process in LC-MS of a present Example.
- the control sequence creating unit 61 creates a control sequence for executing measurement based on the input measurement conditions (step S1).
- the following are included as measurement conditions.
- Separation conditions in the LC unit 1 for example, column type, mobile phase type, mobile phase flow rate, gradient conditions in the case of gradient analysis, etc.).
- the mass-to-charge ratio of ions that are not selected as precursor ions during DDA hereinafter referred to as “excluded ions”).
- Intensity threshold Ith used for precursor ion selection determination processing and detailed conditions for selecting a precursor ion (for example, mass-to-charge ratio of ions to be preferentially selected when ions are present, order of ion intensity, mass) Precursor ion selection priority such as charge ratio order).
- MS 2 analysis execution conditions for the selected precursor ions for example, mass-to-charge ratio range during MS 2 analysis, CID conditions such as collision energy and CID gas pressure).
- the central control unit 6 When the user gives an instruction to start measurement, the central control unit 6 that has received this instruction sends the created control sequence to the analysis control unit 5 and sets the precursor ion selection conditions necessary for the precursor ion selection determination process to the data processing unit 4. Send it out.
- the precursor ion selection condition is stored in the precursor ion selection condition storage unit 42.
- the analysis control unit 5 temporarily stores the control sequence in the control sequence storage unit 51, and controls the operation of each unit according to this control sequence. Thereby, the measurement is started in the LC unit 1 and the mass spectrometry unit 2 (step S2).
- the mass analyzer 2 When the measurement is started, as described above, in the LC unit 1, the sample to be measured is injected into the mobile phase, and various components contained in the sample are sequentially eluted from the column 13.
- the mass analyzer 2 repeatedly performs mass analysis without precursor ion selection or ion dissociation (hereinafter sometimes referred to as “MS measurement”) at a predetermined time interval, and a predetermined mass-to-charge ratio for each mass analysis.
- Time-of-flight spectrum data corresponding to the range is input to the data processing unit 4.
- the spectrum data collection unit 40 collects the time-of-flight spectrum data, converts the flight time into a mass-to-charge ratio, and acquires mass spectrum data (step S3).
- the precursor ion selection determination processing unit 41 uses the data to correspond to excluded ions stored in the precursor ion selection condition storage unit 42. Only, and the signal intensity (hereinafter referred to as “MS signal intensity”) based on the total ion current (TIC) or the base ion current (BPC) is calculated from the remaining data (step S4).
- the mass-to-charge ratio M1 is set as an excluded ion, first, in the obtained mass spectrum data, data corresponding to the peak is deleted regardless of the signal intensity of the peak at the mass-to-charge ratio M1 (FIG. 4). (See (b)). Then, the MS signal intensity is calculated from the remaining mass spectrum data.
- the MS signal intensity may be obtained by adding the signal intensity of all the peaks excluding the peak in the mass-to-charge ratio M1.
- the peak with the highest signal intensity in the remaining mass spectrum data from which the peak at the mass to charge ratio M1 has been deleted (the peak at the mass to charge ratio M2 in FIG. 4B).
- the signal intensity thereof may be obtained.
- the precursor ion selection determination processing unit 41 determines whether or not the calculated MS signal intensity exceeds the intensity threshold value Ith set as one of the measurement conditions (step S5). If so, the process proceeds to step S13 to determine whether or not the current time exceeds the measurement end time. If No in step S13, the process returns to step S3 to continue MS measurement.
- step S5 If it is determined in step S5 that the MS signal intensity exceeds the intensity threshold Ith, the MS 2 execution permission start time Ts is calculated (step S6).
- the intensity threshold Ith is not exceeded when the MS signal intensity is D1, but exceeds the intensity threshold Ith when the MS signal intensity obtained as a result of the next MS measurement is D2. Therefore, when this D2 is obtained, it is determined Yes in step S5.
- step S6 first, based on a change in the MS signal intensity obtained in the past going back from that time point, a peak in the chromatogram (hereinafter referred to as a chromatogram peak in order to distinguish it from the peak on the mass spectrum).
- a peak in the chromatogram hereinafter referred to as a chromatogram peak in order to distinguish it from the peak on the mass spectrum.
- Estimate the start time T0 For example, as shown in FIG. 3, the chromatogram peak start time is obtained by performing linear approximation using the signal intensity value D2 when the MS signal intensity exceeds the intensity threshold and the signal intensity value D1 in the MS measurement just before that. Find T0.
- the time obtained by adding the predetermined delay time Tdelay to the start time T0 of the chromatogram peak thus obtained is defined as the MS 2 execution permission start time Ts.
- the delay time Tdelay corresponds to the time required for a certain amount of time until a chromatogram peak having a mountain shape as shown by the dotted line in FIG. 3 rises to a certain extent, and therefore usually depends on the peak width, that is, the peak half width. To do.
- the peak half-value width largely depends on the separation conditions in the LC unit 1. Therefore, here, information indicating the correspondence between various LC separation conditions and the standard (average) value of the peak half-width is stored in the half-width database 43 in advance.
- FIG. 5 shows an example of this information.
- the type of column used, the flow rate of the mobile phase, the type of mobile phase, the gradient conditions, and the like are associated with the half-value width of the chromatogram peak.
- Such information may be obtained, for example, experimentally by a manufacturer that provides the apparatus, or may be obtained experimentally by a user to construct a database.
- the precursor ion selection determination processing unit 41 uses the half width database 43 to obtain the half width of the chromatogram peak corresponding to the set LC separation condition.
- the delay time Tdelay is calculated by multiplying the half width by a predetermined coefficient. For example, 1/2 may be used as the predetermined coefficient.
- the peak width is wide, the delay time Tdelay becomes large. Therefore, by appropriately setting a predetermined coefficient, the signal intensity value and peak width of the peak top of the chromatogram peak are set to the level of the intensity threshold Ith. Regardless, the MS 2 execution permission start time Ts can be set when the peak rises sufficiently.
- step S7 it is determined whether or not the MS signal intensity calculated based on the mass spectrum data obtained in the next MS measurement exceeds the intensity threshold Ith (step S7, S8) If not, the process proceeds to step S13 described above. If it is determined in step S8 that the MS signal intensity exceeds the intensity threshold Ith, it is next determined whether or not the current time exceeds the MS 2 execution permission start time Ts calculated in step S6 ( Step S9). If No in step S9, the process returns to step S7, and the processes in steps S7 to S9 are repeated. Meanwhile, if it is determined No in step S8, the process proceeds from step S8 to S13.
- the precursor ion selection determination processing unit 41 extracts ions that satisfy the precursor ion selection condition on the mass spectrum obtained by the MS measurement. (Step S10). Then, information on the mass-to-charge ratio of the extracted ions is sent to the analysis control unit 5. In response to this, the analysis control unit 5 controls the mass analysis unit 2 so as to execute MS 2 analysis using the extracted ions as precursor ions. That is, only the precursor ion is selected in the quadrupole mass filter 31, and the precursor ion is dissociated by the CID in the collision cell 32. Various product ions generated thereby are introduced into the time-of-flight mass analyzer 36 for mass analysis.
- step S10 data constituting an MS 2 spectrum over a predetermined mass-to-charge ratio range is obtained.
- step S10 data constituting an MS 2 spectrum over a predetermined mass-to-charge ratio range is obtained.
- step S12 it is determined whether or not the current time has passed the measurement end time (step S12). If the current time has not reached the measurement end time, the process returns from step S12 to S7. Once the MS signal intensity exceeds the intensity threshold Ith, until the MS signal intensity falls below the intensity threshold Ith (that is, until No is determined in Step S8), the MS measurement is repeated by repeating the processes in Steps S6 to S12. MS 2 analysis will be performed. Thereby, it is possible to reliably obtain an MS 2 spectrum for ions satisfying the precursor ion selection condition. Further, instead of MS 2 analysis is performed when the MS signal intensity exceeds a certain threshold, the MS 2 analysis is performed after the time when the chromatogram peak rises sufficiently, the signal strength of the product ions A good MS 2 spectrum can be obtained, which is somewhat higher.
- the sample to be measured includes a plurality of components
- the eluate containing the components temporally separated in the column 13 is sequentially introduced into the mass analyzer 2, so that ions derived from the components even satisfy the precursor ion selection conditions. Then, MS 2 spectrum data can be collected for each component as described above.
- FIG. 6 shows an example of information in the half-width database 43 corresponding to isocratic analysis.
- the width of the peak observed on the chromatogram changes with time as shown in FIG. 7 (a)
- the retention time and peak half-value width of each peak as shown in FIG. 7 (b).
- the relationship is obtained, and the half width of the first peak and the rate of change of the half width with respect to the peak are calculated.
- the half width of the chromatogram peak based on the half width database 43.
- the user manually inputs and sets the half width of the chromatogram peak as one of the measurement conditions. May be.
- the LC unit 1 is operated under a special separation condition that is not registered in the half-width database 43, such manual input setting is effective.
- the peak waveform shape observed on the LC chromatogram is close to the Gaussian distribution shape as long as there are no overlapping components. Therefore, for example, by using a plurality of MS signal intensities such as D1 and D2 in FIG. 3 and obtaining a peak waveform shape approximated by a Gaussian distribution waveform, the peak half width can be estimated. In this way, the half-value width of the peak may be estimated from a plurality of MS signal intensities at the rising portion of the peak on the chromatogram, and the delay time Tdelay may be calculated using the peak half-value width.
- FIG. 8 is an example of a chromatogram for explaining this process.
- smoothing is performed based on the MS signal intensity and one or more MS signal intensities acquired before that.
- An approximate curve (for example, a quadratic curve or a cubic curve) is drawn while performing a smoothing process.
- a differential value at the present time is calculated on the approximate curve, and an inflection point of the approximate curve is obtained using the differential value. If an inflection point is found, the first data acquisition time after the inflection point is set as the MS 2 execution permission start time Ts, and the execution of DDA is started.
- a plurality of items within a predetermined time width range from the MS signal strength obtained at a certain time after the MS signal strength exceeds the strength threshold Ith.
- the first data acquisition time is set as the MS 2 execution permission start time Ts.
- the approximate curve drawing width used for detecting the inflection point is determined by the time width before and after the inflection point, and is often defined by the assumed half-value width of the chromatogram peak.
- the approximate curve drawing width is defined only in the range before the inflection point in time, so for example, it is used as the approximate curve drawing width such as a half value of the half-value width of the assumed chromatogram peak. Is appropriate.
- the start time of the chromatogram peak is estimated, and the time when a predetermined delay time Tdelay has elapsed from the start time is set as the MS 2 execution permission start time Ts.
- the MS 2 execution permission start time is defined as the time when a predetermined delay time has elapsed from the time when the MS signal intensity exceeds the intensity threshold Ith, rather than the start time of the chromatogram peak. It may be Ts.
- the coefficient by which the half-value width of the assumed chromatogram peak is multiplied may be changed from the above embodiment. Even in such a configuration, the MS 2 analysis can be performed when the peak sufficiently rises reflecting the height and width of the chromatogram peak, so that a good MS 2 spectrum can be obtained with certainty.
- MS 2 analysis instead of using a mass spectrometer that dissociates ions in the collision cell, use an ion trap mass spectrometer or ion trap time-of-flight mass spectrometer that temporarily accumulates ions in the ion trap and dissociates the accumulated ions. May be.
- MS n analysis in which n is 3 or more is possible, but the above-described precursor ion selection determination processing is also applicable to such MS n analysis.
- the LC unit 1 injects the measurement target sample from the injector 12 into the mobile phase without using a column, and introduces the measurement target sample into the mass analysis unit 2 by the flow of the mobile phase (FIA).
- the present invention can be applied to GC-MS instead of LC-MS.
Landscapes
- Chemical & Material Sciences (AREA)
- Analytical Chemistry (AREA)
- Physics & Mathematics (AREA)
- Health & Medical Sciences (AREA)
- Life Sciences & Earth Sciences (AREA)
- Biochemistry (AREA)
- General Health & Medical Sciences (AREA)
- General Physics & Mathematics (AREA)
- Immunology (AREA)
- Pathology (AREA)
- Other Investigation Or Analysis Of Materials By Electrical Means (AREA)
Abstract
Description
a)プリカーサイオン選択条件を分析者が設定するための条件設定部と、
b)MSn-1分析によって得られるMSn-1スペクトルデータに基づいて、そのときに分析している成分についてのMSn分析の実行を許可する許可開始時間を決定する時間決定部と、
c)前記許可開始時間以降にMSn-1分析によって得られるMSn-1スペクトルデータにおいて前記プリカーサイオン選択条件に適合するピークをプリカーサイオンとして選択するプリカーサイオン選択部と、
d)前記プリカーサイオン選択部によって選択されたプリカーサイオンに対するMSn分析を実行するように各部を制御する分析制御部と、
を備えることを特徴としている。
一般的に、クロマトグラムピークの立ち上がり部分のカーブの変曲点はその信号強度が該ピークのピークトップの信号強度に対し相対的に或る程度以上のレベルになったときに現れる。そのため、変曲点を許可開始時間とすることで、十分な信号強度のイオンをプリカーサイオンとしたMSn分析を実行することができる。
プリカーサイオン選択条件の一つとして、除外するイオン又は質量電荷比を示す除外イオン情報を含み、
前記時間決定部は、MSn-1分析によってMSn-1スペクトルデータが得られたとき、上記除外イオン情報に該当するデータを除外したうえで許可開始時間を決定する構成とするとよい。
また本発明に係る質量分析装置の好ましい構成によれば、例えばLCの移動相中に存在する成分などの不要な成分についてのMSn分析の実行を回避することができ、実際にユーザが観測したい目的成分についてのMSn分析を実行する可能性を高めることができる。
なお、一般に、分析制御部5はCPU、RAM、ROM、タイマー等を含むマイクロコンピュータを中心に構成され、LC部1や質量分析部2を含む装置本体に組み込まれている。一方、中央制御部6及びデータ処理部4に含まれる機能の全て又は一部は、装置本体と接続されたパーソナルコンピュータ(又はワークステーション)にインストールされた専用のソフトウエアを該コンピュータ上で実行することにより達成される。
LC部1のカラム13からの溶出液がESIスプレー26に導入されると、ESIスプレー26は片寄った電荷を溶出液に付与しつつ該溶出液をイオン化室21中に噴霧する。帯電した微小液滴は大気ガスと接触して微細化され、該液滴中の溶媒が蒸発する過程で該液滴に含まれる成分がイオン化される。生成されたイオンは脱溶媒管27、イオンガイド28、30を経て、四重極マスフィルタ31に導入される。四重極マスフィルタ31を構成するロッド電極には特定の質量電荷比を有するイオンのみを通過させるような電圧が印加され、それによって、試料成分由来の様々なイオンの中で特定の質量電荷比を有するイオンのみが選択的に四重極マスフィルタ31を通り抜け、プリカーサイオンとしてコリジョンセル32内に導入される。
なお、このときに得られるMS2スペクトルは、三連四重極型質量分析装置において後段の四重極マスフィルタで所定の質量電荷比範囲のスキャン測定(プロダクトイオンスキャン測定)を実行することで得られるプロダクトイオンスペクトルと実質的に同じである。
・LC部1における分離条件(例えばカラムの種類、移動相の種類、移動相の流速、グラジエント分析の場合にはグラジエント条件など)。
・DDAの際にプリカーサイオンとして選択しないイオン(以下「除外イオン」という)の質量電荷比。
・プリカーサイオン選択判定処理に使用される強度閾値Ith、及び、プリカーサイオンを選択する際の詳細な条件(例えばイオンが存在する場合に優先的に選択するイオンの質量電荷比、イオン強度順、質量電荷比順などのプリカーサイオン選択の優先順位など)。
・選択されたプリカーサイオンについてのMS2分析の実行条件(例えばMS2分析時の質量電荷比範囲、コリジョンエネルギやCIDガス圧等のCID条件など)。
図8はこの処理を説明するためのクロマトグラムの一例である。ここでは、MS信号強度が強度閾値Ithを超えた(図8におけるデータD2が得られた)以降に、そのMS信号強度とそれより以前に取得した一又は複数のMS信号強度とに基づいて平滑化(スムージング)処理を行いつつ近似曲線(例えば二次曲線又は三次曲線)を描く。そして、その近似曲線上で現時点における微分値を計算し、その微分値を利用して近似曲線の変曲点を求める。変曲点が見つかったならば、その変曲点よりもあとの最初のデータ取得時点をMS2実行許可開始時間Tsとして定めDDAの実行を開始する。
また、LC-MSでなくGC-MSに本発明を適用可能であることも当然である。
10…移動相容器
11…送液ポンプ
12…インジェクタ
13…カラム
2…質量分析部
20…チャンバ
21…イオン化室
22…第1中間真空室
23…第2中間真空室
24…第1分析室
25…第2分析室
26…ESIスプレー
27…脱溶媒管
28、35…イオンガイド
29…スキマー
31…四重極マスフィルタ
32…コリジョンセル
33…多重極型イオンガイド
34…イオン通過孔
36…飛行時間型質量分析器
361…直交加速部
362…飛行空間
363…反射器
37…イオン検出器
4…データ処理部
40…スペクトルデータ収集部
41…プリカーサイオン選択判定処理部
42…プリカーサイオン選択条件記憶部
43…半値幅データベース
5…分析制御部
51…制御シーケンス記憶部
6…中央制御部
61…制御シーケンス作成部
7…入力部
8…表示部
Claims (8)
- MSn-1分析(nは2以上の整数)によって得られるMSn-1スペクトルデータに基づいてプリカーサイオンを決定し、そのMSn-1分析に引き続いて該プリカーサイオンについてのMSn分析を実行する質量分析装置であって、含有成分の濃度が時間経過に従いピーク状に変化するように試料が導入される質量分析装置において、
a)プリカーサイオン選択条件を分析者が設定するための条件設定部と、
b)MSn-1分析によって得られるMSn-1スペクトルデータに基づいて、そのときに分析している成分についてのMSn分析の実行を許可する許可開始時間を決定する時間決定部と、
c)前記許可開始時間以降にMSn-1分析によって得られるMSn-1スペクトルデータにおいて前記プリカーサイオン選択条件に適合するピークをプリカーサイオンとして選択するプリカーサイオン選択部と、
d)前記プリカーサイオン選択部によって選択されたプリカーサイオンに対するMSn分析を実行するように各部を制御する分析制御部と、
を備えることを特徴とする質量分析装置。 - 請求項1に記載の質量分析装置であって、
前記時間決定部は、複数のMSn-1スペクトルデータに基づいて、含有成分の濃度が時間経過に従いピーク状に変化するのに対応したクロマトグラム上のピークの開始時点を推定するピーク開始点推定部を含み、該ピーク開始時点から所定の遅延時間が経過した時点を許可開始時間として決定することを特徴とする質量分析装置。 - 請求項2に記載の質量分析装置であって、
前記時間決定部は、前記クロマトグラム上のピークの半値幅の推定値に基づいて前記遅延時間を定めることを特徴とする質量分析装置。 - 請求項3に記載の質量分析装置であって、
当該質量分析装置の前段にはクロマトグラフが接続され、
前記時間決定部は、該クロマトグラフにおける分離条件に基づいて前記クロマトグラム上のピークの半値幅を推定する半値幅推定部をさらに備えることを特徴とする質量分析装置。 - 請求項3に記載の質量分析装置であって、
前記時間決定部は、複数のMSn-1スペクトルデータに基づいて前記クロマトグラム上のピークの半値幅を推定する半値幅推定部をさらに備えることを特徴とする質量分析装置。 - 請求項2に記載の質量分析装置であって、
前記ピーク開始点推定部は、MSn-1スペクトルデータに基づいて算出した信号強度が所定の閾値を超えたときに、該信号強度及びそれ以前のMSn-1スペクトルデータに基づいて算出した一つ以上の信号強度に基づいてピーク開始時点を推定することを特徴とする質量分析装置。 - 請求項1に記載の質量分析装置であって、
前記時間決定部は、時間的に連続して得られる複数のMSn-1スペクトルデータに基づいて、含有成分の濃度が時間経過に従いピーク状に変化するのに対応したクロマトグラム上のピークの立ち上がり部分の曲線を推定し、該曲線の変曲点を求め、該変曲点の時点を許可開始時間として決定することを特徴とする質量分析装置。 - 請求項1~7のいずれかに記載の質量分析装置であって、
前記プリカーサイオン選択条件の一つとして、除外するイオン又は質量電荷比を示す除外イオン情報を含み、
前記時間決定部は、MSn-1分析によってMSn-1スペクトルデータが得られたとき、前記除外イオン情報に該当するデータを除外したうえで前記許可開始時間を決定することを特徴とする質量分析装置。
Priority Applications (5)
| Application Number | Priority Date | Filing Date | Title |
|---|---|---|---|
| EP15906247.0A EP3364185B1 (en) | 2015-10-15 | 2015-10-15 | Mass spectrometer |
| JP2017545045A JP6519661B2 (ja) | 2015-10-15 | 2015-10-15 | 質量分析装置 |
| CN201580085349.2A CN108369209B (zh) | 2015-10-15 | 2015-10-15 | 质谱分析装置 |
| PCT/JP2015/079114 WO2017064783A1 (ja) | 2015-10-15 | 2015-10-15 | 質量分析装置 |
| US15/768,157 US10613062B2 (en) | 2015-10-15 | 2015-10-15 | Mass spectrometer |
Applications Claiming Priority (1)
| Application Number | Priority Date | Filing Date | Title |
|---|---|---|---|
| PCT/JP2015/079114 WO2017064783A1 (ja) | 2015-10-15 | 2015-10-15 | 質量分析装置 |
Publications (1)
| Publication Number | Publication Date |
|---|---|
| WO2017064783A1 true WO2017064783A1 (ja) | 2017-04-20 |
Family
ID=58518089
Family Applications (1)
| Application Number | Title | Priority Date | Filing Date |
|---|---|---|---|
| PCT/JP2015/079114 Ceased WO2017064783A1 (ja) | 2015-10-15 | 2015-10-15 | 質量分析装置 |
Country Status (5)
| Country | Link |
|---|---|
| US (1) | US10613062B2 (ja) |
| EP (1) | EP3364185B1 (ja) |
| JP (1) | JP6519661B2 (ja) |
| CN (1) | CN108369209B (ja) |
| WO (1) | WO2017064783A1 (ja) |
Cited By (1)
| Publication number | Priority date | Publication date | Assignee | Title |
|---|---|---|---|---|
| WO2020194582A1 (ja) * | 2019-03-27 | 2020-10-01 | 株式会社島津製作所 | クロマトグラフ質量分析装置 |
Families Citing this family (4)
| Publication number | Priority date | Publication date | Assignee | Title |
|---|---|---|---|---|
| WO2020255340A1 (ja) * | 2019-06-20 | 2020-12-24 | 株式会社島津製作所 | クロマトグラフ質量分析装置 |
| FR3111010B1 (fr) * | 2020-05-28 | 2022-06-10 | Total Sa | Procédé et dispositif électronique de détermination d’un ensemble de grandeur(s) relatif à au moins un échantillon à partir d’un dispositif de spectrométrie, programme d’ordinateur et système de mesure associés |
| US11721534B2 (en) * | 2020-07-10 | 2023-08-08 | Bruker Daltonik Gmbh | Peak width estimation in mass spectra |
| JP7460988B2 (ja) * | 2021-01-22 | 2024-04-03 | 株式会社島津製作所 | クロマトグラフ質量分析装置 |
Citations (5)
| Publication number | Priority date | Publication date | Assignee | Title |
|---|---|---|---|---|
| JP2008298427A (ja) * | 2007-05-29 | 2008-12-11 | Shimadzu Corp | 質量分析装置 |
| JP2008309733A (ja) * | 2007-06-18 | 2008-12-25 | Shimadzu Corp | クロマトグラフ質量分析装置用データ処理装置 |
| JP2010019655A (ja) * | 2008-07-10 | 2010-01-28 | Shimadzu Corp | クロマトグラフ質量分析装置 |
| JP2012225862A (ja) * | 2011-04-22 | 2012-11-15 | Shimadzu Corp | 質量分析データ処理装置 |
| WO2013076826A1 (ja) * | 2011-11-22 | 2013-05-30 | 株式会社島津製作所 | 質量分析装置 |
Family Cites Families (5)
| Publication number | Priority date | Publication date | Assignee | Title |
|---|---|---|---|---|
| US7297941B2 (en) * | 2005-06-02 | 2007-11-20 | Thermo Finnigan Llc | Methods for improved data dependent acquisition |
| JP4577266B2 (ja) | 2006-05-16 | 2010-11-10 | 株式会社島津製作所 | クロマトグラフ質量分析装置 |
| US7982181B1 (en) * | 2008-01-15 | 2011-07-19 | Thermo Finnigan Llc | Methods for identifying an apex for improved data-dependent acquisition |
| WO2014096917A1 (en) * | 2012-12-20 | 2014-06-26 | Dh Technologies Development Pte. Ltd. | Parsing events during ms3 experiments |
| CN103487531B (zh) * | 2013-01-28 | 2015-11-25 | 中国药科大学 | 一种适用于天然产物高通量筛选的化合物库高效制备方法 |
-
2015
- 2015-10-15 EP EP15906247.0A patent/EP3364185B1/en active Active
- 2015-10-15 JP JP2017545045A patent/JP6519661B2/ja active Active
- 2015-10-15 CN CN201580085349.2A patent/CN108369209B/zh active Active
- 2015-10-15 US US15/768,157 patent/US10613062B2/en active Active
- 2015-10-15 WO PCT/JP2015/079114 patent/WO2017064783A1/ja not_active Ceased
Patent Citations (5)
| Publication number | Priority date | Publication date | Assignee | Title |
|---|---|---|---|---|
| JP2008298427A (ja) * | 2007-05-29 | 2008-12-11 | Shimadzu Corp | 質量分析装置 |
| JP2008309733A (ja) * | 2007-06-18 | 2008-12-25 | Shimadzu Corp | クロマトグラフ質量分析装置用データ処理装置 |
| JP2010019655A (ja) * | 2008-07-10 | 2010-01-28 | Shimadzu Corp | クロマトグラフ質量分析装置 |
| JP2012225862A (ja) * | 2011-04-22 | 2012-11-15 | Shimadzu Corp | 質量分析データ処理装置 |
| WO2013076826A1 (ja) * | 2011-11-22 | 2013-05-30 | 株式会社島津製作所 | 質量分析装置 |
Non-Patent Citations (1)
| Title |
|---|
| See also references of EP3364185A4 * |
Cited By (6)
| Publication number | Priority date | Publication date | Assignee | Title |
|---|---|---|---|---|
| WO2020194582A1 (ja) * | 2019-03-27 | 2020-10-01 | 株式会社島津製作所 | クロマトグラフ質量分析装置 |
| JPWO2020194582A1 (ja) * | 2019-03-27 | 2021-10-28 | 株式会社島津製作所 | クロマトグラフ質量分析装置 |
| JP7173293B2 (ja) | 2019-03-27 | 2022-11-16 | 株式会社島津製作所 | クロマトグラフ質量分析装置 |
| JP2023012485A (ja) * | 2019-03-27 | 2023-01-25 | 株式会社島津製作所 | クロマトグラム表示装置及びクロマトグラム表示方法 |
| JP7409462B2 (ja) | 2019-03-27 | 2024-01-09 | 株式会社島津製作所 | クロマトグラム表示装置 |
| US11940426B2 (en) | 2019-03-27 | 2024-03-26 | Shimadzu Corporation | Chromatograph mass spectrometer |
Also Published As
| Publication number | Publication date |
|---|---|
| EP3364185B1 (en) | 2025-09-03 |
| CN108369209A (zh) | 2018-08-03 |
| EP3364185A1 (en) | 2018-08-22 |
| US10613062B2 (en) | 2020-04-07 |
| JPWO2017064783A1 (ja) | 2018-07-12 |
| EP3364185A4 (en) | 2018-10-17 |
| JP6519661B2 (ja) | 2019-05-29 |
| US20180313794A1 (en) | 2018-11-01 |
| CN108369209B (zh) | 2021-03-02 |
Similar Documents
| Publication | Publication Date | Title |
|---|---|---|
| US9514922B2 (en) | Mass analysis data processing apparatus | |
| JP4577266B2 (ja) | クロマトグラフ質量分析装置 | |
| US8666681B2 (en) | Mass analysis data analyzing method and mass analysis data analyzing apparatus | |
| US9812307B2 (en) | Targeted mass analysis | |
| JP2007309661A5 (ja) | ||
| US10739320B2 (en) | Mass spectrometer | |
| JP2010019655A (ja) | クロマトグラフ質量分析装置 | |
| JP6519661B2 (ja) | 質量分析装置 | |
| JP2023012485A (ja) | クロマトグラム表示装置及びクロマトグラム表示方法 | |
| US20190011410A1 (en) | Device for processing mass spectrometric data for qualitative analysis | |
| CN104641450B (zh) | 质量分析装置 | |
| US20160314949A1 (en) | Mass spectrometer and mass spectrometry method | |
| CN106341983A (zh) | 优化光谱数据的方法 | |
| US10788469B2 (en) | Mass spectrometry data processor, mass spectrometry data processing method, and mass spectrometry data processing program | |
| JP6702501B2 (ja) | タンデム型質量分析装置及び該装置用プログラム | |
| JP7416232B2 (ja) | クロマトグラフ質量分析データ処理方法、クロマトグラフ質量分析装置、及びクロマトグラフ質量分析データ処理用プログラム | |
| JP7070692B2 (ja) | 質量分析装置及び質量分析方法 | |
| JP5786703B2 (ja) | クロマトグラフ質量分析装置用データ処理装置 | |
| JP7400698B2 (ja) | クロマトグラフ質量分析装置 | |
| US20260011540A1 (en) | Chromatograph Mass Spectrometry Data Processing Method and Chromatograph Mass Spectrometry Data Processing Apparatus | |
| WO2012108034A1 (ja) | 質量分析装置 | |
| Doig et al. | 10 Fundamental Aspects |
Legal Events
| Date | Code | Title | Description |
|---|---|---|---|
| 121 | Ep: the epo has been informed by wipo that ep was designated in this application |
Ref document number: 15906247 Country of ref document: EP Kind code of ref document: A1 |
|
| ENP | Entry into the national phase |
Ref document number: 2017545045 Country of ref document: JP Kind code of ref document: A |
|
| NENP | Non-entry into the national phase |
Ref country code: DE |
|
| WWE | Wipo information: entry into national phase |
Ref document number: 2015906247 Country of ref document: EP |
|
| WWE | Wipo information: entry into national phase |
Ref document number: 15768157 Country of ref document: US |
|
| WWG | Wipo information: grant in national office |
Ref document number: 2015906247 Country of ref document: EP |