WO2017221798A1 - 皮膚診断装置、皮膚状態出力方法、プログラムおよび記録媒体 - Google Patents
皮膚診断装置、皮膚状態出力方法、プログラムおよび記録媒体 Download PDFInfo
- Publication number
- WO2017221798A1 WO2017221798A1 PCT/JP2017/022064 JP2017022064W WO2017221798A1 WO 2017221798 A1 WO2017221798 A1 WO 2017221798A1 JP 2017022064 W JP2017022064 W JP 2017022064W WO 2017221798 A1 WO2017221798 A1 WO 2017221798A1
- Authority
- WO
- WIPO (PCT)
- Prior art keywords
- skin
- optical
- blood flow
- tomographic
- change
- Prior art date
- Legal status (The legal status is an assumption and is not a legal conclusion. Google has not performed a legal analysis and makes no representation as to the accuracy of the status listed.)
- Ceased
Links
Images











Classifications
-
- A—HUMAN NECESSITIES
- A61—MEDICAL OR VETERINARY SCIENCE; HYGIENE
- A61B—DIAGNOSIS; SURGERY; IDENTIFICATION
- A61B5/00—Measuring for diagnostic purposes; Identification of persons
- A61B5/44—Detecting, measuring or recording for evaluating the integumentary system, e.g. skin, hair or nails
- A61B5/441—Skin evaluation, e.g. for skin disorder diagnosis
-
- A—HUMAN NECESSITIES
- A61—MEDICAL OR VETERINARY SCIENCE; HYGIENE
- A61B—DIAGNOSIS; SURGERY; IDENTIFICATION
- A61B5/00—Measuring for diagnostic purposes; Identification of persons
- A61B5/44—Detecting, measuring or recording for evaluating the integumentary system, e.g. skin, hair or nails
- A61B5/441—Skin evaluation, e.g. for skin disorder diagnosis
- A61B5/442—Evaluating skin mechanical properties, e.g. elasticity, hardness, texture, wrinkle assessment
-
- A—HUMAN NECESSITIES
- A61—MEDICAL OR VETERINARY SCIENCE; HYGIENE
- A61B—DIAGNOSIS; SURGERY; IDENTIFICATION
- A61B10/00—Instruments for taking body samples for diagnostic purposes; Other methods or instruments for diagnosis, e.g. for vaccination diagnosis, sex determination or ovulation-period determination; Throat striking implements
-
- A—HUMAN NECESSITIES
- A61—MEDICAL OR VETERINARY SCIENCE; HYGIENE
- A61B—DIAGNOSIS; SURGERY; IDENTIFICATION
- A61B5/00—Measuring for diagnostic purposes; Identification of persons
-
- A—HUMAN NECESSITIES
- A61—MEDICAL OR VETERINARY SCIENCE; HYGIENE
- A61B—DIAGNOSIS; SURGERY; IDENTIFICATION
- A61B5/00—Measuring for diagnostic purposes; Identification of persons
- A61B5/0048—Detecting, measuring or recording by applying mechanical forces or stimuli
- A61B5/0053—Detecting, measuring or recording by applying mechanical forces or stimuli by applying pressure, e.g. compression, indentation, palpation, grasping, gauging
-
- A—HUMAN NECESSITIES
- A61—MEDICAL OR VETERINARY SCIENCE; HYGIENE
- A61B—DIAGNOSIS; SURGERY; IDENTIFICATION
- A61B5/00—Measuring for diagnostic purposes; Identification of persons
- A61B5/0059—Measuring for diagnostic purposes; Identification of persons using light, e.g. diagnosis by transillumination, diascopy, fluorescence
-
- A—HUMAN NECESSITIES
- A61—MEDICAL OR VETERINARY SCIENCE; HYGIENE
- A61B—DIAGNOSIS; SURGERY; IDENTIFICATION
- A61B5/00—Measuring for diagnostic purposes; Identification of persons
- A61B5/0059—Measuring for diagnostic purposes; Identification of persons using light, e.g. diagnosis by transillumination, diascopy, fluorescence
- A61B5/0062—Arrangements for scanning
- A61B5/0064—Body surface scanning
-
- A—HUMAN NECESSITIES
- A61—MEDICAL OR VETERINARY SCIENCE; HYGIENE
- A61B—DIAGNOSIS; SURGERY; IDENTIFICATION
- A61B5/00—Measuring for diagnostic purposes; Identification of persons
- A61B5/0059—Measuring for diagnostic purposes; Identification of persons using light, e.g. diagnosis by transillumination, diascopy, fluorescence
- A61B5/0062—Arrangements for scanning
- A61B5/0066—Optical coherence imaging
-
- A—HUMAN NECESSITIES
- A61—MEDICAL OR VETERINARY SCIENCE; HYGIENE
- A61B—DIAGNOSIS; SURGERY; IDENTIFICATION
- A61B5/00—Measuring for diagnostic purposes; Identification of persons
- A61B5/02—Detecting, measuring or recording for evaluating the cardiovascular system, e.g. pulse, heart rate, blood pressure or blood flow
- A61B5/02007—Evaluating blood vessel condition, e.g. elasticity, compliance
- A61B5/02021—Determining capillary fragility
-
- A—HUMAN NECESSITIES
- A61—MEDICAL OR VETERINARY SCIENCE; HYGIENE
- A61B—DIAGNOSIS; SURGERY; IDENTIFICATION
- A61B5/00—Measuring for diagnostic purposes; Identification of persons
- A61B5/02—Detecting, measuring or recording for evaluating the cardiovascular system, e.g. pulse, heart rate, blood pressure or blood flow
- A61B5/026—Measuring blood flow
-
- A—HUMAN NECESSITIES
- A61—MEDICAL OR VETERINARY SCIENCE; HYGIENE
- A61B—DIAGNOSIS; SURGERY; IDENTIFICATION
- A61B5/00—Measuring for diagnostic purposes; Identification of persons
- A61B5/02—Detecting, measuring or recording for evaluating the cardiovascular system, e.g. pulse, heart rate, blood pressure or blood flow
- A61B5/026—Measuring blood flow
- A61B5/0261—Measuring blood flow using optical means, e.g. infrared light
-
- A—HUMAN NECESSITIES
- A61—MEDICAL OR VETERINARY SCIENCE; HYGIENE
- A61B—DIAGNOSIS; SURGERY; IDENTIFICATION
- A61B5/00—Measuring for diagnostic purposes; Identification of persons
- A61B5/02—Detecting, measuring or recording for evaluating the cardiovascular system, e.g. pulse, heart rate, blood pressure or blood flow
- A61B5/026—Measuring blood flow
- A61B5/0285—Measuring or recording phase velocity of blood waves
-
- A—HUMAN NECESSITIES
- A61—MEDICAL OR VETERINARY SCIENCE; HYGIENE
- A61B—DIAGNOSIS; SURGERY; IDENTIFICATION
- A61B5/00—Measuring for diagnostic purposes; Identification of persons
- A61B5/103—Measuring devices for testing the shape, pattern, colour, size or movement of the body or parts thereof, for diagnostic purposes
- A61B5/1032—Determining colour of tissue for diagnostic purposes
-
- A—HUMAN NECESSITIES
- A61—MEDICAL OR VETERINARY SCIENCE; HYGIENE
- A61B—DIAGNOSIS; SURGERY; IDENTIFICATION
- A61B5/00—Measuring for diagnostic purposes; Identification of persons
- A61B5/44—Detecting, measuring or recording for evaluating the integumentary system, e.g. skin, hair or nails
- A61B5/441—Skin evaluation, e.g. for skin disorder diagnosis
- A61B5/443—Evaluating skin constituents, e.g. elastin, melanin, water
Definitions
- the present invention relates to an apparatus and method for diagnosing skin.
- Skin tissue plays an important role in preventing moisture loss, adjusting body temperature by exchanging heat with the outside world, protecting the living body from physical stimulation, and accepting senses such as touch.
- This skin tissue is mainly composed of three layers of epidermis, dermis and subcutaneous tissue.
- the mechanical properties of each layer change due to environmental changes such as aging and ultraviolet rays, it is considered that the skin aging phenomenon such as wrinkles and sagging is caused.
- the decline in microcirculatory function that governs the metabolic function of skin tissue is also considered to be one of the causes of the aging phenomenon. Therefore, it is considered that an integrated evaluation of the mechanical properties and circulatory function of the skin leads to effective skin care and anti-aging.
- Patent Document 1 a technique for analyzing the skin state by measuring the three-dimensional shape of the skin groove on the skin surface is known (see, for example, Patent Document 1). Also known is a technique for measuring the mechanical properties of the skin by sucking / unloading a specific part of the skin and detecting the surface position (see, for example, Patent Document 2).
- Patent Document 1 measures the surface shape itself that appears as a result of changes in skin tissue, and cannot be diagnosed at the level of skin tissue.
- the technique of patent document 2 can measure a mechanical characteristic at the level of a skin tissue, it is difficult to evaluate a skin state integratedly only by it.
- the present invention has been made in view of such problems, and one of its purposes is to provide an apparatus and method for diagnosing skin conditions in a multifaceted and integrated manner.
- An embodiment of the present invention relates to a skin diagnostic apparatus.
- This skin diagnostic apparatus includes an optical unit including an optical system using optical coherence tomography (hereinafter referred to as “OCT”), an optical mechanism for guiding light from the optical unit to the skin, and scanning the skin.
- OCT optical coherence tomography
- a control calculation unit that calculates a tomographic distribution of the determined state value and calculates an evaluation value of the skin based on the tomographic distribution, and a display device that displays the evaluation value of the skin.
- the control calculation unit calculates the mechanical characteristics and the blood flow state of the skin as the state values, and calculates the evaluation value by associating the mechanical characteristics and the blood flow state with the tomographic position of the skin.
- This skin diagnostic method includes a step of acquiring a tomographic image of the skin by OCT, a step of calculating a mechanical characteristic and a blood flow state of the skin based on the tomographic image, and a mechanical characteristic and a blood flow state. Obtaining information for evaluating the state of the skin by associating with the position, and outputting the information.
- One embodiment of the present invention is a skin diagnostic apparatus.
- This skin diagnostic apparatus has a function of controlling skin tomographic measurement by OCT, a function of acquiring a skin tomographic image by the tomographic measurement, and a mechanical characteristic and a blood flow state of the skin based on the acquired tomographic image.
- This skin diagnostic apparatus applies a predetermined deformation energy (load) to a specific part of the skin while taking a tomographic image of the specific part using OCT to determine the mechanical behavior of the skin tissue and the blood flow state associated therewith.
- An evaluation value for skin diagnosis is output based on the change.
- This mechanical behavior may be tomographically measured as “change in mechanical feature value” as a mechanical property.
- the “mechanical feature value” may be obtained based on the spatial distribution of the deformation vector (movement vector) of the skin tissue.
- This “mechanical feature amount” may be, for example, a deformation vector itself.
- the “change in mechanical feature value” may be a deformation rate vector obtained by temporally differentiating the deformation vector, or a strain rate tensor obtained by further spatially differentiating the deformation rate vector.
- the deformation velocity vector and the strain velocity tensor may be set as “mechanical feature value”, and the time differentiation of them may be set as “change in mechanical feature value”.
- the “blood flow state” may be a blood flow velocity or a form (shape or arrangement) of a blood vessel network. It may also be defined as “hemodynamics”.
- the mechanical features and blood flow state are measured in the process of calculating the evaluation values.
- the evaluation value may be displayed as a tomographic measurement value associated with the position of the skin tissue, or may be displayed as a value obtained by comprehensively evaluating a specific region or the entire skin based on the tomographic measurement value.
- a doctor or the like can make a skin diagnosis by viewing the evaluation value.
- This skin diagnostic apparatus includes an optical unit, an optical mechanism, a load device, and a control calculation unit.
- the optical unit includes an OCT optical system.
- the optical mechanism guides light from the optical unit to the skin for scanning.
- the tomographic measurement by OCT is possible on the micro scale, but may be realized on the nano scale according to the required resolution.
- the load device applies predetermined deformation energy (load) to the skin prior to acquisition of the tomographic image.
- the load loading method using the load device may be based on a stress relaxation method in which a constant strain is applied to a measurement target (skin) and a time change of stress is measured. Or based on the dynamic viscoelasticity method which gives the dynamic strain with respect to a measuring object, and measures the maximum value and phase difference of stress. Alternatively, it may be based on a creep method in which a time-dependent change in strain is measured by applying a certain amount of stress to the measurement object.
- the mechanical feature quantity of the skin changes due to the load applied by the load device.
- the blood flow state of the skin changes with the change of the mechanical feature amount.
- the control operation unit controls the driving of the load device and the optical mechanism, and processes the optical interference signal output from the optical unit in accordance with the drive, thereby calculating the tomographic distribution of the state value determined in advance with respect to the skin.
- the “state value” may include the above-described dynamic feature quantity and blood flow state.
- the control calculation unit calculates, for example, a change in mechanical feature value and a change in blood flow state in association with the tomographic position of the skin. Then, an evaluation value is calculated based on the degree of change in the blood flow state with respect to the change in the mechanical feature value.
- the information for evaluating the skin state is output based on the degree of change in the blood flow state with respect to the change in the mechanical feature amount of the skin using the tomographic measurement result by OCT. Since the output information based on the correlation (correspondence) between the mechanical characteristics and the blood flow characteristics can be obtained, the skin condition can be diagnosed from a multifaceted and integrated basis. Since the measurement by OCT is adopted, it is possible to perform tomographic measurement of the mechanical feature amount and the blood flow state at the level of each layer in the skin tissue. In particular, considering the fact that capillary information is included for the latter, it is meaningful to adopt OCT that can obtain microscale information.
- the control calculation unit may calculate the degree of deformation of the blood vessel network as the degree of change in the blood flow state. For example, when the vascular network at the corresponding location changes due to strain on the skin, the skin condition is good if the deformation of the vascular network quickly follows the change in strain, and the degree of goodness is calculated as the evaluation value. May be. When the deformation of the vascular network is delayed with respect to the strain change, the skin condition may be determined to be poor (there is room for improvement), and the degree may be calculated as an evaluation value.
- control calculation unit may calculate the degree of change in blood flow velocity as the degree of change in blood flow state. For example, when the blood flow velocity at the corresponding location changes due to strain on the skin, if the change in blood flow velocity quickly follows the strain change, the skin condition is good, and the degree of goodness is used as the evaluation value. It may be calculated. When the change in blood flow velocity is delayed with respect to the change in strain, the skin condition may be determined to be poor (there is room for improvement), and the degree may be calculated as an evaluation value. The display device visually displays the calculated evaluation value.
- control calculation unit calculates a displacement related vector corresponding to the tomographic position of the skin as a mechanical feature based on the tomographic image data acquired by processing the optical interference signal, and the displacement related vector
- the evaluation value may be calculated based on the degree of change in the blood flow state with respect to the change.
- the control calculation unit may calculate a deformation rate vector as a displacement-related vector or a strain rate tensor obtained by spatial differentiation of the deformation rate vector.
- the control calculation unit further calculates a change in the moisture content (moisture content) of the skin due to the application of deformation energy (load) in association with the tomographic position of the skin, and the blood flow state and the moisture content with respect to the change in the mechanical feature value
- the evaluation value may be calculated based on the degree of change in (water content).
- the evaluation value may be calculated based on the quality of the mechanical characteristics with respect to the blood flow state.
- the vascular network of the skin may be calculated, and the evaluation value may be calculated based on the distribution of mechanical properties (elasticity and viscoelasticity) near the vascular network. Specifically, when the elasticity or viscoelasticity in the vicinity of blood vessels (capillaries, etc.) is lower than a predetermined reference value (that is, when the skin tissue of the portion is hardened), the deterioration (aging) of the skin proceeds. It is possible to display an evaluation value indicating that the elasticity or viscoelasticity in the vicinity of blood vessels (capillaries, etc.) is lower than a predetermined reference value (that is, when the skin tissue of the portion is hardened), the deterioration (aging) of the skin proceeds. It is possible to display an evaluation value indicating that the elasticity or viscoelasticity in the vicinity of blood vessels (capillaries, etc.) is lower than a predetermined reference value (that is, when the skin tissue of the portion is hardened), the deteriorat
- a skin diagnosis method using the above technique may be constructed.
- This method includes a step of acquiring a tomographic image of the skin by OCT, a step of calculating the mechanical characteristics and blood flow state of the skin based on the tomographic image, and the mechanical characteristics and blood flow state of the skin tomographic position. And acquiring the information for evaluating the state of the skin by associating with, and outputting the information. Specifically, it may include a step of outputting information for evaluating the skin state based on the degree of change in the blood flow state with respect to the change in the mechanical feature amount accompanying the deformation of the skin.
- a skin diagnostic program using the above technique may be constructed.
- This program has the function of acquiring a tomographic image of the skin by OCT, the function of calculating the mechanical characteristics and blood flow state of the skin based on the tomographic image, and the mechanical characteristics and blood flow state of the skin tomographic position.
- information for diagnosing skin can be acquired, and the function of outputting the information can be realized by a computer.
- a function of outputting information for evaluating the skin state may be realized based on the degree of change in the blood flow state with respect to the change in the mechanical feature amount accompanying the skin deformation.
- This program may be recorded on a computer-readable recording medium.
- a light transmissive elastic member may be disposed between the pressing mechanism and the skin.
- the load device applies a pressing load to the skin via the elastic member.
- the optical mechanism irradiates and receives light so as to pass through the elastic member.
- the load detection unit can detect a load applied to the elastic member as a pressing load applied to the surface of the skin.
- the control calculation unit calculates a tomographic distribution of changes in the mechanical feature amount due to skin deformation, and calculates an evaluation value of the skin based on the tomographic distribution.
- the control calculation unit calculates the change in the mechanical feature value of the skin due to the application of the pressing load in association with the tomographic position of the skin, and calculates the evaluation value based on the degree of change in the mechanical feature value with respect to the change in the pressing load. To do.
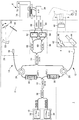
- FIG. 1 is a diagram schematically illustrating a configuration of a skin diagnostic apparatus according to an embodiment.
- the skin diagnostic apparatus according to the present embodiment makes tomographic measurement of skin tissue on a microscale and enables evaluation of the skin condition (skin evaluation or the like). OCT is used for this tomographic measurement.
- a skin diagnostic apparatus 1 includes an optical unit 2 including an optical system using OCT, an optical mechanism 4 connected to the optical unit 2, a load device 5 for applying a diagnostic load to the skin S, and A control calculation unit 6 that performs calculation processing based on optical interference data obtained by OCT is provided.
- an optical system based on a Mach-Zehnder interferometer is shown as the optical unit 2, but a Michelson interferometer or other optical system may be employed.
- TD-OCT Time Domain OCT
- SS-OCT Send Source OCT
- SD-OCT Spectrum Domain OCT
- other OCT may be used. Since SS-OCT does not require mechanical optical delay scanning such as reference mirror scanning, it is preferable in that high time resolution and high position detection accuracy can be obtained.
- the optical unit 2 includes a light source 10, an object arm 12, a reference arm 14, and a light detection device 16. Each optical element is connected to each other by an optical fiber.
- the light emitted from the light source 10 is divided by a coupler 18 (beam splitter), one of which becomes object light guided to the object arm 12 and the other becomes reference light guided to the reference arm 14.
- the object light guided to the object arm 12 is guided to the optical mechanism 4 via the circulator 20 and is irradiated to the skin S that is a measurement target. This object light is reflected as backscattered light on the surface and cross section of the skin S, returns to the circulator 20, and is guided to the coupler 22.
- the reference light guided to the reference arm 14 is guided to the optical mechanism 26 via the circulator 24.
- This reference light is reflected by a resonant mirror 54 (Resonant mirror) of the optical mechanism 26, returns to the circulator 24, and is guided to the coupler 22. That is, the object light and the reference light are combined (superimposed) by the coupler 22, and the interference light is detected by the light detection device 16.
- the light detection device 16 detects this as an optical interference signal (a signal indicating the intensity of interference light).
- This optical interference signal is input to the control calculation unit 6 via the A / D converter 30.
- the control calculation unit 6 performs control processing for the entire optical system of the optical unit 2, drive control of the optical mechanisms 4 and 26, and image output by OCT.
- the command signal of the control calculation unit 6 is input to the optical mechanisms 4 and 26 through a D / A converter (not shown).
- the control calculation unit 6 processes the optical interference signal output from the optical unit 2 based on the driving of the optical mechanisms 4 and 26 and acquires a tomographic image of the measurement target (skin S) by OCT. Based on the tomographic image data, a tomographic distribution of a specific physical quantity inside the measurement target is calculated by a method described later.
- the light source 10 includes two light sources 32 and 34 having different center wavelengths so that the moisture content of the skin can be detected. These light sources are broadband light sources composed of a super luminescent diode (hereinafter referred to as “SLD”).
- SLD super luminescent diode
- the light source 32 is a 1310 nm wavelength band light source
- the light source 34 is a 1430 nm wavelength band light source.
- the control calculation unit 6 can operate both the light sources 32 and 34 simultaneously in parallel, but can also operate only one according to the physical quantity to be measured.
- a WDM (Wavelength Division Multiplexing) spectroscopic element 36 is provided between the light source 10 and the coupler 18.
- Light emitted from the light sources 32 and 34 is multiplexed by the spectroscopic element 36 and guided to the coupler 18.
- EOPM38 Electro-Optic Phase Modulator
- an EOPM 40 is provided between the coupler 18 and the circulator 24.
- the optical mechanism 4 constitutes an object arm 12.
- the light that has passed through the circulator 20 is guided to the optical mechanism 4 through the collimator lens 41.
- the optical mechanism 4 includes a mechanism that guides and scans light from the optical unit 2 to the measurement target (skin S), and a drive unit (actuator) that drives the mechanism.
- the optical mechanism 4 includes a galvano device 42.
- the galvano device 42 includes a fixed mirror 44 and a galvano mirror 46.
- the objective lens 48 is disposed to face the skin S (measurement target).
- Light incident on the object arm 12 via the coupler 18 is scanned in the x-axis direction and the y-axis direction by the biaxial galvanometer mirror 46 and is applied to the skin S.
- the reflected light from the skin S returns to the circulator 20 as object light and is guided to the coupler 22.
- the optical mechanism 26 is an RSOD (Rapid / Scanning / Optical / Delay / Line) mechanism and constitutes the reference arm 14.
- the optical mechanism 26 includes a diffraction grating 50, a curved mirror 52 (Concave mirror), and a resonant mirror 54.
- the light that has passed through the circulator 24 is guided to the optical mechanism 26 through the collimator lens 56.
- This light is dispersed for each wavelength by the diffraction grating 50, and is condensed on the resonant mirror 54 by the curved mirror 52.
- By rotating the resonant mirror 54 at a minute angle high-speed optical path scanning becomes possible.
- the reflected light from the resonant mirror 54 returns to the circulator 24 as reference light and is guided to the coupler 22. Then, the light is superimposed on the object light and transmitted to the light detection device 16 as interference light.
- the light detection device 16 includes WDM-type spectroscopic elements 58 and 60 and light detectors 62 and 64.
- the 1310 nm wavelength band light is guided to the spectroscopic element 58 and detected by the photodetector 62 as an optical interference signal.
- This optical interference signal is input to the control calculation unit 6 via a BPF (Band-Pass Filter) 66 and an A / D converter 30.
- the 1430 nm wavelength band light is guided to the spectroscopic element 60 and detected by the photodetector 64 as an optical interference signal (OCT interference signal).
- This optical interference signal is input to the control calculation unit 6 via the BPF 68 and the A / D converter 30.
- control calculation unit 6 is a personal computer, and includes an input device 70 for receiving various setting inputs by the user, a calculation processing unit 72 for executing calculation processing according to a calculation program for image processing, and calculation results. Is included.
- the arithmetic processing unit 72 includes a CPU, a ROM, a RAM, a hard disk, and the like, and can perform arithmetic processing for image output based on control of the entire optical unit 2 and optical processing results by using these hardware and software. .
- FIG. 2 is a diagram schematically showing the configuration of the load device 5.
- the load device 5 is configured as a type that applies a suction load to the measurement target portion of the skin S.
- a probe 80 for skin diagnosis is provided at the tip of the optical mechanism 4, and the load device 5 is connected to the probe 80.
- the upper half of the probe 80 functions as the optical mechanism 4, and the lower half functions as the load device 5.
- the probe 80 has a metal body 82.
- An internal passage 84 is formed so as to penetrate the body 82 in the axial direction.
- the translucent glass 86 is arrange
- the galvano device 42 and the objective lens 48 are disposed in a space S21 above the glass 86.
- a suction chamber 88 connected to the load device 5 communicates with the space S ⁇ b> 22 below the glass 86.
- Packing 90 is provided above and below the glass 86, and a seal between the space S21 and the space S22 is secured.
- the glass 86 functions as an entrance window for the OCT beam.
- the axis of the internal passage 84 coincides with the optical axis of the object arm 12.
- the lower end opening of the internal passage 84 is a suction port 92 that is applied to the skin S during diagnosis.
- the load device 5 includes a vacuum pump 100, a regulator 102, a reservoir 104, a pressure gauge 106, and the like.
- the regulator 102 controls the pressure to a target value.
- the reservoir 104 suppresses pressure fluctuation of the suction port 92.
- Skin mechanical characteristics Prior to the calculation of the skin mechanical characteristics, the skin mechanical features are calculated. In order to calculate the mechanical feature amount, a tomographic distribution of strain accompanying skin deformation is calculated. As described above, in OCT, the object light (reflected light from the skin) that has passed through the object arm 12 and the reference light that has passed through the reference arm 14 are combined and detected as an optical interference signal by the light detection device 16. The control calculation unit 6 can acquire the optical interference signal as a tomographic image of the measurement target (skin S) based on the interference light intensity. Although this fault distribution can be calculated in two dimensions, the calculation in three dimensions will be described here.
- the coherence length l c which is the resolution in the OCT optical axis direction (depth direction) is determined by the autocorrelation function of the light source.
- the coherence length l c is the half-width of the comprehensive line of the autocorrelation function and can be expressed by the following formula (1).
- ⁇ c is the center wavelength of the beam
- ⁇ is the full width at half maximum of the beam.
- the resolution in the direction perpendicular to the optical axis is 1 ⁇ 2 of the beam spot diameter D based on the light condensing performance of the condensing lens.
- the beam spot diameter ⁇ can be expressed by the following formula (2).
- d is a beam diameter incident on the condenser lens
- f is a focal point of the condenser lens.
- the deformation vector distribution is calculated by applying the FFT cross-correlation method to the two three-dimensional OCT tomographic images before and after the deformation of the measurement target.
- a recursive cross-correlation method recursive cross-correlation method that repeatedly performs cross-correlation processing is applied. This is a technique of applying a cross-correlation method by referring to a deformation vector calculated at a low resolution, limiting an exploration area and hierarchically reducing an inspection area. Thereby, a high-resolution deformation vector can be acquired.
- an adjacent cross-correlation multiplication method (Adjacent cross-correlation Multiplication) that performs multiplication with a correlation value distribution in an adjacent inspection region is used. Then, the maximum correlation value is searched from the correlation value distribution that has been multiplied to increase the SN.
- the sub-pixel accuracy of the deformation vector is important.
- both the up-stream gradient method using brightness gradient (Up-stream Gradientmethod) and the image deformation method considering image expansion and shear (Image Deformation method) are used together to detect deformation vectors with high accuracy.
- the “windward gradient method” here is a kind of gradient method (optical flow method).
- the strain fault distribution can be calculated by spatially differentiating the deformation vector distribution thus obtained.
- the deformation amount (movement amount) is smoothed using a moving least square method (Moving Least Square Method), and a three-dimensional strain tensor is calculated from the derivative.
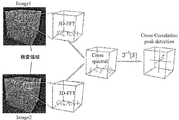
- FIG. 3 is a diagram schematically showing a processing procedure by the FFT cross-correlation method.
- the FFT cross-correlation method is a method for evaluating the local speckle pattern similarity using the correlation values R i, j, k, and uses a Fourier transform to calculate the correlation values.
- the NxNxN (pixel) inspection area is set in the first image (Image1), while the same size search area is set in the same position in the second image (Image2), and the correlation between these two areas Perform the calculation.
- the incident optical axis vertical direction and the optical axis direction be X, Y, and Z, respectively.
- the luminance value patterns of the inspection area of the first image and the search area of the second image are f (X i , Y j , Z k ) and g (X i , Y j , Z k ), respectively, and the Fourier transform is F ⁇ f (X i , Y j , Z k ) ⁇ , F ⁇ g (X i , Y j , Z k ) ⁇ .
- the cross spectrum S i, j, k ( ⁇ , ⁇ , ⁇ ) of the following equation (3) is obtained and subjected to inverse Fourier transform to thereby obtain a cross-correlation function R i, j, k ( ⁇ X, ⁇ Y, ⁇ Z) is obtained.
- F ⁇ 1 represents the inverse Fourier transform.
- ⁇ f and ⁇ g represent the average luminance values in the inspection region of f (X i , Y j , Z k ) and g (X i , Y j , Z k ), respectively, and the deviation from the average value And the correlation value is normalized.
- the coordinates giving the maximum correlation value are selected from the correlation value distributions R i, j, k ( ⁇ X, ⁇ Y, ⁇ Z) calculated in this way, and a deformation vector (movement vector) with pixel accuracy is determined.
- FIG. 4 is a diagram schematically showing a processing procedure by the recursive cross correlation method. For simplicity, the figure is shown in a two-dimensional manner for convenience.
- 4 (A) to 4 (C) show processing steps by the recursive cross-correlation method.
- Each figure shows tomographic images before and after being photographed by OCT.
- the previous tomographic image (Image1) is shown on the left side, and the later tomographic image (Image2) is shown on the right side.
- an inspection region S1 to be inspected with a similarity degree is set in the previous tomographic image (Image1), and similar to the subsequent tomographic image (Image2).
- An exploration area S2 that is an exploration range of the degree is set.
- This method employs a recursive cross-correlation method that increases the spatial resolution by repeating the cross-correlation process while reducing the inspection area S1.
- the spatial resolution is doubled when the resolution is increased.
- the inspection area S1 and the exploration area S2 are hierarchically reduced by half in the X, Y, and Z directions to increase the spatial resolution.
- an adjacent cross-correlation multiplication method is introduced to determine an accurate maximum correlation value from a correlation value distribution having strong randomness affected by speckle noise.
- the correlation value distribution R i, j, k ( ⁇ X, ⁇ Y, ⁇ Z) in the inspection region S1 and the correlation value for the adjacent inspection region overlapping with the inspection region S1 are expressed by the following equation (5). Multiply with distribution.
- the maximum correlation value is searched using the new correlation value distribution R ′ i, j, k ( ⁇ X, ⁇ Y, ⁇ Z) obtained in this way.
- FIG. 5 is a diagram schematically showing a processing procedure by subpixel analysis. For simplicity, the figure is shown in a two-dimensional manner for convenience.
- FIGS. 5A to 5C show processing steps by subpixel analysis. Each figure shows tomographic images before and after continuous imaging by OCT. The previous tomographic image (Image1) is shown on the left side, and the later tomographic image (Image2) is shown on the right side.
- an upwind gradient method and an image deformation method are used for subpixel analysis.
- the final movement amount is calculated by an image deformation method described later
- the windward gradient method is applied prior to the image deformation method because of the problem of convergence of the calculation.
- the image deformation method and the windward gradient method for detecting the sub-pixel movement amount with high accuracy are applied under the condition of the inspection area size being small and the high spatial resolution.
- the subpixel movement amount is calculated by the windward gradient method.
- the luminance difference before and after deformation at the point of interest is represented by the luminance gradient and movement amount of each component.
- the sub-pixel movement amount can be determined using the least square method from the luminance gradient data in the inspection region S1.
- the windward difference method is used which gives the windward brightness gradient before the subpixel deformation. That is, there are various methods for subpixel analysis, but in this embodiment, a gradient method is used to detect the subpixel movement amount with high accuracy even under the condition of a small inspection region size and high spatial resolution.
- the windward gradient method calculates the movement of the point of interest in the inspection region S1 not only with the pixel accuracy shown in FIG. 5A but also with the sub-pixel accuracy shown in FIG. 5B.
- Each grid in the figure represents one pixel. Actually, it is considerably smaller than the tomographic image shown in the figure, but for the convenience of explanation, it is shown in large size.
- This windward gradient method is a method of formulating changes in the luminance distribution before and after the minute deformation by the luminance gradient and the amount of movement. It is expressed as equation (6).
- the above formula (6) indicates that the luminance difference before and after the deformation of the attention point is represented by the luminance gradient and the movement amount before the deformation. Since the movement amount ( ⁇ x, ⁇ z) cannot be determined only by the above equation (6), the movement amount is considered to be constant in the inspection region S1, and is calculated by applying the least square method.
- the luminance difference before and after the movement at each point of interest on the right side can only be obtained uniquely. Therefore, how accurately the luminance gradient is calculated is directly related to the accuracy of the movement amount.
- the primary accuracy upwind difference is used. This is because applying high-order differences in differentiating requires a lot of data and is greatly affected when noise is included.
- the high-order difference based on each point in the inspection area S1 uses a lot of data outside the inspection area S1, and there is a problem that the amount of movement of the inspection area S1 itself is lost. is there.
- the difference on the windward side is applied before the deformation.
- the windward is not the actual movement direction but the direction of the subpixel movement amount with respect to the pixel movement amount, and the upwind is determined by performing parabolic approximation on the maximum correlation value peak.
- the luminance difference on the leeward side after the deformation moves in the opposite direction, a difference in luminance at the point of interest occurs, so the difference on the leeward side is applied after the deformation.
- the position of the point of interest before (after) deformation is obtained from the subpixel movement amount ( ⁇ x, ⁇ y, ⁇ z) when parabolic approximation is performed.
- the luminance gradient is calculated from the ratio thereof. Specifically, the following formula (7) is used. The amount of movement was determined by applying the least square method using the luminance gradient thus calculated and the luminance change.
- the cross-correlation is performed between the inspection area S1 before the deformation of the material and the inspection area S1 considering the expansion and contraction and shear deformation after the deformation, and the sub-pixel deformation amount is determined by iterative calculation based on the correlation value. Note that the expansion and contraction and the shear deformation of the inspection region S1 are linearly approximated.
- a bicubic function interpolation method is applied to the luminance distribution of the OCT tomogram before material deformation, and the luminance distribution is made continuous.
- the bicubic function interpolation method is a technique for reproducing spatial continuity of luminance information using a convolution function obtained by piecewise approximating a sinc function.
- a convolution function obtained by piecewise approximating a sinc function.
- the value of a is determined based on the verification result by the numerical experiment using the pseudo OCT tomogram.
- the inspection area S1 calculated in consideration of expansion and contraction and shear deformation is accompanied by deformation along with movement.
- the coordinates (x, y, z) at the integer pixel position in a certain examination region S1 in the OCT tomogram before the skin tissue deformation move to the coordinates (x * , y * , z * ) after the deformation x * , y * , z * are represented by the following formula (9).
- u, v, and w are movement amounts in the x, y, and z directions, respectively
- ⁇ x, ⁇ y, and ⁇ z are movement amounts from the center of the inspection region S1 to the coordinates (x, y, z)
- ⁇ u / ⁇ x , ⁇ v / ⁇ y, ⁇ w / ⁇ z are vertical strains in the x, y, and z directions, ⁇ u / ⁇ y, ⁇ u / ⁇ z, ⁇ v / ⁇ x, ⁇ v / ⁇ z, ⁇ w, respectively.
- / ⁇ x and ⁇ w / ⁇ y are shear strains.
- the Newton-Raphson method is used for the numerical solution, and 12 variables (u, v, w, ⁇ u / ⁇ x, ⁇ u / ⁇ y, ⁇ u / ⁇ z, ⁇ v / ⁇ x, ⁇ v / ⁇ y, The iterative calculation is performed so that the correlation value differential coefficient at ⁇ v / ⁇ z, ⁇ w / ⁇ x, ⁇ w / ⁇ y, ⁇ w / ⁇ z) becomes 0, that is, the maximum correlation value is obtained.
- the sub-pixel movement amount obtained by the windward gradient method is used as the initial movement amount value in the x, y, and z directions.
- the Hessian matrix for the correlation value R is H and the Jacobian vector for the correlation value is ⁇ R
- the update amount ⁇ Pi obtained in one iteration is expressed by the following equation (10).
- the present embodiment employs the sub-pixel movement amount obtained by the windward gradient method. As described above, a deformation vector distribution with sub-pixel accuracy is obtained.
- the moving least square method is used to calculate the strain amount. That is, the deformation amount (movement amount) is smoothed using the moving least square method, and the strain tensor is calculated from the derivative.
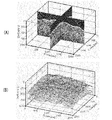
- FIG. 6 and 7 show three-dimensional OCT tomographic images of the skin.
- the OCT beam is irradiated from the upper surface of the image.
- the upper high-brightness line represents the skin surface
- the internal high-brightness line represents the boundary between the stratum corneum and the epidermis living cell layer.
- FIG. 6B shows the skin surface and the boundary between the stratum corneum and the epidermis living cell layer extracted from the OCT tomographic image. Unevenness appears on the skin surface.
- the surface meandering and the meandering of the boundary between the stratum corneum and the epidermis cell layer are synchronized, which is consistent with known pathology reports.
- FIG. 7A shows a tomographic distribution of deformation vectors when a suction force is applied to the skin. It can be seen from the figure that the deformation vector is generated upward. It can be confirmed that the skin rises with the suction.
- FIG. 7B shows the three-dimensional strain ⁇ xx in the x direction. Thus, the mechanical behavior of the skin can be grasped by OCT tomographic measurement.
- the elasticity and viscoelasticity of the skin are calculated as the mechanical characteristics of the skin.
- a predetermined load is applied to the measurement target region of the skin, and tomographic measurement by OCT is performed.
- a creep method is employed as the load application method, in which a certain amount of stress is applied to measure the time change of strain. That is, the skin tissue is regarded as a viscoelastic model, and the creep recovery time is calculated.
- the strain rate at the time of creep recovery is expressed by the following equation (11).
- ⁇ (k, c) is a creep recovery time
- k is an elastic coefficient
- c is a viscosity coefficient.
- ⁇ (k, c) increases if the model is viscous and decreases if it is elastic.
- FIG. 8 is a diagram illustrating a viscoelastic model of skin tissue.
- the creep recovery time ⁇ (k, c) is expressed by a function of an elastic coefficient and a viscosity coefficient as in the following formulas (12) and (13). For this reason, it is possible to consider the mechanical characteristics of the skin tissue by calculating the fault distribution ⁇ (x, y, z) of the creep recovery time.
- FIG. 9 is a diagram exemplifying the result of tomographic measurement relating to mechanical characteristics.
- the result of unloading after applying a predetermined suction load to the measurement target site of the skin and performing the OCT tomographic measurement in the creep recovery process of the skin tissue is shown.
- FIG. 9A shows the correspondence between skin tissue and tomographic images. The figure is shown in a two-dimensional manner for convenience.
- a low luminance region 150 ⁇ m from the skin surface represents the epidermis, and a high luminance region below it represents the dermis.
- FIG. 9 (B) and 9 (C) show the fault distribution of the deformation velocity vector after a predetermined time from unloading.
- FIG. 9B shows 0.19 seconds later
- FIG. 9C shows 0.38 seconds later.
- FIG. 10 is a diagram showing a fault distribution of creep recovery time.
- a strain rate tensor can be obtained by spatially differentiating the deformation rate vector shown in FIG.
- the fault distribution ⁇ (x, y, z) of the creep recovery time shown in FIG. 10 can be calculated.
- the figure is shown in the two-dimensional aspect for convenience. From this tomographic distribution, it can be confirmed that a creep recovery time is short and elastic behavior is shown near the surface of the skin, whereas a region showing viscous behavior exists in the deep layer of the skin. As described above, the mechanical characteristics of the skin can be grasped by OCT tomographic measurement.
- a (t) is the amplitude
- ⁇ c is the central angular frequency of the light source
- ⁇ r is a Doppler angular frequency generated in the RSOD resonant mirror 54.
- the electric field E ′ o (t) of the object light is expressed by the following formula (15) in consideration of the Doppler angular frequency shift amount ⁇ d generated by the flow velocity.
- the detected interference light intensity I ′ d (t) is expressed by the following equation (16).
- the detected tomographic interference signal I d (x, y, z) is expressed by the following equation (17).
- the angular frequency of the interference signal is ⁇ m + ⁇ r ⁇ d .
- the Doppler angular frequency shift amount ⁇ d caused by the blood flow velocity is detected.
- the Doppler angular frequency shift amount omega d it is possible to obtain the blood flow velocity v.
- lambda c is the center wavelength
- theta (x, y, z) angle formed coordinates (x, y, z) is the incident direction of the flow velocity direction and the beam in the light source.
- n is the average refractive index inside the skin.
- a depth direction (z-axis direction) scanning method using RSOD is employed.
- the Hilbert transform and the adjacent autocorrelation method are applied. That is, the adjacent autocorrelation method is applied to the analysis signal (complex signal) ⁇ (t) obtained by applying the Hilbert transform to spatially adjacent interference signals. Thereby, the phase difference ⁇ at an arbitrary coordinate is obtained, and the Doppler angular frequency shift amount ⁇ d due to the blood flow velocity is detected.
- the interference signals are expressed as the following equation (19).
- s (t) represents the real part of the analytic signal ⁇ (t)
- s ⁇ (t) represents the imaginary part
- ⁇ T represents the acquisition time interval of the j, j + 1-th interference signal
- A represents the amplitude of the interference signal (that is, the backscattering intensity).
- the phase difference between the interference signals is zero.
- the phase difference between the interference signals of ⁇ j and ⁇ j + 1 corresponds to the phase change amount ⁇ d ⁇ T due to Doppler modulation caused by the blood flow velocity. That is, the Doppler angular frequency shift amount ⁇ d generated by the blood flow velocity is expressed as the following equation (20).
- the amount of phase change can be detected in the range of ⁇ to ⁇ . Further, by performing an ensemble averaging process on n interference signals according to the following equation (21), the detectability of the Doppler angular frequency shift amount ⁇ d can be improved.
- Doppler angular frequency shift amount omega d obtained as above by substituting the above equation (18), it is possible to calculate the blood flow velocity v.
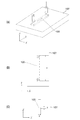
- FIG. 11 is a diagram showing a part of the apparatus used for the blood flow velocity simulation test.
- 11A is a perspective view
- FIG. 11B is a plan view
- FIG. 11C is a front view (viewed in the Y direction).
- FIG. 12 is a diagram showing a tomographic distribution of flow velocity measured by OCT. 12A to 12D show the results when the set average flow velocity U of the erythrocyte suspension described later is different.
- the micro flow path 105 shown in FIG. 11 was used. That is, the microchannel 105 was formed in the member 107 imitating the skin, and a red blood cell suspension (Red Blood Cells' suspension) imitating blood was pumped in the Y direction.
- the erythrocyte suspension was prepared using blood collected from a healthy human.
- FIG. 13 is a schematic diagram illustrating a blood vessel network calculation method using OCT.
- the left side of the figure shows a tomographic image acquired at time t, and the right side shows a tomographic image acquired at time t + 1.
- the figure is shown in a two-dimensional manner.
- the examination region I is set in the continuously acquired tomographic images, and the autocorrelation ZNCC in the region is calculated. That is, the change in the image at the same coordinate (i, j) in the inspection area I is calculated as the autocorrelation value Ct (i, j) in the following equation (22).
- a blood vessel network can be calculated by performing noise reduction processing such as a spatial frequency filter and a median filter on the blood vessel data obtained in this way.
- the blood vessel network calculation accuracy may be improved by performing such autocorrelation processing on three or more tomographic images (time t + 2,..., T + N) in a superimposed manner.
- FIG. 14 is a diagram showing the calculation result of the vascular network.
- FIG. 14A shows the result of measuring the normal state for a predetermined position of the forearm.
- FIG. 14B shows the measurement result at the same position when the blood circulation promoter is applied.
- the region corresponding to the vascular network that is, the region with low autocorrelation is displayed so as to have high luminance (white). From these figures, it can be seen that the blood vessel network is expanded by the blood circulation promoter. From this measurement result, it was confirmed that the vascular network can be calculated by OCT. Note that when the vascular network is disrupted due to a load on the skin, the visibility of the vascular network by OCT is reduced on the downstream side of the disrupted portion. When the load is unloaded, the visibility of the vascular network by OCT is restored. By detecting such behavior, it is possible to evaluate the load responsiveness of the skin and blood vessels, and thus the quality of the skin condition.
- FIG. 15 is a diagram illustrating light absorption characteristics by water. This figure shows the relationship between the wavelength of light and the intensity, and the relationship between the wavelength of light and the light absorption coefficient of water. From this figure, in the tissue with high water content, the backscattered light intensity attenuates exponentially due to the light absorption effect of the 1430 nm wavelength band light, but the effect of the light absorption effect on the backscattered light intensity of the 1310 nm wavelength band light. It turns out that does not appear.
- the moisture content distribution is detected using the difference in the light absorption characteristics of these two wavelength bands. That is, in the present embodiment, as described above, a 1430 nm wavelength band light source having a light absorption characteristic due to moisture and a 1310 nm wavelength band light source not having a light absorption characteristic due to moisture are used.
- the backscattered light intensity I ⁇ c at the deep position z of the skin is a convolution integral of the coherence function G ⁇ c (z) of the light source and the back reflected light intensity O ⁇ c (x, y, z) inside the skin.
- I inc ⁇ c represents the irradiation intensity to the reference mirror and the measurement object (skin)
- the suffix ⁇ c of each variable represents the center wavelength of the incident light.
- the coherence function G ⁇ c (z) can be approximated as a delta function, and the detection signal in OCT is I ⁇ c ⁇ I inc ⁇ cO ⁇ c (x, y, z). Furthermore, since O ⁇ c (x, y, z) depends on the incident light intensity distribution I o ⁇ c (z) determined by the objective lens, the energy reflectance r ⁇ c inside the tissue, the scattering attenuation, and the absorption attenuation, The back reflected light intensity O ⁇ c (x, y, z) can be approximately formulated by the following equation (24).
- scattering coefficient the scattering attenuation coefficient ⁇ s ⁇ c
- absorption coefficient the absorption attenuation coefficient ⁇ a ⁇ c
- the absorption coefficient ⁇ a 1310 in the 1310 nm wavelength band can be ignored because the molar absorption coefficient of water is very small, and the tissue scattering coefficient distribution can be obtained from the attenuation coefficient ⁇ s 1310 . Furthermore, the absorption coefficient ⁇ a 1430 can be separated and detected by calculating in advance the scattering coefficient ratio ⁇ shown in the following equation (27).
- MLSM moving least square method
- FIG. 16 shows the relationship between the light absorption characteristics of water and the water content.
- FIG. 16A shows the relationship between the attenuation coefficient and the water content in each wavelength band.
- the horizontal axis indicates the moisture content
- the vertical axis indicates the attenuation coefficient.
- FIG. 16B shows the relationship between the absorption coefficient and the water content in each wavelength band.
- the horizontal axis indicates the moisture content
- the vertical axis indicates the absorption coefficient.
- the attenuation coefficient ⁇ s 1430 of the 1430 nm wavelength band light increases, but the attenuation coefficient ⁇ s 1310 of the 1310 nm wavelength band light hardly changes. This is because the former has light absorption characteristics by water, while the latter does not have the light absorption characteristics.
- the latter attenuation coefficient is substantially solely due to scattering attenuation.
- the scattering coefficient ratio ⁇ of the above equation (27) is known, the relationship between the absorption coefficient and the water content shown in FIG. 16B is based on the relationship between the attenuation coefficient and the water content shown in FIG. Can guide you. Therefore, it is possible to calculate the moisture content distribution of the skin to be measured by referring to the relationship of FIG. 16B using the absorption coefficient ⁇ a 1430 calculated as described above.
- FIG. 17 is a diagram showing a calculation process of the moisture content of the skin by OCT.
- FIG. 17A shows a tomographic image in the 1310 nm wavelength band
- FIG. 17B shows a tomographic image in the 1430 nm wavelength band.
- FIG. 17C shows a moisture content distribution calculated based on both tomographic images. Each figure is shown in a two-dimensional manner for convenience. Also, in FIG. 17C, the moisture content distribution display is omitted for the sake of convenience for portions with a low SN ratio.
- the tomographic image in the 1430 nm wavelength band has a greater attenuation in the depth direction than the tomographic image in the 1310 nm wavelength band. This difference in attenuation is considered to be due to light absorption of water molecules present in the 1430 nm wavelength band.
- FIG. 17 (C) shows that there is a moisture content distribution in the x direction. Moreover, it is considered that the moisture content is high due to the presence of sweat glands in the high moisture content region, and the moisture content is low due to the absence of sweat glands in the low moisture content region. Moreover, it can be seen that the water content of the stratum corneum is lower than that of the living epidermis cell layer, and the water content tends to increase as the depth increases.
- the control calculation unit 6 outputs information for skin diagnosis based on the skin dynamic characteristics, blood flow velocity, blood vessel network, and water content parameters obtained as described above. That is, the skin evaluation value is calculated and displayed on the display device 74.
- the evaluation value may be, for example, a level for determining whether the current skin condition is good or bad.
- the level is set to 5 levels, level A (very good, excellent elasticity, skin age teenager or less), level B (good, good elasticity, skin age 20s), level C (normal, no problem with skin) , Skin age 30s), level D (slight aging, sagging, skin age 40s), level E (aging, sagging, skin age 50s and over), etc. Can do.
- the evaluation value may be determined using all of these parameters, or the evaluation value may be determined from any combination. For example, the position and shape of the vascular network in the skin are calculated, and if the mechanical properties (elasticity, viscosity) at the position of the vascular network are lower than a predetermined reference value (standard value) (the strain rate is a predetermined threshold value) It may be evaluated that the deterioration (aging) of the skin is progressing. If the skin deteriorates due to the effects of ultraviolet irradiation or aging, the elasticity of the blood vessels is lost and the metabolism is thought to be reduced. This can be evaluated based on OCT tomographic measurements.
- the blood flow is interrupted when a load is applied to the skin, and the blood flow returns when the load is relaxed.
- the vascular network also changes quickly in response to the change in the mechanical feature value, but if the skin tissue is deteriorated, the change is delayed (following ability is reduced). It is conceivable that.
- This change in the mechanical feature value is related to the mechanical characteristics. Based on such knowledge, the evaluation value may be calculated based on the degree of change in the blood flow state relative to the change in the mechanical feature amount.
- 5 points for mechanical properties (elasticity and viscosity) (the higher the elasticity and viscoelasticity, the higher the point is evaluated)
- 5 points for blood flow velocity (the blood flow velocity is The higher the point is, the higher the point is)
- the water content is 5 points (the higher the water content, the higher the point is evaluated), etc.
- the total may be 15 points. 12-15 points: Level A, 9-11 points: Level B, 6-8 points: Level C, 5-7 points: Level D, 6 points or less: Level E, etc.
- An evaluation value for evaluating (deterioration) may be set.
- the evaluation value may be calculated only from the vascular network and mechanical characteristics.
- the evaluation value may be calculated based on the vascular network, mechanical characteristics, and water content.
- the evaluation value may be calculated based on the change in the mechanical feature amount (strain rate) and the change in the blood vessel network (blood vessel shape or the like). For example, a vascular network having an abnormal structure may be observed in atopic rashes, acne, spots, etc. In that case, it is conceivable that the vascular network is deformed more greatly than the normal case with respect to the load applied to the skin. An evaluation value may be set based on such knowledge.
- the evaluation value calculated as described above may be displayed on the screen as a skin tomographic distribution. Alternatively, an average value of the level or the like may be displayed as a comment as an evaluation value for the entire skin.
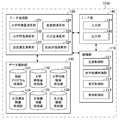
- FIG. 18 is a functional block diagram of the control calculation unit 6.
- the control calculation unit 6 includes a control unit 110, a data processing unit 120, a data storage unit 130, and an interface unit (I / F unit) 140. Each part cooperates on software and performs the process for skin diagnosis by OCT measurement.
- the control unit 110 includes a light source control unit 111, an optical mechanism control unit 112, a load control unit 113, and a display control unit 114.
- the control unit 110 reads out and executes a program for driving and controlling the optical unit 2 from the data storage unit 130, and controls each device and mechanism.
- the light source control unit 111 controls driving of the light source 10.
- the optical mechanism control unit 112 controls driving of the optical mechanisms 4 and 26.
- the load control unit 113 controls driving of the load device 5.
- the display control unit 114 performs display processing of the display device 74.
- the data processing unit 120 includes a mechanical feature amount calculation unit 121, a dynamic characteristic calculation unit 122, a blood flow velocity calculation unit 123, a vascular network calculation unit 124, a moisture amount calculation unit 125, and a skin evaluation calculation unit 126.
- the data processing unit 120 reads out and executes a program for calculating an evaluation value used for skin diagnosis from the data storage unit 130, and executes predetermined calculation processing.
- the mechanical feature quantity computing unit 121 computes the above-described skin mechanical feature quantity using a tomographic image obtained by OCT.
- the mechanical characteristic calculation unit 122 calculates the above-described mechanical characteristics of the skin using the calculated dynamic feature quantity.
- the blood flow velocity calculation unit 123 calculates the above-described blood flow velocity of the skin using the OCT signal.
- the vascular network calculation unit 124 calculates the above-described skin vascular network using the OCT signal.
- the water content calculation unit 125 calculates the above-described skin water content (water content) using the OCT signal.
- the skin evaluation calculation unit 126 calculates an evaluation value for skin diagnosis based on the dynamic characteristic amount, the dynamic characteristic, the blood flow velocity, the change in each parameter of the blood vessel network, and the water amount obtained as described above. To do.
- the data storage unit 130 includes a diagnostic program storage unit 131, a mechanical feature amount storage unit 132, a mechanical characteristic information storage unit 133, a blood flow rate information storage unit 134, a vascular network information storage unit 135, and a water content information storage unit 136.
- the diagnostic program storage unit 131 stores a control program for controlling each part of the optical unit 2 and a calculation program for evaluating the skin condition.
- the dynamic feature quantity storage unit 132 temporarily stores data related to the dynamic feature quantity calculated by the dynamic feature quantity calculation unit 121.
- the mechanical property information storage unit 133 temporarily stores data related to the mechanical property calculated by the mechanical property calculation unit 122.
- the blood flow rate information storage unit 134 temporarily stores data related to the blood flow rate calculated by the blood flow rate calculation unit 123.
- the vascular network information storage unit 135 temporarily stores data related to the vascular network calculated by the vascular network calculation unit 124.
- the water content information storage unit 136 temporarily stores data relating to the water content (moisture content) calculated by the water content calculation unit 125.
- the IF unit 140 includes an input unit 141 and an output unit 142.
- the input unit 141 receives detection data sent from the optical unit 2, an instruction command input by the user via the input device 70, and the like, and sends it to the control unit 110 and the data processing unit 120.
- the output unit 142 outputs the control command signal calculated by the control unit 110 toward the optical unit 2.
- the output unit 142 also outputs data for displaying the result calculated by the data processing unit 120 to the display device 74.
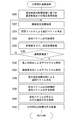
- FIG. 19 is a flowchart showing the flow of skin diagnosis processing executed by the control calculation unit 6.
- the control calculation unit 6 first drives the optical unit 2 (S10).
- the load control unit 113 drives the load device 5 to control the load applied to the skin S, while the light source control unit 111 controls the emission of light from the light source 10, and the optical mechanism control unit 112 controls the optical mechanisms 4 and 26.
- Control the operation of The control calculation unit 6 continuously acquires OCT optical interference signals in the process of applying a load to the skin S (S11). Subsequently, the tomographic distribution of each parameter described above with respect to the skin S is calculated by using the optical interference signal.
- the mechanical feature amount calculation unit 121 calculates the deformation vector of the skin tissue
- the mechanical property calculation unit 122 calculates the tomographic distribution of the mechanical properties (S12).
- the blood flow velocity calculation unit 123 calculates the tomographic distribution of the blood flow velocity (S13)
- the vascular network calculation unit 124 calculates the vascular network (S14)
- the water content calculation unit 125 calculates the tomographic distribution of the moisture content ( S15).
- the skin evaluation calculation unit 126 associates the calculation results of these parameters with the tomographic position of the skin S, and calculates the evaluation value of the skin state (S16).
- the calculation of the evaluation value is as described above.
- the display control unit 114 displays the evaluation value on the screen.
- FIG. 20 is a flowchart showing in detail the mechanical characteristic calculation process of S12 in FIG.
- the mechanical feature amount calculation unit 121 executes processing by the recursive cross-correlation method based on the tomographic images before and after deformation acquired by OCT.
- cross-correlation processing is executed at the minimum resolution (maximum size inspection region) to obtain a correlation coefficient distribution (S20).
- the product of adjacent correlation coefficient distributions is calculated by the adjacent cross correlation multiplication method (S22).
- error vectors are removed by a spatial filter such as a standard deviation filter (S24), and interpolation of the removal vectors is performed by a least square method or the like (S26).
- the cross correlation process is continued by increasing the resolution by reducing the inspection area (S28). That is, the cross-correlation process is executed based on the reference vector at the low resolution. If the resolution at this time is not the predetermined maximum resolution (N in S30), the process returns to S22.
- the dynamic feature quantity calculation unit 121 repeats the processes of S22 to S28, and when the cross-correlation process at the highest resolution is completed (Y in S30), executes the sub-pixel analysis. That is, based on the distribution of the deformation vector at the highest resolution (minimum size inspection area), the subpixel movement amount is calculated by the windward gradient method (S32). Based on the sub-pixel movement amount calculated at this time, the sub-pixel deformation amount by the image deformation method is calculated (S34). Subsequently, the error vector is removed by filtering using the maximum cross-correlation value (S36), and interpolation of the removal vector is executed by the least square method or the like (S38).
- the mechanical property calculation unit 122 calculates a tomographic distribution of mechanical properties (elasticity and viscoelasticity) based on the strain rate distribution (S42).
- FIG. 21 is a flowchart showing in detail the blood flow velocity calculation process of S13 in FIG.
- the blood flow velocity calculation unit 123 acquires an OCT interference signal (S50), and executes a Fourier transform (FFT) (S52). Subsequently, the band-pass filtering process is executed with reference to the carrier frequency to improve the signal SN ratio (S54), and then the Hilbert transform is executed (S56). Using the analysis signal obtained by the Hilbert transform, adjacent autocorrelation processing is performed to obtain a phase difference (S58), and a Doppler frequency is obtained (S60). The obtained Doppler frequency is spatially averaged with a pixel size (S62), and a tomographic distribution of blood flow velocity is calculated (S64).
- FIG. 22 is a flowchart showing in detail the blood vessel network calculation process of S14 in FIG.
- the blood vessel network calculation unit 124 acquires an optical interference signal at the same position by OCT (S70), and executes autocorrelation processing (S72). Subsequently, noise removal processing such as a spatial frequency filter is performed (S74), and a tomographic distribution of the vascular network is calculated (S76).
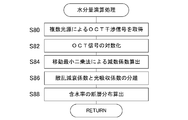
- FIG. 23 is a flowchart showing in detail the water content calculation process of S15 in FIG.
- the moisture amount calculation unit 125 acquires OCT interference signals from the plurality of light sources 32 and 34 (S80).
- the light source 32 is a 1310 nm wavelength band light source having no light absorption characteristics
- the light source 34 is a 1430 nm wavelength band light source having light absorption characteristics.
- a natural logarithm is taken for the OCT signal (S82), and spatial differentiation is performed.
- the attenuation coefficient is calculated by the moving least square method (S84), the absorption coefficient is separated (S86), and the fault distribution of the moisture content is calculated (S88).
- a suction type load mechanism using a vacuum pump is exemplified as a load device for applying predetermined deformation energy (load) to the skin.
- a load mechanism that applies stress by contact with a piezoelectric element or the like may be employed.
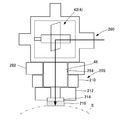
- FIG. 24 is a diagram schematically showing a configuration of a load device according to a modification.
- the load device 205 is configured as a type that applies a pressing load to the measurement target portion of the skin S.
- a probe 280 for skin diagnosis is provided at the tip of the optical mechanism 4.
- the upper half of the probe 280 functions as the optical mechanism 4, and the lower half functions as the load device 205.
- An internal passage 284 is formed so as to penetrate the body 282 of the probe 280 in the axial direction, and the objective lens 48 is arranged on the axial line.
- the load device 205 includes a piezoelectric element 210 (piezo element) and an indenter 212 assembled to the body 282.
- Both the piezoelectric element 210 and the indenter 212 have a cylindrical shape and are arranged coaxially with respect to the body 282.
- a parallel flat substrate 214 is disposed at the lower end opening of the indenter 212, and an elastomer 216 is disposed on the lower surface thereof.
- the parallel plane substrate 214 is made of a synthetic quartz material and has excellent heat resistance and impact resistance.
- the elastomer 216 is a light-transmitting elastic member having a known material constant, and can transmit a pressing load from the piezoelectric element 210 to the skin S.
- the elastomer 216 is provided with a piezoelectric sensor (functioning as a “load detection unit”), and a load applied from the piezoelectric element 210 can be detected by deformation thereof. That is, a load detected by deformation of the elastomer 216 can be detected as a load (pressure) applied to the surface of the skin S. As indicated by the arrows in the figure, the object light from the optical unit 2 passes through the objective lens 48, the parallel plane substrate 214 and the elastomer 216 and is irradiated to the skin S, and the reflected light passes through the reverse path. Return to the optical unit 2.
- strain rate distribution calculated in S40 of FIG. Similarly, the blood flow velocity distribution calculated in S64 of FIG.
- a tomographic image by OCT is acquired in three dimensions, but it may be acquired in two dimensions. That is, it goes without saying that a deformation vector or a deformation speed vector as a displacement-related vector may be processed as two-dimensional data.
- an amplitude value of strain rate and a time delay (phase delay) of strain rate may be adopted as the “mechanical feature amount”. That is, taking the dynamic viscoelastic method as an example, the strain rate fluctuates between a positive value and a negative value in the process of repeatedly applying and relaxing stress. The strain rate also varies so as to follow the variation of the load. In this regard, the magnitude (amplitude value) of the strain rate fluctuation and the followability (responsiveness) of the strain rate fluctuation to the load fluctuation tend to change corresponding to the skin condition. Therefore, the fault distribution may be calculated with respect to the amplitude value of the strain rate and the time delay (phase delay).
- the median value of the periodic fluctuation of the strain rate may be adopted as the “mechanical feature value”.
- the strain rate fluctuates between a positive value and a negative value in the process of repeatedly applying and relaxing stress.
- the center of the fluctuation of the strain rate tends to deviate slightly from zero due to the balance between the viscous force and the elastic force.
- the amount of deviation tends to change corresponding to the skin condition. Therefore, the fault distribution may be calculated for the amount of deviation from zero of the variation center (median value) of the strain rate.
- a suction type load mechanism using a vacuum pump is exemplified as a load device for applying predetermined deformation energy (load) to the skin.
- a load device that applies a load (excitation force) to the skin in a non-contact manner using ultrasonic waves (sound pressure), photoacoustic waves, electromagnetic waves, or the like may be employed.
- control unit 110 and the data processing unit 120 shown in FIG. 18 may be provided in separate devices (such as a personal computer).
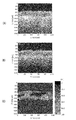
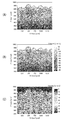
- FIG. 25 and FIG. 26 are diagrams showing OCT tomographic images of the forearm internal flexion side of a person.
- FIG. 25 shows a tomographic measurement result in a normal state
- FIG. 26 shows a tomographic measurement result when the tourniquet is used.
- (A) of each figure shows an OCT tomographic image.
- (B) is a superimposition display of the maximum value of blood flow velocity at a predetermined time on (A)
- (C) is a time average of blood flow velocity.
- this invention is not limited to the said Example and modification, A component can be deform
- Various inventions may be formed by appropriately combining a plurality of constituent elements disclosed in the above-described embodiments and modifications. Moreover, you may delete some components from all the components shown by the said Example and modification.
Landscapes
- Health & Medical Sciences (AREA)
- Life Sciences & Earth Sciences (AREA)
- Surgery (AREA)
- Molecular Biology (AREA)
- General Health & Medical Sciences (AREA)
- Veterinary Medicine (AREA)
- Pathology (AREA)
- Engineering & Computer Science (AREA)
- Biomedical Technology (AREA)
- Heart & Thoracic Surgery (AREA)
- Medical Informatics (AREA)
- Public Health (AREA)
- Animal Behavior & Ethology (AREA)
- Physics & Mathematics (AREA)
- Biophysics (AREA)
- Hematology (AREA)
- Cardiology (AREA)
- Physiology (AREA)
- Dermatology (AREA)
- Nuclear Medicine, Radiotherapy & Molecular Imaging (AREA)
- Radiology & Medical Imaging (AREA)
- Oral & Maxillofacial Surgery (AREA)
- Dentistry (AREA)
- Vascular Medicine (AREA)
- Investigating Or Analysing Materials By Optical Means (AREA)
- Measuring And Recording Apparatus For Diagnosis (AREA)
- Measuring Pulse, Heart Rate, Blood Pressure Or Blood Flow (AREA)
Abstract
Description
[実施例]
図1は、実施例に係る皮膚診断装置の構成を概略的に表す図である。本実施例の皮膚診断装置は、皮膚組織をマイクロスケールにて断層計測し、その皮膚状態の評価(肌評価など)を可能とするものである。この断層計測にOCTを利用する。
光源10は、皮膚の水分量を検出可能となるよう、中心波長が異なる2つの光源32,34を有する。これらの光源は、スーパールミネッセントダイオード(Super Luminessent Diode:以下「SLD」と表記する)からなる広帯域光源である。光源32は1310nm波長帯光源であり、光源34は1430nm波長帯光源である。制御演算部6は、光源32,34の双方を同時並行的に作動させることが可能であるが、計測対象とする物理量に応じて一方のみを作動させることもできる。
負荷装置5は、皮膚Sの計測対象部位に吸引荷重を付与するタイプとして構成される。光学機構4の先端には皮膚診断用のプローブ80が設けられており、そのプローブ80に負荷装置5が接続されている。プローブ80の上半部が光学機構4として機能し、下半部が負荷装置5として機能する。プローブ80は、金属製のボディ82を有する。ボディ82を軸線方向に貫通するように内部通路84が形成されている。
本実施例では、皮膚診断に先立って、OCTにより皮膚の力学特性、血流速度、血管網、水分量の各パラメータの断層分布をマイクロスケールで演算する。そして、それらのパラメータの演算結果を統合することにより、皮膚状態を評価するための評価値を算出する。以下、各パラメータの算出原理について説明する。
皮膚の力学特性の算出に先立って、皮膚の力学特徴量を演算する。その力学特徴量の算出のために、皮膚の変形に伴うひずみの断層分布を演算する。上述のように、OCTにおいて、オブジェクトアーム12を経た物体光(皮膚からの反射光)と、リファレンスアーム14を経た参照光とが合波され、光検出装置16により光干渉信号として検出される。制御演算部6は、この光干渉信号を干渉光強度に基づく計測対象(皮膚S)の断層画像として取得することができる。この断層分布は二次元で演算することもできるが、ここでは三次元での演算について説明する。


図3は、FFT相互相関法による処理手順を概略的に示す図である。
FFT相互相関法とは、局所的なスペックルパターンの類似度を相関値Ri,j,kを用いて評価する方法であり、相関値算出にフーリエ変換を用いる。N×N×N(pixel)の検査領域を第1画像(Image1)に設定する一方、同じ大きさの探査領域を第2画像(Image2)の同じ位置に設定し、これら2つの領域間で相関計算を行う。入射光軸垂直方向及び光軸方向をそれぞれX,Y,Zとする。第1画像の検査領域および第2画像の探査領域の輝度値パターンをそれぞれf(Xi,Yj,Zk),g(Xi,Yj,Zk)とし、そのフーリエ変換をF{f(Xi,Yj,Zk)},F{g(Xi,Yj,Zk)}と表す。このとき、下記式(3)のクロススペクトルSi,j,k(ξ,η,ζ)を求め、それに逆フーリエ変換を施すことにより、下記式(4)のように相互相関関数Ri,j,k(ΔX,ΔY,ΔZ)が得られる。


図4は、再帰的相互相関法による処理手順を概略的に示す図である。なお、簡単のため、同図は便宜上、二次元態様で示されている。図4(A)~(C)は、再帰的相互相関法による処理過程を示している。各図にはOCTにより撮影される前後の断層画像が示されている。左側には先の断層画像(Image1)が示され、右側には後の断層画像(Image2)が示されている。
本実施例では、スペックルノイズの影響を受けたランダム性の強い相関値分布から正確な最大相関値を決定するために隣接相互相関乗法を導入している。この隣接相互相関乗法では、下記式(5)により、検査領域S1における相関値分布Ri,j,k(ΔX,ΔY,ΔZ)と、その検査領域S1にオーバーラップする隣接検査領域に対する相関値分布との乗算を行う。このようにして得た新たな相関値分布R'i,j,k(ΔX,ΔY,ΔZ)を用いて最大相関値を検索する。

図5は、サブピクセル解析による処理手順を概略的に示す図である。なお、簡単のため、同図は便宜上、二次元態様で示されている。図5(A)~(C)は、サブピクセル解析による処理過程を示している。各図にはOCTにより連続的に撮影される前後の断層画像が示されている。左側には先の断層画像(Image1)が示され、右側には後の断層画像(Image2)が示されている。


上述した風上勾配法までは検査領域S1の形状は変更せず、矩形体を保ったまま変形ベクトルの算出を行っている。しかし、現実には計測対象の変形に合わせて検査領域S1も変形していると考えられるため、検査領域S1の微小変形を考慮したアルゴリズムを導入し、変形ベクトル算出を高精度にて算出する必要がある。このため、本実施例ではサブピクセル精度での変形ベクトルの算出に画像変形法を導入している。すなわち、材料の変形前の検査領域S1と変形後の伸縮及びせん断変形を考慮した検査領域S1とで相互相関を実施し、相関値ベースの反復計算によってサブピクセル変形量を決定している。なお、検査領域S1の伸縮及びせん断変形は線形で近似している。



OCTのビームは、画像上面から照射されている。図6(A)において、上部の高輝度線は皮膚表面を表し、内部の高輝度線は角層と表皮生細胞層の境界を表している。図6(B)は、OCT断層画像から皮膚表面と、角層と表皮生細胞層との境界とを抽出したものである。皮膚表面に凹凸が表れている。表面の蛇行と、角層と表皮生細胞層との境界の蛇行とが同期しており、公知の病理報告と一致している。


図9に示した変形速度ベクトルを空間微分することにより、ひずみ速度テンソルを得ることができる。そのひずみ速度分布を上記式(12)および(13)に適用することにより、図10に示すクリープ回復時間の断層分布τ(x,y,z)を算出することができる。なお、同図は便宜上、二次元態様で示されている。この断層分布から、皮膚の表面付近ではクリープ回復時間が短くて弾性的な挙動を示しているのに対し、皮膚の深層では粘性的な挙動を示す領域が存在することが確認できる。以上のように、OCT断層計測により、皮膚の力学特性を把握することができる。
OCTによりドップラー変調信号を検出することにより、皮膚組織の血流速度分布を算出することができる。上述のように、皮膚診断装置1ではリファレンスアーム14にEOPM40を設置しており、高周波キャリア信号を発生させることができる。EOPM40にて生じた変調角周波数ωmを考慮し、参照光の電場E'r(t)は下記式(14)にて表される。





本実施例では上述のように、RSODを用いた奥行方向(z軸方向)走査手法を採用する。その際の流速検出能の劣化を防止するために、ヒルベルト変換および隣接自己相関法を適用する。すなわち、空間的に隣接する干渉信号にヒルベルト変換を適用して得られる解析信号(複素信号)Γ(t)に対し、隣接自己相関法を適用する。それにより、任意座標における位相差Δφを求め、血流速度によるドップラー角周波数シフト量ωdを検出する。

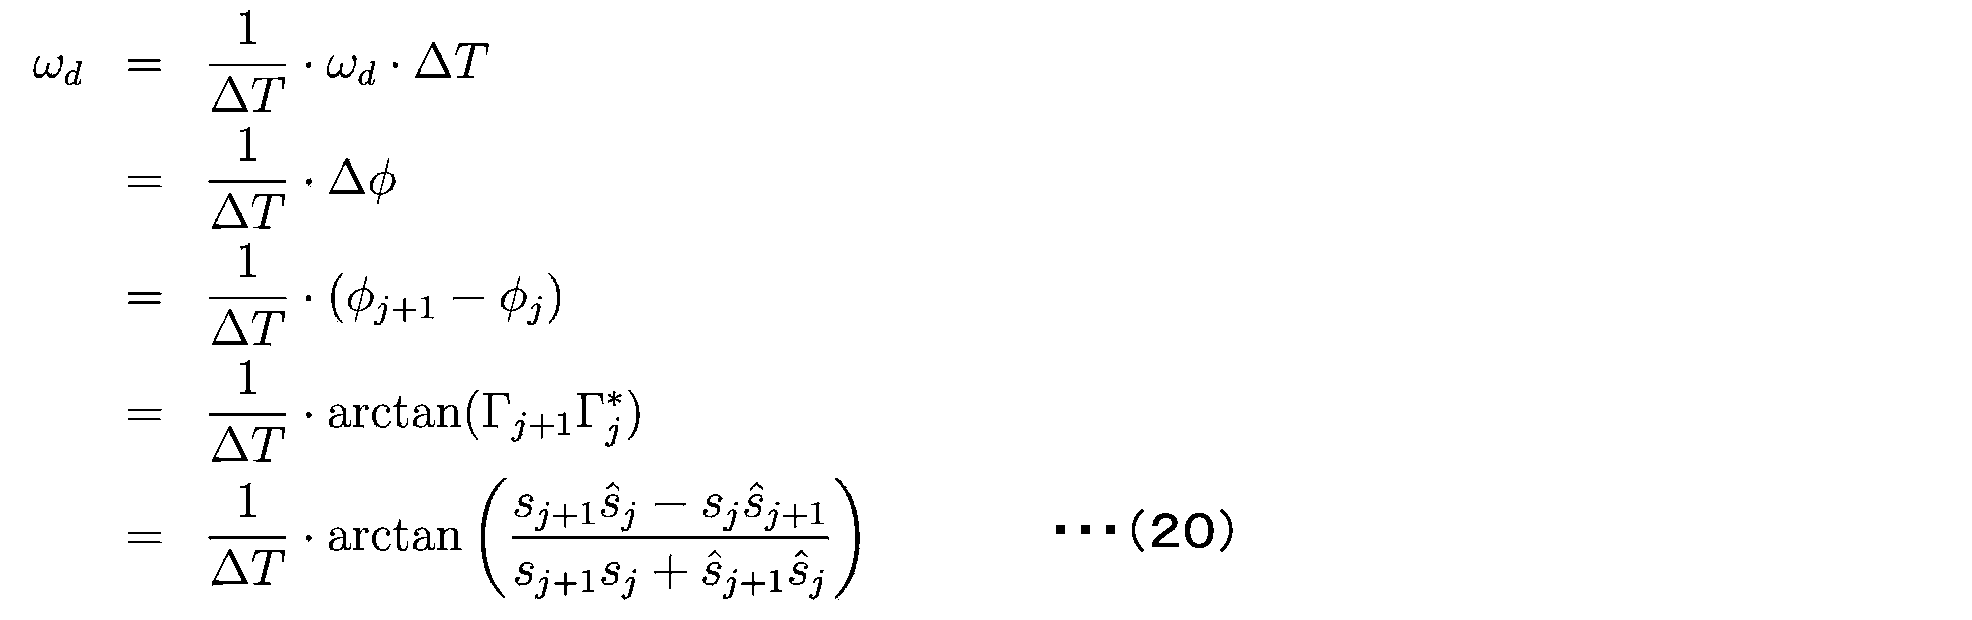

図11は、血流速度模擬試験に用いられた装置の一部を表す図である。図11(A)は斜視図、図11(B)は平面図、図11(C)は正面図(Y方向にみた図)である。図12は、OCTにより計測された流速の断層分布を示す図である。図12(A)~(D)は、後述する赤血球浮遊液の設定平均流速Uがそれぞれ異なる場合の結果を示す。
(3)皮膚の血管網
OCTにより連続的に撮影される断層画像の自己相関を演算することにより、血管網のネットワーク(血管形状およびその変化)を算出することができる。図13は、OCTによる血管網の演算方法を表す模式図である。同図の左側は時間tに取得される断層画像を示し、右側は時間t+1に取得される断層画像を示す。便宜上、同図は二次元態様で示されている。

光吸収特性が異なる2つの波長帯の光源を用いてOCT断層計測を行うことにより、皮膚組織の含水率分布を算出することができる。
図15は、水による光吸収特性を表す図である。本図は、光の波長と強度との関係、および光の波長と水の光吸収係数との関係を示す。本図から、高含水率を有する組織において、1430nm波長帯光は光吸収作用により後方散乱光強度が指数関数的に減衰するが、1310nm波長帯光の後方散乱光強度には光吸収作用の影響が現れないことが分かる。本実施例では、この2つの波長帯の光吸収特性の相異を利用して含水率分布の検出を行う。すなわち、本実施例では上述のように、水分による光吸収特性を有する1430nm波長帯光源と、水分による光吸収特性を有しない1310nm波長帯光源とが用いられる。




制御演算部6は、制御部110、データ処理部120、データ格納部130およびインタフェース部(I/F部)140を備える。各部がソフトウェア上で連携し、OCT計測による皮膚診断のための処理を実行する。
図19は、制御演算部6により実行される皮膚診断処理の流れを示すフローチャートである。制御演算部6は、まず、光学ユニット2を駆動する(S10)。負荷制御部113が負荷装置5を駆動して皮膚Sに付与する荷重を制御する一方、光源制御部111が光源10からの光の出射を制御し、光学機構制御部112が光学機構4,26の作動を制御する。制御演算部6は、皮膚Sに荷重が負荷される過程でOCTの光干渉信号を連続的に取得する(S11)。続いて、その光干渉信号を用いることにより、皮膚Sに関して上述の各パラメータの断層分布を演算する。
負荷装置205は、皮膚Sの計測対象部位に押圧荷重を付与するタイプとして構成される。光学機構4の先端には皮膚診断用のプローブ280が設けられる。プローブ280の上半部が光学機構4として機能し、下半部が負荷装置205として機能する。プローブ280のボディ282を軸線方向に貫通するように内部通路284が形成され、その軸線上に対物レンズ48が配置されている。負荷装置205は、ボディ282に組み付けられた圧電素子210(ピエゾ素子)および圧子212を備える。圧電素子210と圧子212は、いずれも円筒状をなし、ボディ282に対して同軸状に配置される。圧子212の下端開口部に平行平面基板214が配設され、さらにその下面にエラストマー216が配設されている。平行平面基板214は、合成石英材からなり、耐熱性および耐衝撃性に優れている。エラストマー216は、材料定数が既知の光透過性の弾性部材であり、圧電素子210からの押圧荷重を皮膚Sに伝達可能である。
Claims (10)
- 皮膚を診断するための皮膚診断装置であって、
光コヒーレンストモグラフィーを用いる光学系を含む光学ユニットと、
前記光学ユニットからの光を皮膚に導いて走査させるための光学機構と、
皮膚に対して所定の変形エネルギーを付与するための負荷装置と、
前記負荷装置および前記光学機構の駆動を制御し、それらの駆動に応じて前記光学ユニットから出力された光干渉信号を処理することにより、皮膚に関して予め定める状態値の断層分布を演算し、その断層分布に基づいて皮膚の評価値を演算する制御演算部と、
前記皮膚の評価値を表示する表示装置と、
を備え、
前記制御演算部は、前記状態値として皮膚の力学特性および血流状態をそれぞれ演算し、その力学特性と血流状態とを前記皮膚の断層位置にて対応づけることにより前記評価値を演算することを特徴とする皮膚診断装置。 - 前記制御演算部は、前記力学特性として前記変形エネルギーの付与による力学特徴量の変化を取得し、その力学特徴量の変化に対する前記血流状態の変化の度合いに基づいて前記評価値を演算することを特徴とする請求項1に記載の皮膚診断装置。
- 前記制御演算部は、前記血流状態の変化の度合いとして、血管網の変形度合いを演算することを特徴とする請求項2に記載の皮膚診断装置。
- 前記制御演算部は、前記血流状態の変化の度合いとして、血流速度の変化の度合いを演算することを特徴とする請求項2又は3に記載の皮膚診断装置。
- 前記制御演算部は、前記光干渉信号を処理することにより取得した断層画像データに基づき、皮膚の断層位置に対応した変位関連ベクトルを前記力学特徴量として演算し、その変位関連ベクトルの変化に対する前記血流状態の変化の度合いに基づいて前記評価値を演算することを特徴とする請求項2~4のいずれかに記載の皮膚診断装置。
- 前記制御演算部は、さらに前記変形エネルギーの付与による皮膚の含水率の変化を、その皮膚の断層位置に対応づけて演算し、前記力学特徴量の変化に対する前記血流状態および含水率の変化の度合いに基づいて前記評価値を演算することを特徴とする請求項2~5のいずれかに記載の皮膚診断装置。
- 皮膚を診断するための皮膚診断装置であって、
光コヒーレンストモグラフィーを用いる光学系を含む光学ユニットと、
前記光学ユニットからの光を皮膚に導いて走査させるための光学機構と、
皮膚に対して所定の押圧荷重を付与するための負荷装置と、
前記押圧荷重を検出する荷重検出部と、
前記負荷装置および前記光学機構の駆動を制御し、それらの駆動に応じて前記光学ユニットから出力された光干渉信号を処理することにより、皮膚の変形に伴う力学特徴量の変化の断層分布を演算し、その断層分布に基づいて皮膚の評価値を演算する制御演算部と、
前記皮膚の評価値を表示する表示装置と、
を備え、
前記負荷装置は、前記押圧荷重を光透過性の弾性部材を介して皮膚に付与し、
前記光学機構は、前記弾性部材を透過させるようにして光の照射および受光をし、
前記荷重検出部は、前記弾性部材に負荷される荷重を、皮膚に付与される押圧荷重として検出し、
前記制御演算部は、前記押圧荷重の付与による皮膚の力学特徴量の変化を、その皮膚の断層位置に対応づけて演算し、前記押圧荷重の変化に対する前記力学特徴量の変化の度合いに基づいて前記評価値を演算することを特徴とする皮膚診断装置。 - 光コヒーレンストモグラフィーにより皮膚の断層画像を取得する工程と、
前記断層画像に基づき、皮膚の力学特性および血流状態をそれぞれ演算する工程と、
前記力学特性と前記血流状態とを前記皮膚の断層位置にて対応づけることにより前記皮膚の状態を評価するための情報を取得し、その情報を出力する工程と、
を備えることを特徴とする皮膚状態出力方法。 - 光コヒーレンストモグラフィーによる皮膚の断層画像を取得する機能と、
前記断層画像に基づき、皮膚の力学特性および血流状態をそれぞれ演算する機能と、
前記力学特性と前記血流状態とを前記皮膚の断層位置にて対応づけることにより前記皮膚を診断するための情報を取得し、その情報を出力する機能と、
をコンピュータに実現させるためのプログラム。 - 光コヒーレンストモグラフィーによる皮膚の断層画像を取得する機能と、
前記断層画像に基づき、皮膚の力学特性および血流状態をそれぞれ演算する機能と、
前記力学特性と前記血流状態とを前記皮膚の断層位置にて対応づけることにより前記皮膚を診断するための情報を取得し、その情報を出力する機能と、
をコンピュータに実現させるためのプログラムを記録したコンピュータ読み取り可能な記録媒体。
Priority Applications (4)
| Application Number | Priority Date | Filing Date | Title |
|---|---|---|---|
| KR1020187025090A KR102225808B1 (ko) | 2016-06-20 | 2017-06-15 | 피부 진단 장치, 피부 상태 출력 방법, 프로그램, 및 기록 매체 |
| CN201780037982.3A CN109310337B (zh) | 2016-06-20 | 2017-06-15 | 皮肤诊断装置、皮肤状态输出方法、以及记录介质 |
| EP17815266.6A EP3473166A4 (en) | 2016-06-20 | 2017-06-15 | DEVICE FOR SKIN DIAGNOSIS, METHOD FOR EXPOSING A SKIN DISEASE, PROGRAM AND RECORDING MEDIUM |
| US16/224,261 US12029578B2 (en) | 2016-06-20 | 2018-12-18 | Skin diagnosing device, skin condition outputting method, program, and recording medium |
Applications Claiming Priority (4)
| Application Number | Priority Date | Filing Date | Title |
|---|---|---|---|
| JP2016121492 | 2016-06-20 | ||
| JP2016-121492 | 2016-06-20 | ||
| JP2017-098372 | 2017-05-17 | ||
| JP2017098372A JP6245590B1 (ja) | 2016-06-20 | 2017-05-17 | 皮膚診断装置、皮膚状態出力方法、プログラムおよび記録媒体 |
Related Child Applications (1)
| Application Number | Title | Priority Date | Filing Date |
|---|---|---|---|
| US16/224,261 Continuation US12029578B2 (en) | 2016-06-20 | 2018-12-18 | Skin diagnosing device, skin condition outputting method, program, and recording medium |
Publications (1)
| Publication Number | Publication Date |
|---|---|
| WO2017221798A1 true WO2017221798A1 (ja) | 2017-12-28 |
Family
ID=60659077
Family Applications (1)
| Application Number | Title | Priority Date | Filing Date |
|---|---|---|---|
| PCT/JP2017/022064 Ceased WO2017221798A1 (ja) | 2016-06-20 | 2017-06-15 | 皮膚診断装置、皮膚状態出力方法、プログラムおよび記録媒体 |
Country Status (7)
| Country | Link |
|---|---|
| US (1) | US12029578B2 (ja) |
| EP (1) | EP3473166A4 (ja) |
| JP (1) | JP6245590B1 (ja) |
| KR (1) | KR102225808B1 (ja) |
| CN (1) | CN109310337B (ja) |
| TW (1) | TWI735596B (ja) |
| WO (1) | WO2017221798A1 (ja) |
Cited By (2)
| Publication number | Priority date | Publication date | Assignee | Title |
|---|---|---|---|---|
| CN108309244A (zh) * | 2018-02-13 | 2018-07-24 | 天津海仁医疗技术有限公司 | 一种新型压力传感皮肤微血管扫描装置和系统及工作方法 |
| JP2020131026A (ja) * | 2019-02-12 | 2020-08-31 | ポーラ化成工業株式会社 | 肌解析方法、肌解析システム及び肌解析プログラム |
Families Citing this family (26)
| Publication number | Priority date | Publication date | Assignee | Title |
|---|---|---|---|---|
| CN107563438B (zh) * | 2017-08-31 | 2019-08-30 | 西南交通大学 | 一种快速鲁棒的多模态遥感影像匹配方法和系统 |
| JP6968324B2 (ja) * | 2017-09-29 | 2021-11-17 | 株式会社 資生堂 | 皮膚の血管網を可視化する装置、方法およびプログラム |
| JP6967984B2 (ja) * | 2018-01-26 | 2021-11-17 | 花王株式会社 | 肌評価方法 |
| JP7312957B2 (ja) * | 2018-06-21 | 2023-07-24 | パナソニックIpマネジメント株式会社 | 肌評価装置、肌評価システム、肌評価方法、および肌評価のためのプログラムを格納したコンピュータ読み取り可能な記録媒体 |
| JP7174993B2 (ja) * | 2018-08-31 | 2022-11-18 | 学校法人 名城大学 | マイクロ断層可視化装置および方法 |
| EP3930564B1 (en) * | 2019-02-27 | 2023-07-05 | Naked Labs Austria GmbH | Method for operating a 3d body scanner |
| US11534105B2 (en) | 2019-03-20 | 2022-12-27 | Keio University | Estimation method, estimation model generation method, program, and estimation device |
| CN110309699B (zh) * | 2019-03-22 | 2021-06-18 | 浙江工业大学 | 一种基于oct的皮下汗孔图自动提取方法 |
| JP7256876B2 (ja) | 2019-07-23 | 2023-04-12 | オリンパス株式会社 | 物性値計測方法、及び物性値算出装置 |
| WO2021014597A1 (ja) * | 2019-07-23 | 2021-01-28 | オリンパス株式会社 | 物性値算出装置、及び物性値計測方法 |
| TWI754858B (zh) * | 2019-11-21 | 2022-02-11 | 國立中央大學 | 光學斷層造影系統及造影方法 |
| CN115039011A (zh) * | 2020-01-31 | 2022-09-09 | 安盟生技股份有限公司 | 具有光学扩展量压缩模块的照明系统及其方法 |
| TWI799740B (zh) * | 2020-03-05 | 2023-04-21 | 緯創資通股份有限公司 | 光學感測裝置 |
| TWI773972B (zh) * | 2020-03-05 | 2022-08-11 | 緯創資通股份有限公司 | 光學感測裝置 |
| US11484245B2 (en) * | 2020-03-05 | 2022-11-01 | International Business Machines Corporation | Automatic association between physical and visual skin properties |
| US11659998B2 (en) | 2020-03-05 | 2023-05-30 | International Business Machines Corporation | Automatic measurement using structured lights |
| CN111839681A (zh) * | 2020-07-08 | 2020-10-30 | 胡飞青 | 利用内容解析的压迫区域识别平台及方法 |
| CN113191265B (zh) * | 2021-04-30 | 2024-08-02 | 苏州科医世凯半导体技术有限责任公司 | 一种皮肤组织光照射方法、装置和存储介质 |
| CN114209278B (zh) * | 2021-12-14 | 2023-08-25 | 复旦大学 | 一种基于光学相干层析成像的深度学习皮肤病诊断系统 |
| CN114569065B (zh) * | 2021-12-31 | 2025-01-24 | 复旦大学 | 一种基于光学相干层析成像的皮肤状态检测系统及其方法 |
| CN114322833B (zh) * | 2021-12-31 | 2022-09-06 | 中国科学院长春光学精密机械与物理研究所 | 基于伪Wigner-Ville分布的白光扫描干涉三维重建方法 |
| KR102776104B1 (ko) * | 2022-03-17 | 2025-03-07 | 경북대학교 산학협력단 | 마이컬슨 간섭계 기반 다채널 광 간섭 단층 촬영 장치 |
| CN114812427B (zh) * | 2022-04-22 | 2023-05-02 | 重庆大学 | 一种具有纳米级分辨率的超快成像系统 |
| WO2024135329A1 (ja) * | 2022-12-20 | 2024-06-27 | 株式会社資生堂 | 肌診断システム、肌診断装置、プログラム、および方法 |
| CN116807397B (zh) * | 2023-03-06 | 2026-04-21 | 南昌大学第一附属医院 | 一种用于皮肤弹性度与含水量测量的光学装置及方法 |
| WO2025154424A1 (ja) * | 2024-01-17 | 2025-07-24 | ソニーグループ株式会社 | 情報処理装置、情報処理方法、及びプログラム |
Citations (2)
| Publication number | Priority date | Publication date | Assignee | Title |
|---|---|---|---|---|
| JP2007500529A (ja) * | 2003-07-31 | 2007-01-18 | コーニンクレッカ フィリップス エレクトロニクス エヌ ヴィ | 生体管構造を流れる流体の性状を決定する開口数可変の方法および装置 |
| JP2016011935A (ja) * | 2014-06-30 | 2016-01-21 | 株式会社トプコン | 皮膚性状評価装置 |
Family Cites Families (15)
| Publication number | Priority date | Publication date | Assignee | Title |
|---|---|---|---|---|
| NO180024C (no) * | 1994-10-11 | 1997-01-29 | Oerjan G Martinsen | Måling av fuktighet i hud |
| EP1007901B1 (en) * | 1997-06-02 | 2009-04-29 | Joseph A. Izatt | Doppler flow imaging using optical coherence tomography |
| US7039446B2 (en) * | 2001-01-26 | 2006-05-02 | Sensys Medical, Inc. | Indirect measurement of tissue analytes through tissue properties |
| US7359062B2 (en) * | 2003-12-09 | 2008-04-15 | The Regents Of The University Of California | High speed spectral domain functional optical coherence tomography and optical doppler tomography for in vivo blood flow dynamics and tissue structure |
| JP2006284249A (ja) * | 2005-03-31 | 2006-10-19 | Olympus Corp | 樹脂接合体変形シミュレーション方法、装置、プログラムおよびこれらを用いた樹脂接合体実装システム |
| RU2387365C2 (ru) * | 2007-08-15 | 2010-04-27 | Государственное образовательное учреждение высшего профессионального образования "Нижегородская государственная медицинская академия Федерального Агентства по здравоохранению и социальному развитию" (ГОУ ВПО НижГМА Росздрава) | Способ исследования состояния кожи методом оптической когерентной томографии |
| JP5252985B2 (ja) | 2008-05-02 | 2013-07-31 | 花王株式会社 | 皮膚内部の弾性計測方法 |
| JP6058902B2 (ja) * | 2012-03-13 | 2017-01-11 | 株式会社 資生堂 | 肌状態解析方法、肌状態解析装置、及び、肌状態解析システム、並びに、該肌状態解析方法を実行させるためのプログラム、及び、該プログラムを記録した記録媒体 |
| JP6059600B2 (ja) * | 2012-06-18 | 2017-01-11 | 富士フイルム株式会社 | 肌評価装置の作動方法および肌評価装置 |
| WO2014048573A1 (en) * | 2012-09-26 | 2014-04-03 | Agfa Healthcare N.V. | Method and system for optical coherence tomography |
| US9655521B2 (en) * | 2013-01-31 | 2017-05-23 | Physical Sciences, Inc. | Combined reflectance confocal microscopy-optical coherence tomography system for imaging of biological tissue |
| US10932670B2 (en) * | 2013-03-15 | 2021-03-02 | Avinger, Inc. | Optical pressure sensor assembly |
| JP6251489B2 (ja) * | 2013-03-28 | 2017-12-20 | 株式会社 資生堂 | 画像解析装置、画像解析方法、及び画像解析プログラム |
| KR20160001890A (ko) * | 2014-06-27 | 2016-01-07 | 연세대학교 원주산학협력단 | 항 노화를 위한 초음파와 oct를 결합한 피부 진단 및 치료 시스템 |
| US10018461B2 (en) * | 2015-01-04 | 2018-07-10 | Joshua Noel Hogan | Reference signal filter for interferometric system |
-
2017
- 2017-05-17 JP JP2017098372A patent/JP6245590B1/ja active Active
- 2017-06-13 TW TW106119630A patent/TWI735596B/zh active
- 2017-06-15 KR KR1020187025090A patent/KR102225808B1/ko active Active
- 2017-06-15 WO PCT/JP2017/022064 patent/WO2017221798A1/ja not_active Ceased
- 2017-06-15 EP EP17815266.6A patent/EP3473166A4/en not_active Withdrawn
- 2017-06-15 CN CN201780037982.3A patent/CN109310337B/zh active Active
-
2018
- 2018-12-18 US US16/224,261 patent/US12029578B2/en active Active
Patent Citations (2)
| Publication number | Priority date | Publication date | Assignee | Title |
|---|---|---|---|---|
| JP2007500529A (ja) * | 2003-07-31 | 2007-01-18 | コーニンクレッカ フィリップス エレクトロニクス エヌ ヴィ | 生体管構造を流れる流体の性状を決定する開口数可変の方法および装置 |
| JP2016011935A (ja) * | 2014-06-30 | 2016-01-21 | 株式会社トプコン | 皮膚性状評価装置 |
Non-Patent Citations (4)
| Title |
|---|
| DAISUKE YOSHIKAWA ET AL.: "Basic Study on Micro-tomographic Visualization of Blood Flow in Microcirculation using High-Frequency Modulated Low Coherence Interferometer", PROCEEDINGS OF MECHANICAL ENGINEERING CONGRESS, JAPAN, 10 September 2016 (2016-09-10), XP009514621, DOI: 10.1299/jsmemecj.2016.S0220206 * |
| NAOYA KUSUMOTO ET AL.: "IF35 Basic study on Tomographic Micro-visualizing System of Moisture Content inside Skin Tissue using Low Coherence Interferometer with 1400 nm band light source", THE PROCEEDINGS OF THE BIOENGINEERING CONFERENCE ANNUAL MEETING OF BED/JSME; THE 28TH BIOENGINEERING CONFERENCE; 2016.01.09−10, 8 January 2016 (2016-01-08), pages 1 - 5, XP009519706 * |
| SOICHI SAEKI ET AL.: "Basic study on Micro- tomographic visualization of mechanical properties inside skin tissue using Suction- typed Dynamic Optical Coherence Straingraphy", PROCEEDINGS OF MECHANICAL ENGINEERING CONGRESS, JAPAN, 6 September 2014 (2014-09-06), pages J0210201, 1 - 4, XP009514624, DOI: 10.1299/jsmemecj.2014._J0210201- * |
| YUSUKE IKUNAMI ET AL.: "Development Study on Tomographically Visualizing Method of Water Content and Mechanical Strain in Skin Tissue using Low Coherence Interferometer", PROCEEDINGS OF MECHANICAL ENGINEERING CONGRESS, JAPAN, 10 September 2011 (2011-09-10), pages J022014, 1 - 5, XP009514625, DOI: 10.1299/jsmemecj.2011._J022014-1 * |
Cited By (3)
| Publication number | Priority date | Publication date | Assignee | Title |
|---|---|---|---|---|
| CN108309244A (zh) * | 2018-02-13 | 2018-07-24 | 天津海仁医疗技术有限公司 | 一种新型压力传感皮肤微血管扫描装置和系统及工作方法 |
| JP2020131026A (ja) * | 2019-02-12 | 2020-08-31 | ポーラ化成工業株式会社 | 肌解析方法、肌解析システム及び肌解析プログラム |
| JP7356927B2 (ja) | 2019-02-12 | 2023-10-05 | ポーラ化成工業株式会社 | 肌解析方法、肌解析システム及び肌解析プログラム |
Also Published As
| Publication number | Publication date |
|---|---|
| JP2017225811A (ja) | 2017-12-28 |
| EP3473166A1 (en) | 2019-04-24 |
| US12029578B2 (en) | 2024-07-09 |
| KR102225808B1 (ko) | 2021-03-10 |
| US20190125247A1 (en) | 2019-05-02 |
| CN109310337A (zh) | 2019-02-05 |
| TWI735596B (zh) | 2021-08-11 |
| EP3473166A4 (en) | 2019-12-11 |
| JP6245590B1 (ja) | 2017-12-13 |
| CN109310337B (zh) | 2021-07-06 |
| TW201803521A (zh) | 2018-02-01 |
| KR20180107209A (ko) | 2018-10-01 |
Similar Documents
| Publication | Publication Date | Title |
|---|---|---|
| JP6245590B1 (ja) | 皮膚診断装置、皮膚状態出力方法、プログラムおよび記録媒体 | |
| JP5166889B2 (ja) | 眼底血流量の定量測定装置 | |
| Nair et al. | Heartbeat OCE: corneal biomechanical response to simulated heartbeat pulsation measured by optical coherence elastography | |
| JP6707258B2 (ja) | 応力可視化装置および力学物性値可視化装置 | |
| JP6798095B2 (ja) | 光コヒーレンストモグラフィ装置、及びそれに用いる制御プログラム | |
| US9687147B2 (en) | Optical coherence tomography device and control program | |
| KR101746763B1 (ko) | 망막 또는 맥락막 내 혈관조영 광가간섭 단층촬영 장치 및 이를 이용한 질병 진단방법 | |
| Singh et al. | Optical coherence elastography | |
| WO2014168930A1 (en) | Methods and systems for determining hemodynamic properties of a tissue | |
| Chen | Advances in doppler oct | |
| US20150233701A1 (en) | Enhanced OCT Measurement and Imaging Apparatus and Method | |
| JP7154542B2 (ja) | 組織の粘弾性を断層可視化する装置および方法 | |
| JP6648891B2 (ja) | 物質含有量を断層可視化する装置および方法 | |
| US11406258B2 (en) | System and method to measure tissue biomechanical properties without external excitation | |
| JP6623163B2 (ja) | 軟骨診断装置および診断用プローブ | |
| Gao | Quantitative depth‐resolved microcirculation imaging with optical coherence tomography angiography (Part Ι): Blood flow velocity imaging | |
| US20200226756A1 (en) | Device, method, and program for visualizing network of blood vessels of skin | |
| CN120387998A (zh) | 处理光学相干断层成像扫描 | |
| HK40002242A (en) | Skin diagnosing device, skin condition output method, program and recording medium | |
| HK40002242B (zh) | 皮肤诊断装置、皮肤状态输出方法、以及记录介质 | |
| JP7629595B2 (ja) | Octを利用した軟骨診断装置 | |
| Zvietcovich | Dynamic optical coherence elastography | |
| Xie | Development of Functional Optical Coherence Tomography for Structural and Microangiography Assessment of Heart and Skin | |
| Li | Development of Advanced Multifunctional Optical Coherence Tomography Based on Jones-matrix Theory for Biological Tissue Investigation | |
| Chau | Elastography using optical coherence tomography: development and validation of a novel technique |
Legal Events
| Date | Code | Title | Description |
|---|---|---|---|
| ENP | Entry into the national phase |
Ref document number: 20187025090 Country of ref document: KR Kind code of ref document: A |
|
| 121 | Ep: the epo has been informed by wipo that ep was designated in this application |
Ref document number: 17815266 Country of ref document: EP Kind code of ref document: A1 |
|
| NENP | Non-entry into the national phase |
Ref country code: DE |
|
| ENP | Entry into the national phase |
Ref document number: 2017815266 Country of ref document: EP Effective date: 20190121 |
|
| WWW | Wipo information: withdrawn in national office |
Ref document number: 2017815266 Country of ref document: EP |