WO2018105652A1 - 溶融金属表面のスラグ体積評価方法 - Google Patents
溶融金属表面のスラグ体積評価方法 Download PDFInfo
- Publication number
- WO2018105652A1 WO2018105652A1 PCT/JP2017/043809 JP2017043809W WO2018105652A1 WO 2018105652 A1 WO2018105652 A1 WO 2018105652A1 JP 2017043809 W JP2017043809 W JP 2017043809W WO 2018105652 A1 WO2018105652 A1 WO 2018105652A1
- Authority
- WO
- WIPO (PCT)
- Prior art keywords
- slag
- container
- molten metal
- volume
- thickness
- Prior art date
- Legal status (The legal status is an assumption and is not a legal conclusion. Google has not performed a legal analysis and makes no representation as to the accuracy of the status listed.)
- Ceased
Links
Images


Classifications
-
- B—PERFORMING OPERATIONS; TRANSPORTING
- B22—CASTING; POWDER METALLURGY
- B22D—CASTING OF METALS; CASTING OF OTHER SUBSTANCES BY THE SAME PROCESSES OR DEVICES
- B22D2/00—Arrangement of indicating or measuring devices, e.g. for temperature or viscosity of the fused mass
- B22D2/001—Arrangement of indicating or measuring devices, e.g. for temperature or viscosity of the fused mass for the slag appearance in a molten metal stream
-
- B—PERFORMING OPERATIONS; TRANSPORTING
- B22—CASTING; POWDER METALLURGY
- B22D—CASTING OF METALS; CASTING OF OTHER SUBSTANCES BY THE SAME PROCESSES OR DEVICES
- B22D37/00—Controlling or regulating the pouring of molten metal from a casting melt-holding vessel
-
- B—PERFORMING OPERATIONS; TRANSPORTING
- B22—CASTING; POWDER METALLURGY
- B22D—CASTING OF METALS; CASTING OF OTHER SUBSTANCES BY THE SAME PROCESSES OR DEVICES
- B22D43/00—Mechanical cleaning, e.g. skimming of molten metals
-
- C—CHEMISTRY; METALLURGY
- C21—METALLURGY OF IRON
- C21C—PROCESSING OF PIG-IRON, e.g. REFINING, MANUFACTURE OF WROUGHT-IRON OR STEEL; TREATMENT IN MOLTEN STATE OF FERROUS ALLOYS
- C21C5/00—Manufacture of carbon-steel, e.g. plain mild steel, medium carbon steel or cast steel or stainless steel
- C21C5/28—Manufacture of steel in the converter
- C21C5/42—Constructional features of converters
- C21C5/46—Details or accessories
- C21C5/4673—Measuring and sampling devices
-
- F—MECHANICAL ENGINEERING; LIGHTING; HEATING; WEAPONS; BLASTING
- F27—FURNACES; KILNS; OVENS; RETORTS
- F27D—DETAILS OR ACCESSORIES OF FURNACES, KILNS, OVENS OR RETORTS, IN SO FAR AS THEY ARE OF KINDS OCCURRING IN MORE THAN ONE KIND OF FURNACE
- F27D21/00—Arrangement of monitoring devices; Arrangement of safety devices
-
- F—MECHANICAL ENGINEERING; LIGHTING; HEATING; WEAPONS; BLASTING
- F27—FURNACES; KILNS; OVENS; RETORTS
- F27D—DETAILS OR ACCESSORIES OF FURNACES, KILNS, OVENS OR RETORTS, IN SO FAR AS THEY ARE OF KINDS OCCURRING IN MORE THAN ONE KIND OF FURNACE
- F27D21/00—Arrangement of monitoring devices; Arrangement of safety devices
- F27D21/02—Observation or illuminating devices
-
- G—PHYSICS
- G01—MEASURING; TESTING
- G01B—MEASURING LENGTH, THICKNESS OR SIMILAR LINEAR DIMENSIONS; MEASURING ANGLES; MEASURING AREAS; MEASURING IRREGULARITIES OF SURFACES OR CONTOURS
- G01B11/00—Measuring arrangements characterised by the use of optical techniques
-
- G—PHYSICS
- G01—MEASURING; TESTING
- G01B—MEASURING LENGTH, THICKNESS OR SIMILAR LINEAR DIMENSIONS; MEASURING ANGLES; MEASURING AREAS; MEASURING IRREGULARITIES OF SURFACES OR CONTOURS
- G01B11/00—Measuring arrangements characterised by the use of optical techniques
- G01B11/02—Measuring arrangements characterised by the use of optical techniques for measuring length, width or thickness
- G01B11/06—Measuring arrangements characterised by the use of optical techniques for measuring length, width or thickness for measuring thickness ; e.g. of sheet material
-
- G—PHYSICS
- G01—MEASURING; TESTING
- G01F—MEASURING VOLUME, VOLUME FLOW, MASS FLOW OR LIQUID LEVEL; METERING BY VOLUME
- G01F17/00—Methods or apparatus for determining the capacity of containers or cavities, or the volume of solid bodies
-
- G—PHYSICS
- G01—MEASURING; TESTING
- G01F—MEASURING VOLUME, VOLUME FLOW, MASS FLOW OR LIQUID LEVEL; METERING BY VOLUME
- G01F22/00—Methods or apparatus for measuring volume of fluids or fluent solid material, not otherwise provided for
-
- G—PHYSICS
- G01—MEASURING; TESTING
- G01N—INVESTIGATING OR ANALYSING MATERIALS BY DETERMINING THEIR CHEMICAL OR PHYSICAL PROPERTIES
- G01N21/00—Investigating or analysing materials by the use of optical means, i.e. using sub-millimetre waves, infrared, visible or ultraviolet light
- G01N21/84—Systems specially adapted for particular applications
-
- G—PHYSICS
- G01—MEASURING; TESTING
- G01N—INVESTIGATING OR ANALYSING MATERIALS BY DETERMINING THEIR CHEMICAL OR PHYSICAL PROPERTIES
- G01N33/00—Investigating or analysing materials by specific methods not covered by groups G01N1/00 - G01N31/00
- G01N33/20—Metals
-
- G—PHYSICS
- G01—MEASURING; TESTING
- G01N—INVESTIGATING OR ANALYSING MATERIALS BY DETERMINING THEIR CHEMICAL OR PHYSICAL PROPERTIES
- G01N33/00—Investigating or analysing materials by specific methods not covered by groups G01N1/00 - G01N31/00
- G01N33/20—Metals
- G01N33/205—Metals in liquid state, e.g. molten metals
-
- G—PHYSICS
- G06—COMPUTING OR CALCULATING; COUNTING
- G06T—IMAGE DATA PROCESSING OR GENERATION, IN GENERAL
- G06T7/00—Image analysis
- G06T7/0002—Inspection of images, e.g. flaw detection
- G06T7/0004—Industrial image inspection
- G06T7/001—Industrial image inspection using an image reference approach
-
- G—PHYSICS
- G06—COMPUTING OR CALCULATING; COUNTING
- G06T—IMAGE DATA PROCESSING OR GENERATION, IN GENERAL
- G06T7/00—Image analysis
- G06T7/60—Analysis of geometric attributes
- G06T7/62—Analysis of geometric attributes of area, perimeter, diameter or volume
-
- B—PERFORMING OPERATIONS; TRANSPORTING
- B22—CASTING; POWDER METALLURGY
- B22D—CASTING OF METALS; CASTING OF OTHER SUBSTANCES BY THE SAME PROCESSES OR DEVICES
- B22D43/00—Mechanical cleaning, e.g. skimming of molten metals
- B22D43/005—Removing slag from a molten metal surface
- B22D43/007—Removing slag from a molten metal surface by using scrapers
-
- C—CHEMISTRY; METALLURGY
- C21—METALLURGY OF IRON
- C21B—MANUFACTURE OF IRON OR STEEL
- C21B3/00—General features in the manufacture of pig-iron
- C21B3/04—Recovery of by-products, e.g. slag
-
- C—CHEMISTRY; METALLURGY
- C21—METALLURGY OF IRON
- C21C—PROCESSING OF PIG-IRON, e.g. REFINING, MANUFACTURE OF WROUGHT-IRON OR STEEL; TREATMENT IN MOLTEN STATE OF FERROUS ALLOYS
- C21C5/00—Manufacture of carbon-steel, e.g. plain mild steel, medium carbon steel or cast steel or stainless steel
- C21C5/52—Manufacture of steel in electric furnaces
- C21C2005/5288—Measuring or sampling devices
-
- C—CHEMISTRY; METALLURGY
- C21—METALLURGY OF IRON
- C21C—PROCESSING OF PIG-IRON, e.g. REFINING, MANUFACTURE OF WROUGHT-IRON OR STEEL; TREATMENT IN MOLTEN STATE OF FERROUS ALLOYS
- C21C2300/00—Process aspects
- C21C2300/06—Modeling of the process, e.g. for control purposes; CII
-
- F—MECHANICAL ENGINEERING; LIGHTING; HEATING; WEAPONS; BLASTING
- F27—FURNACES; KILNS; OVENS; RETORTS
- F27D—DETAILS OR ACCESSORIES OF FURNACES, KILNS, OVENS OR RETORTS, IN SO FAR AS THEY ARE OF KINDS OCCURRING IN MORE THAN ONE KIND OF FURNACE
- F27D21/00—Arrangement of monitoring devices; Arrangement of safety devices
- F27D21/02—Observation or illuminating devices
- F27D2021/026—Observation or illuminating devices using a video installation
-
- F—MECHANICAL ENGINEERING; LIGHTING; HEATING; WEAPONS; BLASTING
- F27—FURNACES; KILNS; OVENS; RETORTS
- F27D—DETAILS OR ACCESSORIES OF FURNACES, KILNS, OVENS OR RETORTS, IN SO FAR AS THEY ARE OF KINDS OCCURRING IN MORE THAN ONE KIND OF FURNACE
- F27D3/00—Charging; Discharging; Manipulation of charge
- F27D3/15—Tapping equipment; Equipment for removing or retaining slag
- F27D3/1545—Equipment for removing or retaining slag
-
- G—PHYSICS
- G06—COMPUTING OR CALCULATING; COUNTING
- G06T—IMAGE DATA PROCESSING OR GENERATION, IN GENERAL
- G06T2207/00—Indexing scheme for image analysis or image enhancement
- G06T2207/30—Subject of image; Context of image processing
- G06T2207/30108—Industrial image inspection
- G06T2207/30136—Metal
-
- Y—GENERAL TAGGING OF NEW TECHNOLOGICAL DEVELOPMENTS; GENERAL TAGGING OF CROSS-SECTIONAL TECHNOLOGIES SPANNING OVER SEVERAL SECTIONS OF THE IPC; TECHNICAL SUBJECTS COVERED BY FORMER USPC CROSS-REFERENCE ART COLLECTIONS [XRACs] AND DIGESTS
- Y02—TECHNOLOGIES OR APPLICATIONS FOR MITIGATION OR ADAPTATION AGAINST CLIMATE CHANGE
- Y02P—CLIMATE CHANGE MITIGATION TECHNOLOGIES IN THE PRODUCTION OR PROCESSING OF GOODS
- Y02P10/00—Technologies related to metal processing
- Y02P10/20—Recycling
-
- Y—GENERAL TAGGING OF NEW TECHNOLOGICAL DEVELOPMENTS; GENERAL TAGGING OF CROSS-SECTIONAL TECHNOLOGIES SPANNING OVER SEVERAL SECTIONS OF THE IPC; TECHNICAL SUBJECTS COVERED BY FORMER USPC CROSS-REFERENCE ART COLLECTIONS [XRACs] AND DIGESTS
- Y02—TECHNOLOGIES OR APPLICATIONS FOR MITIGATION OR ADAPTATION AGAINST CLIMATE CHANGE
- Y02P—CLIMATE CHANGE MITIGATION TECHNOLOGIES IN THE PRODUCTION OR PROCESSING OF GOODS
- Y02P10/00—Technologies related to metal processing
- Y02P10/25—Process efficiency
-
- Y—GENERAL TAGGING OF NEW TECHNOLOGICAL DEVELOPMENTS; GENERAL TAGGING OF CROSS-SECTIONAL TECHNOLOGIES SPANNING OVER SEVERAL SECTIONS OF THE IPC; TECHNICAL SUBJECTS COVERED BY FORMER USPC CROSS-REFERENCE ART COLLECTIONS [XRACs] AND DIGESTS
- Y02—TECHNOLOGIES OR APPLICATIONS FOR MITIGATION OR ADAPTATION AGAINST CLIMATE CHANGE
- Y02W—CLIMATE CHANGE MITIGATION TECHNOLOGIES RELATED TO WASTEWATER TREATMENT OR WASTE MANAGEMENT
- Y02W30/00—Technologies for solid waste management
- Y02W30/50—Reuse, recycling or recovery technologies
Definitions
- the present invention relates to a method for evaluating a slag volume on the surface of a molten metal.
- This application claims priority based on Japanese Patent Application No. 2016-236936 for which it applied to Japan on December 6, 2016, and uses the content here.
- Slag floats on the surface of the molten metal contained in the vessel, such as hot metal taken from the blast furnace to the hot ladle or molten steel taken from the converter to the ladle.
- the slag floating on the surface of the hot metal accommodated in the hot metal ladle may cause a component detachment in the converter process, which is a subsequent process.
- the slag which floats on the surface of the molten steel accommodated in the ladle may cause a component detachment in the secondary refining process which is a subsequent process.
- the slag floating on the surface of the molten metal contained in the container may have a harmful effect in the subsequent process, before sending the molten metal to the subsequent process, remove the slag outside the container. It is common to perform a draining operation to remove slag using a scraper that scrapes.
- a luminance histogram is obtained from image data obtained by imaging a molten metal surface in a molten metal container with an imaging device installed in the vicinity of the molten metal container, and slag scraping is obtained from the pattern of the luminance histogram.
- the actual slag has a thickness, and it is considered that the thickness of the slag gradually decreases in the process of slag removal.
- the above method of Patent Document 1 does not evaluate the thickness of the slag, so the slag remaining in the container. It is difficult to accurately grasp the amount of Moreover, in the method of Patent Document 1, many steps are required to calculate the amount of the slag, and it is difficult to quickly grasp the amount of the slag.
- the present invention has been made in view of the above circumstances, and it is possible to more accurately and quickly evaluate the volume of the slag floating on the surface of the molten metal in the container.
- the purpose is to provide a method.
- the inventors of the present invention are that slag floating on the surface of the molten metal in the container and solidified by contact with the atmosphere absorbs radiated light emitted from the molten metal by thermal radiation, and slag It was noted that the degree of absorption of the emitted light varies depending on the thickness of the light. Then, if a hot water surface is imaged in a state where a plurality of slags having different thicknesses are floating on the surface of the molten metal, and the relationship between the thickness and concentration (luminance) of the slag is calculated in advance, the hot water to be evaluated It has been found that the volume of the slag can be calculated based on the captured image of the surface.
- the present invention employs the following in order to solve the above problems.
- the slag thickness and the density parameter A preparatory step for preliminarily calculating an approximate curve indicating a correspondence relationship with the image; an imaging step for imaging a molten metal surface to be evaluated; a value of the density parameter of each pixel constituting the captured image obtained in the imaging step; , Based on the approximate curve calculated in the preparation step, calculating the slag thickness for each pixel constituting the captured image obtained in the imaging step, and integrating the calculated slag thickness for each pixel, And a slag volume calculating step for calculating the volume of the slag
- the configuration may be as follows: a slag discharging process for slag slag in the container; and a slag remaining for calculating a residual ratio of the slag in the container.
- the volume of the slag in the container before the waste disposal process and the volume of the slag in the container after the waste disposal process are calculated, and in the slag residual rate calculation process, the volume after the waste disposal process is calculated.
- the residual volume ratio of the slag in the container is calculated by dividing the volume of the slag in the container by the volume of the slag in the container before the draining step.
- the volume of the slag floating on the surface of the molten metal in the container can be evaluated more accurately and quickly.
- FIG. 4 is a view showing a state in which the slags S1 to S3 shown in FIG. 3 are floating on the hot water surface in the container, and is a cross-sectional view taken along the line XX of FIG. It is a figure which shows an example of the approximated curve calculated in preparation process ST1 shown in FIG.
- FIG. 6 is a diagram for explaining a procedure for calculating a slag thickness in the slag volume calculating step ST3 shown in FIG. 2, and is an enlarged view of a pixel region surrounded by a broken line A in FIG. 6A. It is a figure for demonstrating the procedure which calculates the thickness of slag in slag volume calculation process ST3 shown in FIG. 2, Comprising: It is a figure which shows the thickness of slag calculated in the pixel area
- FIG. 6 shows the thickness of slag calculated in the pixel area
- slag volume evaluation method on the surface of a molten metal according to an embodiment of the present invention
- slag volume evaluation method on the surface of a molten metal according to an embodiment of the present invention
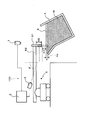
- FIG. 1 is a schematic diagram illustrating a schematic configuration of a slag volume evaluation apparatus 100 used in the slag volume evaluation method according to the present embodiment.
- the container 4 which accommodates the molten metal M is shown by the cross section.
- the slag volume evaluation apparatus 100 is configured to remove the slag S floating on the surface of a molten metal M such as hot metal accommodated in a container 4 such as a tilted hot metal ladle with a scraping plate 51 and an arm. It is used for the waste work which scrapes out the container 4 using the waste machine 5 having 52.
- the molten metal M accommodated in the container 4 has a temperature of 1200 ° C. to 1400 ° C., for example, and emits light by thermal radiation (that is, the molten metal M emits light by thermal radiation).
- the slag S floating on the surface of the molten metal M accommodated in the container 4 is cooled by contact with the atmosphere and solidified in the vicinity of the surface. The light emission is blocked.
- the slag volume evaluation apparatus 100 includes a first imaging unit 1 that images the molten metal surface in the container 4 from above in the vertical direction, and a second imaging unit 3 that images the molten metal surface in the container 4 from above obliquely with respect to the vertical direction.
- the image processing means 2 connected to the first image pickup means 1 and the second image pickup means 3 is provided.
- the “hot water surface” does not mean only the surface of the molten metal M, but means the surface of the slag when the slag floats on the surface of the molten metal. That is, it means the outermost surface (uppermost surface) of the contents in the container 4.
- the first imaging means 1 for example, a CCD camera having main sensitivity in the visible light region or a thermal image camera (thermography) having main sensitivity in the infrared light region can be used.
- a CCD camera is used as the first imaging unit 1.
- the density value of the pixel region corresponding to the slag in the captured image can be calculated.
- the thermal image camera (thermography) is used, the value of the temperature or density (density before conversion into temperature) of the pixel region can be calculated.
- the image processing means 2 includes, for example, a general-purpose personal computer in which a predetermined program for executing a slag volume calculating step ST3 and a slag remaining rate calculating step ST7 described later is installed.
- the image processing means 2 has a monitor for displaying the captured images obtained by the first imaging means 1 and the second imaging means 3.
- the second imaging means 3 as with the first imaging means 1, for example, a CCD camera having main sensitivity in the visible light region or a thermal image camera (thermography) having main sensitivity in the infrared light region can be used. .
- a CCD camera is used as the second imaging unit 3.
- the slag volume evaluation method according to the present embodiment is executed using the slag volume evaluation apparatus 100.
- the slag volume evaluation method according to the present embodiment will be described.
- FIG. 2 is a flowchart showing the slag volume evaluation method according to this embodiment.
- the slag volume evaluation method according to the present embodiment floats on the surface of the molten metal M based on a captured image obtained by imaging the molten metal surface in the container 4 containing the molten metal M by the first imaging means 1.
- This is a method for evaluating the volume of the slag S, and as shown in FIG. 2, a preparation step ST1, an imaging step ST2, a slag volume calculation step ST3, an elimination step ST4, an imaging step ST5, and a slag volume calculation. It includes a process ST6, a slag remaining rate calculation process ST7, and a determination process ST8 for determining whether or not to end the evacuation work.
- the contents of each process will be described sequentially.
- the first imaging means 1 is used to image a molten metal surface in which a plurality of slags S having different thicknesses are simultaneously floating on the surface of the molten metal M.
- a plurality of hot water surfaces obtained at different times of the waste work (partial waste) using the waste machine 5 may be imaged, or a single hot water surface at a certain time of the waste work may be imaged. May be.
- the hot water surface before starting the draining work of the slag S (the thickness of the slag S is considered to be the largest).
- the hot water surface in the middle of the draining operation, and the hot water surface after the draining operation (the hot water surface considered to have the smallest thickness of the slag S) can be exemplified.
- the obtained captured image is stored in the image processing means 2.
- the aperture of the lens included in the first imaging unit 1 so that the density of the pixel region corresponding to the molten metal M in the captured image obtained by the first imaging unit 1 has a maximum value of 255 (white), and The gain of the video signal output from the first imaging means 1 is adjusted.
- the visual field of the first imaging unit 1 is set so that not only the hot water surface of the container 4 but also the container 4 and the background B are included in the visual field. Note that the visual field of the first imaging unit 1 may be set so that only the hot water surface of the container 4 is included in the visual field.
- density in the present specification refers to, for example, the brightness of an image having 256 gradations (that is, the luminance on the image). And the relationship between this density
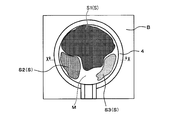
- FIG. 3 is a diagram schematically showing an example of a captured image obtained by imaging the hot water surface in the container 4 by the first imaging means 1.
- the field of view of the first imaging means is set to a wide field of view including the container 4 and the background B within the field of view, and a plurality of slags S1 to S3 having different thicknesses float on the single molten metal surface at the same time. Shows the case.
- the thickness of the slag S1 is the largest, and the thickness decreases in the order of the slag S2 and the slag S3.
- the pixel region corresponding to the slag S1 having the largest thickness is the darkest (the density is small), and the pixel region corresponding to S3 having the smallest thickness is the pixel region. It is the brightest (high density).
- the density of the pixel region corresponding to the molten metal M has a maximum value of 255 (white). Note that the pixel region corresponding to the container 4 and the pixel region corresponding to the background B are actually dark (the density is small) because the temperatures of the container 4 and the background B are lower than the molten metal M and the slag S.
- the pixel region corresponding to the molten metal M is shown in white as in the case of the pixel region.
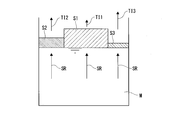
- FIG. 4 is a view showing a state in which the slags S1 to S3 are floating on the molten metal M in the container 4, and is a cross-sectional view taken along the line XX of FIG.
- part of the radiated light SR radiated from the molten metal M by thermal radiation is absorbed by the slags S1 to S3.
- the radiated light SR that has passed through the slugs S1 to S3 becomes transmitted light TI1 to TI3, and these transmitted light TI1 to TI3 enter the first imaging means 1.
- the transmitted light TI1 transmitted through the slag S1 As the thickness of the slag increases, the absorption of the radiated light SR by the slag increases. Therefore, the transmitted light TI1 transmitted through the slag S1, the transmitted light TI2 transmitted through the slag S2, and the transmitted light TI3 transmitted through the slag S3 are sequentially transmitted. Strength increases. Thereby, in the captured image shown in FIG. 3, the pixel region is brightened in the order of the slag S1, the slag S2, and the slag S3.
- the value of the density parameter having a correlation with the density of the pixel region corresponding to the slags S1 to S3 in the captured image shown in FIG. 3 is calculated.
- the concentration parameter can be exemplified by temperature in addition to the concentration itself, but in the present embodiment, the concentration itself is used as the concentration parameter.
- the average density of the pixel area corresponding to each of the slags S1 to S3 is calculated.
- the pixel area corresponding to each of the slugs S1 to S3 can be recognized, for example, by displaying a captured image on the monitor of the image processing means 2 and visually checking it by the operator.
- the image processing means 2 can automatically calculate the average density of the pixel areas corresponding to the slags S1 to S3.
- an approximate curve indicating the correspondence between the thickness and the density of the slag S is calculated using the average density value of the pixel area corresponding to each of the slags S1 to S3.
- the minimum two An approximate curve is calculated by applying a multiplication method.
- the approximate curve is also calculated using the value (255 in this embodiment).
- each slag S can be measured, for example, by comparing the slag S with the vertical dimension of the scraper 51 of the scraper 5.
- the arm 52 of the evacuator 5 is driven (rotated) so that the lower end of the scraper 51 is buried in the slag S, and the scraper 51 Is substantially coincident with the lower surface of the slag S (the upper surface of the molten metal M).
- molten_metal surface in the container 4 is imaged from diagonally upward with respect to the perpendicular direction by the 2nd imaging means 3.
- FIG. Thereby, the picked-up image in which both the slag S and the scraping board 51 were reflected is obtained.
- the lower surface of the scraping plate 51 can be made substantially coincident with the lower surface of the slag S (the upper surface of the molten metal M). It can. Further, from the volume of the molten metal M in the container 4, a molten metal surface position when the container 4 is tilted is calculated in advance, and the calculated molten metal surface position and the lower surface of the scraping plate 51 are substantially coincided with each other. The scraper plate 51 may be lowered.
- the captured image is displayed on the monitor of the image processing means 2, and the operator visually observes this to calculate the distance H ⁇ b> 1 between the lower surface of the arm 52 and the upper surface of the slag S.
- the distance (actual size) of a straight line passing through two points designated using a pointing device such as a mouse is set as the imaging magnification and visual axis angle of the second imaging means 3 set in advance (shown in FIG. 1).
- a program for calculating by geometric calculation using ⁇ ) is installed in the image processing means 2, the operator can designate two points, the lower surface of the arm 52 and the upper surface of the slag S, while viewing the monitor.
- the image processing means 2 can automatically calculate the distance H1.
- the lower end of the scraper 51 is sequentially buried in each of the slags S1 to S3, and the above procedure is executed to measure the thickness of each of the slags S1 to S3.
- the approximate curve to be calculated is represented by an exponential function.
- the slag thickness is K
- the concentration value is I
- an approximate curve represented by the following equation (1) is calculated (the coefficient a is specified by the least square method or the like).
- I 0 is the density value (255 in the present embodiment) of the pixel region corresponding to the molten metal M in the captured image obtained in the preparation step ST1
- e is the natural logarithm base
- a means a positive coefficient, respectively.
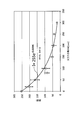
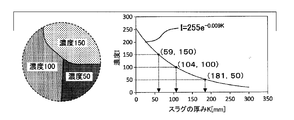
- FIG. 5 is a diagram illustrating an example of the approximate curve calculated in the preparation step ST1.
- the data plotted with circles in FIG. 5 indicate the concentration I at the thickness K of each slag S used to calculate the approximate curve, and the bars extending vertically indicate the concentration variation (standard deviation 1 ⁇ ) at the same thickness K. .
- the preparation step ST1 described above is executed before evaluating the volume of the slag S on the hot water surface that is actually the object of evaluation. Then, the correspondence (approximate curve) between the thickness K and the concentration I of the slag S obtained in the preparation step ST1 is stored in the image processing means 2 and used in the slag volume calculation step ST3 described later. Specifically, formula (2) described later is stored in the image processing means 2.
- Imaging process ST2 Next, in the imaging step ST2, the first imaging means 1 images the molten metal surface to be evaluated.
- the imaging conditions such as the aperture of the lens provided in the first imaging unit 1 and the gain of the video signal output from the first imaging unit 1 are the same as the conditions set in the preparation step ST1.
- the image processing means 2 performs the imaging step ST2 based on the value of the density I of each pixel constituting the captured image obtained in the imaging step ST2 and the approximate curve calculated in the preparation step ST1.
- the thickness K of the slag S is calculated for each pixel constituting the obtained captured image.
- the following formula (2) obtained by modifying the above formula (1) is used.
- the image processing means 2 can automatically calculate the thickness K of the slag S corresponding to the density I by substituting the value of the density I of each pixel into the above equation (2).
- FIG. 6A to 6C are diagrams for explaining a procedure for calculating the thickness K of the slag S in the slag volume calculating step ST3.
- FIG. 6A is a diagram schematically illustrating an example of a captured image obtained in the imaging step ST2.
- 6B is an enlarged view of the pixel area surrounded by the broken line A in FIG. 6A (left figure), and a graph for calculating the slag thickness from the density of the pixel area using the approximate curve shown in FIG. 5 (right figure). ).
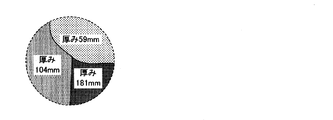
- 6C is a diagram showing the thickness K of the slag S calculated in the pixel region shown in FIG. 6B. If pixel regions having densities of 50, 100, and 150 exist in the pixel region surrounded by the broken line A in FIG.
- the thickness is based on the approximate curve shown in FIG. 6B (based on the above equation (2)). 181 mm, 104 mm, and 59 mm are calculated.
- the above-described processing described for the pixel region surrounded by the broken line A is executed for each pixel constituting the captured image obtained in the imaging step ST2.
- the thicknesses calculated based on the approximate curve are used because the density of these pixel regions is small as described above. Becomes larger. Therefore, when the thickness of these pixel regions is added to the integration described later, a large error occurs in the volume of the calculated slag S. Therefore, for example, among all the pixels constituting the captured image, only the pixels located inside the pixel region corresponding to the container 4 are set as targets for calculating the thickness. In general, the position of the container 4 when performing the evacuation work is often fixed, and in this case, the position of the pixel region corresponding to the container 4 and the background B in the captured image does not change.
- the coordinates of the pixel located inside the pixel region corresponding to the container 4 in the captured image are set in advance and stored in the image processing means 2, thereby the pixel located inside the pixel region. Only the thickness can be calculated. Further, for example, after calculating the thickness for all the pixels constituting the captured image (including the pixels corresponding to the container 4 and the background B), only the thickness for the pixels located inside the pixel region corresponding to the container 4 is calculated. May be integrated. Further, since the density of the pixel area corresponding to the container 4 and the background B is generally smaller than the density of the pixel area corresponding to the molten metal M and the slag S, for example, the density is equal to or higher than a predetermined threshold value. Only pixels having density may be targeted.
- the predetermined threshold value is a value that can distinguish the density of the pixel region corresponding to the molten metal M and the slag S and the density of the pixel region corresponding to the container 4 and the background B.
- the visual field of the first imaging unit 1 may be adjusted in advance so that only the hot water surface in the container 4 is imaged. However, if the field of view is too small, part of the slag S will be out of the field of view, and the volume of the slag S may not be calculated with high accuracy. preferable.
- the pixel region corresponding to the molten metal M may or may not be calculated. Since the density of the pixel region corresponding to the molten metal M is I 0 (255 in this embodiment), the thickness K (I 0 ) calculated by the above equation (2) becomes zero. Therefore, even if the thickness is calculated for the pixel region corresponding to the molten metal M and added to the integration described later, no error occurs in the calculated volume of the slag S.
- the volume of the slag S is calculated by integrating the calculated thickness for each pixel.
- the image processing means 2 is, for example, Based on Expression (3), the volume V (t) of the slag S at time t is calculated.
- I th is the above-mentioned predetermined threshold that can distinguish the density of the pixel region corresponding to the molten metal M and the slag S from the density of the pixel region corresponding to the container 4 and the background B. Mean value.
- the unit of volume calculated by the following equation (3) is pixel ⁇ pixel ⁇ thickness (mm), but the resolution (actual size) per pixel is based on the imaging magnification of the first imaging means 1 and the like. If determined in advance, the volume can be calculated in actual units.
- Example process ST4 Next, in a state where the container 4 is tilted, a part of the slag S is scraped out of the container 4 using the evacuator 5 (see FIG. 1). That is, in the evacuation process ST4, the slag is not scraped out and the slag S is left so that a part of the slag S remains in the container 4.
- Imaging process ST5 In the imaging process ST5, the hot water surface in the container 4 after the elimination process ST4 is imaged.
- the imaging conditions and the like are the same as in the imaging process ST2.
- the image processing means 2 calculates the volume of the slag S calculated in the slag volume calculating step ST6 (the volume of the slag S calculated based on the captured image taken after the rejection step ST4) as the slag volume.
- the residual rate of the slag S in the container 4 is calculated by dividing by the volume of the slag S calculated in the calculation step ST3 (the volume of the slag S calculated based on the captured image captured before the elimination step ST4). That is, the image processing means 2 calculates the residual rate Ps (t) of the slag S at time t based on the following formula (4).
- the calculated residual rate Ps (t) of the slag S is stored in the image processing means 2 and displayed on the monitor.
- Ps (t) V (t) / V (0) (4)
- the rejection rate Qs (t) of the slag S can be calculated by the following equation (5).
- Qs (t) 1 ⁇ Ps (t) (5)
- the operator visually checks the residual rate Ps (t) of the slag S displayed on the monitor, determines whether or not the desired residual rate has been reached, and whether or not to end the slag S draining operation. Is determined (ST8 in FIG. 2).
- the evacuation work is finished (in the case of “Yes” in ST8 of FIG. 2), the slag volume evaluation method according to the present embodiment is completed.
- the evacuation step ST4 the imaging step ST5, the slag volume calculation step ST6, and the slag remaining rate calculation step ST7 are repeatedly executed.
- an approximate curve indicating the correspondence between the thickness and the concentration of the slag S is calculated in advance, and based on this approximate curve, Since the thickness of the slag is calculated for each pixel constituting the picked-up image of the molten metal surface to be evaluated, which is obtained in the imaging step ST2, the volume of the slag S can be evaluated more accurately and quickly. For this reason, in the course of the slag S evacuation operation, the volume of the slag S remaining in the container 4 is sequentially evaluated to optimize the evacuation operation so that the slag S does not remain in the container 4 more than necessary. Is possible.
- the residual ratio of the slag S in the container 4 is calculated in the slag residual ratio calculation step ST7. If this residual ratio is used, when the molten metal M in the container 4 is processed in a subsequent process, the amount of the sulfur component contained in the molten metal M can be predicted. Thereby, the component adjustment of the molten metal M in a post process can be optimized.
- the rate has a correlation with the content of the sulfur component in the molten metal in the subsequent process. If sample analysis is used in the pre-process of the slagging operation, the content of the sulfur component in the molten metal before the slag is generated and the sulfur component in the molten metal after the slag is generated (after desulfurization refining).
- the slag remaining rate in the container 4 can be calculated by the slag remaining rate calculating step ST7, the calculated slag remaining rate and the calculated slag remaining rate in the container before the start of the waste operation are calculated. From the content of the sulfur component in the slag, the content of the sulfur component in the slag in the container after the start of the discharge operation can be calculated.
- the calculated content of the sulfur component in the slag in the container after the start of the exhausting operation and the content of the sulfur component in the molten metal after desulfurization refining calculated using the sample analysis as described above. It is possible to predict the content of the sulfur component in the molten metal at the time of the treatment in the subsequent step, based on the double sulfur ratio from the slag to the molten metal at the time of the treatment in the subsequent step. Therefore, the slag residual rate can be determined according to the content rate of the sulfur component required for the molten metal (the end of the discharge operation can be determined). Thereby, it has the advantage that the component adjustment of the molten metal in a post process can be optimized.
- the slag volume evaluation method according to the present embodiment was compared with the method described in Patent Document 1. Specifically, a skilled operator visually confirms the molten metal level in the container 4 so that the removal rate of the slag S at the end of the removal operation is 0.7 to 0.8. Worked. At the time of this waste work, the residual rate Ps (t) of the slag S at the end of the waste work is calculated using the slag volume evaluation method according to the present embodiment, and the slag S is discharged by the above equation (5). We asked for the probability of the defect.
- the residual rate of the slag S is calculated from the area of the slag S before the start of the waste work and at the end of the waste work, calculated using the method described in Patent Document 1.
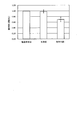
- the rejection rate of the slag S was obtained from Equation (5). The above test was repeated three times. The results are shown in FIG.
- the slag S rejection rate obtained by using the slag volume evaluation method according to the present embodiment based on the slag S rejection rate determined by the operator's visual judgment, and the method described in Patent Document 1.
- required using is shown.
- the value of the bar graph indicates an average value of three tests, and the bar extending vertically from the bar graph indicates variation (standard deviation 1 ⁇ ).
- the slag volume evaluation method according to the present embodiment is calculated using the method described in Patent Document 1, whereas the slag S rejection rate is 0.70 ⁇ 0.08.
- the rejection rate of slag S determined by use was 0.98 ⁇ 0.06. That is, it is considered that the slag S rejection rate according to the slag volume evaluation method according to the present embodiment is closer and more accurate to a skilled operator than the rejection rate according to the method described in Patent Document 1.
- the case where the approximate curve (see FIG. 5) represented by the above formula (1) is calculated in the preparation step ST1 is shown.
- the preparation step ST1 the relationship between the slag thickness K and the concentration I as shown in FIG. 5 is obtained from the radiated light of the molten metal M incident on the first imaging means 1 and transmitted through the slag S.
- it can be approximated by an exponential function such as equation (1).
- the approximate curve is not limited to the equation (1), and it is only necessary to fit measurement data of slag thickness and concentration.
- an approximate curve represented by the following formula (6) or formula (7) may be calculated.
- I I 0 / (aK 2 + bK + 1) (6)
- I I 0 / (aK 3 + bK 2 + cK + 1) (7)
- the second imaging unit 3 based on the captured image in a state in which the lower surface of the scraping plate 51 is substantially coincident with the lower surface of the slag S (the upper surface of the molten metal M) by the second imaging unit 3 in the preparation step ST1.
- the case where the thickness K of the slag S is measured is shown (see FIG. 1).
- a set of laser distance meters that are non-contact distance meters arranged at the same height above the scraping plate 51 may be used.
- the distance H1 between the lower surface of the arm 52 and the upper surface of the slag S can be calculated by subtracting the measurement result of the other laser distance meter and subtracting the vertical dimension of the arm 52.
- the thickness K of the slag S may be measured by subtracting the distance H1 calculated in this way from H0.
- the distance to the upper surface of the slag S is measured with one laser distance meter, and the distance to the surface of the molten metal M is measured with the other laser distance meter,
- the thickness K of the slag S may be measured from the difference between these measurement results. Further, the thickness K of the slag S may be measured using a measuring rod. In these cases, it is not necessary to measure the distance H1.
- the thickness K of the slag S is calculated in the 1st imaging means 1 used in order to obtain the captured image for evaluating the volume of the slag S in slag volume calculation process ST3, and the preparation process ST1.
- the second imaging means 3 used for the purpose is provided separately.
- the second imaging means 3 may be used for the purpose of calculating the thickness K of the slag S and at the same time for obtaining a captured image for evaluating the volume of the slag S.
- the second image pickup means 3 needs to pick up an image from obliquely above in the vertical direction in order to calculate the distance H1 between the lower surface of the arm 52 and the upper surface of the slag S, the larger the visual axis angle ⁇ , Even if the difference in resolution per pixel is large or the thickness of the slag S is the same between the portion closer to the second imaging means 3 and the portion farther from the hot water surface of the container 4. There may be a difference in the density of the corresponding pixel region. Thus, since there exists a possibility of having a bad influence on the calculation precision of slag volume, it is preferable to use the 1st imaging means 1 and the 2nd imaging means 3 like the said embodiment.
- the first imaging unit 1 adjusts so that the density of the pixel region corresponding to the molten metal M in the captured image obtained by the first imaging unit 1 becomes the maximum value 255 (white). Is done.
- the pixel region corresponding to the molten metal M other than the slag S is increased in increasing the resolution for calculating the thickness of the slag S. This is because the density range of the pixel region corresponding to the slag S can be secured widely by restricting the density range to the maximum value.
- the first imaging unit 1 may be adjusted so that the density of the pixel region corresponding to the molten metal M is 250 to 255 (including density other than the maximum value).
- the minimum value of the density of the pixel region corresponding to the molten metal M (250 in the above example) may be used as the density I 0 in the above formulas (1), (2), and (3). .
- the approximate curve represented by the above equation (1) was calculated.
- the coefficient a in the equation (1) when the slag thickness and the concentration were measured while changing the slag component and the molten steel temperature, the coefficient a may be substantially constant regardless of the slag component and the molten steel temperature. all right. Therefore, once an approximate curve indicating the correspondence between the slag thickness K and the concentration I is obtained, the approximate curve can be used even if the slag component and the molten steel temperature change. However, from the viewpoint of calculating the slag volume with higher accuracy, it is preferable to calculate an approximate curve indicating the correspondence between the slag thickness K and the concentration I every time the slag component and the molten steel temperature change.
- First imaging means 2 Image processing means 3: Second imaging means 4: Container 5: Exhaust machine 100: Slag volume evaluation device M: Molten metal S: Slag
Landscapes
- Engineering & Computer Science (AREA)
- Physics & Mathematics (AREA)
- General Physics & Mathematics (AREA)
- Chemical & Material Sciences (AREA)
- Mechanical Engineering (AREA)
- Health & Medical Sciences (AREA)
- Life Sciences & Earth Sciences (AREA)
- Analytical Chemistry (AREA)
- Biochemistry (AREA)
- General Health & Medical Sciences (AREA)
- Immunology (AREA)
- Pathology (AREA)
- Fluid Mechanics (AREA)
- General Engineering & Computer Science (AREA)
- Food Science & Technology (AREA)
- Medicinal Chemistry (AREA)
- Metallurgy (AREA)
- Organic Chemistry (AREA)
- Theoretical Computer Science (AREA)
- Manufacturing & Machinery (AREA)
- Materials Engineering (AREA)
- Computer Vision & Pattern Recognition (AREA)
- Quality & Reliability (AREA)
- Geometry (AREA)
- Waste-Gas Treatment And Other Accessory Devices For Furnaces (AREA)
- Measurement Of Levels Of Liquids Or Fluent Solid Materials (AREA)
- Carbon Steel Or Casting Steel Manufacturing (AREA)
- Length Measuring Devices By Optical Means (AREA)
- Casting Support Devices, Ladles, And Melt Control Thereby (AREA)
- Investigating Or Analysing Materials By Optical Means (AREA)
Abstract
Description
本願は、2016年12月6日に日本に出願された特願2016-236936号に基づき優先権を主張し、その内容をここに援用する。
特許文献1の上記方法によれば、スラグと溶融金属とを識別するための閾値を固定する場合に比べて、スラグと溶融金属とを正確に識別できると考えられる。このため、特許文献1の上記方法によれば、湯面におけるスラグの量をある程度正確に算出可能と考えられる。
(1)本発明の一態様に係る溶融金属表面のスラグ体積評価方法は、容器内に収容された溶融金属の表面に浮上しているスラグの体積を、前記容器内の湯面の撮像画像に基づいて評価する方法であって、前記溶融金属の表面に浮上している、互いに厚みの異なる複数のスラグの厚みを測定すると共に、前記複数のスラグが前記溶融金属の表面に浮上している状態で前記容器内の湯面を撮像して得られた撮像画像における、前記複数のスラグに対応する画素領域の濃度に相関を有する濃度パラメータの値を算出することで、スラグの厚みと前記濃度パラメータとの対応関係を示す近似曲線を予め算出する準備工程と;評価対象とする湯面を撮像する撮像工程と;前記撮像工程で得られた撮像画像を構成する各画素の前記濃度パラメータの値と、前記準備工程で算出した前記近似曲線とに基づき、前記撮像工程で得られた撮像画像を構成する画素毎にスラグの厚みを算出し、前記算出した画素毎のスラグの厚みを積算することで、スラグの体積を算出するスラグ体積算出工程と;を有する。
(2)上記(1)に記載の態様において、以下のように構成してもよい:前記容器内のスラグを排滓する排滓工程と;前記容器内のスラグの残存率を算出するスラグ残存率算出工程と;をさらに有し、前記撮像工程で、前記排滓工程前の前記容器内の湯面と、前記排滓工程後の前記容器内の湯面とを撮像し、前記スラグ体積算出工程で、前記排滓工程前の前記容器内のスラグの体積と、前記排滓工程後の前記容器内のスラグの体積とを算出し、前記スラグ残存率算出工程で、前記排滓工程後の前記容器内のスラグの体積を、前記排滓工程前の前記容器内のスラグの体積で除算して、前記容器内のスラグの残存率を算出する。
まず、本実施形態に係るスラグ体積評価方法に用いるスラグ体積評価装置の構成について説明する。
図1に示すように、スラグ体積評価装置100は、傾動させた溶銑鍋などの容器4内に収容された溶銑などの溶融金属Mの表面に浮上しているスラグSを、掻き板51およびアーム52を有する排滓機5を用いて容器4外に掻き出す排滓作業に用いられる。
なお、本明細書において「湯面」とは、溶融金属Mの表面のみを意味するものではなく、スラグが溶融金属の表面に浮上している場合にはスラグの表面を意味する。すなわち、容器4内の収容物の最表面(最上面)を意味する。
なお、本実施形態のようにCCDカメラを用いる場合、撮像画像におけるスラグに対応する画素領域の濃度の値を算出可能である。また、熱画像カメラ(サーモグラフィ)を用いる場合、当該画素領域の温度又は濃度(温度に換算する前の濃度)の値を算出可能である。
以下、各工程の内容について、順次説明する。
準備工程ST1においては、まず、互いに厚みの異なる複数のスラグSが溶融金属Mの表面に同時に浮上している状態の湯面を、第1撮像手段1を用いて撮像する。この際、排滓機5を用いた排滓作業(部分排滓)の異なる時期に得られる複数の湯面を撮像してもよいし、排滓作業のある時点における単一の湯面を撮像してもよい。なお、排滓作業(部分排滓)の異なる時期に得られる複数の湯面の具体例として、例えば、スラグSの排滓作業を開始する前の湯面(スラグSの厚みが最も大きいと考えられる湯面)、排滓作業中期の湯面、および排滓作業終了後の湯面(スラグSの厚みが最も小さいと考えられる湯面)を例示できる。
得られた撮像画像は、画像処理手段2に記憶される。
また、本実施形態では、第1撮像手段1の視野が、容器4の湯面だけでなく、容器4および背景Bも視野内に含まれるように設定されている。なお、容器4の湯面だけが視野内に含まれるように第1撮像手段1の視野を設定してもよい。
なお、容器4に対応する画素領域および背景Bに対応する画素領域は、容器4および背景Bの温度が溶融金属MおよびスラグSよりも低いため、実際には暗く(濃度が小さく)なるが、図示の便宜上、溶融金属Mに対応する画素領域と同様に白で示している。
図4に示すように、溶融金属Mから熱放射により放射された放射光SRは、一部がスラグS1~S3に吸収される。一方、スラグS1~S3を透過した放射光SRは透過光TI1~TI3となり、これら透過光TI1~TI3は第1撮像手段1に入射する。
スラグの厚みが大きいほど、スラグによる放射光SRの吸収が大きくなるため、スラグS1を透過した透過光TI1、スラグS2を透過した透過光TI2、およびスラグS3を透過した透過光TI3の順に光の強度が大きくなる。これにより、図3に示す撮像画像において、スラグS1、スラグS2、及びスラグS3の順に、画素領域が明るくなっている。
具体的には、各スラグS1~S3に対応する画素領域の平均濃度を算出する。各スラグS1~S3に対応する画素領域は、例えば、撮像画像を画像処理手段2のモニターに表示し、これを操業者が目視することで認識可能である。そして、例えば、マウス等のポインティングデバイスを用いて指定した輪郭内の平均濃度等を算出するプログラムを画像処理手段2にインストールしておけば、操業者がモニターを目視しながら各スラグS1~S3の輪郭を指定することで、画像処理手段2が自動的に各スラグS1~S3に対応する画素領域の平均濃度を算出可能である。
図3に示す例では、スラグS1~S3の各々に掻き板51の下端部を順次埋没させて上記の手順を実行し、各スラグS1~S3の厚みを測定する。
I=I0×e-aK ・・・(1)
次に、撮像工程ST2では、第1撮像手段1によって、評価対象とする湯面を撮像する。この際、第1撮像手段1が具備するレンズの絞り、および第1撮像手段1から出力されるビデオ信号のゲイン等の撮像条件は、準備工程ST1で設定した条件と同一とする。
スラグ体積算出工程ST3では、画像処理手段2が、撮像工程ST2で得られた撮像画像を構成する各画素の濃度Iの値と、準備工程ST1で算出した近似曲線とに基づき、撮像工程ST2で得られた撮像画像を構成する画素毎にスラグSの厚みKを算出する。この際、算出されるスラグSの厚みKを濃度Iの関数とするため、上記の式(1)を変形して得られる下記の式(2)を用いる。なお、下記の式(2)の「ln」は自然対数を意味する。
K(I)=(-1/a)×ln(I/I0) ・・・(2)
図6Aの破線Aで囲まれた画素領域中に、濃度が50、100、150の画素領域が存在するとすれば、図6Bに示す近似曲線に基づき(上記の式(2)に基づき)、厚み181mm、104mm、59mmが算出される。
スラグ体積算出工程ST3では、破線Aで囲まれた画素領域について説明した上記の処理を、撮像工程ST2で得られた撮像画像を構成する各画素について実行する。
したがって、例えば、撮像画像を構成する全ての画素中、容器4に対応する画素領域よりも内側に位置する画素だけを、厚みを算出する対象にする。一般に、排滓作業を行うときの容器4の位置は固定されている場合が多く、この場合、撮像画像中の容器4および背景Bに対応する画素領域の位置は変動しないことになる。このため、撮像画像中の容器4に対応する画素領域よりも内側に位置する画素の座標を予め設定して画像処理手段2に記憶しておくことで、当該画素領域よりも内側に位置する画素についてのみ厚みを算出することができる。
また、例えば、撮像画像を構成する全ての画素(容器4及び背景Bに対応する画素も含む)について厚みを算出した後、容器4に対応する画素領域よりも内側に位置する画素についての厚みだけを積算してもよい。
また、容器4及び背景Bに対応する画素領域の濃度は、溶融金属M及びスラグSに対応する画素領域の濃度よりも小さくなるのが一般的であるため、例えば、所定のしきい値以上の濃度を有する画素だけを対象にしてもよい。
また、撮像画像を構成する全ての画素の厚みを算出した後、前記所定のしきい値以上の濃度を有する画素についての厚みだけを積算してもよい。前記所定のしきい値は、溶融金属MおよびスラグSに対応する画素領域の濃度と、容器4及び背景Bに対応する画素領域の濃度とを識別可能な値である。
また、例えば、容器4内の湯面だけが撮像されるように、第1撮像手段1の視野を予め調整してもよい。ただし、視野を小さくし過ぎると、スラグSの一部が視野外となり、スラグSの体積を精度良く算出できないおそれがあるため、容器4が写らない範囲で可能な限り大きな視野に調整することが好ましい。
なお、溶融金属Mに対応する画素領域は、算出対象にしてもよいし、しなくてもよい。溶融金属Mに対応する画素領域の濃度はI0(本実施形態では255)であるため、上記の式(2)で算出される厚みK(I0)がゼロとなる。そのため、仮に溶融金属Mに対応する画素領域について厚みを算出し、後述の積算に加えたとしても、算出されるスラグSの体積に誤差は生じないからである。
具体的には、排滓作業の開始時刻を始点とする時刻tにおいて撮像した撮像画像について、濃度Iの画素の総数をNs(t,I)とすると、画像処理手段2は、例えば、下記の式(3)に基づき、時刻tにおけるスラグSの体積V(t)を算出する。下記の式(3)において、Ithは、溶融金属MおよびスラグSに対応する画素領域の濃度と、容器4および背景Bに対応する画素領域の濃度とを識別可能な前述の所定のしきい値を意味する。なお、下記の式(3)で算出される体積の単位は、画素×画素×厚み(mm)であるが、第1撮像手段1の撮像倍率等に基づき、1画素当たりの分解能(実寸)を予め求めておけば、実寸単位で体積を算出できる。

次に、容器4を傾けた状態で、排滓機5を用いて容器4外へスラグSの一部を掻き出す(図1参照)。すなわち、排滓工程ST4では、容器4内の全てのスラグを掻き出さず、スラグSの一部が容器4内に残るように排滓作業を行う。
撮像工程ST5では、排滓工程ST4後の容器4内の湯面を撮像する。なお、撮像条件等は、上記撮像工程ST2と同様である。
スラグ体積算出工程ST6では、撮像工程ST5で得られた撮像画像に基づき、排滓工程ST4後の容器4内のスラグの体積を算出する。なお、算出方法は、上述したスラグ体積算出工程ST3と同様である。
スラグ残存率算出工程ST7では、画像処理手段2が、スラグ体積算出工程ST6で算出したスラグSの体積(排滓工程ST4後に撮像した撮像画像に基づいて算出したスラグSの体積)を、スラグ体積算出工程ST3で算出したスラグSの体積(排滓工程ST4前に撮像した撮像画像に基づいて算出したスラグSの体積)で除算して、容器4内のスラグSの残存率を算出する。すなわち、画像処理手段2は、下記の式(4)に基づき、時刻tにおけるスラグSの残存率Ps(t)を算出する。算出したスラグSの残存率Ps(t)は、画像処理手段2に記憶され、モニターに表示される。
Ps(t)=V(t)/V(0) ・・・(4)
Qs(t)=1-Ps(t) ・・・(5)
一方、排滓作業を終了しない場合(図2のST8において「No」の場合)、排滓工程ST4、撮像工程ST5、スラグ体積算出工程ST6、及びスラグ残存率算出工程ST7を繰り返し実行する。
排滓作業の前工程において、サンプル分析を用いれば、スラグを生成させる前の溶融金属中の硫黄成分の含有率と、スラグを生成させた後(脱硫精錬後)の溶融金属中の硫黄成分の含有率とを測定可能であり、両測定結果に基づき、排滓作業を開始する前の容器内のスラグ中の硫黄成分の含有量を算出可能である(含有率差×溶融金属量=スラグ中の硫黄成分の含有量)。
本実施形態によれば、スラグ残存率算出工程ST7によって容器4内のスラグの残存率を算出できるため、算出したスラグの残存率と、前述のように算出した排滓作業開始前の容器内のスラグ中の硫黄成分の含有量とから、排滓作業開始後の容器内のスラグ中の硫黄成分の含有量を算出可能である。そして、この算出した排滓作業開始後の容器内のスラグ中の硫黄成分の含有量と、前述のようにサンプル分析を用いて算出した脱硫精錬後の溶融金属中の硫黄成分の含有量とを用い、後工程での処理時におけるスラグから溶融金属への複硫率を踏まえ、後工程での処理時における溶融金属中の硫黄成分の含有量を予測可能である。
したがって、溶融金属に要求される硫黄成分の含有率に応じてスラグ残存率を決定できる(排滓作業の終了を決定できる)。これにより、後工程における溶融金属の成分調整を好適化できるという利点を有する。
具体的には、熟練の操業者が、容器4内の湯面を目視で確認しながら、排滓作業終了時のスラグSの排滓率が0.7~0.8となるように排滓作業を行った。この排滓作業の際、本実施形態に係るスラグ体積評価方法を用いて、排滓作業終了時のスラグSの残存率Ps(t)を算出し、上記の式(5)によりスラグSの排滓率を求めた。また、この排滓作業の際、特許文献1に記載の方法を用いて算出した、排滓作業開始前および排滓作業終了時のスラグSの面積からスラグSの残存率を算出し、上記の式(5)によりスラグSの排滓率を求めた。
以上の試験を、3回繰り返した。結果を図7に示す。
図7に示すように、特許文献1に記載の方法を用いて求めた、スラグSの排滓率が0.70±0.08であるのに対し、本実施形態に係るスラグ体積評価方法を用いて求めた、スラグSの排滓率は0.98±0.06であった。すなわち、本実施形態に係るスラグ体積評価方法によるスラグSの排滓率の方が、特許文献1に記載の方法による排滓率よりも熟練操業者の感覚に近く、正確であると考えられる。
I=I0/(aK2+bK+1) ・・・(6)
I=I0/(aK3+bK2+cK+1) ・・・(7)
また、例えば、上記1組のレーザ距離計を用い、一方のレーザ距離計でスラグSの上面までの距離を計測すると共に、他方のレーザ距離計で溶融金属Mの表面までの距離を計測し、これら計測結果の差分からスラグSの厚みKを測定してもよい。また、測定棒を用いてスラグSの厚みKを測定してもよい。なお、これらの場合、距離H1を測定する必要はない。
2: 画像処理手段
3: 第2撮像手段
4: 容器
5: 排滓機
100: スラグ体積評価装置
M: 溶融金属
S: スラグ
Claims (2)
- 容器内に収容された溶融金属の表面に浮上しているスラグの体積を、前記容器内の湯面の撮像画像に基づいて評価する方法であって、
前記溶融金属の表面に浮上している、互いに厚みの異なる複数のスラグの厚みを測定すると共に、前記複数のスラグが前記溶融金属の表面に浮上している状態で前記容器内の湯面を撮像して得られた撮像画像における、前記複数のスラグに対応する画素領域の濃度に相関を有する濃度パラメータの値を算出することで、スラグの厚みと前記濃度パラメータとの対応関係を示す近似曲線を予め算出する準備工程と;
評価対象とする湯面を撮像する撮像工程と;
前記撮像工程で得られた撮像画像を構成する各画素の前記濃度パラメータの値と、前記準備工程で算出した前記近似曲線とに基づき、前記撮像工程で得られた撮像画像を構成する画素毎にスラグの厚みを算出し、前記算出した画素毎のスラグの厚みを積算することで、スラグの体積を算出するスラグ体積算出工程と;
を有することを特徴とする溶融金属表面のスラグ体積評価方法。 - 前記容器内のスラグを排滓する排滓工程と;
前記容器内のスラグの残存率を算出するスラグ残存率算出工程と;
をさらに有し、
前記撮像工程で、前記排滓工程前の前記容器内の湯面と、前記排滓工程後の前記容器内の湯面とを撮像し、
前記スラグ体積算出工程で、前記排滓工程前の前記容器内のスラグの体積と、前記排滓工程後の前記容器内のスラグの体積とを算出し、
前記スラグ残存率算出工程で、前記排滓工程後の前記容器内のスラグの体積を、前記排滓工程前の前記容器内のスラグの体積で除算して、前記容器内のスラグの残存率を算出する
ことを特徴とする請求項1に記載の溶融金属表面のスラグ体積評価方法。
Priority Applications (8)
| Application Number | Priority Date | Filing Date | Title |
|---|---|---|---|
| EP17879407.9A EP3553463A4 (en) | 2016-12-06 | 2017-12-06 | PROCESS FOR EVALUATING THE VOLUME OF SLAG ON A MELTED METAL SURFACE |
| CN202410005339.4A CN117804568A (zh) | 2016-12-06 | 2017-12-06 | 熔融金属表面的渣体积评价方法 |
| US16/466,154 US10845352B2 (en) | 2016-12-06 | 2017-12-06 | Slag volume evaluation method for molten metal surface |
| KR1020197015565A KR102189118B1 (ko) | 2016-12-06 | 2017-12-06 | 용융 금속 표면의 슬래그 체적 평가 방법 |
| BR112019010774-6A BR112019010774B1 (pt) | 2016-12-06 | 2017-12-06 | Método de avaliação do volume de escória para uma superfície de metal fundido |
| JP2018555038A JP6687125B2 (ja) | 2016-12-06 | 2017-12-06 | 溶融金属表面のスラグ体積評価方法 |
| CN201780075201.XA CN110036257A (zh) | 2016-12-06 | 2017-12-06 | 熔融金属表面的渣体积评价方法 |
| CA3045408A CA3045408A1 (en) | 2016-12-06 | 2017-12-06 | Slag volume evaluation method for molten metal surface |
Applications Claiming Priority (2)
| Application Number | Priority Date | Filing Date | Title |
|---|---|---|---|
| JP2016236936 | 2016-12-06 | ||
| JP2016-236936 | 2016-12-06 |
Publications (1)
| Publication Number | Publication Date |
|---|---|
| WO2018105652A1 true WO2018105652A1 (ja) | 2018-06-14 |
Family
ID=62492296
Family Applications (1)
| Application Number | Title | Priority Date | Filing Date |
|---|---|---|---|
| PCT/JP2017/043809 Ceased WO2018105652A1 (ja) | 2016-12-06 | 2017-12-06 | 溶融金属表面のスラグ体積評価方法 |
Country Status (8)
| Country | Link |
|---|---|
| US (1) | US10845352B2 (ja) |
| EP (1) | EP3553463A4 (ja) |
| JP (1) | JP6687125B2 (ja) |
| KR (1) | KR102189118B1 (ja) |
| CN (2) | CN117804568A (ja) |
| CA (1) | CA3045408A1 (ja) |
| TW (1) | TWI657880B (ja) |
| WO (1) | WO2018105652A1 (ja) |
Cited By (6)
| Publication number | Priority date | Publication date | Assignee | Title |
|---|---|---|---|---|
| JP2020112429A (ja) * | 2019-01-11 | 2020-07-27 | 日本製鉄株式会社 | スラグの定量化方法 |
| TWI700372B (zh) * | 2019-09-11 | 2020-08-01 | 中國鋼鐵股份有限公司 | 高爐設備及高爐爐渣液位之監測方法 |
| CN112828275A (zh) * | 2020-12-30 | 2021-05-25 | 北京首钢自动化信息技术有限公司 | 一种自动扒渣方法、装置及系统 |
| CN113033335A (zh) * | 2021-03-08 | 2021-06-25 | 柳州钢铁股份有限公司 | 一种基于炉渣智能分析及三维模型的转炉留渣量计算方法 |
| JP2021133377A (ja) * | 2020-02-25 | 2021-09-13 | スズキ株式会社 | 溶解炉湯面検出方法及び装置 |
| WO2023275385A1 (en) * | 2021-07-02 | 2023-01-05 | Noda Technologies Ab | A method for determining at least one property of an aluminium production bath in of an aluminium production cell, a system for determining the at least one property, and a probe for capturing a sample from the aluminium production cell |
Families Citing this family (11)
| Publication number | Priority date | Publication date | Assignee | Title |
|---|---|---|---|---|
| WO2019227224A1 (en) * | 2018-06-01 | 2019-12-05 | Dynamic Concept Inc. | System for measuring level and quality of a metal in a furnace |
| KR102251035B1 (ko) * | 2019-09-30 | 2021-05-12 | 주식회사 포스코 | 슬래그 배재 장치 및 슬래그 배재 방법 |
| CN110666150A (zh) * | 2019-10-09 | 2020-01-10 | 长沙有色冶金设计研究院有限公司 | 金属铸锭扒渣系统及方法 |
| CN113096083B (zh) * | 2021-03-30 | 2022-11-01 | 湖南镭目科技有限公司 | 一种对炉口钢渣的识别方法、装置、设备及存储介质 |
| CN113986896B (zh) * | 2021-10-14 | 2024-07-23 | 中冶南方工程技术有限公司 | 一种渣皮厚度数据滤波的方法和装置 |
| KR102670728B1 (ko) * | 2022-05-11 | 2024-05-30 | 주식회사 포스코 | 슬래그의 식별 방법, 슬래그의 배재 방법 및 슬래그 배재 장치 |
| CN117165733B (zh) * | 2022-05-27 | 2026-05-19 | 宝山钢铁股份有限公司 | 一种转炉自动倒渣的渣量实时识别方法及系统 |
| CN115631164B (zh) * | 2022-10-23 | 2025-11-28 | 甘肃东兴铝业有限公司 | 一种铝熔体炉内精炼工艺水平的评价方法 |
| CN117428183B (zh) * | 2023-12-20 | 2024-03-26 | 苏州朗信智能科技有限公司 | 基于图像识别的扒渣控制方法、系统、设备及介质 |
| CN119489184B (zh) * | 2024-09-27 | 2025-10-31 | 武汉钢铁有限公司 | 一种中包水口的检测方法、装置、电子设备及存储介质 |
| CN119979949A (zh) * | 2025-04-10 | 2025-05-13 | 宁波得鑫科技有限公司 | 一种镁铝合金生产方法及系统 |
Citations (7)
| Publication number | Priority date | Publication date | Assignee | Title |
|---|---|---|---|---|
| US3080755A (en) * | 1960-10-12 | 1963-03-12 | Percy James Ward | Metallurgical process control |
| JP2002523753A (ja) * | 1998-08-18 | 2002-07-30 | ユーエスエックス エンジニアーズ アンド コンサルタンツ,インコーポレーテツド | 物質の厚さの測定 |
| JP2003013129A (ja) * | 2001-07-03 | 2003-01-15 | Nkk Corp | スラグ検知方法、スラグ検知装置、及び除滓装置 |
| JP2003019553A (ja) | 2001-07-03 | 2003-01-21 | Nkk Corp | スラグ検知方法、スラグ検知装置及び除滓装置 |
| JP2004144652A (ja) * | 2002-10-25 | 2004-05-20 | Fuji Photo Film Co Ltd | 被検物測定装置 |
| JP2007119837A (ja) * | 2005-10-27 | 2007-05-17 | Nippon Steel Corp | 極低硫含クロム溶鋼の製造方法 |
| JP2013160627A (ja) * | 2012-02-03 | 2013-08-19 | Nippon Steel & Sumitomo Metal | 高炉出銑温度測定方法、高炉出銑温度測定システム、コンピュータプログラム、及びコンピュータ読み取り可能な記憶媒体 |
Family Cites Families (19)
| Publication number | Priority date | Publication date | Assignee | Title |
|---|---|---|---|---|
| US5301621A (en) * | 1993-05-17 | 1994-04-12 | Rollins Environmental Services, Inc. | Slag viscosity detection through image analysis of dripping slag within rotary incineration kilns |
| US5694480A (en) * | 1995-08-30 | 1997-12-02 | Tsukishima Kikai Co., Ltd. | Molten slag flow rate measuring device and furnace facilities using the same |
| DE19614760A1 (de) | 1996-04-02 | 1997-10-09 | Mannesmann Ag | Verfahren zur Optimierung der Strangoberflächenqualität |
| US5968227A (en) * | 1997-11-13 | 1999-10-19 | Bethlehem Steel Corporation | System and method for minimizing slag carryover during the tapping of a BOF converter in the production of steel |
| US6197086B1 (en) * | 1997-11-13 | 2001-03-06 | Bethlehem Steel Corporation | System and method for minimizing slag carryover during the production of steel |
| US6130637A (en) * | 1998-08-18 | 2000-10-10 | Usx Corporation | Measuring the thickness of hot slag in steelmaking |
| US6562285B1 (en) * | 2000-11-15 | 2003-05-13 | Metallurgical Sensors, Inc. | Method and apparatus for detecting slag carryover |
| US6576039B2 (en) | 2001-07-02 | 2003-06-10 | Tetron, Inc. | Method and apparatus for metal pouring |
| EP1424543B1 (en) * | 2001-07-27 | 2014-05-21 | Nippon Steel & Sumitomo Metal Corporation | Molten metal temperature measuring instrument |
| CN1238138C (zh) * | 2002-12-20 | 2006-01-25 | 宝山钢铁股份有限公司 | 自动扒渣方法 |
| US7468090B2 (en) * | 2005-11-28 | 2008-12-23 | Nupro Corporation | Method for tapping a steel making furnace |
| JP5448669B2 (ja) * | 2009-09-17 | 2014-03-19 | 三菱重工業株式会社 | 石炭ガス化炉のスラグ監視装置及び石炭ガス化炉 |
| CN102183288B (zh) | 2011-03-03 | 2013-01-02 | 浙江大学 | 基于远程红外监测的精炼铝用量控制方法 |
| GB2508323A (en) * | 2011-09-29 | 2014-05-28 | Ramchandra Harisa Tupkary | Slag ladle for separation and recovery of molten iron from slag |
| DE102012211714A1 (de) * | 2012-07-05 | 2014-05-22 | Siemens Vai Metals Technologies Gmbh | Verfahren und Vorrichtung zur Detektion des Schlackepegels in einem metallurgischen Gefäß |
| CN103063150A (zh) * | 2012-12-19 | 2013-04-24 | 浙江大学 | 基于数字图像处理技术的灰渣厚度监测方法及装置 |
| EP3029160B1 (en) * | 2013-07-29 | 2018-04-25 | JFE Steel Corporation | Abnormality detection method and blast-furnace operation method |
| CN104232837B (zh) * | 2014-09-24 | 2016-08-24 | 杭州谱诚泰迪实业有限公司 | 一种转炉/电炉出钢监测装置及控制方法 |
| CN105160683B (zh) * | 2015-09-29 | 2019-01-15 | 田陆 | 一种基于人工干预的铁水扒渣检测与控制系统及其方法 |
-
2017
- 2017-12-06 EP EP17879407.9A patent/EP3553463A4/en not_active Withdrawn
- 2017-12-06 CN CN202410005339.4A patent/CN117804568A/zh active Pending
- 2017-12-06 JP JP2018555038A patent/JP6687125B2/ja active Active
- 2017-12-06 CN CN201780075201.XA patent/CN110036257A/zh active Pending
- 2017-12-06 US US16/466,154 patent/US10845352B2/en active Active
- 2017-12-06 KR KR1020197015565A patent/KR102189118B1/ko active Active
- 2017-12-06 TW TW106142738A patent/TWI657880B/zh not_active IP Right Cessation
- 2017-12-06 CA CA3045408A patent/CA3045408A1/en not_active Abandoned
- 2017-12-06 WO PCT/JP2017/043809 patent/WO2018105652A1/ja not_active Ceased
Patent Citations (7)
| Publication number | Priority date | Publication date | Assignee | Title |
|---|---|---|---|---|
| US3080755A (en) * | 1960-10-12 | 1963-03-12 | Percy James Ward | Metallurgical process control |
| JP2002523753A (ja) * | 1998-08-18 | 2002-07-30 | ユーエスエックス エンジニアーズ アンド コンサルタンツ,インコーポレーテツド | 物質の厚さの測定 |
| JP2003013129A (ja) * | 2001-07-03 | 2003-01-15 | Nkk Corp | スラグ検知方法、スラグ検知装置、及び除滓装置 |
| JP2003019553A (ja) | 2001-07-03 | 2003-01-21 | Nkk Corp | スラグ検知方法、スラグ検知装置及び除滓装置 |
| JP2004144652A (ja) * | 2002-10-25 | 2004-05-20 | Fuji Photo Film Co Ltd | 被検物測定装置 |
| JP2007119837A (ja) * | 2005-10-27 | 2007-05-17 | Nippon Steel Corp | 極低硫含クロム溶鋼の製造方法 |
| JP2013160627A (ja) * | 2012-02-03 | 2013-08-19 | Nippon Steel & Sumitomo Metal | 高炉出銑温度測定方法、高炉出銑温度測定システム、コンピュータプログラム、及びコンピュータ読み取り可能な記憶媒体 |
Non-Patent Citations (1)
| Title |
|---|
| See also references of EP3553463A4 |
Cited By (10)
| Publication number | Priority date | Publication date | Assignee | Title |
|---|---|---|---|---|
| JP2020112429A (ja) * | 2019-01-11 | 2020-07-27 | 日本製鉄株式会社 | スラグの定量化方法 |
| JP7256365B2 (ja) | 2019-01-11 | 2023-04-12 | 日本製鉄株式会社 | スラグの定量化方法 |
| TWI700372B (zh) * | 2019-09-11 | 2020-08-01 | 中國鋼鐵股份有限公司 | 高爐設備及高爐爐渣液位之監測方法 |
| JP2021133377A (ja) * | 2020-02-25 | 2021-09-13 | スズキ株式会社 | 溶解炉湯面検出方法及び装置 |
| JP7472536B2 (ja) | 2020-02-25 | 2024-04-23 | スズキ株式会社 | 溶解炉湯面検出方法及び装置 |
| CN112828275A (zh) * | 2020-12-30 | 2021-05-25 | 北京首钢自动化信息技术有限公司 | 一种自动扒渣方法、装置及系统 |
| CN112828275B (zh) * | 2020-12-30 | 2022-08-09 | 北京首钢自动化信息技术有限公司 | 一种自动扒渣方法、装置及系统 |
| CN113033335A (zh) * | 2021-03-08 | 2021-06-25 | 柳州钢铁股份有限公司 | 一种基于炉渣智能分析及三维模型的转炉留渣量计算方法 |
| CN113033335B (zh) * | 2021-03-08 | 2021-10-08 | 柳州钢铁股份有限公司 | 一种基于炉渣智能分析及三维模型的转炉留渣量计算方法 |
| WO2023275385A1 (en) * | 2021-07-02 | 2023-01-05 | Noda Technologies Ab | A method for determining at least one property of an aluminium production bath in of an aluminium production cell, a system for determining the at least one property, and a probe for capturing a sample from the aluminium production cell |
Also Published As
| Publication number | Publication date |
|---|---|
| TW201827143A (zh) | 2018-08-01 |
| US10845352B2 (en) | 2020-11-24 |
| KR102189118B1 (ko) | 2020-12-09 |
| KR20190077049A (ko) | 2019-07-02 |
| TWI657880B (zh) | 2019-05-01 |
| US20200064326A1 (en) | 2020-02-27 |
| CN117804568A (zh) | 2024-04-02 |
| EP3553463A4 (en) | 2020-07-29 |
| EP3553463A1 (en) | 2019-10-16 |
| JP6687125B2 (ja) | 2020-04-22 |
| BR112019010774A2 (pt) | 2019-10-01 |
| CA3045408A1 (en) | 2018-06-14 |
| CN110036257A (zh) | 2019-07-19 |
| JPWO2018105652A1 (ja) | 2019-06-24 |
Similar Documents
| Publication | Publication Date | Title |
|---|---|---|
| JP6687125B2 (ja) | 溶融金属表面のスラグ体積評価方法 | |
| CN100588957C (zh) | 图像检查方法以及使用了该方法的图像检查装置 | |
| CN107735674B (zh) | 表面缺陷检测装置、表面缺陷检测方法及钢材的制造方法 | |
| JP2017003404A (ja) | 欠陥検査方法および装置 | |
| JP6451839B2 (ja) | 形状検査方法、形状検査装置及びプログラム | |
| JP2006119110A (ja) | 高炉出銑温度測定方法及び測定装置 | |
| JP2012026820A (ja) | ブラスト後の除錆度検査システム | |
| WO2015146744A1 (ja) | 工具検査方法及び工具検査装置 | |
| JP7256365B2 (ja) | スラグの定量化方法 | |
| JP6988705B2 (ja) | 鋳片気泡欠陥の非破壊検査方法 | |
| JP5949690B2 (ja) | 評価方法及び評価装置 | |
| JP7584471B2 (ja) | デブリ判定方法 | |
| KR101309649B1 (ko) | 전로 출강구 슬리브의 내화물 손모량 측정장치 및 그 방법 | |
| JP2012078143A (ja) | 異物検査装置及びアライメント調整方法 | |
| JP2005252451A (ja) | 画質検査方法及び画質検査装置 | |
| JP2008151653A (ja) | 検査装置、検査方法、検査プログラムおよび検査システム | |
| EP3584328A1 (en) | Method for detecting slag in molten steel flow | |
| JP3566625B2 (ja) | プローブ痕深さ測定装置 | |
| BR112019010774B1 (pt) | Método de avaliação do volume de escória para uma superfície de metal fundido | |
| CN121633089A (zh) | 一种实现背照式激光探测器正背面外观缺陷检测方法 | |
| JP4946306B2 (ja) | 欠陥検査装置における照明角度設定方法 | |
| JP5073582B2 (ja) | 欠陥計数装置及び欠陥計数方法 | |
| KR101710110B1 (ko) | 비파괴 검사장치의 영상 판독 방법 | |
| JP2025139723A (ja) | 不良検知装置及び不良検知方法 | |
| JP2025115812A (ja) | 鋳型の表面粗さを評価する装置及びプログラム |
Legal Events
| Date | Code | Title | Description |
|---|---|---|---|
| 121 | Ep: the epo has been informed by wipo that ep was designated in this application |
Ref document number: 17879407 Country of ref document: EP Kind code of ref document: A1 |
|
| ENP | Entry into the national phase |
Ref document number: 2018555038 Country of ref document: JP Kind code of ref document: A |
|
| ENP | Entry into the national phase |
Ref document number: 3045408 Country of ref document: CA |
|
| ENP | Entry into the national phase |
Ref document number: 20197015565 Country of ref document: KR Kind code of ref document: A |
|
| REG | Reference to national code |
Ref country code: BR Ref legal event code: B01A Ref document number: 112019010774 Country of ref document: BR |
|
| NENP | Non-entry into the national phase |
Ref country code: DE |
|
| ENP | Entry into the national phase |
Ref document number: 2017879407 Country of ref document: EP Effective date: 20190708 |
|
| ENP | Entry into the national phase |
Ref document number: 112019010774 Country of ref document: BR Kind code of ref document: A2 Effective date: 20190527 |