WO2018116546A1 - レール検査システム - Google Patents
レール検査システム Download PDFInfo
- Publication number
- WO2018116546A1 WO2018116546A1 PCT/JP2017/032723 JP2017032723W WO2018116546A1 WO 2018116546 A1 WO2018116546 A1 WO 2018116546A1 JP 2017032723 W JP2017032723 W JP 2017032723W WO 2018116546 A1 WO2018116546 A1 WO 2018116546A1
- Authority
- WO
- WIPO (PCT)
- Prior art keywords
- signal
- oscillation
- rail
- unit
- inspection
- Prior art date
- Legal status (The legal status is an assumption and is not a legal conclusion. Google has not performed a legal analysis and makes no representation as to the accuracy of the status listed.)
- Ceased
Links
Images


Classifications
-
- G—PHYSICS
- G01—MEASURING; TESTING
- G01N—INVESTIGATING OR ANALYSING MATERIALS BY DETERMINING THEIR CHEMICAL OR PHYSICAL PROPERTIES
- G01N27/00—Investigating or analysing materials by the use of electric, electrochemical, or magnetic means
- G01N27/72—Investigating or analysing materials by the use of electric, electrochemical, or magnetic means by investigating magnetic variables
- G01N27/82—Investigating or analysing materials by the use of electric, electrochemical, or magnetic means by investigating magnetic variables for investigating the presence of flaws
- G01N27/83—Investigating or analysing materials by the use of electric, electrochemical, or magnetic means by investigating magnetic variables for investigating the presence of flaws by investigating stray magnetic fields
- G01N27/87—Investigating or analysing materials by the use of electric, electrochemical, or magnetic means by investigating magnetic variables for investigating the presence of flaws by investigating stray magnetic fields using probes
-
- G—PHYSICS
- G01—MEASURING; TESTING
- G01N—INVESTIGATING OR ANALYSING MATERIALS BY DETERMINING THEIR CHEMICAL OR PHYSICAL PROPERTIES
- G01N27/00—Investigating or analysing materials by the use of electric, electrochemical, or magnetic means
- G01N27/72—Investigating or analysing materials by the use of electric, electrochemical, or magnetic means by investigating magnetic variables
- G01N27/82—Investigating or analysing materials by the use of electric, electrochemical, or magnetic means by investigating magnetic variables for investigating the presence of flaws
- G01N27/83—Investigating or analysing materials by the use of electric, electrochemical, or magnetic means by investigating magnetic variables for investigating the presence of flaws by investigating stray magnetic fields
-
- B—PERFORMING OPERATIONS; TRANSPORTING
- B61—RAILWAYS
- B61K—AUXILIARY EQUIPMENT SPECIALLY ADAPTED FOR RAILWAYS, NOT OTHERWISE PROVIDED FOR
- B61K9/00—Railway vehicle profile gauges; Detecting or indicating overheating of components; Apparatus on locomotives or cars to indicate bad track sections; General design of track recording vehicles
- B61K9/08—Measuring installations for surveying permanent way
- B61K9/10—Measuring installations for surveying permanent way for detecting cracks in rails or welds thereof
-
- B—PERFORMING OPERATIONS; TRANSPORTING
- B61—RAILWAYS
- B61L—GUIDING RAILWAY TRAFFIC; ENSURING THE SAFETY OF RAILWAY TRAFFIC
- B61L23/00—Control, warning or like safety means along the route or between vehicles or trains
- B61L23/04—Control, warning or like safety means along the route or between vehicles or trains for monitoring the mechanical state of the route
- B61L23/042—Track changes detection
- B61L23/044—Broken rails
-
- G—PHYSICS
- G01—MEASURING; TESTING
- G01N—INVESTIGATING OR ANALYSING MATERIALS BY DETERMINING THEIR CHEMICAL OR PHYSICAL PROPERTIES
- G01N27/00—Investigating or analysing materials by the use of electric, electrochemical, or magnetic means
- G01N27/72—Investigating or analysing materials by the use of electric, electrochemical, or magnetic means by investigating magnetic variables
- G01N27/82—Investigating or analysing materials by the use of electric, electrochemical, or magnetic means by investigating magnetic variables for investigating the presence of flaws
-
- G—PHYSICS
- G01—MEASURING; TESTING
- G01N—INVESTIGATING OR ANALYSING MATERIALS BY DETERMINING THEIR CHEMICAL OR PHYSICAL PROPERTIES
- G01N2291/00—Indexing codes associated with group G01N29/00
- G01N2291/26—Scanned objects
- G01N2291/262—Linear objects
- G01N2291/2623—Rails; Railroads
Definitions
- the present invention relates to a rail inspection system.
- the present technology provides a test apparatus for testing the integrity of a material in a test object.
- the electrical conductor generally extends in a linear direction and generally conducts current in a direction across the longitudinal axis of the test object.
- the path of the flowing current affects the magnetic field around the test object and indirectly generates eddy currents, and the test device is arranged at a position away from the electrical conductor and flows through the electrical conductor. It is provided with a detecting device for detecting a magnetic field generated according to the above.
- the rail inspection system of the present invention is arranged in a direction crossing the laying direction of the railroad rail, facing the railroad rail to be inspected, and an oscillation unit that outputs an oscillation signal of a predetermined frequency.
- Each receiving coil and when the oscillation signal is supplied, a first oscillation coil and a second oscillation coil that generate alternating magnetic fields opposite to each other at a location where the reception coil is provided,
- the first output signal is output with respect to the output signal output from each of the plurality of receiving coils.
- a plurality of detectors for detecting a first inspection signal corresponding to the phase and a second inspection signal corresponding to the second phase of the output signal.
- FIG. 3 It is a block diagram which shows the whole structure of the rail inspection system by 3rd Embodiment.
- 3 is an example of a waveform diagram of a cosine signal X.
- FIG. It is a circuit diagram of the principal part of the rail inspection system in a 4th embodiment. It is a circuit diagram of the modification of 4th Embodiment.
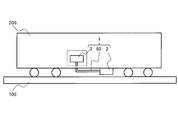
- FIG. 1 is a schematic diagram of a rail inspection system 1 according to a first embodiment of the present invention.
- the rail inspection system 1 includes a detection device 2, a processing device 3, and a cable 60 that connects the two.
- the rail inspection system 1 is mounted on, for example, a self-propelled inspection vehicle 200, the detection device 2 is installed at a position facing the railroad rail 100 that is an inspection object, and the processing device 3 is an inspection device. It is installed in the room of the survey vehicle 200.
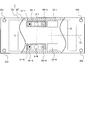
- FIG. 2 is a perspective view of the detection device 2.
- the detection device 2 includes a housing 20 formed in a hollow rectangular parallelepiped shape, and a rectangular plate-like flange 25 fixed to the upper surface of the housing 20. Through holes 25 a are formed at four corners of the flange 25.
- positions the detection apparatus 2 in the inspection vehicle 200 is equipped with the screw hole (not shown) in the position facing the through-hole 25a.
- the detection device 2 is fixed at a predetermined position of the inspection vehicle 200 by inserting a bolt into the through hole 25a and tightening the bolt into the screw hole.
- the flange 25 is a jig for installing the detection device 2 for the railroad rail 100 at a predetermined position.
- a sensor unit group 21 and an amplification / filter unit group 22 are fixed to the bottom surface of the housing 20.
- FIG. 3 is a partially cutaway plan view of the detection device 2.
- the sensor unit group 21 has N (N is a plurality) sensor units 21-1 to 21-N arranged in a plurality so as to form a line in the width direction of the rail 100.
- the amplification / filter unit group 22 has the same number of amplification / filter units 22-1 to 22-N.
- the sensor units 21-1 to 21-N respectively include oscillation coils 5A-1 to 5A-N (first oscillation coil), oscillation coils 5B-1 to 5B-N (second oscillation coil), and reception. And coils 6-1 to 6-N. These coils are formed by winding a coated copper wire.
- the oscillation coil 5A-k (where 1 ⁇ k ⁇ N), the reception coil 6-k, and the oscillation coil 5B-k are arranged along the laying direction of the rail 100 (see FIG. 1), and the reception coil 6-k are arranged at equal intervals between the oscillation coil 5A-k and the oscillation coil 5B-k.
- An alternating current having a predetermined oscillation frequency f (predetermined frequency) is supplied from the processing device 3 (see FIG. 1) to the oscillation coils 5A-k and 5B-k via the cable 60.
- f predetermined frequency
- the amplification / filter unit 22-k performs amplification and filter processing on the induced voltage generated in the reception coil 6-k, and transmits the result to the processing device 3 via the cable 60 (see FIG. 1).
- the processing device 3 performs an analysis process on the received signal and detects a defect in the rail 100.
- the casing 20 is preferably made of a non-magnetic material, and a material excellent in impact resistance and environmental resistance such as glass epoxy is used in consideration of outdoor use. Is preferred.
- the internal space in the housing 20 preferably has a resin mold structure in order to prevent the position of each sensor unit from being changed due to vibration or impact. Further, it is preferable that the center line CL of the N sensor units 21-1 to 21-N corresponds to the center of the detection device 2.
- Oscillation coils 5A-k and 5B-k are connected in series (or in parallel) at the beginning or end of winding of the coated copper wire, and when a current is supplied from the processing device 3, the alternating current is inverted in phase. Generate a magnetic field. More specifically, the oscillation coils 5A-k and 5B-k may be connected in series (or in parallel), and an AC voltage may be applied to the series circuit (or parallel circuit).
- the magnetic fluxes ⁇ A and ⁇ B generated by the oscillation coils 5A-k and 5B-k are propagated to the tread surface of the railroad rail 100 via the air, and a magnetic flux flows inside the railroad rail 100.
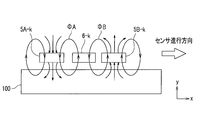
- FIG. 4A shows an example in the case where there is no defect such as a crack in the vicinity of the receiving coil 6-k in the rail 100.
- Components of the magnetic fluxes ⁇ A and ⁇ B that are linked to the receiving coil 6-k cancel each other because the direction of the magnetic flux is opposite. Accordingly, the interlinkage magnetic flux of the receiving coil 6-k becomes almost zero, and the induced voltage of the receiving coil 6 becomes almost zero.
- the inspection vehicle 200 see FIG. 1 travels, the inspection device 2 generates a flow of magnetic flux on the rail 100 while moving. Then, since the flow of the magnetic flux is constant at a place where there is no defect, the induced voltage of the receiving coil 6 becomes a substantially constant value (0).
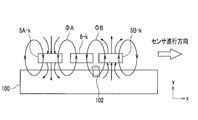
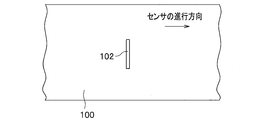
- FIG. 4B shows an example in the case where a defective portion 102 that is a crack is generated in the vicinity of the receiving coil 6-k in the rail 100.
- the flow of magnetic flux is disturbed, and magnetic flux leaks from the tread surface of the rail 100. Therefore, when the reception coil 6-k passes near the defective portion 102, the induced voltage of the reception coil 6-k becomes a relatively large value.
- the defect detection in the present embodiment is to detect the generated leakage magnetic field based on the fact that the flow of magnetic flux generated in the railway rail 100 that is the inspection object changes in the defect portion 102.
- a leakage magnetic field generated in space can be expressed based on a dipole model. This model assumes that the diamagnetic magnetic charge is uniformly distributed at both ends of the uniformly magnetized defect 102, and that the leakage magnetic field can be approximated by a spatial magnetic field generated therefrom.
- the laying direction of the rail 100 is the x direction
- the depth direction of the defective portion 102 is the y direction
- the direction perpendicular to the paper surface is the z direction (not shown)
- the defective portion 102 is in the z direction.
- it has an infinite length.
- the spatial magnetic fields Hx and Hy in the x direction and the y direction at the point (x, y, 0) can be expressed by the following expressions (1) and (2).
- the width of the defect portion 102 is 2a
- the depth of the defect portion 102 is d
- m is the magnetic charge.
- the magnetic charge m is approximated by the following equation (3) using a classical electromagnetic solution for the internal magnetic field of a spheroid existing in a ferromagnetic body that receives uniform magnetization.
- H 0 represents the magnetic field intensity for excitation
- n represents the aspect ratio (d / a) of the scratch
- ⁇ represents the relative permeability.
- the receiving coil 6-k detects a leakage magnetic field from a direction perpendicular to the laying direction of the railroad rail 100, which is an inspection object, and the measurement result corresponds to the spatial magnetic field Hy.
- the spatial magnetic field Hy can be expressed as a function of the depth d of the defect portion 102, and Hy is in the x-axis direction with the center position of the defect portion 102 as a zero point. The change in which a maximum or minimum appears.
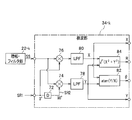
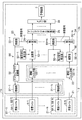
- FIG. 5 is a block diagram showing the overall configuration of the rail inspection system 1 according to the present embodiment.
- the rail inspection system 1 includes the detection device 2 and the processing device 3.
- the detection device 2 includes a sensor unit group 21 sensor units 21-1 to 21-N and amplification / filter units 22-1 to 22-N, and each sensor unit 21-k (where 1 ⁇ k ⁇ N) includes oscillation coils 5A-k and 5B-k and a reception coil 6-k.
- the processing device 3 includes an amplification unit 31-1 to 31-N, a digital / analog conversion unit 32, an oscillation unit 33, a detection unit 34-1 to 34-N, an analog / digital conversion unit 35, and a memory unit. 36 and an evaluation device 4.
- the detection units 34-1 to 34-N are collectively referred to as a detection unit group 34.
- the oscillation unit 33 outputs a sinusoidal digital oscillation signal having a predetermined oscillation frequency f (for example, 20 kHz).
- a frequency other than 20 kHz may be selected as the oscillation frequency f.
- the oscillation frequency f is preferably selected from frequencies in the range of 10 Hz to 100 GHz. This is because if the frequency f is lower than 10 Hz, the sensitivity of the receiving coil 6 is deteriorated, and if it exceeds 100 GHz, the impedance of the oscillation coils 5A and 5B is increased, thereby weakening the magnetic field.
- the frequency f is more preferably selected from the range of 1 kHz to 1 GHz, and further preferably selected from the range of 10 kHz to 100 kHz.
- a circuit called a “track circuit” including the railway rail 100 as a component may be configured. This is for detecting whether or not a railway vehicle exists in a specific section of the track and controlling a traffic light or the like to prevent a collision accident. If the frequency used for this track circuit is close to the oscillation frequency f, the sensor units 21-1 to 21-N may malfunction. However, experiments have shown that if the frequency used in the track circuit is separated by about ⁇ 7% or more of the oscillation frequency f, the influence on the sensor units 21-1 to 21-N can be almost ignored. Therefore, the oscillation frequency f is preferably selected from frequencies separated by ⁇ 0.07f or more with respect to the frequency used for the track circuit.
- the digital-analog conversion unit 32 converts the digital oscillation signal output from the oscillation unit 33 into an analog AC voltage.
- the amplifying unit 31 amplifies the AC voltage and applies it to the oscillation coils 5A-k and 5B-k in each sensor unit 21-k (where 1 ⁇ k ⁇ N). As a result, an alternating magnetic field whose phase is inverted is generated from the oscillation coils 5A-k and 5B-k.
- the amplification / filter unit 22-k in the detection device 2 amplifies and filters the signal from the corresponding reception coil 6-k, and transmits the amplified signal to the detection unit 34-k of the processing device 3.
- the “filter process” is a low-pass filter process that mainly removes frequency components of the oscillation frequency f or higher.
- the detection unit 34-k uses the reference signal from the oscillation unit 33 and based on the signal supplied from the amplification / filter unit 22-k, the signals X, Y, R, ⁇ (details of these signals are described). Is generated and supplied to the analog-digital converter 35.
- the analog / digital converter 35 converts each analog signal received from the detectors 34-1 to 34-N into a digital signal.
- the digital signal output from the analog / digital conversion unit 35 is stored as data in the memory unit 36 and supplied to the evaluation device 4.
- the evaluation device 4 includes hardware as a general computer such as a CPU (Central Processing Unit), a RAM (Random Access Memory), a ROM (Read Only Memory), and an HDD (Hard Disk Drive). , OS (Operating System), application programs, various data, and the like are stored. The OS and application programs are expanded in the RAM and executed by the CPU.
- FIG. 5 the inside of the evaluation device 4 shows functions realized by application programs and the like as blocks.
- the evaluation device 4 includes a control unit 42, a data processing unit 43, an output processing unit 44, an operation input unit 45, a display unit 46, and a storage unit 47.
- the evaluation device 4 executes an inspection processing program that identifies a defect in the rail 100 based on inspection data received from the detection device 2, the detection units 34-1 to 34-N, the analog / digital conversion unit 35, or the memory unit 36. .
- “inspection data” corresponds to data at all stages from the receiving coil 6 of the detection device 2 to the evaluation device 4.
- the control unit 42 controls the reading of the inspection data from the memory unit 36 and the arithmetic processing.
- the data processing unit 43 performs an inspection process based on the inspection data (details will be described later).
- the display unit 46 is an LCD (Liquid Crystal Display), a CRT (Cathode Ray Tube) display, or the like that displays inspection results.
- the output processing unit 44 causes the display unit 46 to display inspection results and the like. At that time, the output processing unit 44 performs processing for displaying in a display format that is visually easy to understand by appropriately using a graph or table format.
- the operation input unit 45 is information input means such as a keyboard and a mouse.
- the storage unit 47 stores data such as inspection results processed by the data processing unit 43. Further, the data stored in the memory unit 36 is also transferred to the storage unit 47.
- the data processing unit 43 and the output processing unit 44 are realized by loading a program or data stored in the storage unit 47 into the control unit 42 and executing arithmetic processing.
- FIG. 6 is a block diagram of the detector 34-k (where 1 ⁇ k ⁇ N).
- the reception signal SS from the amplification / filter unit 22-k is supplied to the phase comparators 74 and 76.
- the reference signal SR1 supplied from the oscillating unit 33 (see FIG. 5) is delayed by the delay circuit 72 by a time corresponding to the 90 ° phase of the oscillation frequency f.
- the delayed reference signal SR1 is referred to as a reference signal SR2.
- the reference signal SR1 is supplied to the phase comparator 76, and the reference signal SR2 is supplied to the phase comparator 74.
- the phase comparator 76 extracts a component synchronized with the reference signal SR1 in the reception signal SS.
- the extracted signal is filtered by an LPF (low-pass filter) 80, and the LPF 80 outputs the result as a cosine signal X (first inspection signal, display target signal).
- LPF low-pass filter
- phase comparator 74 extracts a component synchronized with the reference signal SR2 in the received signal SS.
- the extracted signal is filtered by the LPF 78, and the LPF 78 outputs the result as a sine signal Y (second inspection signal, display target signal).
- the computing unit 84 calculates ⁇ (X 2 + Y 2 ) and outputs the result as an amplitude signal R (display target signal).
- the computing unit 82 calculates an arc tangent of (Y / X), that is, atan (Y / X), and outputs the result as a phase difference signal ⁇ (display target signal).
- the detection unit 34-k supplies the above-described signals X, Y, R, and ⁇ to the memory unit 36 via the analog-digital conversion unit 35 (see FIG. 5).
- the detection unit 34-k outputs all of the signals X, Y, R, and ⁇ , but the amplitude signal R and the phase difference signal ⁇ are not calculated by the detection unit 34-k.
- the data processing unit 43 may calculate.
- the phase of the reference signal may be set so that the amplitude of the cosine signal X is maximized. Then, it can be said that this set phase is an optimum phase for detecting the cosine signal X.
- the received signal SS is independent for each of the sensor units 21-1 to 21-N, and the influence of the arrangement location and manufacturing error differs for each of the sensor units 21-1 to 21-N.
- the optimum phase varies depending on aging and temperature changes. Therefore, setting the optimum phase of the reference signal for each of the detectors 34-1 to 34-N is complicated.
- the sine signal Y is a signal component whose phase is shifted by 90 ° with respect to the exciting magnetic field that excites the rail.
- the calculator 84 (or the evaluation device 4) can calculate the amplitude signal R. Since the value of the amplitude signal R is constant in principle even when the phase difference signal ⁇ fluctuates, the process of optimizing the phase of the reference signal can be omitted.
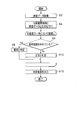
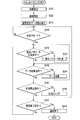
- FIG. 7 is a flowchart of an inspection processing program executed by the data processing unit 43 of the evaluation device 4.
- the data processing unit 43 acquires inspection data from the storage unit 47.
- the data processing unit 43 associates the position history information of the inspection vehicle 200 (see FIG. 1) with the inspection data.
- the inspection vehicle 200 has a position measurement function, and the position on the track is sequentially recorded along with the time.
- the inspection data is stored in the storage unit 47 in association with the data measurement time. Accordingly, in step S4, the inspection data and the position on the trajectory are associated with each other by these data.
- step S6 the data processing unit 43 determines whether or not the inspection data to be processed is out of the reference range, that is, a range that can be estimated to be normal. If "Yes" is determined here, the process proceeds to step S8, and the data processing unit 43 determines that the inspection data is abnormal.
- step S6 the process proceeds to step S10, and the data processing unit 43 determines that the inspection data is normal.
- the process proceeds to step S12, and the data processing unit 43 stores the normal / abnormal determination result of each inspection data in the storage unit 47, and It is displayed on the display unit 46.
- the processing of this routine ends.
- FIG. 8A is a plan view showing a specific example of the defective portion 102 formed on the railroad rail 100.
- the defect portion 102 is a groove-like defect formed in a direction crossing the railroad rail 100.
- FIG. 8B is an example of a waveform diagram of the cosine signal X, the amplitude signal R, and the phase difference signal ⁇ in the vicinity of the defective portion 102.
- illustration of the sine signal Y is omitted, the sine signal Y has a waveform having the same shape as the cosine signal X (however, the amplitudes of both are generally different).
- the sensor unit 21-k (see FIG. 3) has moved at a constant speed from left to right.
- the horizontal axis of FIG. 8B indicates time and a position on the rail 100.
- the vertical axis in FIG. 8B is “voltage” for the cosine signal X and the amplitude signal R, and “angle” for the phase difference signal ⁇ .
- the sensor part 21-k is sufficiently separated from the defect part 102.
- the cosine signal X substantially matches the predetermined offset value BL.
- FIG. 8B shows only one cosine signal X, amplitude signal R, and phase difference signal ⁇ . Actually, each of the signals X, Y, R, and S in each of the sensor units 21-1 to 21-N is shown. ⁇ is obtained. As shown in FIG.
- the cosine signal X has a continuous value along the laying direction of the railroad rail 100, but the direction in which the sensor units 21-1 to 21-N are arranged (the width direction of the railroad rail 100). ), Discrete N values are obtained. Therefore, the measured value of the cosine signal X can be expressed as two-dimensional data.
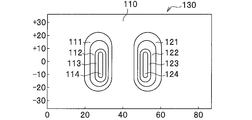
- FIG. 8C shows a display example of the two-dimensional image 130 in which the data processing unit 43 displays the two-dimensional cosine signal X on the display unit 46 with contour lines.
- the horizontal axis represents time and corresponds to a position on the rail 100 as in FIG. 8B.
- the vertical axis in FIG. 8C represents the arrangement direction of the sensor units 21-1 to 21-N (see FIG. 3), that is, the position in the direction crossing the railroad rail 100.
- the numbers such as “0”, “+10”, “ ⁇ 10” on the vertical axis represent the distance from the center position of the rail 100 in mm.
- the width of the tread surface of the rail 100 is generally 65 mm.
- an area 110 is an area where the cosine signal X is close to the offset value BL, and is filled with, for example, “green”.
- the region 114 is a region where the cosine signal X is close to a negative peak, and is filled with, for example, “blue”.
- the region 124 is a region where the cosine signal X is close to a positive peak, and is filled with, for example, “red”.
- the regions 111 to 113 correspond to each of a plurality of ranges from the offset value BL toward the negative peak, and are set to hues that change stepwise from green to blue.
- the regions 121 to 123 correspond to each of a plurality of ranges from the offset value BL toward the positive peak, and are set to hues that gradually change from green to yellow through yellow. Accordingly, the user can visually and clearly grasp the depth of the defect 102 at which position of the rail 100.
- FIG. 8C shows an example in which the cosine signal X is displayed in contour lines
- any one of the sine signal Y, the amplitude signal R, and the phase difference signal ⁇ is used instead of or in addition to the cosine signal X. May be displayed in a contour line.
- hues such as red, blue, and green are associated with the signal intensity, but other display modes (for example, lightness and saturation) may be associated with the signal intensity.
- the first output signal is output with respect to the output signal output from each of the receiving coils.
- a plurality of detectors for detecting a first inspection signal (X) corresponding to the phase (0 °) and a second inspection signal (Y) corresponding to the second phase (90 °) of the output signal Since the detection unit group (34) having 34-1 to 34-N) is provided, it is possible to accurately detect a rail defect.
- the first inspection signal (X), the second inspection signal (Y), or the result of performing arithmetic processing on the first inspection signal (X) and the second inspection signal (Y) ( R, ⁇ ) is a display target signal
- the intensity distribution of the display target signals (X, Y, R, ⁇ ) corresponding to the plurality of sensor units (21-1 to 21-N) is output as a two-dimensional image (130).
- an output processing unit (44) is a contour image in which a display mode (hue, brightness, saturation, etc.) is set corresponding to the intensity of the display target signal (X, Y, R, ⁇ ).
- the display target signal (X, Y, R, ⁇ ) is a signal having an intensity corresponding to the depth of the defective portion (102) formed on the railroad rail (100), and the two-dimensional image (130) is FIG. 5 is an image showing the depth of a defective portion (102) in a display manner (hue, brightness, saturation, etc.).
- the processing accuracy required for the oscillation coils 5A-k and 5B-k can be lowered by electrically canceling the noise signal.
- FIG. 9 is a block diagram showing the overall configuration of the rail inspection system 1a according to the second embodiment of the present invention.
- the external configuration of the rail inspection system 1a of this embodiment is the same as that of the first embodiment (see FIGS. 1 to 3).
- the configuration of the detection device 2 is the same as that of the first embodiment (see FIG. 5).
- the processing apparatus 3 of the first embodiment see FIG. 5
- the processing apparatus 3a is applied in the present embodiment.
- the inside of the evaluation device 4 is omitted in FIG. 9, the configuration of the evaluation device 4 is the same as that of FIG.
- correction signal generation units 50-1 to 50-N and subtraction units 52-1 to 52-N are provided corresponding to the amplification / filter units 22-1 to 22-N. .
- the correction signal generation units 50-1 to 50-N are collectively referred to as a correction signal generation unit group 50, and the subtraction units 52-1 to 52-N are collectively referred to as a subtraction unit group 52.
- the noise signal of the oscillation frequency f is superimposed on the induced voltage output from each sensor unit 21-k (where 1 ⁇ k ⁇ N), and this noise signal is amplified and filtered by the amplification / filter unit 22-k. Is amplified.
- the correction signal generator 50-k attempts to generate a correction signal having substantially the same amplitude and phase as the noise signal in order to cancel the noise signal.
- the subtraction unit 52-k cancels the noise signal by subtracting the correction signal from the output signal of the amplification / filter unit 22-k.
- a signal obtained by canceling the noise signal is supplied to the detectors 34-1 to 34-N.
- the configuration of the processing apparatus 3a other than that described above is the same as that of the processing apparatus 3 (see FIG. 5) of the first embodiment.
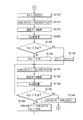
- FIG. 10 is a flowchart of a main routine executed by the evaluation device 4 shown in FIG. 9 (more specifically, the data processing unit 43 shown in FIG. 5).
- the evaluation device 4 performs predetermined initial settings.
- the evaluation device 4 starts communication with the memory unit 36.
- the evaluation device 4 reads device setting data from the storage unit 47.
- This device setting data includes data such as the amplitude and phase of the correction signal described above.
- step S26 the evaluation device 4 determines whether or not a measurement start instruction is input from the user via the operation input unit 45 (see FIG. 5). Then, the process waits in step S26 until the measurement start instruction is input. When a measurement start instruction is input, the process proceeds to step S28, and it is determined whether or not the user has performed a correction parameter measurement operation using the operation input unit 45.
- the correction parameters are parameters that specify the amplitude and phase of each correction signal output from the correction signal generators 50-1 to 50-N.
- step S32 it is determined whether or not the user has performed a data collection operation at the operation input unit 45. If “No” is determined here, the process proceeds to step S36 to determine whether or not the user has performed a measurement stop operation. If “No” is determined here, the process proceeds to step S40 to determine whether or not the user has performed a communication stop operation. If “No” is determined here, the process returns to step S28. Thereafter, these steps are repeated until “Yes” is determined in any of steps S28, S32, S36, and S40.
- step S28 If it is determined as “Yes” in step S28, the process proceeds to step S30.
- a correction parameter measurement subroutine (FIGS. 11 to 13) described later is executed, and after the amplitude and phase of each correction signal are determined, the processing returns to step S28.
- step S32 If “Yes” is determined in step S32, the process proceeds to step S34.
- the evaluation device 4 executes a data collection process. That is, inspection data is collected via the detection device 2, and the process returns to step S32.
- step S36 If it is determined “Yes” in step S36, the process proceeds to step S38. Here, the evaluation device 4 stops the measurement of the correction parameter or the inspection data, and the process returns to step S26. If “Yes” is determined in step S40, the process proceeds to step S42. Here, the evaluation device 4 ends the communication with the memory unit 36, and the processing of this routine is also ended.
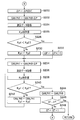
- FIGS. 11 to 13 are flowcharts of the correction parameter measurement subroutine executed in step S30 described above.
- a railway rail 100 shown in FIG. 1 having no defect (close to a new article) is prepared and is made to face the detection device 2.
- the correction parameter measurement subroutine shown in FIGS. 11 to 13 is sequentially executed for each of the correction signal generators 50-1 to 50-N.
- FIGS. 11 to 13 show the processing contents for measuring the correction parameter for one correction signal generator 50-k (where 1 ⁇ k ⁇ N). That is, the processing shown in FIGS. 11 to 13 is repeated N times, whereby the correction parameters are measured for all of the correction signal generators 50-1 to 50-N.
- the evaluation device 4 acquires measurement data for a predetermined number of samples (plural).
- “measurement data” is mainly data obtained by measuring the amplitude signal R. More specifically, the evaluation device 4 first causes the oscillation unit 33 to output a digital oscillation signal. Next, the evaluation apparatus 4 sets initial values of correction parameters for the correction signal generation unit 50-k that is a measurement target.
- the correction parameter includes an amplitude command value CAN_VOLT2 that specifies the amplitude of the correction signal, and a phase command value CAN_PH1 that specifies the phase of the correction signal.
- step S102 the evaluation device 4 supplies the amplitude command value CAN_VOLT2 and the phase command value CAN_PH1 that are predetermined initial values to the correction signal generation unit 50-k.
- the correction signal generation unit 50-k supplies the correction signal having the set amplitude and phase to the subtraction unit 52-k.
- the oscillation unit 33 When the oscillation unit 33 outputs a digital oscillation signal, the oscillation coils 5A-k and 5B-k generate magnetic flux through the digital-analog conversion unit 32 and the amplification unit 31-k, and an induced voltage is generated in the reception coil 6-k. Occurs.
- the amplifying / filtering unit 22-k amplifies and filters the induced voltage and supplies it to the subtracting unit 52-k.
- the subtraction unit 52-k subtracts the correction signal from the output signal of the amplification / filter unit 22-k and supplies the result to the detection unit 34-k. Then, the detection unit 34-k calculates the amplitude signal R based on the output signal of the subtraction unit 52-k. Thereby, measurement data of one sample of the amplitude signal R is obtained.
- the amplitude signal R of a plurality of samples is measured under the same conditions.
- the evaluation device 4 may calculate the amplitude signal R based on the cosine signal X and the sine signal Y measured by the detection unit 34-k. Good.
- step S104 the evaluation device 4 calculates the average value of the measurement data of the acquired amplitude signal R of the predetermined number of samples.
- the calculated average value is defined as an average amplitude value R_p0.
- step S106 it is determined whether or not the average amplitude value R_p0 is less than a predetermined average amplitude reference value R_pth.
- the average amplitude reference value R_pth is a sufficiently low value, for example, 0.005V. If “Yes” is determined here, the processing of this routine ends.
- the initial values of the correction parameters that is, the initial values of the amplitude command value CAN_VOLT2 and the phase command value CAN_PH1 are both sufficiently reliable, and the amplitude signal R is sufficiently low with respect to the rail 100 having no defect. Means that Therefore, in this case, the initial value is applied as it is as a correction parameter, and this routine is processed.
- step S106 if the average amplitude value R_p0 is equal to or greater than the average amplitude reference value R_pth, “No” is determined in step S106, and the process proceeds to step S108.
- a value of a predetermined variable called an amplitude comparison value CAN_VOLT1 is substituted into the amplitude command value CAN_VOLT2.
- the amplitude comparison value CAN_VOLT1 is set to a predetermined value slightly larger than 0 at this time.
- step S110 the measurement data of the amplitude signal R is acquired as in step S102 described above.
- the evaluation device 4 calculates the average amplitude value R_p1 based on the acquired measurement data of the amplitude signal R of the predetermined number of samples.
- step S114 1 is assigned to the stage number ST.
- the amplitude signal R is measured while gradually changing the amplitude and phase of the correction signal generated by the correction signal generator 50-k, and the amplitude and phase where the average value of the amplitude signal R is as small as possible are obtained.
- the result is set as a correction parameter.
- the unit of change when the amplitude is gradually changed is referred to as “amplitude increase / decrease value ⁇ V”.
- phase increase / decrease value ⁇ P the unit of change when the phase is gradually changed.
- the stage number ST represents a stage in which the amplitude increase / decrease value ⁇ V and the phase increase / decrease value ⁇ P are decreased by a natural number of 1 to 3.
- the evaluation device 4 substitutes the voltage fluctuation unit initial value ⁇ VD [ST] for the amplitude increase / decrease value ⁇ V.
- the unit initial value ⁇ VD [3] 0.001V is set.
- the stage number ST is 1. Therefore, in the above example, the amplitude increase / decrease value ⁇ V is set to 0.1V.
- step S122 when the process proceeds to step S122, the evaluation device 4 substitutes the addition result of the amplitude comparison value CAN_VOLT1 and the amplitude increase / decrease value ⁇ V for the amplitude command value CAN_VOLT2.
- step S124 measurement data of the amplitude signal R is acquired as in steps S102 and S110 described above.
- the phase of the correction signal is a predetermined initial value, but the amplitude of the correction signal is the amplitude command value CAN_VOLT2 obtained in step S122.
- step S126 the evaluation device 4 calculates the average amplitude value R_p2 based on the acquired measurement data of the amplitude signal R of the predetermined number of samples.
- the evaluation device 4 determines whether or not the average amplitude value R_p1 is smaller than the average amplitude value R_p2.
- the average amplitude value R_p1 is an average amplitude value when CAN_VOLT1 is substituted for the amplitude command value CAN_VOLT2.
- the average amplitude value R_p2 is an average amplitude value when “CAN_VOLT1 + ⁇ V” is substituted into the amplitude command value CAN_VOLT2. If the former is smaller than the latter, the sign (positive / negative) of the amplitude increase / decrease value ⁇ V is in the direction of increasing the average amplitude value, which can be considered an undesirable sign. Therefore, in such a case, “Yes” is determined in step S128, and the process proceeds to step S132. In step S132, the evaluation device 4 inverts the sign (positive / negative) of the amplitude increase / decrease value ⁇ V.
- step S1208 the process proceeds to step S130, and the evaluation apparatus 4 substitutes the average amplitude value R_p2 for the average amplitude value R_p1. This is because the most preferable (small) value among the average amplitude values obtained in the past is held as the average amplitude value R_p1.
- step S134 the evaluation apparatus 4 substitutes the addition result of the amplitude comparison value CAN_VOLT1 and the amplitude increase / decrease value ⁇ V for the amplitude command value CAN_VOLT2.
- step S136 the measurement data of the amplitude signal R is acquired as in steps S102 and S110 described above.
- step S138 the evaluation device 4 calculates the average amplitude value R_p2 based on the acquired measurement data of the amplitude signal R of the predetermined number of samples.
- step S140 the evaluation device 4 determines whether or not the average amplitude value R_p1 is smaller than the average amplitude value R_p2.
- step S142 the evaluation apparatus 4 substitutes the amplitude command value CAN_VOLT2 for the amplitude comparison value CAN_VOLT1 and substitutes the average amplitude value R_p2 for the average amplitude value R_p1. Accordingly, the most preferable (small) value among the average amplitude values R_p2 obtained in the past is held as the average amplitude value R_p1, and the amplitude command value CAN_VOLT2 realizing the average amplitude value R_p1 is held as the amplitude comparison value CAN_VOLT1. . Then, the process returns to step S134. Thereafter, as long as the average amplitude value R_p2 is equal to or less than the average amplitude value R_p1, the loop of steps S134 to S142 is repeated.
- step S140 if the average amplitude value R_p2 obtained in step S138 is larger than the average amplitude value R_p1, “Yes” is determined in step S140, and the process proceeds to step S144.
- the amplitude comparison value CAN_VOLT1 is substituted into the amplitude command value CAN_VOLT2.
- the most preferable amplitude is the amplitude comparison. That is, it is assigned to the value CAN_VOLT1.
- the evaluation device 4 substitutes the phase fluctuation unit initial value ⁇ PD [ST] for the phase increase / decrease value ⁇ P.
- the stage number ST is 1. Therefore, in the above example, the phase increase / decrease value ⁇ P is set to 10 °.
- step S222 when the process proceeds to step S222, the evaluation device 4 substitutes the addition result of the phase comparison value CAN_PH0 and the phase increase / decrease value ⁇ P for the phase command value CAN_PH1.
- the phase comparison value CAN_PH0 is the initial value of the phase among the initial values of the correction parameters described above.
- step S224 measurement data of the amplitude signal R is acquired as in step S102 (see FIG. 11) described above.
- the evaluation device 4 calculates the average amplitude value R_p2 based on the acquired measurement data of the amplitude signal R of the predetermined number of samples.
- step S2208 the evaluation device 4 determines whether or not the average amplitude value R_p1 is smaller than the average amplitude value R_p2.
- the most preferable (smallest) value among the average amplitude values R_p2 calculated in the past when Step S128 or S142 (see FIG. 12) is finally executed is substituted for the average amplitude value R_p1. If “Yes” is determined in step S228, the process proceeds to step S232, and the evaluation device 4 inverts the sign (positive / negative) of the phase increase / decrease value ⁇ P.
- step S230 the evaluation apparatus 4 substitutes the average amplitude value R_p2 for the average amplitude value R_p1.
- step S234 the evaluation device 4 substitutes the addition result of the phase comparison value CAN_PH0 and the phase increase / decrease value ⁇ P for the phase command value CAN_PH1.
- step S236 measurement data of the amplitude signal R is acquired in the same manner as in step S224 described above.
- step S2308 the evaluation device 4 calculates the average amplitude value R_p2 based on the acquired measurement data of the amplitude signal R of the predetermined number of samples.
- step S240 the evaluation device 4 determines whether or not the average amplitude value R_p1 is smaller than the average amplitude value R_p2.
- step S242 the evaluation apparatus 4 substitutes the phase command value CAN_PH1 for the phase comparison value CAN_PH0 and substitutes the average amplitude value R_p2 for the average amplitude value R_p1.
- the most preferable (small) value is held as the average amplitude value R_p1
- the phase command value CAN_PH1 realizing the average amplitude value R_p1 is held as the phase comparison value CAN_PH0. .
- step S234 Thereafter, as long as the average amplitude value R_p2 is equal to or less than the average amplitude value R_p1, the loop of steps S234 to S242 is repeated.
- step S244 when the amplitude of the correction signal is changed in units of the current phase increase / decrease value ⁇ P (for example, 10 °), the most preferable phase (decreasing the amplitude signal R) is the phase command value CAN_PH1. Is assigned to.
- step S246 it is determined whether or not the stage number ST is 3. If "No" is determined here, the process proceeds to step S248, and the stage number ST is incremented by one. For example, if the previous stage number ST is 1, 2 is substituted for the stage number ST here. Then, the process returns to step S120 in FIG.
- step S120 the voltage fluctuation unit initial value ⁇ VD [2], for example, 0.01V is substituted for the amplitude increase / decrease value ⁇ V, and the above-described processing of steps S122 to S144 is executed.
- step S220 a phase fluctuation unit initial value ⁇ PD [2], for example, 1 ° is substituted for the phase increase / decrease value ⁇ P, and the processes of steps S222 to S244 described above are executed.
- step S248 via step S246, the stage number ST is incremented again and becomes 3, for example.
- step S120 the voltage fluctuation unit initial value ⁇ VD [3], for example, 0.001V is substituted for the amplitude increase / decrease value ⁇ V, and the processes of steps S122 to S144 described above are executed.
- step S220 in FIG. 13 the phase fluctuation unit initial value ⁇ PD [3], for example, 0.1 ° is substituted for the phase increase / decrease value ⁇ P, and the processes of steps S222 to S244 described above are executed. Is done.
- step S246 since the stage number ST is 3, it is determined as “Yes”. Thereby, the processing of the correction parameter measurement subroutine (FIGS. 11 to 13) is completed, and the processing returns to step S28 of the main routine (FIG. 10).
- the correction signal generators 50-1 to 50-N output the respective correction signals based on the amplitude command value CAN_VOLT2 and the phase command value CAN_PH1. To do.
- correction signals having the same frequency as the oscillation signal and having different amplitude and phase from the oscillation signal are respectively associated with the plurality of receiving coils (6-1 to 6-N).
- the respective correction signals are subtracted from the output signals of the plurality of correction signal generation units (50-1 to 50-N) and the plurality of sensor units (21-1 to 21-N) to be output, and the respective subtraction results are obtained.
- FIG. 14 is a block diagram showing an overall configuration of a rail inspection system 1b according to the third embodiment of the present invention.
- the external configuration of the rail inspection system 1b of this embodiment is the same as that of the first embodiment (see FIGS. 1 to 3).
- the configuration of the detection device 2 is the same as that of the first embodiment (see FIG. 5).
- the processing apparatus 3 of the first embodiment see FIG. 5
- the processing apparatus 3b is applied in the present embodiment.
- the inside of the evaluation device 4 is omitted, but the configuration of the evaluation device 4 is the same as that of FIG.
- the processing device 3b of the present embodiment corresponds to each of the amplification / filter units 22-1 to 22-N and the modified signal generators 50-1 to 50- 50-N and subtracting units 52-1 to 52-N are provided.
- individual oscillation units 33-1 to 33-N are provided corresponding to the amplification / filter units 22-1 to 22-N.
- These oscillation units 33-1 to 33-N output digital oscillation signals and reference signals having different oscillation frequencies f1 to fN (predetermined frequencies).
- the oscillation unit 33-k (where 1 ⁇ k ⁇ N) supplies a digital oscillation signal with an oscillation frequency fk to the digital-analog conversion unit 32 and the correction signal generation unit 50-k, and also detects a reference signal with the oscillation frequency fk.
- the digital-analog conversion unit 32 converts each of the N-channel digital oscillation signals into analog signals and supplies them to the sensor units 21-1 to 21-N.
- the reception coil 6-k of the sensor unit 21-k generates an induced voltage of the frequency fk, and this induced voltage is amplified and filtered by the amplification / filter unit 22-k.
- the correction signal generation unit 50-k supplies the correction signal of the oscillation frequency fk to the subtraction unit 52-k, and the subtraction unit 52-k subtracts the correction signal from the output signal of the amplification / filter unit 22-k. This cancels the noise signal. As a result, a signal obtained by canceling the noise signal is supplied to the detectors 34-1 to 34-N.
- the configuration of the processing apparatus 3b other than that described above is the same as that of the processing apparatus 3 (see FIG. 5) of the first embodiment.
- a plurality of sensor units 21-1 to 21-N are arranged in the detection device 2 to form a sensor unit group 21, but these are the same as in the first and second embodiments.
- interference may occur between them.
- different oscillation frequencies f1 to fN are applied to the sensor units 21-1 to 21-N.
- Mutual interference can be reduced.
- the rail 100 constitutes a part of the track circuit, all the oscillation frequencies fk (where 1 ⁇ k ⁇ N) are separated from the frequency used for the track circuit by ⁇ 0.07 fk or more. It is preferable to select from frequencies.
- the oscillation units (33-1 to 33-N) have different frequencies (f1 to fN) from the plurality of sensor units (21-1 to 21-N). Outputs an oscillation signal. As a result, interference between the sensor units (21-1 to 21-N) can be reduced.
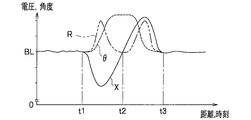
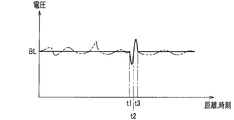
- FIG. 15 is an example of a waveform diagram of the cosine signal X.
- FIG. 15 corresponds to a reduced time axis of the waveform of the cosine signal X shown in FIG. 8B.
- Times t1 to t3 shown in FIG. 15 correspond to times t1 to t3 shown in FIG. 8B.
- the solid line is an example of the waveform of the cosine signal X when the speed of the inspection vehicle 200 is relatively slow.
- the level of the cosine signal X substantially coincides with the offset value BL in a section (before time t1 and after t3) away from the defective portion 102 (see FIG. 8A).
- the two-dot chain line is an example of the waveform of the cosine signal X when the speed of the inspection vehicle 200 is relatively high.
- the inspection vehicle 200 vibrates and the cosine signal X fluctuates even in a section away from the defective portion. For this reason, fluctuations in the cosine signal X at times t1 to t3 at which the defective portion 102 appears may be difficult to distinguish from fluctuations due to vibration.
- the example of the cosine signal X has been described above, but the other signals Y, R, and ⁇ are similarly changed by the vibration of the inspection vehicle 200. In the present embodiment, the influence of vibration of the inspection vehicle 200 is compensated, and the inspection vehicle 200 can be operated at a higher speed.
- the waveforms of the signals Y, R, and ⁇ are the same as the waveform of the cosine signal X in a section away from the defective portion 102 (before time t1 and after t3).
- the waveforms of the amplitude signal R and the phase difference signal ⁇ in the defective portion 102 are clearly different from those of the cosine signal X.
- the waveform shape (not shown) of the sine signal Y is the same as that of the cosine signal X.
- the difference signal RX becomes substantially zero before time t1 and after t3 away from the defect portion 102.
- the difference signal RX since the waveform of the cosine signal X and the waveform of the amplitude signal R are clearly different, the difference signal RX between them is significant. It is considered that the signal generates a large amplitude. Therefore, if the presence or absence of the defective portion 102 is determined based on the difference signal RX, the influence of vibration of the inspection vehicle 200 can be reduced.
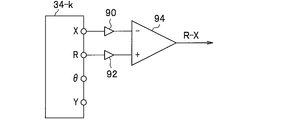
- FIG. 16 is a circuit diagram of a main part of the rail inspection system 1 in the present embodiment.
- the detector 34-k (where 1 ⁇ k ⁇ N) is the same as that of the first to third embodiments (see FIG. 6).
- gain adjusting sections 90 and 92 and a differential amplifier 94 are added after the detecting section 34-k.
- the gain adjusting sections 90 and 92 may set these gains so that the levels of the cosine signal X and the amplitude signal R in the section having no defect are substantially equal. Then, the differential amplifier 94 outputs a differential signal RX that is a difference between the amplitude signal R and the cosine signal X whose gain has been adjusted.
- the analog / digital conversion unit 35 converts the difference signal RX into a digital signal in addition to the signals X, Y, R, and ⁇ , and supplies the digital signal to the evaluation device 4 via the memory unit 36. Then, the evaluation device 4 detects the defective portion 102 of the railroad rail 100 based on the difference signal RX.
- the configuration and operation of this embodiment other than those described above are the same as those of the third embodiment.
- the vibration of the inspection vehicle 200 is detected even when the inspection vehicle 200 travels at a high speed. Can reduce the effects of.
- the present invention is not limited to the above-described embodiments, and various modifications can be made.
- the above-described embodiments are illustrated for easy understanding of the present invention, and are not necessarily limited to those having all the configurations described.
- a part of the configuration of an embodiment can be replaced with the configuration of another embodiment, and the configuration of another embodiment can be added to the configuration of an embodiment.
- the control lines and information lines shown in the figure are those that are considered necessary for the explanation, and not all the control lines and information lines that are necessary on the product are shown. Actually, it may be considered that almost all the components are connected to each other. Examples of possible modifications to the above embodiment are as follows.
- FIG. 7 Although the processing shown in FIG. 7, FIG. 10 to FIG. 13 and the like has been described as software processing using a program in the above embodiment, part or all of the processing is ASIC (ApplicationASpecific Integrated Circuit; specific It may be replaced by hardware processing using an application IC) or FPGA (field-programmable gate array).
- ASIC ApplicationASpecific Integrated Circuit
- FPGA field-programmable gate array
- the detection device 2 and the processing device 3 are mounted on the inspection vehicle 200 (see FIG. 1), but these are mounted on a hand-held carriage (not shown) or the like. However, the user may be able to carry it.
- the detector 34-k (where 1 ⁇ k ⁇ N) outputs the cosine signal X, the sine signal Y, the amplitude signal R, and the phase difference signal ⁇ .
- a value obtained by time-differentiating the signal may be output together with each signal X, Y, R, ⁇ (or in place of each signal X, Y, R, ⁇ ). Further, these time differentiated values may be displayed on the two-dimensional image 130 (see FIG. 8C).
- the difference between the amplitude signal R and the cosine signal X is obtained.
- the difference between “one of signals X and Y” and “one of signals R and ⁇ ” is calculated. Even if the difference is obtained, the defective portion 102 can be detected in the same manner while reducing the influence of vibration.
- the phase difference signal ⁇ is supplied to the gain adjustment unit 92, and the difference signal ⁇ X that is the difference between the cosine signal X and the phase difference signal ⁇ is output from the differential amplifier 94. May be.
Landscapes
- Chemical & Material Sciences (AREA)
- Chemical Kinetics & Catalysis (AREA)
- Electrochemistry (AREA)
- Physics & Mathematics (AREA)
- Health & Medical Sciences (AREA)
- Life Sciences & Earth Sciences (AREA)
- Analytical Chemistry (AREA)
- Biochemistry (AREA)
- General Health & Medical Sciences (AREA)
- General Physics & Mathematics (AREA)
- Immunology (AREA)
- Pathology (AREA)
- Engineering & Computer Science (AREA)
- Mechanical Engineering (AREA)
- Investigating Or Analyzing Materials By The Use Of Magnetic Means (AREA)
- Train Traffic Observation, Control, And Security (AREA)
Abstract
鉄道レールの欠陥を正確に検出できるレール検査システムを実現する。そのため、受信コイル(6-1~6-N)と受信コイルに対応した第1の発振コイル(5A-1~5A-N)および第2の発振コイル(5B-1~5B-N)とを含んでなるセンサ部(21-1~21-N)が、検査対象である鉄道レール(100)の幅方向に列をなすように複数配列されたセンサ部群(21)と、第1の発振コイルおよび第2の発振コイルの各々に発振信号を供給する発振部(33)と、センサ部群が鉄道レールの敷設方向に移動する際、受信コイルの各々から出力される出力信号に対して、出力信号の第1の位相(0°)に対応する第1の検査信号(X)と、出力信号の第2の位相(90°)に対応する第2の検査信号(Y)と、を検出する複数の検波部(34-1~34-N)を有する検波部群(34)と、を設けた。
Description
本発明は、レール検査システムに関する。
鉄道等に使用されるレールには、亀裂等の欠陥が生じることがある。この種の欠陥を放置すると、レールが破断する等の問題が生じるため、定期的にレールを非破壊検査することが好ましい。その一例として、下記特許文献1の要約書には、「一実施形態によれば、本技術は、試験対象物内の材料の完全性を試験するための試験装置を提供する。試験装置は、電気導体と検出装置とを含む。典型的な検査装置では、電気導体は、一般的に直線方向に延びており、一般に、試験対象物の長手方向軸を横切る方向に電流を流す。電気導体を流れる電流の経路は、試験対象物の周囲の磁場に影響を与え、間接的に渦電流を発生させる。また、試験装置は、電気導体から離れた位置に配置され、電気導体を介して流れる電流に応じて発生する磁界を検出する検出装置を備えている。 」と記載されている。
上記特許文献1の技術では、渦電流によって発生する磁界を検出しているが、渦電流の大きさは、試験装置と試験対象物(鉄道レール)の距離の二乗に反比例するため、検測車両(軌道や架線の状態を検査する鉄道車両)の振動によって生じる誤差が大きくなり、鉄道レールの欠陥を正確に検出することが困難であった。
この発明は上述した事情に鑑みてなされたものであり、鉄道レールの欠陥を正確に検出できるレール検査システムを提供することを目的とする。
この発明は上述した事情に鑑みてなされたものであり、鉄道レールの欠陥を正確に検出できるレール検査システムを提供することを目的とする。
上記課題を解決するため本発明のレール検査システムは、所定周波数の発振信号を出力する発振部と、検査対象の鉄道レールに対向して、前記鉄道レールの敷設方向を横切る方向に配列されるとともに、各々が受信コイルと、前記発振信号が供給されると、前記受信コイルが設けられた箇所に対して互いに逆向きの交流磁場を発生する第1の発振コイルおよび第2の発振コイルと、を備えた複数のセンサ部と、複数の前記センサ部が、前記鉄道レールの敷設方向に移動する際、複数の前記受信コイルの各々から出力される出力信号に対して、前記出力信号の第1の位相に対応する第1の検査信号と、前記出力信号の第2の位相に対応する第2の検査信号と、を検出する複数の検波部と、を有することを特徴とする。
本発明によれば、鉄道レールの欠陥を正確に検出できる。
[第1実施形態]
〈第1実施形態の構成〉
図1は、本発明の第1実施形態によるレール検査システム1の模式図である。
図1においてレール検査システム1は、検出装置2と、処理装置3と、両者を接続するケーブル60とを有している。レール検査システム1は、例えば自走式の検測車両200に装着されるものであり、検出装置2は、検査対象物である鉄道レール100に対向する位置に設置され、処理装置3は、検測車両200の室内に設置される。
〈第1実施形態の構成〉
図1は、本発明の第1実施形態によるレール検査システム1の模式図である。
図1においてレール検査システム1は、検出装置2と、処理装置3と、両者を接続するケーブル60とを有している。レール検査システム1は、例えば自走式の検測車両200に装着されるものであり、検出装置2は、検査対象物である鉄道レール100に対向する位置に設置され、処理装置3は、検測車両200の室内に設置される。
図2は、検出装置2の斜視図である。
図2において検出装置2は、中空の直方体状に形成された筐体20と、筐体20の上面に固定された矩形板状のフランジ25とを有する。フランジ25の四隅には貫通孔25aが形成されている。また、検測車両200において検出装置2を配置する箇所には、貫通孔25aに対向する位置にネジ穴(図示せず)を備える。貫通孔25aにボルトを挿入し、ネジ穴に当該ボルトを締め付けることで、検出装置2が検測車両200の所定位置に固定される。検出装置2をこの所定位置に固定すると、鉄道レール100の中心と、検出装置2の中心とが一致する。そのため、フランジ25は鉄道レール100に対する検出装置2を所定位置に設置するための冶具となっている。筐体20の底面には、センサ部群21と増幅・フィルタ部群22とが固定されている。
図2において検出装置2は、中空の直方体状に形成された筐体20と、筐体20の上面に固定された矩形板状のフランジ25とを有する。フランジ25の四隅には貫通孔25aが形成されている。また、検測車両200において検出装置2を配置する箇所には、貫通孔25aに対向する位置にネジ穴(図示せず)を備える。貫通孔25aにボルトを挿入し、ネジ穴に当該ボルトを締め付けることで、検出装置2が検測車両200の所定位置に固定される。検出装置2をこの所定位置に固定すると、鉄道レール100の中心と、検出装置2の中心とが一致する。そのため、フランジ25は鉄道レール100に対する検出装置2を所定位置に設置するための冶具となっている。筐体20の底面には、センサ部群21と増幅・フィルタ部群22とが固定されている。
図3は、検出装置2の一部切欠平面図である。
図3において、センサ部群21は、鉄道レール100の幅方向に列をなすように複数配列されたN個(Nは複数)のセンサ部21-1~21-Nを有している。また、増幅・フィルタ部群22は、同数の増幅・フィルタ部22-1~22-Nを有している。センサ部21-1~21-Nは、それぞれ、発振コイル5A-1~5A-N(第1の発振コイル)と、発振コイル5B-1~5B-N(第2の発振コイル)と、受信コイル6-1~6-Nと、を有している。これらのコイルは、被服銅線を巻回して構成されている。
図3において、センサ部群21は、鉄道レール100の幅方向に列をなすように複数配列されたN個(Nは複数)のセンサ部21-1~21-Nを有している。また、増幅・フィルタ部群22は、同数の増幅・フィルタ部22-1~22-Nを有している。センサ部21-1~21-Nは、それぞれ、発振コイル5A-1~5A-N(第1の発振コイル)と、発振コイル5B-1~5B-N(第2の発振コイル)と、受信コイル6-1~6-Nと、を有している。これらのコイルは、被服銅線を巻回して構成されている。
発振コイル5A-k(但し、1≦k≦N)と、受信コイル6-kと、発振コイル5B-kとは、鉄道レール100(図1参照)の敷設方向に沿って配置され、受信コイル6-kは、発振コイル5A-kと発振コイル5B-kとの間に等間隔になるように配置されている。発振コイル5A-k,5B-kには、処理装置3(図1参照)から、ケーブル60を介して、所定の発振周波数f(所定周波数)の交流電流が供給される。これにより、発振コイル5A-k,5B-kから各々交流磁界が発生し、受信コイル6には鎖交する磁束によって誘起電圧が発生する。
増幅・フィルタ部22-kは、受信コイル6-kで生じた誘起電圧に対して増幅およびフィルタ処理を行い、ケーブル60(図1参照)を介して、その結果を処理装置3に送信する。処理装置3は、受信した信号に対して解析処理を行い、鉄道レール100の欠陥を検出する。
検出装置2に上述した交流磁界を発生させるため、筐体20は非磁性体とすることが好ましく、屋外使用を考慮してガラスエポキシ等の耐衝撃性および耐環境性に優れた材質を用いることが好ましい。筐体20内の内部空間は、振動や衝撃による各センサ部の位置が変わることを防ぐために、樹脂モールド構造にすることが好ましい。また、N個のセンサ部21-1~21-Nの中心線CLは、検出装置2の中心に対応させることが好ましい。
検出装置2に上述した交流磁界を発生させるため、筐体20は非磁性体とすることが好ましく、屋外使用を考慮してガラスエポキシ等の耐衝撃性および耐環境性に優れた材質を用いることが好ましい。筐体20内の内部空間は、振動や衝撃による各センサ部の位置が変わることを防ぐために、樹脂モールド構造にすることが好ましい。また、N個のセンサ部21-1~21-Nの中心線CLは、検出装置2の中心に対応させることが好ましい。
〈欠陥検出の原理〉
図4A、図4Bは、本実施形態における欠陥検出の原理説明図である。
発振コイル5A-k,5B-kは、被覆銅線の巻き始め同士もしくは巻き終り同士が直列(または並列)に接続されており、処理装置3から電流が供給されると、位相が反転した交流磁界を発生させる。より具体的には、発振コイル5A-k,5B-kを直列(または並列)に接続し、この直列回路(または並列回路)に交流電圧を印加するとよい。発振コイル5A-k,5B-kによって生じる磁束ΦA,ΦBは、空気を介して、鉄道レール100の踏面に伝播され、鉄道レール100の内部に磁束の流れを生じさせる。
図4A、図4Bは、本実施形態における欠陥検出の原理説明図である。
発振コイル5A-k,5B-kは、被覆銅線の巻き始め同士もしくは巻き終り同士が直列(または並列)に接続されており、処理装置3から電流が供給されると、位相が反転した交流磁界を発生させる。より具体的には、発振コイル5A-k,5B-kを直列(または並列)に接続し、この直列回路(または並列回路)に交流電圧を印加するとよい。発振コイル5A-k,5B-kによって生じる磁束ΦA,ΦBは、空気を介して、鉄道レール100の踏面に伝播され、鉄道レール100の内部に磁束の流れを生じさせる。
図4Aは、鉄道レール100において、受信コイル6-kの近傍に特に亀裂等の欠陥が無い場合の例を示す。
磁束ΦA,ΦBのうち受信コイル6-kに鎖交する成分は、磁束の向きが逆向きであるため、相互に打ち消しあう。従って、受信コイル6-kの鎖交磁束はほぼ零になり、受信コイル6の誘起電圧もほぼ零になる。ここで、検測車両200(図1参照)が走行すると、検査装置2は移動しながら鉄道レール100に磁束の流れを発生させる。そして、欠陥が無い箇所では当該磁束の流れが一定であるため、受信コイル6の誘起電圧はほぼ一定値(0)になる。
磁束ΦA,ΦBのうち受信コイル6-kに鎖交する成分は、磁束の向きが逆向きであるため、相互に打ち消しあう。従って、受信コイル6-kの鎖交磁束はほぼ零になり、受信コイル6の誘起電圧もほぼ零になる。ここで、検測車両200(図1参照)が走行すると、検査装置2は移動しながら鉄道レール100に磁束の流れを発生させる。そして、欠陥が無い箇所では当該磁束の流れが一定であるため、受信コイル6の誘起電圧はほぼ一定値(0)になる。
図4Bは、鉄道レール100において、受信コイル6-kの近傍に亀裂である欠陥部102が生じている場合の例を示す。図示の例においては、磁束の流れが乱れて、鉄道レール100の踏面から磁束の漏洩が生じる。そのため、受信コイル6-kが欠陥部102の近傍を通過する際に、受信コイル6-kの誘起電圧は比較的大きな値になる。
本実施形態における欠陥検出は、検査対象物である鉄道レール100に発生させた磁束の流れが欠陥部102において変わることに基づき、発生した漏洩磁界を検出するものである。この漏洩磁界の解析モデルとして、双極子モデルに基づいて空間に発生する漏洩磁界を表現することができる。このモデルは、一様に磁化された欠陥部102の両端部に反磁性の磁荷を一様に分布させ、漏洩磁界はそれらから生じた空間磁界で近似できると仮定するものである。
まず、図4Bにおいて鉄道レール100の敷設方向をx方向とし、欠陥部102の深さ方向をy方向とし、紙面に垂直な方向をz方向(図示せず)とし、欠陥部102はz方向に無限長の長さを持っていると仮定する。すると、(x、y、0)点におけるx方向およびy方向の空間磁界Hx,Hyは、下式(1),(2)で表すことができる。


磁荷量mは、一様磁化を受ける強磁性体中に存在する回転楕円体の内部磁場に対する古典電磁気学的解を用いて、下式(3)で近似される。

〈第1実施形態の回路構成〉
図5は、本実施形態によるレール検査システム1の全体構成を示すブロック図である。
上述したように、レール検査システム1は、検出装置2と、処理装置3とを有する。そして、検出装置2は、センサ部群21センサ部21-1~21-Nと、増幅・フィルタ部22-1~22-Nとを有し、各センサ部21-k(但し、1≦k≦N)は、発振コイル5A-k,5B-kと、受信コイル6-kとを有する。
また、処理装置3は、増幅部31-1~31-Nと、デジタルアナログ変換部32と、発振部33と、検波部34-1~34-Nと、アナログデジタル変換部35と、メモリ部36と、評価装置4とを備えている。なお、検波部34-1~34-Nを総称して検波部群34と呼ぶ。
発振部33は、所定の発振周波数f(例えば20kHz)の正弦波状のデジタル発振信号を出力する。なお、発振周波数fとして20kHz以外の周波数を選択してもよい。但し、発振周波数fは、10Hz~100GHzの範囲の周波数から選択することが好ましい。これは、周波数fが10Hzよりも低いと受信コイル6の感度が悪くなり、100GHzを超えると発振コイル5A,5Bのインピーダンスが高くなることによって、磁場が弱くなるからである。また、周波数fは、1kHz~1GHzの範囲から選択することがより好ましく、10kHz~100kHzの範囲から選択することがさらに好ましい。
ところで、実際に運用されている鉄道線路においては、鉄道レール100を構成要素に含む「軌道回路」と呼ばれる回路を構成することがある。これは、線路の特定区間内に鉄道車両が存在するか否かを検出して信号機等を制御し、衝突事故を防ぐためのものである。この軌道回路に用いられる周波数と、発振周波数fとが近接していると、センサ部21-1~21-Nが誤動作する場合がある。しかし、軌道回路に用いられる周波数を、発振周波数fの±7%程度以上離すと、センサ部21-1~21-Nに対する影響がほぼ無視できることが実験により判明している。従って、発振周波数fは、軌道回路に用いられる周波数に対して、±0.07f以上離れた周波数から選択することが好ましい。
図5においてデジタルアナログ変換部32は、発振部33が出力したデジタル発振信号をアナログの交流電圧に変換する。増幅部31は、この交流電圧を増幅し、各センサ部21-k(但し、1≦k≦N)における発振コイル5A-k,5B-kに印加する。これにより、発振コイル5A-k,5B-kからは、位相が反転した交流磁界が発生する。
また、検出装置2内の増幅・フィルタ部22-kは、対応する受信コイル6-kからの信号を増幅およびフィルタ処理し、処理装置3の検波部34-kに送信する。なお、「フィルタ処理」とは、主として発振周波数f以上の周波数成分を除去する低域通過フィルタ処理である。また、検波部34-kは、発振部33からの参照信号を用いて、増幅・フィルタ部22-kから供給された信号に基づいて、信号X,Y,R,θ(これら信号の詳細は後述する)を生成し、アナログデジタル変換部35に供給する。アナログデジタル変換部35は、検波部34-1~34-Nから受信した各アナログ信号をデジタル信号に変換する。アナログデジタル変換部35から出力されたデジタル信号は、データとしてメモリ部36に記憶され、評価装置4に供給される。
次に、評価装置4について説明する。
評価装置4は、CPU(Central Processing Unit)、RAM(Random Access Memory)、ROM(Read Only Memory)、HDD(Hard Disk Drive)等、一般的なコンピュータとしてのハードウエアを備えており、HDDには、OS(Operating System)、アプリケーションプログラム、各種データ等が格納されている。OSおよびアプリケーションプログラムは、RAMに展開され、CPUによって実行される。図5において、評価装置4の内部は、アプリケーションプログラム等によって実現される機能を、ブロックとして示している。
評価装置4は、CPU(Central Processing Unit)、RAM(Random Access Memory)、ROM(Read Only Memory)、HDD(Hard Disk Drive)等、一般的なコンピュータとしてのハードウエアを備えており、HDDには、OS(Operating System)、アプリケーションプログラム、各種データ等が格納されている。OSおよびアプリケーションプログラムは、RAMに展開され、CPUによって実行される。図5において、評価装置4の内部は、アプリケーションプログラム等によって実現される機能を、ブロックとして示している。
評価装置4は、制御部42と、データ処理部43と、出力処理部44と操作入力部45と、表示部46と、記憶部47と、を備える。
評価装置4は、検出装置2、検波部34-1~34-N、アナログデジタル変換部35またはメモリ部36から受信した検査データに基づいて鉄道レール100の欠陥を特定する検査処理プログラムを実行する。なお、本実施形態において、「検査データ」とは、検出装置2の受信コイル6から評価装置4に至るまでの全ての段階でのデータが該当するものとする。
評価装置4は、検出装置2、検波部34-1~34-N、アナログデジタル変換部35またはメモリ部36から受信した検査データに基づいて鉄道レール100の欠陥を特定する検査処理プログラムを実行する。なお、本実施形態において、「検査データ」とは、検出装置2の受信コイル6から評価装置4に至るまでの全ての段階でのデータが該当するものとする。
制御部42は、メモリ部36からの検査データの読出しや、演算処理等の制御を行う。データ処理部43は、検査データに基づいて、検査処理を行う(詳細は後記)。表示部46は、検査結果等を表示するLCD(Liquid Crystal Display)、CRT(Cathode Ray Tube)ディスプレイ等である。出力処理部44は、表示部46に検査結果等を表示させる。その際、出力処理部44は、グラフやテーブルの形式を適宜用いて視覚的に理解しやすい表示形式で表示させるための処理を行う。操作入力部45は、キーボード、マウス等の情報入力手段である。記憶部47は、データ処理部43が処理した検査結果等のデータを保存する。また、メモリ部36に記憶されたデータは、記憶部47にも転送される。なお、データ処理部43、出力処理部44は、記憶部47に格納されたプログラムやデータを制御部42にロードして、演算処理を実行することによって実現される。
図6は、検波部34-k(但し、1≦k≦N)のブロック図である。
増幅・フィルタ部22-kからの受信信号SSは、位相比較器74,76に供給される。また、発振部33(図5参照)から供給された参照信号SR1は、遅延回路72によって、発振周波数fの90°の位相に相当する時間だけ遅延される。遅延された参照信号SR1を参照信号SR2と呼ぶ。参照信号SR1は位相比較器76に供給され、参照信号SR2は位相比較器74に供給される。位相比較器76は、受信信号SSにおいて参照信号SR1に同期する成分を抽出する。抽出された信号は、LPF(ローパスフィルタ)80によってフィルタ処理され、LPF80は、その結果を余弦信号X(第1の検査信号,表示対象信号)として出力する。
増幅・フィルタ部22-kからの受信信号SSは、位相比較器74,76に供給される。また、発振部33(図5参照)から供給された参照信号SR1は、遅延回路72によって、発振周波数fの90°の位相に相当する時間だけ遅延される。遅延された参照信号SR1を参照信号SR2と呼ぶ。参照信号SR1は位相比較器76に供給され、参照信号SR2は位相比較器74に供給される。位相比較器76は、受信信号SSにおいて参照信号SR1に同期する成分を抽出する。抽出された信号は、LPF(ローパスフィルタ)80によってフィルタ処理され、LPF80は、その結果を余弦信号X(第1の検査信号,表示対象信号)として出力する。
また、位相比較器74は、受信信号SSにおいて、参照信号SR2に同期する成分を抽出する。抽出された信号は、LPF78によってフィルタ処理され、LPF78は、その結果を正弦信号Y(第2の検査信号,表示対象信号)として出力する。演算器84は、√(X2+Y2)を計算し、その結果を振幅信号R(表示対象信号)として出力する。また、演算器82は、(Y/X)のアークタンジェントすなわちatan(Y/X)を計算し、その結果を位相差信号θ(表示対象信号)として出力する。
そして、検波部34-kは、上述した各信号X,Y,R,θを、アナログデジタル変換部35(図5参照)を介してメモリ部36に供給する。なお、図示の例では、検波部34-kは各信号X,Y,R,θの全てを出力したが、振幅信号Rおよび位相差信号θは検波部34-kが計算するのではなく、余弦信号Xおよび正弦信号Yに基づいて、データ処理部43(図5参照)が計算するようにしてもよい。
ここで、検波部34-kが余弦信号Xに加えて正弦信号Yを検出している理由について説明しておく。まず、余弦信号Xを重視するのであれば、余弦信号Xの振幅が最大になるように、参照信号の位相を設定することが考えられる。すると、この設定した位相は、余弦信号Xを検出するための最適な位相であると言える。しかし、受信信号SSは、センサ部21-1~21-N毎に独立しており、センサ部21-1~21-N毎に配置箇所や製造誤差の影響が異なる。また、経年変化や温度変化によっても最適な位相は変動する。従って、検波部34-1~34-Nの各々に対して参照信号の最適な位相を設定することは、煩雑である。
正弦信号Yは、レールを励磁する励磁磁場に対して90°位相がシフトした信号成分である。本実施形態のように、余弦信号Xとともに正弦信号Yを検出すると、演算器84(または評価装置4)において振幅信号Rを計算することができる。振幅信号Rの値は、位相差信号θが変動した場合であっても、原理上は一定になるため、参照信号の位相を最適化する処理を省略することができる。
〈第1実施形態の動作〉
図7は、評価装置4のデータ処理部43によって実行される検査処理プログラムのフローチャートである。
図7において処理がステップS2に進むと、データ処理部43は、検査データを記憶部47から取得する。次に、処理がステップS4に進むと、データ処理部43は、検測車両200(図1参照)の位置履歴情報と、検査データとの対応付けを行う。検測車両200は位置測定機能を有しており、軌道上の位置が、時刻とともに逐次記録される。また、検査データは、データ測定時刻と対応付けて記憶部47に記憶されている。従って、ステップS4では、これらのデータによって、検査データと、軌道上における位置とが対応付けられる。
図7は、評価装置4のデータ処理部43によって実行される検査処理プログラムのフローチャートである。
図7において処理がステップS2に進むと、データ処理部43は、検査データを記憶部47から取得する。次に、処理がステップS4に進むと、データ処理部43は、検測車両200(図1参照)の位置履歴情報と、検査データとの対応付けを行う。検測車両200は位置測定機能を有しており、軌道上の位置が、時刻とともに逐次記録される。また、検査データは、データ測定時刻と対応付けて記憶部47に記憶されている。従って、ステップS4では、これらのデータによって、検査データと、軌道上における位置とが対応付けられる。
次に、ステップS2で取得した全ての検査データについて、ステップS6,S8,S10のループが繰り返される。まず、ステップS6において、データ処理部43は、処理対象の検査データが基準範囲すなわち正常であると推定できる範囲を外れているか否かを判定する。ここで「Yes」と判定されると、処理はステップS8に進み、データ処理部43は、当該検査データは異常であると判定する。
一方、ステップS6において「No」と判定されると、処理はステップS10に進み、データ処理部43は、当該検査データは正常であると判定する。そして、ステップS6~S10の処理が検査データ全体に対して終了すると、処理はステップS12に進み、データ処理部43は、各検査データの正常/異常の判定結果を記憶部47に記憶させるとともに、表示部46に表示させる。以上により、本ルーチンの処理が終了する。
次に、図8A、図8B、図8Cを参照し、上述したステップS12における判定結果の表示態様について説明する。
図8Aは、鉄道レール100に形成された欠陥部102の具体例を示す平面図である。図示の例において、欠陥部102は、鉄道レール100を横切る方向に形成された溝状の欠陥であるとする。
図8Bは、欠陥部102の近傍における余弦信号X、振幅信号R、位相差信号θの波形図の例である。なお、正弦信号Yについては図示を省略するが、正弦信号Yは余弦信号Xと同様の形状の波形になる(但し、一般的には両者の振幅は異なる)。
図8Aは、鉄道レール100に形成された欠陥部102の具体例を示す平面図である。図示の例において、欠陥部102は、鉄道レール100を横切る方向に形成された溝状の欠陥であるとする。
図8Bは、欠陥部102の近傍における余弦信号X、振幅信号R、位相差信号θの波形図の例である。なお、正弦信号Yについては図示を省略するが、正弦信号Yは余弦信号Xと同様の形状の波形になる(但し、一般的には両者の振幅は異なる)。
図8Aにおいて、センサ部21-k(図3参照)は、左から右に向かって一定速度で移動したこととする。すると、図8Bの横軸は、時刻であるとともに、鉄道レール100上の位置を示すものになる。また、図8Bの縦軸は、余弦信号Xおよび振幅信号Rについては「電圧」であり、位相差信号θについては、「角度」になる。時刻t1以前およびt3以降は、センサ部21-kは欠陥部102から充分に離れていることとする。この場合、余弦信号Xは、所定のオフセット値BLにほぼ一致している。
そして、時刻t1~t2の区間では、余弦信号Xに負のピークが現れ、時刻t2~t3の区間では、余弦信号Xに正のピークが現れる。また、振幅信号Rは、時刻t1~t2の区間および時刻t2~t3の区間に、各々正のピークを有する。また、位相差信号θは、略台形状の波形になる。図8Bには、余弦信号X、振幅信号Rおよび位相差信号θを各1系統のみ示すが、実際には、センサ部21-1~21-Nの各々において、各信号X,Y,R,θが求まる。図8Bに示したように、余弦信号Xは、鉄道レール100の敷設方向に沿って連続的な値が得られるが、センサ部21-1~21-Nの配列方向(鉄道レール100の幅方向)に沿って、離散的なN個の値が得られる。従って、余弦信号Xの測定値は、2次元のデータとして表現することができる。
図8Cは、データ処理部43が、2次元の余弦信号Xを表示部46に等高線表示させた2次元画像130の表示例を示す。図8Cにおいて横軸は、図8Bと同様に、時刻であるとともに、鉄道レール100上の位置に対応する。また、図8Cの縦軸は、センサ部21-1~21-N(図3参照)の配列方向、すなわち、鉄道レール100を横切る方向の位置である。また、縦軸における「0」、「+10」、「-10」等の数字は、鉄道レール100の中心位置からの距離をmm単位で表したものである。なお、鉄道レール100の踏面の幅は、一般的に65mmである。
図8Cにおいて領域110は、余弦信号Xがオフセット値BLに近い領域であり、例えば「緑色」によって塗りつぶされる。また、領域114は、余弦信号Xが負のピークに近い領域であり、例えば「青色」によって塗りつぶされる。また、領域124は、余弦信号Xが正のピークに近い領域であり、例えば「赤色」によって塗りつぶされる。領域111~113は、オフセット値BLから負のピークに向かう複数段階の各範囲に対応し、緑色から青色に向かって段階的に変化する色相に設定されている。
また、領域121~123は、オフセット値BLから正のピークに向かう複数段階の各範囲に対応し、緑色から黄色を介して赤色に向かって段階的に変化する色相に設定されている。これにより、ユーザは、鉄道レール100のどの位置に、どの程度の深さの欠陥部102が生じているのか、視覚的に明瞭に把握することができる。
なお、図8Cには、余弦信号Xを等高線表示させた例を示したが、余弦信号Xに代えて、または余弦信号Xに加えて、正弦信号Y、振幅信号Rまたは位相差信号θの何れかを等高線表示させてもよい。また、図8Cの例においては、赤、青、緑等の色相を信号強度に対応付けたが、他の表示態様(例えば、明度、彩度)を信号強度に対応付けてもよい。
ここで、実際に使用されている鉄道レールに生じる欠陥について説明しておく。鉄道車両の車輪が鉄道レールの踏面に接触しつつ転がると、鉄道レールには疲労が蓄積してゆき、やがて踏面に平行な方向すなわち水平方向に亀裂が生じるようになる。このような亀裂は「水平裂」と呼ばれている。水平裂が生じた鉄道レールに、さらに疲労が蓄積すると、水平裂が下方向に向かって成長してゆくことがある。このように、下方向に成長した亀裂は「横裂」と呼ばれている。横裂は進展性が高いため、これを見逃してしまうと、高い確率で鉄道レールが破断する。本実施形態によれば、欠陥の深さdに対応した検出信号を出力できるため、特に横裂の存在およびその深さを正確に検出できる点で有利である。
〈第1実施形態の効果〉
以上のように、本実施形態は、センサ部群(21)が鉄道レール(100)の敷設方向に移動する際、受信コイルの各々から出力される出力信号に対して、出力信号の第1の位相(0°)に対応する第1の検査信号(X)と、出力信号の第2の位相(90°)に対応する第2の検査信号(Y)と、を検出する複数の検波部(34-1~34-N)を有する検波部群(34)を設けたので、鉄道レールの欠陥を正確に検出できる。
以上のように、本実施形態は、センサ部群(21)が鉄道レール(100)の敷設方向に移動する際、受信コイルの各々から出力される出力信号に対して、出力信号の第1の位相(0°)に対応する第1の検査信号(X)と、出力信号の第2の位相(90°)に対応する第2の検査信号(Y)と、を検出する複数の検波部(34-1~34-N)を有する検波部群(34)を設けたので、鉄道レールの欠陥を正確に検出できる。
また、本実施形態は、第1の検査信号(X)、第2の検査信号(Y)または第1の検査信号(X)と第2の検査信号(Y)に演算処理を施した結果(R,θ)を表示対象信号とし、複数のセンサ部(21-1~21-N)に対応する表示対象信号(X,Y,R,θ)の強度分布を2次元画像(130)として出力する出力処理部(44)をさらに有する。ここで、2次元画像(130)は、表示対象信号(X,Y,R,θ)の強度に対応して表示態様(色相、明度、彩度等)を設定した等高線画像であり、鉄道レール(100)の敷設方向の位置および幅方向の位置を軸とする画像である。そして、表示対象信号(X,Y,R,θ)は、鉄道レール(100)に形成された欠陥部(102)の深さに応じた強度を有する信号であり、2次元画像(130)は、欠陥部(102)の深さを表示態様(色相、明度、彩度等)によって示す画像である。これらの特徴により、ユーザは、鉄道レールの欠陥をより的確に認識できるようになる。
[第2実施形態]
〈第2実施形態の構成〉
次に、本発明の第2実施形態について説明する。なお、以下の説明において、図1~図8の各部に対応する部分には同一の符号を付し、その説明を省略する場合がある。
本実施形態の構成を説明する前に、上述した第1実施形態について再び検討する。図4Aにおいて説明したように、鉄道レール100に亀裂等の欠陥が無い場合、磁束ΦA,ΦBのうち受信コイル6-kに鎖交する成分は相互に打ち消しあい、鎖交磁束は理想的には零になる。
〈第2実施形態の構成〉
次に、本発明の第2実施形態について説明する。なお、以下の説明において、図1~図8の各部に対応する部分には同一の符号を付し、その説明を省略する場合がある。
本実施形態の構成を説明する前に、上述した第1実施形態について再び検討する。図4Aにおいて説明したように、鉄道レール100に亀裂等の欠陥が無い場合、磁束ΦA,ΦBのうち受信コイル6-kに鎖交する成分は相互に打ち消しあい、鎖交磁束は理想的には零になる。
但し、発振コイル5A-k,5B-kの形状(内径、外径、コイル長等)に差があると、両者の発生する磁束ΦA,ΦBは受信コイル6-kにおいて打ち消されなくなり、発振信号と同一周波数の雑音信号が受信コイル6-kからは継続的に出力されるようになる。勿論、発振コイル5A-k,5B-kの加工精度を充分に高くすることにより、この雑音信号は実用上問題の無いレベルにまで低減することができる。但し、発振コイル5A-k,5B-kの加工精度を高くすることはコストアップにつながるため、加工精度の低い、安価なコイルを適用できればより好ましい。そこで、本実施形態は、雑音信号を電気的にキャンセルすることによって、発振コイル5A-k,5B-kに求められる加工精度を下げられるようにするものである。
図9は、本発明の第2実施形態によるレール検査システム1aの全体構成を示すブロック図である。本実施形態のレール検査システム1aの外観構成は、第1実施形態のもの(図1~図3参照)と同様である。また、検出装置2の構成も第1実施形態のもの(図5参照)と同様である。但し、第1実施形態の処理装置3(図5参照)に代えて、本実施形態においては、処理装置3aが適用される。なお、図9においては評価装置4の内部は省略するが、評価装置4の構成も図5のものと同様である。
処理装置3aにおいては、各増幅・フィルタ部22-1~22-Nに対応して修正信号発生部50-1~50-Nと、減算部52-1~52-Nとが設けられている。なお、修正信号発生部50-1~50-Nを総称して修正信号発生部群50と呼び、減算部52-1~52-Nを総称して減算部群52と呼ぶ。上述したように、各センサ部21-k(但し、1≦k≦N)が出力する誘起電圧には、発振周波数fの雑音信号が重畳し、この雑音信号は、増幅・フィルタ部22-kにおいて増幅される。修正信号発生部50-kは、この雑音信号をキャンセルするために、雑音信号にほぼ等しい振幅および位相を有する修正信号を発生しようとするものである。
そして、減算部52-kは、増幅・フィルタ部22-kの出力信号から修正信号を減算することにより、雑音信号をキャンセルする。これにより、検波部34-1~34-Nには、雑音信号をキャンセルした信号が供給されるようになる。上述した以外の処理装置3aの構成は、第1実施形態の処理装置3(図5参照)と同様である。
〈第2実施形態の動作〉
(メインルーチン)
次に、本実施形態の動作を説明する。図10は、図9に示した評価装置4(より詳細には、図5に示すデータ処理部43)にて実行されるメインルーチンのフローチャートである。
図10において処理がステップS20に進むと、評価装置4は所定の初期設定を行う。次に、処理がステップS22に進むと、評価装置4は、メモリ部36との間で通信を開始させる。次に、処理がステップS24に進むと、評価装置4は、記憶部47から、装置設定データを読み取る。この装置設定データには、上述した修正信号の振幅および位相等のデータが含まれる。
(メインルーチン)
次に、本実施形態の動作を説明する。図10は、図9に示した評価装置4(より詳細には、図5に示すデータ処理部43)にて実行されるメインルーチンのフローチャートである。
図10において処理がステップS20に進むと、評価装置4は所定の初期設定を行う。次に、処理がステップS22に進むと、評価装置4は、メモリ部36との間で通信を開始させる。次に、処理がステップS24に進むと、評価装置4は、記憶部47から、装置設定データを読み取る。この装置設定データには、上述した修正信号の振幅および位相等のデータが含まれる。
次に、処理がステップS26に進むと、評価装置4は、操作入力部45(図5参照)を介して、ユーザから計測スタート指示が入力されたか否かが判定される。そして、該計測スタート指示が入力されるまで、ステップS26にて処理が待機する。計測スタート指示が入力されると、処理はステップS28に進み、ユーザが操作入力部45にて修正パラメータ計測操作を行ったか否かが判定される。なお、修正パラメータとは、修正信号発生部50-1~50-Nが出力する各修正信号の振幅および位相を指定するパラメータである。
ここで「No」と判定されると、処理はステップS32に進み、操作入力部45にてユーザがデータ収集操作を行なったか否かが判定される。ここで「No」と判定されると、処理はステップS36に進み、ユーザが計測停止操作を行なったか否かが判定される。ここで「No」と判定されると、処理はステップS40に進み、ユーザが通信停止操作を行なったか否かが判定される。ここで「No」と判定されると、処理はステップS28に戻る。以後、ステップS28,S32,S36,S40の何れかにおいて「Yes」と判定されるまで、これらのステップが繰り返される。
ステップS28において「Yes」と判定されると、処理はステップS30に進む。ここでは、後述する修正パラメータ計測サブルーチン(図11~図13)が実行され、各修正信号の振幅および位相が決定された後、処理はステップS28に戻る。また、ステップS32において「Yes」と判定されると、処理はステップS34に進む。ここでは、評価装置4は、データ収集処理を実行する。すなわち、検出装置2を介して、検査データを収集し、処理はステップS32に戻る。
また、ステップS36において「Yes」と判定されると、処理はステップS38に進む。ここでは、評価装置4は、修正パラメータまたは検査データの計測をストップさせ、処理はステップS26に戻る。また、ステップS40において「Yes」と判定されると、処理はステップS42に進む。ここでは、評価装置4は、メモリ部36との間の通信を終了させ、本ルーチンの処理も終了する。
(修正パラメータ計測サブルーチン)
図11~図13は、上述したステップS30にて実行される修正パラメータ計測サブルーチンのフローチャートである。
この処理を実行させる場合には、図1に示す鉄道レール100として、欠陥が無い(新品に近い)ものを準備し、検出装置2に対向させておく。図11~図13に示す修正パラメータ計測サブルーチンは、修正信号発生部50-1~50-Nの各々に対して順次実行される。但し、図11~図13においては、一つの修正信号発生部50-k(但し、1≦k≦N)に対する修正パラメータを計測する処理内容を示す。すなわち、図11~図13に示す処理は、N回繰り返されることにより、修正信号発生部50-1~50-Nの全てに対して、修正パラメータが計測される。
図11において処理がステップS102に進むと、評価装置4は、所定サンプル数(複数)の測定データを取得する。ここで、「測定データ」とは、主として振幅信号Rを測定したデータである。より具体的には、評価装置4は、まず発振部33に対してデジタル発振信号を出力させる。次に、評価装置4は、計測対象である修正信号発生部50-kに対して、修正パラメータの初期値を設定する。ここで、修正パラメータとは、修正信号の振幅を指定する振幅指令値CAN_VOLT2と、修正信号の位相を指定する位相指令値CAN_PH1と、を含んでいる。すなわち、ステップS102においては、評価装置4は、所定の初期値である振幅指令値CAN_VOLT2および位相指令値CAN_PH1を、修正信号発生部50-kに供給する。これにより、修正信号発生部50-kは、設定された振幅および位相を有する修正信号を減算部52-kに供給する。
発振部33がデジタル発振信号を出力すると、デジタルアナログ変換部32、増幅部31-kを介して、発振コイル5A-k,5B-kが磁束を発生し、受信コイル6-kには誘起電圧が発生する。増幅・フィルタ部22-kは、該誘起電圧を増幅・フィルタ処理し、減算部52-kに供給する。減算部52-kは、増幅・フィルタ部22-kの出力信号から修正信号を減算し、その結果を検波部34-kに供給する。そして、検波部34-kは、減算部52-kの出力信号に基づいて、振幅信号Rを計算する。これにより、振幅信号Rの1サンプルの測定データが得られる。
但し、振幅信号Rの正確性を担保するため、ステップS102においては、同様の条件で複数サンプルの(より好ましくは、5サンプル以上の)振幅信号Rを測定する。なお、検波部34-kが振幅信号Rを計算することに代えて、検波部34-kが計測した余弦信号Xおよび正弦信号Yに基づいて、評価装置4が振幅信号Rを計算してもよい。
図11において次に処理がステップS104に進むと、評価装置4は、取得した所定サンプル数の振幅信号Rの測定データの平均値を計算する。計算した平均値を平均振幅値R_p0とする。次に、処理がステップS106に進むと、平均振幅値R_p0が所定の平均振幅基準値R_pth未満であるか否かを判定する。なお、平均振幅基準値R_pthは、充分に低い値、例えば0.005Vである。ここで「Yes」と判定されると、本ルーチンの処理は終了する。これは、修正パラメータの初期値すなわち振幅指令値CAN_VOLT2および位相指令値CAN_PH1の初期値が共に充分に信頼できる値であり、欠陥の無い鉄道レール100に対して振幅信号Rが充分に低い値になっていることを意味する。従って、かかる場合は、初期値をそのまま修正パラメータとして適用することとし、本ルーチンの処理をする。
一方、平均振幅値R_p0が平均振幅基準値R_pth以上であれば、ステップS106において「No」と判定され、処理はステップS108に進む。ここでは、振幅比較値CAN_VOLT1と称する所定の変数の値が振幅指令値CAN_VOLT2に代入される。なお、振幅比較値CAN_VOLT1は、この時点では、0よりも若干大きな所定値に設定されている。
次に、処理がステップS110に進むと、上述したステップS102と同様に、振幅信号Rの測定データが取得される。その際、修正信号の位相は、ステップS102の場合と同様に所定の初期値であるが、修正信号の振幅は、先のステップS108で設定された振幅指令値CAN_VOLT2(=振幅比較値CAN_VOLT1)に設定される。次に、処理がステップS112に進むと、評価装置4は、取得した所定サンプル数の振幅信号Rの測定データに基づいて、これらの平均振幅値R_p1を計算する。次に、処理がステップS114に進むと、ステージ番号STに1が代入される。
ここで、ステージ番号STの意義について説明する。本実施形態においては、修正信号発生部50-kが発生する修正信号の振幅および位相を徐々に変化させながら振幅信号Rを測定し、振幅信号Rの平均値がなるべく小さくなる振幅および位相を求め、その結果を修正パラメータに設定する。ここで、振幅を徐々に変動させる際の変動単位を「振幅増減値ΔV」と呼ぶ。また、位相を徐々に変動させる際の変動単位を「位相増減値ΔP」と呼ぶ。但し、振幅増減値ΔVおよび位相増減値ΔPは一定ではなく、最初は大きな値とし、段階的に小さな値に変更してゆくことによって、なるべく速やかに、正確な修正パラメータを求めようとしている。ステージ番号STは、振幅増減値ΔVおよび位相増減値ΔPを小さくしてゆく段階を1~3の自然数で表すものである。
次に、図12において、処理がステップS120に進むと、評価装置4は、振幅増減値ΔVに対して、電圧変動単位初期値ΔVD[ST]を代入する。電圧変動単位初期値ΔVD[ST]は、ステージ番号STに応じて、例えば、電圧変動単位初期値ΔVD[1]=0.1V、電圧変動単位初期値ΔVD[2]=0.01V、電圧変動単位初期値ΔVD[3]=0.001Vに設定されている。ステップS120が最初に実行される際、ステージ番号STは1であるから、上記例では、振幅増減値ΔVは0.1Vに設定される。
次に、処理がステップS122に進むと、評価装置4は、振幅比較値CAN_VOLT1と振幅増減値ΔVとの加算結果を振幅指令値CAN_VOLT2に代入する。次に、処理がステップS124に進むと、上述したステップS102,S110と同様に、振幅信号Rの測定データが取得される。この場合も、修正信号の位相は所定の初期値であるが、修正信号の振幅は、ステップS122で得られた振幅指令値CAN_VOLT2である。次に、処理がステップS126に進むと、評価装置4は、取得した所定サンプル数の振幅信号Rの測定データに基づいて、これらの平均振幅値R_p2を計算する。
次に、処理がステップS128に進むと、評価装置4は、平均振幅値R_p1が平均振幅値R_p2よりも小さいか否を判定する。上述の例では、平均振幅値R_p1は、CAN_VOLT1を振幅指令値CAN_VOLT2に代入した場合の平均振幅値であった。また、平均振幅値R_p2は、「CAN_VOLT1+ΔV」を振幅指令値CAN_VOLT2に代入した場合の平均振幅値であった。仮に、前者が後者よりも小さいとすると、振幅増減値ΔVの符号(正負)は、平均振幅値を増加させる方向にあり、望ましくない符号であると考えらえる。そこで、かかる場合は、ステップS128において「Yes」と判定され、処理はステップS132に進む。ステップS132において、評価装置4は、振幅増減値ΔVの符号(正負)を反転させる。
一方、ステップS128において「No」と判定されると、処理はステップS130に進み、評価装置4は、平均振幅値R_p2を平均振幅値R_p1に代入する。これは、過去に求めた平均振幅値のうち、最も好ましい(小さな)値を平均振幅値R_p1として保持するためである。ステップS130またはS132の処理が終了すると、処理はステップS134に進み、評価装置4は、振幅比較値CAN_VOLT1と振幅増減値ΔVとの加算結果を振幅指令値CAN_VOLT2に代入する。
次に、処理がステップS136に進むと、上述したステップS102,S110等と同様に、振幅信号Rの測定データが取得される。次に、処理がステップS138に進むと、評価装置4は、取得した所定サンプル数の振幅信号Rの測定データに基づいて、これらの平均振幅値R_p2を計算する。次に、処理がステップS140に進むと、評価装置4は、平均振幅値R_p1が平均振幅値R_p2よりも小さいか否を判定する。
ここで「No」と判定されると、処理はステップS142に進み、評価装置4は、振幅比較値CAN_VOLT1に振幅指令値CAN_VOLT2を代入するとともに、平均振幅値R_p1に平均振幅値R_p2を代入する。これにより、過去に求めた平均振幅値R_p2のうち、最も好ましい(小さな)値が平均振幅値R_p1として保持され、該平均振幅値R_p1を実現した振幅指令値CAN_VOLT2が振幅比較値CAN_VOLT1として保持される。そして、処理はステップS134に戻る。以後、平均振幅値R_p2が平均振幅値R_p1以下である限り、ステップS134~S142のループが繰り返される。
ここで、ステップS138で求めた平均振幅値R_p2が平均振幅値R_p1よりも大きければ、ステップS140において「Yes」と判定され、処理はステップS144に進む。ここでは、振幅指令値CAN_VOLT2に振幅比較値CAN_VOLT1が代入される。このステップS144が終了した時点では、現在の振幅増減値ΔV(例えば0.1V)単位で修正信号の振幅を変動させていった際、最も好ましい(振幅信号Rを小さくする)振幅が、振幅比較値CAN_VOLT1に代入されていることになる。
次に、図13において、処理がステップS220に進むと、評価装置4は、位相増減値ΔPに対して、位相変動単位初期値ΔPD[ST]を代入する。位相変動単位初期値ΔPD[ST]は、ステージ番号STに応じて、例えば、位相変動単位初期値ΔPD[1]=10°、位相変動単位初期値ΔPD[2]=1°、位相変動単位初期値ΔPD[3]=0.1°に設定されている。ステップS220が最初に実行される際、ステージ番号STは1であるから、上記例では、位相増減値ΔPは10°に設定される。
次に、処理がステップS222に進むと、評価装置4は、位相比較値CAN_PH0と位相増減値ΔPとの加算結果を位相指令値CAN_PH1に代入する。なお、この時点で位相比較値CAN_PH0は、上述した修正パラメータの初期値のうち、位相の初期値である。次に、処理がステップS224に進むと、上述したステップS102(図11参照)と同様に、振幅信号Rの測定データが取得される。次に、処理がステップS226に進むと、評価装置4は、取得した所定サンプル数の振幅信号Rの測定データに基づいて、これらの平均振幅値R_p2を計算する。
次に、処理がステップS228に進むと、評価装置4は、平均振幅値R_p1が平均振幅値R_p2よりも小さいか否を判定する。ここで、平均振幅値R_p1には、ステップS128またはS142(図12参照)が最後に実行された際、過去に計算された平均振幅値R_p2のうち最も好ましい(小さな)値が代入されている。ステップS228において「Yes」と判定されると、処理はステップS232に進み、評価装置4は、位相増減値ΔPの符号(正負)を反転させる。
一方、ステップS228において「No」と判定されると、処理はステップS230に進み、評価装置4は、平均振幅値R_p2を平均振幅値R_p1に代入する。ステップS230またはS232の処理が終了すると、処理はステップS234に進み、評価装置4は、位相比較値CAN_PH0と位相増減値ΔPとの加算結果を位相指令値CAN_PH1に代入する。
次に、処理がステップS236に進むと、上述したステップS224と同様に、振幅信号Rの測定データが取得される。次に、処理がステップS238に進むと、評価装置4は、取得した所定サンプル数の振幅信号Rの測定データに基づいて、これらの平均振幅値R_p2を計算する。次に、処理がステップS240に進むと、評価装置4は、平均振幅値R_p1が平均振幅値R_p2よりも小さいか否を判定する。
ここで「No」と判定されると、処理はステップS242に進み、評価装置4は、位相比較値CAN_PH0に位相指令値CAN_PH1を代入するとともに、平均振幅値R_p1に平均振幅値R_p2を代入する。これにより、過去に求めた平均振幅値R_p2のうち、最も好ましい(小さな)値が平均振幅値R_p1として保持され、該平均振幅値R_p1を実現した位相指令値CAN_PH1が位相比較値CAN_PH0として保持される。そして、処理はステップS234に戻る。以後、平均振幅値R_p2が平均振幅値R_p1以下である限り、ステップS234~S242のループが繰り返される。
ここで、ステップS238で求めた平均振幅値R_p2が平均振幅値R_p1よりも大きければ、ステップS240において「Yes」と判定され、処理はステップS244に進む。ここでは、位相指令値CAN_PH1に位相比較値CAN_PH0が代入される。このステップS244が終了した時点では、現在の位相増減値ΔP(例えば10°)単位で修正信号の振幅を変動させていった際、最も好ましい(振幅信号Rを小さくする)位相が位相指令値CAN_PH1に代入されていることになる。
次に、処理がステップS246に進むと、ステージ番号STは3であるか否かが判定される。ここで「No」と判定されると、処理はステップS248に進み、ステージ番号STが1だけインクリメントされる。例えば、従前のステージ番号STが1であれば、ここでステージ番号STには2が代入される。そして、処理は図12のステップS120に戻る。
ステージ番号STが2になると、ステップS120において振幅増減値ΔVには電圧変動単位初期値ΔVD[2]、例えば0.01Vが代入され、上述したステップS122~S144の処理が実行される。次に、処理が図13のステップS220に進むと、位相増減値ΔPには、位相変動単位初期値ΔPD[2]、例えば1°が代入され、上述したステップS222~S244の処理が実行される。次に、ステップS246を介して処理がステップS248に進むと、ステージ番号STが再びインクリメントされ、例えば3になる。
ステージ番号STが3になると、ステップS120において振幅増減値ΔVには電圧変動単位初期値ΔVD[3]、例えば0.001Vが代入され、上述したステップS122~S144の処理が実行される。次に、処理が図13のステップS220に進むと、位相増減値ΔPには、位相変動単位初期値ΔPD[3]、例えば0.1°が代入され、上述したステップS222~S244の処理が実行される。
以上の処理により、欠陥の無い鉄道レール100に対して、振幅信号Rを充分に小さくできる振幅指令値CAN_VOLT2および位相指令値CAN_PH1が求められた。次に、処理がステップS246に進むと、ステージ番号STは3であるから、「Yes」と判定される。これにより、修正パラメータ計測サブルーチン(図11~図13)の処理は終了し、処理はメインルーチン(図10)のステップS28に戻る。
その後、ステップS34のデータ収集処理によって検査データを取得する際には、修正信号発生部50-1~50-Nは、振幅指令値CAN_VOLT2および位相指令値CAN_PH1に基づいて、各々の修正信号を出力する。
〈第2実施形態の効果〉
以上のように、本実施形態は、発振信号と同一の周波数を有し、発振信号とは振幅および位相が異なる修正信号を複数の受信コイル(6-1~6-N)にそれぞれ対応して出力する複数の修正信号発生部(50-1~50-N)と、複数のセンサ部(21-1~21-N)の出力信号から対応する修正信号を各々減算し、各々の減算結果を対応する検波部(34-1~34-N)に供給する減算部(52-1~52-N)と、をさらに有する。
これにより、発振コイル5A-k,5B-k(図4参照)の加工精度が低い場合であっても、雑音信号を電気的にキャンセルすることができ、鉄道レール100の欠陥を精密に検出することができる。
以上のように、本実施形態は、発振信号と同一の周波数を有し、発振信号とは振幅および位相が異なる修正信号を複数の受信コイル(6-1~6-N)にそれぞれ対応して出力する複数の修正信号発生部(50-1~50-N)と、複数のセンサ部(21-1~21-N)の出力信号から対応する修正信号を各々減算し、各々の減算結果を対応する検波部(34-1~34-N)に供給する減算部(52-1~52-N)と、をさらに有する。
これにより、発振コイル5A-k,5B-k(図4参照)の加工精度が低い場合であっても、雑音信号を電気的にキャンセルすることができ、鉄道レール100の欠陥を精密に検出することができる。
[第3実施形態]
次に、本発明の第3実施形態について説明する。なお、以下の説明において、図1~図13の各部に対応する部分には同一の符号を付し、その説明を省略する場合がある。
図14は、本発明の第3実施形態によるレール検査システム1bの全体構成を示すブロック図である。本実施形態のレール検査システム1bの外観構成は、第1実施形態のもの(図1~図3参照)と同様である。また、検出装置2の構成も第1実施形態のもの(図5参照)と同様である。但し、第1実施形態の処理装置3(図5参照)に代えて、本実施形態においては、処理装置3bが適用される。なお、図14においては評価装置4の内部は省略するが、評価装置4の構成も図5のものと同様である。
本実施形態の処理装置3bは、第2実施形態の処理装置3a(図9参照)と同様に、各増幅・フィルタ部22-1~22-Nに対応して修正信号発生部50-1~50-Nと、減算部52-1~52-Nとが設けられている。但し、本実施形態においては、図14に示すように、増幅・フィルタ部22-1~22-Nに対応して、個別の発振部33-1~33-Nを有している。これら発振部33-1~33-Nは、相互に異なる発振周波数f1~fN(所定周波数)のデジタル発振信号および参照信号を出力する。
発振部33-k(但し、1≦k≦N)は、発振周波数fkのデジタル発振信号をデジタルアナログ変換部32および修正信号発生部50-kに供給するとともに、発振周波数fkの参照信号を検波部34-kに供給する。デジタルアナログ変換部32は、Nチャンネルのデジタル発振信号を各々アナログ信号に変換し、センサ部21-1~21-Nに供給する。これにより、センサ部21-kの受信コイル6-kは、周波数fkの誘起電圧を発生し、この誘起電圧は増幅・フィルタ部22-kによって増幅およびフィルタ処理される。
そして、修正信号発生部50-kは、発振周波数fkの修正信号を減算部52-kに供給し、減算部52-kは、増幅・フィルタ部22-kの出力信号から修正信号を減算することにより、雑音信号をキャンセルする。これにより、検波部34-1~34-Nには、雑音信号をキャンセルした信号が供給されるようになる。上述した以外の処理装置3bの構成は、第1実施形態の処理装置3(図5参照)と同様である。
図3に示したように、検出装置2には複数のセンサ部21-1~21-Nが配列されてセンサ部群21を構成しているが、第1,第2実施形態のようにこれらの発振コイル5A-1~5A-N,5B-1~5B-Nに同一周波数の磁束を発生させると、相互に干渉が生じる場合がある。これに対して、図14の本実施形態によれば、各センサ部21-1~21-Nに対して異なる発振周波数f1~fNが適用されるため、センサ部21-1~21-Nの相互の干渉を低減することができる。なお、鉄道レール100が軌道回路の一部を構成する場合には、全ての発振周波数fk(但し、1≦k≦N)を、軌道回路に用いられる周波数に対して±0.07fk以上離れた周波数の中から選択することが好ましい。
以上のように本実施形態によれば、発振部(33-1~33-N)は、複数のセンサ部(21-1~21-N)に対して、周波数(f1~fN)が各々異なる発振信号を出力する。これにより、センサ部(21-1~21-N)相互間の干渉を低減することができる。
[第4実施形態]
次に、本発明の第4実施形態について説明する。なお、以下の説明において、図1~図14の各部に対応する部分には同一の符号を付し、その説明を省略する場合がある。
上述した第1~第3実施形態において、検測車両200(図1参照)の走行速度を上げると、レール検査をより迅速に実行することができる。しかし、検測車両200の走行速度を上げると、検測車両200の振動も大きくなり、この振動が各信号X,Y,R,θに影響を及ぼすようになる。
次に、本発明の第4実施形態について説明する。なお、以下の説明において、図1~図14の各部に対応する部分には同一の符号を付し、その説明を省略する場合がある。
上述した第1~第3実施形態において、検測車両200(図1参照)の走行速度を上げると、レール検査をより迅速に実行することができる。しかし、検測車両200の走行速度を上げると、検測車両200の振動も大きくなり、この振動が各信号X,Y,R,θに影響を及ぼすようになる。
ここで、図15を参照し、検測車両200の高速化に伴う影響を説明する。なお、図15は、余弦信号Xの波形図の例である。図15は、図8Bに示した余弦信号Xの波形の時間軸を縮小したものに相当し、図15に示す時刻t1~t3は、図8Bに示した時刻t1~t3に対応する。
図15において実線は、検測車両200の速度が比較的遅い場合の余弦信号Xの波形の例である。この場合、欠陥部102(図8A参照)から離れた区間(時刻t1以前およびt3以降)において、余弦信号Xのレベルは、ほぼオフセット値BLに一致している。一方、二点鎖線は、検測車両200の速度が比較的速い場合の余弦信号Xの波形の例である。検測車両200の速度が速くなると、検測車両200が振動し、欠陥部から離れた区間においても余弦信号Xが変動する。このため、欠陥部102が現れる時刻t1~t3における余弦信号Xの変動が、振動による変動と区別し難くなる場合がある。
以上、余弦信号Xの例について述べたが、検測車両200の振動によって、他の信号Y,R,θも同様に変動する。本実施形態は、検測車両200の振動による影響を補償し、検測車両200をより高速度で運用可能にするものである。
ここで、欠陥部102から離れた区間(時刻t1以前およびt3以降)において、信号Y,R,θの波形は、余弦信号Xの波形と同様になる。一方、図8Bにて説明したように、欠陥部102(時刻t1~t3)における振幅信号R、位相差信号θの波形は余弦信号Xのものとは明らかに相違する。なお、正弦信号Yの波形形状(図示せず)は余弦信号Xと同様になる。
ここで、欠陥部102から離れた区間(時刻t1以前およびt3以降)において、信号Y,R,θの波形は、余弦信号Xの波形と同様になる。一方、図8Bにて説明したように、欠陥部102(時刻t1~t3)における振幅信号R、位相差信号θの波形は余弦信号Xのものとは明らかに相違する。なお、正弦信号Yの波形形状(図示せず)は余弦信号Xと同様になる。
そこで、例えば、振幅信号Rと余弦信号Xとの差分である差分信号R-Xを求めると、この差分信号R-Xは、欠陥部102から離れた時刻t1以前およびt3以降においてほぼ0になる。一方、欠陥部102に対応する時刻t1~t3においては、図8Bに示したように、余弦信号Xの波形と振幅信号Rの波形とは明らかに異なるため、両者の差分信号R-Xは有意な振幅が生じる信号になると考えられる。従って、差分信号R-Xによって欠陥部102の有無を判別すると、検測車両200の振動による影響を軽減できる。
次に、本実施形態の構成を説明する。本実施形態の全体構成は第3実施形態のもの(図14参照)と同様であるが、図16に示す箇所の構成が異なっている。なお、図16は、本実施形態におけるレール検査システム1の要部の回路図である。
図16において、検波部34-k(但し、1≦k≦N)は、第1~第3実施形態のもの(図6参照)と同様である。本実施形態においては、各検波部34-kの後段に、ゲイン調整部90,92と、差動増幅器94とが追加される。
図16において、検波部34-k(但し、1≦k≦N)は、第1~第3実施形態のもの(図6参照)と同様である。本実施形態においては、各検波部34-kの後段に、ゲイン調整部90,92と、差動増幅器94とが追加される。
ゲイン調整部90,92は、欠陥の無い区間における余弦信号Xおよび振幅信号Rのレベルがほぼ等しくなるように、これらのゲインを設定しておくとよい。そして、差動増幅器94は、ゲイン調整された振幅信号Rおよび余弦信号Xの差分である差分信号R-Xを出力する。そして、アナログデジタル変換部35は、各信号X,Y,R,θに加えて、差分信号R-Xをデジタル信号に変換し、メモリ部36を介して評価装置4に供給する。そして、評価装置4は、差分信号R-Xに基づいて、鉄道レール100の欠陥部102を検出する。上述した以外の本実施形態の構成および動作は、第3実施形態のものと同様である。
以上のように、本実施形態によれば、差分信号R-Xに基づいて鉄道レール100の欠陥部102を検出するため、検測車両200が高速走行した場合においても、検測車両200の振動による影響を軽減することができる。
[変形例]
本発明は上述した実施形態に限定されるものではなく、種々の変形が可能である。上述した実施形態は本発明を理解しやすく説明するために例示したものであり、必ずしも説明した全ての構成を備えるものに限定されるものではない。また、ある実施形態の構成の一部を他の実施形態の構成に置き換えることが可能であり、また、ある実施形態の構成に他の実施形態の構成を加えることも可能である。また、各実施形態の構成の一部について削除し、若しくは他の構成の追加・置換をすることが可能である。また、図中に示した制御線や情報線は説明上必要と考えられるものを示しており、製品上で必要な全ての制御線や情報線を示しているとは限らない。実際には殆ど全ての構成が相互に接続されていると考えてもよい。上記実施形態に対して可能な変形は、例えば以下のようなものである。
本発明は上述した実施形態に限定されるものではなく、種々の変形が可能である。上述した実施形態は本発明を理解しやすく説明するために例示したものであり、必ずしも説明した全ての構成を備えるものに限定されるものではない。また、ある実施形態の構成の一部を他の実施形態の構成に置き換えることが可能であり、また、ある実施形態の構成に他の実施形態の構成を加えることも可能である。また、各実施形態の構成の一部について削除し、若しくは他の構成の追加・置換をすることが可能である。また、図中に示した制御線や情報線は説明上必要と考えられるものを示しており、製品上で必要な全ての制御線や情報線を示しているとは限らない。実際には殆ど全ての構成が相互に接続されていると考えてもよい。上記実施形態に対して可能な変形は、例えば以下のようなものである。
(1)上記各実施形態における評価装置4のハードウエアは一般的なコンピュータによって実現できるため、図7,図10~図13に示したフローチャートに係るプログラム等を記憶媒体に格納し、または伝送路を介して頒布してもよい。
(2)図7,図10~図13等に示した処理は、上記実施形態ではプログラムを用いたソフトウエア的な処理として説明したが、その一部または全部をASIC(Application Specific Integrated Circuit;特定用途向けIC)、あるいはFPGA(field-programmable gate array)等を用いたハードウエア的な処理に置き換えてもよい。
(3)上記各実施形態において、検出装置2および処理装置3は検測車両200(図1参照)に装着されるものであったが、これらを手押し式の台車(図示せず)等に装着し、ユーザが持ち運べるようにしてもよい。
(4)また、上記各実施形態において、検波部34-k(但し、1≦k≦N)は、余弦信号X、正弦信号Y、振幅信号Rおよび位相差信号θを出力したが、これらの信号を時間微分した値を、各信号X,Y,R,θとともに(または各信号X,Y,R,θに代えて)出力してもよい。また、2次元画像130(図8C参照)に、これら時間微分した値を表示してもよい。
(5)上記第4実施形態では、振幅信号Rおよび余弦信号Xの差分を求めたが、「信号X,Yのうち何れか一方」と、「信号R,θのうち何れか一方」との差分を求めても、振動による影響を軽減しつつ、同様に欠陥部102を検出できる。例えば、図17に示すように、ゲイン調整部92に対して位相差信号θを供給し、余弦信号Xと位相差信号θとの差分である差分信号θ-Xを差動増幅器94から出力させてもよい。
1,1a,1b レール検査システム
2 検出装置
3,3a,3b 処理装置
4 評価装置
5A-1~5A-N 発振コイル(第1の発振コイル)
5B-1~5B-N 発振コイル(第2の発振コイル)
6-1~6-N 受信コイル
21 センサ部群
21-1~21-N センサ部
33,33-1~33-N 発振部
34 検波部群
34-1~34-N 検波部
44 出力処理部
50-1~50-N 修正信号発生部
52-1~52-N 減算部
100 鉄道レール
102 欠陥部
110~114,121~124 領域
130 2次元画像
R 振幅信号(表示対象信号)
X 余弦信号(第1の検査信号,表示対象信号)
Y 正弦信号(第2の検査信号,表示対象信号)
θ 位相差信号(表示対象信号)
f,f1~fN 発振周波数(所定周波数)
Claims (7)
- 受信コイルと前記受信コイルに対応した第1の発振コイルおよび第2の発振コイルとを含んでなるセンサ部が、検査対象である鉄道レールの幅方向に列をなすように複数配列されたセンサ部群と、
前記センサ部群の前記第1の発振コイルおよび前記第2の発振コイルの各々に発振信号を供給する発振部と、
前記センサ部群が前記鉄道レールの敷設方向に移動する際、前記受信コイルの各々から出力される出力信号に対して、前記出力信号の第1の位相に対応する第1の検査信号と、前記出力信号の第2の位相に対応する第2の検査信号と、を検出する複数の検波部を有する検波部群と、
を有することを特徴とするレール検査システム。 - 前記第1の検査信号、前記第2の検査信号または前記第1の検査信号と前記第2の検査信号に演算処理を施した結果を表示対象信号とし、複数の前記センサ部に対応する前記表示対象信号の強度分布を2次元画像として出力する出力処理部
をさらに有することを特徴とする請求項1に記載のレール検査システム。 - 前記2次元画像は、前記表示対象信号の強度に対応して表示態様を設定した等高線画像である
ことを特徴とする請求項2に記載のレール検査システム。 - 前記2次元画像は、前記鉄道レールの敷設方向の位置および幅方向の位置を軸とする画像である
ことを特徴とする請求項3に記載のレール検査システム。 - 前記表示対象信号は、前記鉄道レールに形成された欠陥部の深さに応じた強度を有する信号であり、
前記2次元画像は、前記欠陥部の深さを前記表示態様によって示す画像である
ことを特徴とする請求項4に記載のレール検査システム。 - 前記発振信号と同一の周波数を有し、前記発振信号とは振幅および位相が異なる修正信号を複数の前記受信コイルにそれぞれ対応して出力する複数の修正信号発生部と、
複数の前記センサ部の出力信号から対応する前記修正信号を各々減算し、各々の減算結果を対応する前記検波部に供給する減算部と、
をさらに有することを特徴とする請求項1に記載のレール検査システム。 - 前記発振部は、複数の前記センサ部に対して、周波数が各々異なる発振信号を出力する
ことを特徴とする請求項1に記載のレール検査システム。
Priority Applications (2)
| Application Number | Priority Date | Filing Date | Title |
|---|---|---|---|
| US16/468,632 US10989694B2 (en) | 2016-12-21 | 2017-09-11 | Rail inspection system |
| EP17885193.7A EP3561501B1 (en) | 2016-12-21 | 2017-09-11 | Rail inspection system |
Applications Claiming Priority (2)
| Application Number | Priority Date | Filing Date | Title |
|---|---|---|---|
| JP2016248281A JP6768486B2 (ja) | 2016-12-21 | 2016-12-21 | レール検査システム |
| JP2016-248281 | 2016-12-21 |
Publications (1)
| Publication Number | Publication Date |
|---|---|
| WO2018116546A1 true WO2018116546A1 (ja) | 2018-06-28 |
Family
ID=62626259
Family Applications (1)
| Application Number | Title | Priority Date | Filing Date |
|---|---|---|---|
| PCT/JP2017/032723 Ceased WO2018116546A1 (ja) | 2016-12-21 | 2017-09-11 | レール検査システム |
Country Status (4)
| Country | Link |
|---|---|
| US (1) | US10989694B2 (ja) |
| EP (1) | EP3561501B1 (ja) |
| JP (1) | JP6768486B2 (ja) |
| WO (1) | WO2018116546A1 (ja) |
Families Citing this family (13)
| Publication number | Priority date | Publication date | Assignee | Title |
|---|---|---|---|---|
| US10362293B2 (en) | 2015-02-20 | 2019-07-23 | Tetra Tech, Inc. | 3D track assessment system and method |
| US10807623B2 (en) | 2018-06-01 | 2020-10-20 | Tetra Tech, Inc. | Apparatus and method for gathering data from sensors oriented at an oblique angle relative to a railway track |
| US11377130B2 (en) | 2018-06-01 | 2022-07-05 | Tetra Tech, Inc. | Autonomous track assessment system |
| WO2020232431A1 (en) | 2019-05-16 | 2020-11-19 | Tetra Tech, Inc. | System and method for generating and interpreting point clouds of a rail corridor along a survey path |
| US10969292B2 (en) | 2019-08-30 | 2021-04-06 | Balanced Engineering Solution, Llc | Apparatus for measuring imbalance forces of a tire/hub assembly of a vehicle during motion of the vehicle |
| JP7341922B2 (ja) * | 2020-02-28 | 2023-09-11 | 株式会社日立ビルシステム | ワイヤー検査システム及びワイヤー検査装置 |
| CN111307933A (zh) * | 2020-04-15 | 2020-06-19 | 新兴铸管股份有限公司 | 铸钢管无损检测方法 |
| EP4469332A4 (en) | 2022-01-25 | 2026-01-28 | Herzog Services Inc | ROLLER RESEARCH UNIT WITH INTEGRATED DIGITAL CIRCUITS FOR DETECTING RAIL DEFECTS |
| JP7835624B2 (ja) * | 2022-06-13 | 2026-03-25 | 株式会社日立製作所 | レール状態監視装置およびレール状態監視方法 |
| US11731673B1 (en) | 2022-09-26 | 2023-08-22 | Balanced Engineering Solution, Llc | Wheel-mounted sensor ring apparatus for determining anomalies associated with a railcar wheelset, or a railcar bogie assembly that the railcar wheelset is part of, or a track |
| US11656156B1 (en) | 2022-09-26 | 2023-05-23 | Balanced Engineering Solution, Llc | Axle-mounted sensor cuff apparatus for determining anomalies associated with a railcar wheelset, or a railcar bogie assembly that the railcar wheelset is part of, or a track |
| CN117601923B (zh) * | 2023-11-28 | 2024-04-30 | 唐山中弘智能科技有限公司 | 轨道探伤自动巡检系统 |
| JP2026007956A (ja) * | 2024-07-04 | 2026-01-19 | 株式会社日立ハイテク | 金属体検査装置 |
Citations (11)
| Publication number | Priority date | Publication date | Assignee | Title |
|---|---|---|---|---|
| JPS597940B2 (ja) * | 1979-02-26 | 1984-02-21 | 株式会社エレクトロニクスキヨ−ト | 鋳鉄管探傷装置 |
| JPH08261991A (ja) * | 1995-03-22 | 1996-10-11 | Ichiro Sasada | 渦電流プローブ |
| JP2003050234A (ja) * | 2001-08-07 | 2003-02-21 | Marktec Corp | 渦流探傷試験装置 |
| US20050285588A1 (en) | 2004-06-25 | 2005-12-29 | Gopichand Katragadda | Method and apparatus for testing material integrity |
| JP2006226884A (ja) * | 2005-02-18 | 2006-08-31 | Hitachi Ltd | 渦電流探傷プローブ及び渦電流探傷装置 |
| JP2011196863A (ja) * | 2010-03-19 | 2011-10-06 | Jfe Steel Corp | 漏洩磁束探傷方法及び漏洩磁束探傷装置 |
| US20130113472A1 (en) * | 2010-03-10 | 2013-05-09 | Jrb Engineering Pty Ltd | Method and apparatus for magnetic crack depth prediction |
| JP2014102197A (ja) * | 2012-11-21 | 2014-06-05 | Meielec:Kk | 磁気誘導式レール探傷方法及び磁気誘導式レール探傷装置 |
| JP2014157078A (ja) * | 2013-02-15 | 2014-08-28 | Mitsubishi Heavy Ind Ltd | 探傷装置及び探傷方法 |
| WO2017006589A1 (ja) * | 2015-07-09 | 2017-01-12 | 株式会社日立ハイテクノロジーズ | レール検査装置、および、レール検査システム |
| JP2017088411A (ja) * | 2016-12-05 | 2017-05-25 | 株式会社日立ビルシステム | ハンドレール検査装置、および、ハンドレール検査システム |
Family Cites Families (9)
| Publication number | Priority date | Publication date | Assignee | Title |
|---|---|---|---|---|
| JP3984653B2 (ja) * | 1996-08-20 | 2007-10-03 | 日本信号株式会社 | 弾性波を用いた情報生成装置 |
| WO2002016184A1 (en) * | 2000-08-25 | 2002-02-28 | Em-Tech Llc | Detection of anomalies on railroad tracks |
| WO2002030729A1 (en) * | 2000-10-10 | 2002-04-18 | Sperry Rail, Inc. | Hi-rail vehicle-based rail inspection system |
| US7082833B2 (en) * | 2003-06-06 | 2006-08-01 | Luna Innovations | Method and apparatus for determining and assessing a characteristic of a material |
| JP4917899B2 (ja) | 2006-03-03 | 2012-04-18 | 株式会社日立製作所 | 渦電流探傷センサ及び渦電流探傷方法 |
| US20130024135A1 (en) | 2011-07-22 | 2013-01-24 | Blum Dieter W | Method And Apparatus For Ferromagnetic Cable Inspection |
| JP2014066688A (ja) | 2012-09-27 | 2014-04-17 | Hosei Univ | 渦流探傷プローブ、渦流探傷装置 |
| US9669851B2 (en) * | 2012-11-21 | 2017-06-06 | General Electric Company | Route examination system and method |
| JP6625489B2 (ja) | 2016-06-28 | 2019-12-25 | 株式会社日立ハイテクファインシステムズ | レール検査システム |
-
2016
- 2016-12-21 JP JP2016248281A patent/JP6768486B2/ja active Active
-
2017
- 2017-09-11 WO PCT/JP2017/032723 patent/WO2018116546A1/ja not_active Ceased
- 2017-09-11 EP EP17885193.7A patent/EP3561501B1/en active Active
- 2017-09-11 US US16/468,632 patent/US10989694B2/en active Active
Patent Citations (11)
| Publication number | Priority date | Publication date | Assignee | Title |
|---|---|---|---|---|
| JPS597940B2 (ja) * | 1979-02-26 | 1984-02-21 | 株式会社エレクトロニクスキヨ−ト | 鋳鉄管探傷装置 |
| JPH08261991A (ja) * | 1995-03-22 | 1996-10-11 | Ichiro Sasada | 渦電流プローブ |
| JP2003050234A (ja) * | 2001-08-07 | 2003-02-21 | Marktec Corp | 渦流探傷試験装置 |
| US20050285588A1 (en) | 2004-06-25 | 2005-12-29 | Gopichand Katragadda | Method and apparatus for testing material integrity |
| JP2006226884A (ja) * | 2005-02-18 | 2006-08-31 | Hitachi Ltd | 渦電流探傷プローブ及び渦電流探傷装置 |
| US20130113472A1 (en) * | 2010-03-10 | 2013-05-09 | Jrb Engineering Pty Ltd | Method and apparatus for magnetic crack depth prediction |
| JP2011196863A (ja) * | 2010-03-19 | 2011-10-06 | Jfe Steel Corp | 漏洩磁束探傷方法及び漏洩磁束探傷装置 |
| JP2014102197A (ja) * | 2012-11-21 | 2014-06-05 | Meielec:Kk | 磁気誘導式レール探傷方法及び磁気誘導式レール探傷装置 |
| JP2014157078A (ja) * | 2013-02-15 | 2014-08-28 | Mitsubishi Heavy Ind Ltd | 探傷装置及び探傷方法 |
| WO2017006589A1 (ja) * | 2015-07-09 | 2017-01-12 | 株式会社日立ハイテクノロジーズ | レール検査装置、および、レール検査システム |
| JP2017088411A (ja) * | 2016-12-05 | 2017-05-25 | 株式会社日立ビルシステム | ハンドレール検査装置、および、ハンドレール検査システム |
Non-Patent Citations (1)
| Title |
|---|
| See also references of EP3561501A4 |
Also Published As
| Publication number | Publication date |
|---|---|
| US20190302057A1 (en) | 2019-10-03 |
| EP3561501B1 (en) | 2026-04-15 |
| JP6768486B2 (ja) | 2020-10-14 |
| JP2018100942A (ja) | 2018-06-28 |
| EP3561501A1 (en) | 2019-10-30 |
| EP3561501A4 (en) | 2020-08-12 |
| US10989694B2 (en) | 2021-04-27 |
Similar Documents
| Publication | Publication Date | Title |
|---|---|---|
| JP6768486B2 (ja) | レール検査システム | |
| JP6506122B2 (ja) | レール検査装置、および、レール検査システム | |
| KR101909768B1 (ko) | 표면 특성 검사 장치 및 표면 특성 검사 방법 | |
| US9389282B2 (en) | Magnetism detection device | |
| JP6598979B2 (ja) | 床版探傷装置 | |
| JP5544962B2 (ja) | 漏洩磁束探傷方法及び漏洩磁束探傷装置 | |
| JP4353465B2 (ja) | 鉄道車両の磁界測定方法および磁界測定装置 | |
| CN111024805A (zh) | 一种钢轨表面伤损漏磁检测装置及方法 | |
| CN109696467A (zh) | 一种基于磁弹效应的f轨应力检测方法及装置 | |
| JP6625489B2 (ja) | レール検査システム | |
| US20150276675A1 (en) | Alternating Current Field Measurement System | |
| KR101999945B1 (ko) | 강자성체 응력 측정 장치 | |
| US10777031B2 (en) | Coin detection system | |
| JPS6329244A (ja) | 渦電流表面欠陥検出装置 | |
| JP7835624B2 (ja) | レール状態監視装置およびレール状態監視方法 | |
| JP7734671B2 (ja) | 加速冷却による欠陥の検査装置及び検査方法 | |
| EP0544911B1 (en) | Device for detecting magnetic flux | |
| JP2021162360A (ja) | 検査方法および検査装置 | |
| JP2007248153A (ja) | 渦流探傷法方及び渦流探傷装置 | |
| JP2021001813A (ja) | 非破壊検査用磁気センサ及び非破壊検査装置 | |
| JP2002039997A (ja) | 磁性測定装置及び方法 | |
| Crouch et al. | Development of nonlinear harmonic sensors for detection of mechanical damage | |
| Mussatayev et al. | Towards Real-Time Railroad Inspection Using Directional Eddy Current Probe | |
| RU55716U1 (ru) | Устройство для оценки величины стыковых зазоров и вертикальных ступенек железнодорожного пути | |
| Davis et al. | The effects of flux leakage magnetizer velocity on volumetric defect signals |
Legal Events
| Date | Code | Title | Description |
|---|---|---|---|
| 121 | Ep: the epo has been informed by wipo that ep was designated in this application |
Ref document number: 17885193 Country of ref document: EP Kind code of ref document: A1 |
|
| NENP | Non-entry into the national phase |
Ref country code: DE |
|
| ENP | Entry into the national phase |
Ref document number: 2017885193 Country of ref document: EP Effective date: 20190722 |
|
| WWG | Wipo information: grant in national office |
Ref document number: 2017885193 Country of ref document: EP |