WO2019053917A1 - 輝度特性生成方法 - Google Patents
輝度特性生成方法 Download PDFInfo
- Publication number
- WO2019053917A1 WO2019053917A1 PCT/JP2018/006865 JP2018006865W WO2019053917A1 WO 2019053917 A1 WO2019053917 A1 WO 2019053917A1 JP 2018006865 W JP2018006865 W JP 2018006865W WO 2019053917 A1 WO2019053917 A1 WO 2019053917A1
- Authority
- WO
- WIPO (PCT)
- Prior art keywords
- luminance
- tone map
- video
- value
- nit
- Prior art date
- Legal status (The legal status is an assumption and is not a legal conclusion. Google has not performed a legal analysis and makes no representation as to the accuracy of the status listed.)
- Ceased
Links
Images


Classifications
-
- H—ELECTRICITY
- H04—ELECTRIC COMMUNICATION TECHNIQUE
- H04N—PICTORIAL COMMUNICATION, e.g. TELEVISION
- H04N9/00—Details of colour television systems
- H04N9/64—Circuits for processing colour signals
- H04N9/73—Colour balance circuits, e.g. white balance circuits or colour temperature control
-
- H—ELECTRICITY
- H04—ELECTRIC COMMUNICATION TECHNIQUE
- H04N—PICTORIAL COMMUNICATION, e.g. TELEVISION
- H04N9/00—Details of colour television systems
- H04N9/79—Processing of colour television signals in connection with recording
- H04N9/80—Transformation of the television signal for recording, e.g. modulation, frequency changing; Inverse transformation for playback
- H04N9/82—Transformation of the television signal for recording, e.g. modulation, frequency changing; Inverse transformation for playback the individual colour picture signal components being recorded simultaneously only
- H04N9/8205—Transformation of the television signal for recording, e.g. modulation, frequency changing; Inverse transformation for playback the individual colour picture signal components being recorded simultaneously only involving the multiplexing of an additional signal and the colour video signal
-
- G—PHYSICS
- G06—COMPUTING OR CALCULATING; COUNTING
- G06T—IMAGE DATA PROCESSING OR GENERATION, IN GENERAL
- G06T5/00—Image enhancement or restoration
- G06T5/90—Dynamic range modification of images or parts thereof
- G06T5/92—Dynamic range modification of images or parts thereof based on global image properties
-
- G—PHYSICS
- G11—INFORMATION STORAGE
- G11B—INFORMATION STORAGE BASED ON RELATIVE MOVEMENT BETWEEN RECORD CARRIER AND TRANSDUCER
- G11B27/00—Editing; Indexing; Addressing; Timing or synchronising; Monitoring; Measuring tape travel
-
- H—ELECTRICITY
- H04—ELECTRIC COMMUNICATION TECHNIQUE
- H04N—PICTORIAL COMMUNICATION, e.g. TELEVISION
- H04N21/00—Selective content distribution, e.g. interactive television or video on demand [VOD]
- H04N21/40—Client devices specifically adapted for the reception of or interaction with content, e.g. set-top-box [STB]; Operations thereof
- H04N21/43—Processing of content or additional data, e.g. demultiplexing additional data from a digital video stream; Elementary client operations, e.g. monitoring of home network or synchronising decoder's clock; Client middleware
- H04N21/431—Generation of visual interfaces for content selection or interaction; Content or additional data rendering
-
- H—ELECTRICITY
- H04—ELECTRIC COMMUNICATION TECHNIQUE
- H04N—PICTORIAL COMMUNICATION, e.g. TELEVISION
- H04N5/00—Details of television systems
- H04N5/14—Picture signal circuitry for video frequency region
- H04N5/20—Circuitry for controlling amplitude response
-
- H—ELECTRICITY
- H04—ELECTRIC COMMUNICATION TECHNIQUE
- H04N—PICTORIAL COMMUNICATION, e.g. TELEVISION
- H04N5/00—Details of television systems
- H04N5/66—Transforming electric information into light information
-
- H—ELECTRICITY
- H04—ELECTRIC COMMUNICATION TECHNIQUE
- H04N—PICTORIAL COMMUNICATION, e.g. TELEVISION
- H04N5/00—Details of television systems
- H04N5/76—Television signal recording
- H04N5/91—Television signal processing therefor
- H04N5/92—Transformation of the television signal for recording, e.g. modulation, frequency changing; Inverse transformation for playback
-
- G—PHYSICS
- G06—COMPUTING OR CALCULATING; COUNTING
- G06T—IMAGE DATA PROCESSING OR GENERATION, IN GENERAL
- G06T2207/00—Indexing scheme for image analysis or image enhancement
- G06T2207/10—Image acquisition modality
- G06T2207/10016—Video; Image sequence
Definitions
- the present disclosure relates to a luminance characteristic generation method for generating luminance characteristics of an image.
- Patent Document 1 describes a display device that updates a display method of an HDR signal based on dynamic HDR metadata in HDR (High Dynamic Range) video.
- the present disclosure provides a luminance characteristic generation method that can improve the quality of an image displayed on an image display device.
- a luminance characteristic generation method configures, for each of a plurality of frames that configure a moving image, the number of pixels having a first luminance or less among a plurality of pixels that configure the frame.
- the present disclosure can provide a luminance characteristic generation method that can improve the quality of an image displayed on an image display device.
- FIG. 1 is a diagram for explaining the evolution of video technology.
- FIG. 2 is a diagram for explaining the relationship between video production, a distribution method, and a display device when introducing a new video expression to content.
- FIG. 3A is a diagram illustrating an example of a tone map.
- FIG. 3B is a diagram showing an example of a tone map.
- FIG. 4A is a diagram illustrating an example of a static tone map.
- FIG. 4B is a diagram illustrating an example of a dynamic tone map.
- FIG. 5A is a view showing an example of an EOTF (Electro-Optical Transfer Function) corresponding to each of HDR and SDR.
- FIG. 5B is a diagram showing an example of inverse EOTF corresponding to each of HDR and SDR.
- FIG. EOTF Electro-Optical Transfer Function
- FIG. 6 is a diagram showing the relationship between the luminance of the input video and the luminance output to the actual display.
- FIG. 7 is a diagram showing an example of dynamic metadata.
- FIG. 8 is a diagram for explaining the 99Y and DY 100 calculation method.
- FIG. 9 is a diagram for explaining a method of calculating 18G.
- FIG. 10 is a block diagram showing an example of the configuration of the video display apparatus according to the embodiment.
- FIG. 11 is a block diagram showing an example of the configuration of the HDR signal converter according to the embodiment.
- FIG. 12 is a flowchart showing the operation of the video display apparatus according to the present embodiment.
- FIG. 13 is a diagram for describing a method of generating a conversion curve which is generated when threshold TH_A ⁇ brightness compression rate ⁇ 1.
- FIG. 13 is a diagram for describing a method of generating a conversion curve which is generated when threshold TH_A ⁇ brightness compression rate ⁇ 1.
- FIG. 20 is a diagram illustrating an example of a conversion curve generated when maxRGB Percentile [90] and maxRGB Percentile [98] both have values closer to 99Y than 18G.
- FIG. 21 is a flowchart for explaining the tone map processing of the fifth example.
- FIG. 22 is a diagram for explaining the conversion curve generated in the tone map processing of the fifth example.
- FIG. 23 is a block diagram showing an example of the configuration of the generation device according to the embodiment.
- FIG. 24 is a block diagram showing an example of a configuration of a generation unit of the embodiment.
- FIG. 25 is a flowchart showing an example of a generation method.
- FIG. 26 is a flowchart showing determination processing of luminance characteristics in the generation method.
- FIG. 1 is a diagram for explaining the evolution of video technology.
- HDR High
- SDR Standard Dynamic Range
- ITU-R International Telecommunications Union Radiocommunications Sector
- HDR As a specific application destination of HDR, as in HD and UHD, broadcast, packaged media (Blu-ray (registered trademark) Disc etc.), Internet distribution, etc. are assumed.
- FIG. 2 is a diagram for explaining the relationship between video production, a distribution method, and a display device when introducing a new video expression to content.
- the tone map (Tone Mapping) is based on the relationship between the luminance of the HDR image and the maximum luminance (Display Peak Luminance: DPL) of the image display device, and when the Maximum Content Luminance Level (MaxCLL) of the image exceeds DPL, It is processing to convert the luminance of the video and to bring the luminance of the video within DPL. By this processing, the video can be displayed without losing information in the vicinity of the maximum luminance of the video. Since this conversion depends on the characteristics of the video display device and also on the idea of how to display it, different conversion curves are used for each video display device.
- FIGS. 3A and 3B illustrate an example of a tone map.
- FIG. 3A shows the case where DPL is 500 nit
- FIG. 3B shows the case where DPL is 1000 nit.
- FIGS. 3A and 3B are examples of a tone map when MaxCLL displays an image of 1000 nit and a tone map when an image of MaxCLL displays 4000 nit.
- the tone map is not performed in the video in which the MaxCLL is 1000 nit.
- tone mapping is performed, and the luminance of 4000 nit is converted to 1000 nit and displayed.
- MaxCLL static metadata
- Dynamic Max CLL adapted to the time-varying luminance, so that the tone is low when the luminance is low.
- a tone map is performed ((c) in FIG. 4B), it is possible to realize an optimum tone map in accordance with the time-varying luminance.
- Dynamic metadata is a dynamic luminance characteristic that indicates a time-series change in luminance characteristics of an image.
- the luminance characteristics of the video used for the dynamic metadata are, for example, maximum luminance, average luminance, and the like in each predetermined section of the video.
- the maximum luminance of an image is described as an example of the luminance characteristics of the image.
- the predetermined section of the video is, for example, a scene, a chapter, a frame or the like.
- FIG. 5A is a view showing an example of an EOTF (Electro-Optical Transfer Function) corresponding to each of HDR and SDR.
- EOTF Electro-Optical Transfer Function
- EOTF is generally called a gamma curve, which indicates the correspondence between a code value and a luminance value, and converts the code value into a luminance value. That is, EOTF is relationship information indicating the correspondence between a plurality of code values and luminance values.
- FIG. 5B is a diagram showing an example of inverse EOTF corresponding to each of HDR and SDR.
- the inverse EOTF indicates the correspondence between the luminance value and the code value, and quantizes the luminance value to convert it into a code value, contrary to the EOTF. That is, the reverse EOTF is relationship information indicating the correspondence between the luminance value and the plurality of code values. For example, when the luminance value of the image corresponding to HDR is expressed by the code value of the gradation of 10 bits, the luminance values in the luminance range of HDR up to 10000 nit are quantized to 1024 integers from 0 to 1023 Mapped to a number.
- the luminance value luminance value of the image corresponding to the HDR
- the HDR signal which is a 10-bit code value.
- an EOTF corresponding to HDR hereinafter referred to as “HDR EOTF”
- an EOTF corresponding to HDR hereinafter referred to as “SDR EOTF”
- a reverse EOTF corresponding to SDR hereinafter referred to as “SDR reverse EOTF”
- SDR reverse EOTF can represent a luminance value higher than that. For example, in FIGS.
- the maximum value of luminance (peak luminance) is 10000 nit. That is, the luminance range of HDR includes all the luminance range of SDR, and the peak luminance of HDR is larger than the peak luminance of SDR.
- the luminance range of HDR is a luminance range obtained by expanding 100 nit, which is the maximum value, to 10000 nit, as compared with the luminance range of SDR.
- Task 1 As described above, the problem of the prior art can be solved by using the dynamic range of luminance for each scene.
- dynamic metadata for optimizing a conversion curve used for a tone map is defined, and an algorithm for generating a conversion curve used for a tone map is shown based on the dynamic metadata.
- the video display apparatus performs the video optimization by optimizing the tone map using the dynamic metadata or the feature data of the video equivalent to the dynamic metadata obtained by analyzing the main video. By weighting for each luminance, it is possible to display an image in which an optimal tone map is realized.
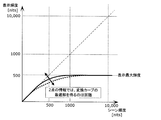
- FIG. 6 is a diagram showing the relationship between the luminance (Scene Luminance) of an input video and the luminance (Display Luminance) output to an actual display. That is, FIG. 6 shows the conversion curve used for the tone map.
- FIG. 7 is a diagram showing an example of dynamic metadata.
- dynamic metadata includes: 99Y, 18G, maxRGB Percentile (1%), maxRGB Percentile (25%), maxRGB Percentile (50%) maxRGB Percentile (75%) maxRGB Percentile (90%), maxRGB Percentile (90%) 95%), (99.98%), averrage max RGB, knee_point_x, knee_point_y, Bezier_anchor (0-9), DY100.
- dynamic metadata may include 99Y and DY100.
- FIG. 8 is a diagram for explaining a method of calculating 99Y and DY100.
- FIG. 9 is a diagram for explaining a method of calculating 18G.
- FIG. 8 and FIG. 9 are diagrams showing luminance distribution of pixels in one frame.
- 99Y F does not exceed 99.99% when the luminance histogram indicating the relationship between the luminance and the number of pixels of the luminance is accumulated from the low luminance side for all pixels in one frame. Indicates the maximum luminance value.
- 99Y is set to the maximum value among 99Y F of a plurality of frames constituting a scene.
- 99Y is an integer from 0 to 4095 obtained by normalizing the luminance value (0 nit to 10000 nit) to 12 bits (0 to 4095).
- a histogram (50 nit cumulative histogram) of a cumulative value with a width of 50 nit is obtained with the target brightness as a start point with respect to the luminance histogram of the frame Find the point where the accumulated value is maximum (maximum accumulated value) and its luminance value-Increase the luminance from the above luminance value, and set the luminance value below 10% of the maximum accumulated value to 18 G.-From 0 nit to 18 G Let 18G be an effective value when the luminance distribution of the image exceeds 80% of the whole, and 18G be an invalid value otherwise.
- 18G is derived as the luminance value in Distribution_Cuttoff shown in FIG. 18G is an average of 18G of a plurality of frames constituting the scene. If 18G is equal to 0, it must not be included in the 18G calculation.
- Distribution_Cuttoff is a threshold obtained by multiplying Cutoff_Threshold and Distribution_Peak.
- Distribution_Peak is the number of pixels at the peak of the luminance distribution of the pixels in the frame. Cutoff_Threshold is, for example, 0.10. That is, Distribution_Cutoff is 10% of the number of pixels of Distribution_Peak.
- MaxRGB Percentile [k] is obtained by the following calculation.
- k is any one of 1, 25, 50, 75, 90, 95, and 99.98.
- the average max RGB is a value obtained by averaging max RGB values of pixels of one frame over the entire screen.
- the dynamic metadata is included in the video data as content information, and is added to the main video for each scene at the time of video playback from the video playback device playing back the video, and sent to the video display device.
- the luminance characteristics of the main video equivalent to the dynamic metadata can also be acquired by analyzing the main video of the content. That is, the present disclosure also includes a tone map performed based on luminance characteristics equivalent to dynamic metadata obtained by analyzing a main video in a video display device.
- dynamic luminance characteristics indicating time-series changes in luminance characteristics of a moving image luminance obtained by analyzing dynamic metadata, a main video in frame units, and scene units composed of a plurality of frames. Characteristic etc. are illustrated.
- the percentile value is an integrated value from small luminances of pixels in one frame and is discrete. Thus, the percentile value indicates an area distribution of determined luminance. For this reason, the percentile value does not sufficiently represent the degree of concentration of luminance. For example, when trying to determine the degree of concentration of luminance using maxRGB Percentile [75], for example, up to 74% is concentrated, and 75% of luminance away from 74%, 75% Can not be distinguished from the case where the luminance is concentrated.
- the luminance value (Distribution_Peak_count_Luminance) which is the maximum count number from the luminance histogram and its maximum Detect the count number (Distribution_Peak).
- the luminance value is increased from Distribution_Peak_count_Luminance, the luminance that becomes a count number less than 10% of Distribution_Peak is identified, and the identified luminance is set to 18 G_mesure.
- the count number may be instantaneously reduced and an incorrect value may be taken.
- the sensitivity of the instantaneous change is reduced by constructing the luminance histogram with an integral value of 50 nit width, so that an optimum value can be obtained.
- FIG. 10 is a block diagram showing an example of the configuration of the video display apparatus according to the embodiment.
- FIG. 11 is a block diagram showing an example of the configuration of the HDR signal converter according to the embodiment.
- the video display device 100 includes a video receiving unit 110, a tone map processing unit 120, and a display unit 130.
- the video receiving unit 110 receives video data including a main video which is a moving image and a dynamic luminance characteristic. That is, the video reception unit 110 functions as an acquisition unit that acquires video data. The video receiving unit 110 outputs the received video data to the tone map processing unit 120.
- the tone map processing unit 120 is a processing unit that performs tone mapping using a predetermined conversion curve.
- the tone map processing unit 120 includes an HDR signal converter 121 and a tone map generation device 122.
- the HDR signal converter 121 optimizes the luminance information of the main video, which is an HDR video, to the luminance of the display unit 130 and outputs the same.
- the HDR signal converter 121 converts the code value indicating the luminance of the main video into luminance, and the code value obtained by converting the luminance into the luminance of the display unit 130.
- a luminance-to-output level conversion circuit 124 for converting into The luminance-output level conversion circuit 124 performs tone map processing using the conversion curve generated by the tone map generation device 122, so that the image obtained by performing the tone map processing is optimally used in the display unit 130. It can be displayed.
- the tone map generation device 122 optimizes the conversion curve used in the HDR signal converter 121 in accordance with the luminance of the display unit 130.
- the tone map generation device 122 acquires the dynamic luminance characteristic of the video data from the video reception unit 110, and generates a conversion curve suitable for use in the tone map according to the dynamic luminance characteristic.
- the specific method of the conversion curve generation process will be described separately in the first to fifth embodiments.
- the display unit 130 displays an image after tone map processing.
- FIG. 12 is a flowchart showing the operation of the video display apparatus according to the present embodiment.
- the video reception unit 110 acquires video data including a main video which is a moving image and a dynamic luminance characteristic indicating a time-series change of luminance characteristics of the seed video (S1).
- the tone map processing unit 120 uses the conversion curve that is optimal for the dynamic luminance characteristic and the display maximum luminance according to the dynamic luminance characteristic and the display maximum luminance that is the maximum luminance of the display device. Perform tone map processing (S2).
- the display unit 130 displays the video after the tone map processing (S3).
- tone map processing Next, an example of tone map processing will be described.
- tone maps are generated using DY 100 and 99Y as dynamic metadata.
- the tone map generation device 122 specifies the luminance dynamic range of the main video using 99Y, and determines whether (1) luminance compression is performed or (2) luminance compression is not performed for the specified luminance dynamic range. .
- the luminance compression is processing to reduce the luminance dynamic range of the video displayed on the display unit 130 by reducing the luminance of the main video.
- luminance compression for example, when the maximum luminance of the main video exceeds the display maximum luminance, the maximum luminance of the main video can not be displayed on the display unit 130, so the maximum luminance of the main video is the display maximum luminance. As described above, this is processing to reduce the luminance dynamic range.
- the tone map generation device 122 when performing luminance compression, the tone map generation device 122 further performs luminance compression in the (1-1) high luminance region or (1-2) luminance compression in the luminance dynamic range of the main video. You may decide
- the tone map generation device 122 controls the luminance compression ratio of the dark portion according to the DY 100 in order to maintain the tonality and visibility of the dark portion. .
- the tone map generation device 122 calculates the luminance compression rate using Equation 2 below from the dynamic metadata 99Y and the display luminance (DPB: Display Peak Brightness) that indicates the display maximum luminance.
- the tone map generation device 122 generates different conversion curves according to the calculated luminance compression rate.
- the tone map generation device 122 performs processing for generating different conversion curves according to the luminance compression rate, for example, as shown in the following (1) to (3).
- the tone map generation device 122 does not generate a conversion curve since tone map processing is unnecessary. That is, in this case, the tone map generation device 122 determines not to perform luminance compression.
- the HDR signal converter 121 outputs the luminance in the range up to 99Y of the moving image as it is without converting it. Therefore, Scene Luminance and Display Luminance are equal.
- the threshold TH_A is a value obtained by multiplying DPB by a predetermined coefficient (for example, a number smaller than 1 and larger than 0.5).
- the predetermined coefficient uses a value optimized based on experience. In this case, since the luminance compression rate is close to 1 and the luminance compression is small, a conversion curve for luminance compression in the high luminance area is generated. That is, in this case, the tone map generation device 122 determines to perform luminance compression in the high luminance region.
- the tone map generation device 122 sets output luminance (that is, display luminance) to input luminance (that is, scene luminance) in a low luminance region less than (i) kneepoint To generate a conversion curve having a PQ curve outputting the same luminance as in (1), and (ii) a curve for performing luminance compression matching DPY to DPB in a high luminance region larger than kneepoint.
- the tone map generation device 122 generates different conversion curves depending on whether DY 100 exceeds the threshold TH.
- the threshold TH a threshold optimized based on experience is used.
- the tone map generation device 122 has an important detail at 100 nit or less because the ratio to the total number of pixels occupied by pixels having luminance of 100 nit or less is larger than the threshold TH. It is determined that the conversion curve not to be compressed is generated in the luminance region of 100 nit or less.
- the tone map generation device 122 sets a luminance area equal to or lower than the first luminance (for example, KneePoint) as a low luminance area and a luminance area exceeding KneePoint as a high luminance area, (i) If DY 100 as the first luminance characteristic indicating the number of pixels of 100 nit or less as the second luminance among pixels included in the low luminance region in one frame of the moving image exceeds the threshold TH, change the luminance of 100 nit or less Not generate the first conversion curve.
- the tone map generation device 122 generates, for example, a conversion curve shown in (c) of FIG. 17 described later.
- the tone map generation device 122 has a small influence on the luminance compression because the ratio to the total number of pixels occupied by pixels having a luminance of 100 nit or less is the threshold value TH or less. Then, a conversion curve is generated to perform luminance compression even in a low luminance area. That is, when DY 100 is equal to or less than the threshold TH, the tone map generation device 122 generates a second conversion curve that makes the luminance in the range of 100 nit or less smaller than the luminance. The tone map generation device 122 generates, for example, a conversion curve shown in (b) of FIG. 17 described later.
- the luminance compression rate may be changed according to the value of DY 100 to define and protect the maximum compression rate (for example, 0.8 or the like). That is, the tone map generation device 122 may generate, as the second conversion curve, a conversion curve whose slope in the range of 100 nit or less is less than one. In addition, the tone map generation device 122 may generate, as the second conversion curve, a conversion curve in which the ratio of the brightness in the range of 100 nit or less to the brightness is smaller as the value indicated by DY 100 is smaller.
- tone map processing of the first example will be described using a flowchart.
- FIG. 15 is a flowchart for explaining the tone map processing of the first example.
- the tone map generation device 122 acquires dynamic metadata of video data (S11).
- the tone map generation device 122 calculates the luminance compression rate using 99Y of the dynamic metadata and the DPB of the image display device 100, and determines whether the calculated luminance compression rate exceeds 1 or not. It judges (S12).
- the tone map generation device 122 determines that the luminance compression rate exceeds 1 (Yes in S12), it determines that the luminance compression is not present, and outputs a conversion curve without luminance compression to the HDR signal converter 121. Then, the HDR signal converter 121 performs tone map processing A using a conversion curve without luminance compression, and outputs the video signal obtained by the tone map processing A to the display unit 130 (S13).
- the tone map generation device 122 determines whether the luminance compression rate exceeds the threshold TH_A (S14).
- the tone map generation device 122 determines that the luminance compression ratio exceeds the threshold TH_A (Yes in S14), it determines that the luminance compression is to be performed on the high luminance region, and the conversion curve shown in FIG. Output to 121. Then, the HDR signal converter 121 performs tone map processing B using the conversion curve shown in FIG. 13, and outputs the video signal obtained by the tone map processing B to the display unit 130 (S15).
- the tone map generation device 122 determines whether DY 100 of the acquired dynamic metadata exceeds the threshold TH (S16) .
- the tone map generation device 122 determines that the DY 100 exceeds the threshold TH (Yes in S16)
- the tone map generation device 122 outputs, to the HDR signal converter 121, a conversion curve not subjected to luminance compression in a luminance region of 100 nit or less.
- the HDR signal converter 121 performs tone map processing C using the output conversion curve, and outputs the video signal obtained by the tone map processing C to the display unit 130 (S17).
- the HDR signal converter 121 converts a conversion curve that makes the luminance in the range of 100 nit or less smaller than that shown in FIG. Output to Then, the HDR signal converter 121 performs tone map processing D using the output conversion curve, and outputs the video signal obtained by the tone map processing D to the display unit 130 (S18).
- Tone map processing in the second example will be described.
- a method of generating a conversion curve different from the first example using DY 100 and 99Y will be described.
- FIG. 16 is a diagram for describing a method of generating a conversion curve in the second example.
- the tone map generation device 122 determines the conversion curve slope at 99Y using 99Y, and generates a tone map by connecting three points of origin coordinates, 100 nit coordinates Ks and maximum value coordinates with a spline curve.
- the tone map generation device 122 may generate a conversion curve in which the inclination is weighted using the percentile information. For example, when the maxRGB Percentile [75] becomes a value close to 99Y (for example, a value within a predetermined luminance range based on 99Y), the tone map generation device 122 generates the gradation of the high luminance region (near 99Y). It can be determined that there are many components. For this reason, the tone map generation device 122 may generate a conversion curve that increases the slopes of maxRGB Percentile [75] to 99Y. This can improve the tonality between maxRGB Percentile [75] to 99Y.
- FIG. 18 is a diagram for explaining the conversion curve generated in the tone map processing of the third example.
- the tone map processing unit 120 concentrates at least 90% of all pixels on the luminance close to 18G. It can be said that Therefore, by performing tone map processing using a conversion curve in which the slope from 18G to maxRGB Percentile [98] is larger than the slope exceeding maxRGB Percentile [98], the gradation from 18G to maxRGB Percentile [98] I can raise the weight of sex. Therefore, it is possible to improve the tonality of the pixel having the luminance concentrated in one frame, and to improve the quality of the image.
- 18G is illustrated as the second luminance, but the second luminance may be 100 nit.
- Tone map processing in the fourth example will be described.
- tone map processing in a low luminance region will be described.
- the luminance compression is performed in the low luminance area when DY 100 is equal to or less than the threshold TH_A when the luminance compression is performed, the present invention is not limited thereto.
- whether to perform luminance compression in a low luminance region may be determined according to the value of maxRGB Percentile [1].
- the tone map generation device 122 determines whether the tone map generation device 122 has many luminance distributions in the low luminance region (dark part) depending on whether or not maxRGB Percentile [1] of the dynamic metadata is higher than a predetermined luminance. Determine if there is less. Then, when the tone map generation device 122 determines that the luminance distribution of the dark part is small, for example, as shown in (b) of FIG. 17 described above, the luminance dynamic range is compressed by tone mapping the dark part side. A conversion curve may be generated which extends the dynamic range of. For example, if maxRGB Percentile [1] is 200 nit, the area occupied by pixels having a luminance of 200 nit or less is 1% or less of the area of the entire screen.
- the tone map generator 122 uses 99Y and 18G to determine the knee point of the conversion curve (the point at which to start compression of content intensity). Thereby, the contrast of the specific luminance region can be appropriately improved.
- the tone map generation device 122 sets 1898 as a convergence point and uses 18G to determine KneePoint in the conversion curve.
- the tone map generation device 122 sets the following values for 99Y.
- the tone map generation device 122 sets an upper limit value at which the conversion curve can visually recognize all gradations as kneepoint_max. Also, the tone map generation device 122 sets, as kneepoint_min, a value that allows the conversion curve to be visually recognized at all tones uniformly.
- kneepoint_max is the upper limit value of the luminance range for determining KneePoint
- kneepoint_min is the lower limit value of the luminance range for determining KneePoint.
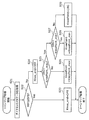
- FIG. 21 is a flowchart for explaining the tone map processing of the fifth example.
- FIG. 22 is a diagram for explaining the conversion curve generated in the tone map processing of the fifth example.
- the tone map generation device 122 determines whether 99Y of the dynamic metadata is equal to or less than the DPB of the video display device 100 (S22).
- the tone map generation device 122 determines that 18G is equal to or greater than KneePoint_max (No in S25), it sets KneePoint to KneePoint_max (S26).
- the tone map generation device 122 ends the process here.
- the tone map generation device 122 may generate the conversion curves of the first to fourth examples using the KneePoint set in this process.
- the generation unit 220 analyzes the main video output from the video reception unit 210 to generate dynamic metadata indicating luminance characteristics for each scene. Specifically, the generation unit 220 generates dynamic metadata for each frame, and temporarily stores in the memory 230 dynamic metadata for one scene composed of a plurality of frames. Then, the generation unit 220 generates dynamic metadata for each scene by taking an average or a maximum value using dynamic metadata for one scene. The generation unit 220 may output the metadata generated for each frame.
- the luminance histogram generation unit 222 generates a luminance histogram from the signal information obtained by performing luminance conversion in the video information luminance conversion unit 221.
- the determination unit 223 determines the dynamic metadata of each frame using the luminance histogram generated by the luminance histogram generation unit 222. In addition, the determination unit 223 performs processing of temporally merging similar video information using dynamic data of a plurality of frames for one scene temporarily stored in the memory 230.
- merge is processing for taking the maximum value in a scene (similar frame) in 99Y, and processing for taking an average value in a scene (similar frame) in 100DY.
- the memory 230 temporarily stores the dynamic metadata for each frame generated by the generation unit 220.
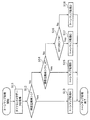
- FIG. 25 is a flowchart showing an example of a generation method.
- the video receiving unit 210 acquires a main video (S31).
- the generation unit 220 starts a loop in which steps S32 and S33 are repeated for each of a plurality of frames constituting the main video acquired by the video reception unit 210.
- FIG. 26 is a flowchart showing determination processing of luminance characteristics in the generation method.
- the generation unit 220 generates a luminance histogram by analyzing the luminance of all the pixels of the processing target frame (S41).
- the generation unit 220 starts counting integrated values in order from low luminance (S42). Specifically, the generation unit 220 counts pixels having the set luminance while sequentially increasing by 1 nit from 0 nit of the luminance histogram.
- the generation unit 220 determines whether the luminance value to be counted is 100 nit (S43).
- the generation unit 220 determines a value obtained by dividing the integrated value counted up to the present time by the total number of pixels (D44). That is, for each of a plurality of frames forming a moving image, the generation unit 220 sets the number of pixels of 100 nit or less as a predetermined luminance among the plurality of pixels forming the frame to the number of all pixels forming the frame. The value obtained by dividing by is determined as DY 100 as a first luminance characteristic.
- step S44 or when it is determined that the brightness to be counted is not 100 nit (No in S43), whether the value obtained by dividing the current integrated value by the total number of pixels exceeds 99.99% It is determined whether or not it is (S45).
- the generation unit 220 determines the luminance to be currently counted as 99Y (S46). That is, in this case, the generation unit 2220 is the maximum of the luminance at the number of 99.99% of all the pixels when all the pixels in the frame are arranged from the pixel having a small luminance for each of a plurality of frames. The luminance is specified, and the specified maximum luminance is determined as 99Y as a second luminance characteristic.
- step S46 when it is determined that the value obtained by dividing the present integrated value by the total number of pixels is 99.99% or less (No in S45), 100DY and 99Y have already been determined. It is determined whether or not (S47).
- the generation unit 220 ends the process of determining the luminance characteristic.
- the generating unit 220 determines that 100DY or 99Y has not been determined (No in S47), the luminance to be counted is increased by 1 nit, and the process returns to step S43.
- the generation unit 220 when the process of determining the luminance characteristic is completed, the generation unit 220 outputs the determined luminance characteristic to the memory 230 (S33). Then, when the luminance characteristics for one scene are accumulated in the memory 230, the generation unit 220 performs merging using a plurality of luminance characteristics for one scene, and outputs dynamic metadata after merging to perform processing. finish.
- the generation device 200 records the output dynamic metadata in the SEI information of the content. That is, the generation device 200 may record the dynamic metadata together with the moving image on a recording medium such as an HDD, an SSD, or a BD.
- a recording medium such as an HDD, an SSD, or a BD.
- the generating apparatus 200 can generate dynamic metadata by analyzing a moving image. Therefore, since the video display apparatus can acquire dynamic metadata indicating the dynamic luminance characteristic of the moving image in addition to the moving image, the tone map processing is executed according to the luminance characteristic of the moving image indicated by the dynamic metadata. be able to. That is, the video display apparatus can execute the dynamic tone map without analyzing the moving image, and the processing load can be reduced. Further, since the video display apparatus can reduce the processing time for analyzing the moving image, the dynamic tone map can be effectively executed on the moving image.
- the main video is, for example, an HDR video.
- the HDR video may be, for example, a Blu-ray disc, a DVD, a video distribution site on the Internet, a broadcast, or a video in an HDD (Hard Disk Drive).
- the video reproduction device may be a device such as a disk player, a disk recorder, a set top box, a television, a personal computer, or a smart phone, which decodes a compressed video signal from a recording medium, broadcast or the Internet and sends it to a video display device. Further, part or all of the functions of the video reproduction apparatus may be included in the video display apparatus 100.
- the video signal transmission means for transmitting the video signal from the video reproduction device to the video display device may transmit the video signal in an uncompressed state such as HDMI (registered trademark), DVI, or DP, or may be through the network. Means for transmitting the video signal in a compressed form.
- the setting of the maximum luminance information or tone map information of the video display device to the video reproduction device may be performed by the user inputting the video reproduction device to the video reproduction device using a remote controller or the like. It may be performed by inputting using the operating device with which the device is provided. Alternatively, the user acquires these pieces of information using the Internet or other means, stores the acquired information in the portable storage medium, and sends the information to the video reproduction apparatus through the portable storage medium. It is also good. Also, the video reproduction device may be directly connected to the Internet, and the video reproduction device may obtain these pieces of information from the server database. Furthermore, the video reproduction device may display test patterns on the video display device, and obtain and store these pieces of information while confirming the characteristics of the video display device using the displayed test patterns.
- each processing unit included in the image display device and the generation device according to the above-described embodiment is typically realized as an LSI which is an integrated circuit. These may be individually made into one chip, or may be made into one chip so as to include some or all.
- circuit integration is not limited to LSI's, and implementation using dedicated circuitry or general purpose processors is also possible.
- a field programmable gate array (FPGA) that can be programmed after LSI fabrication, or a reconfigurable processor that can reconfigure connection and setting of circuit cells inside the LSI may be used.
- each component may be configured by dedicated hardware or implemented by executing a software program suitable for each component.
- Each component may be realized by a program execution unit such as a CPU or a processor reading and executing a software program recorded in a recording medium such as a hard disk or a semiconductor memory.
- the present disclosure may be realized as various methods executed by a video display device and a generation device.
- division of functional blocks in the block diagram is an example, and a plurality of functional blocks may be realized as one functional block, one functional block may be divided into a plurality of parts, or some functions may be transferred to another function block. May be Also, a single piece of hardware or software may process the functions of a plurality of functional blocks having similar functions in parallel or in time division.
- the present disclosure is applicable to a luminance characteristic generation method.
- Video display apparatus 110 Video receiving part 120 Tone map processing part 121 HDR signal converter 122 Tone map production
Landscapes
- Engineering & Computer Science (AREA)
- Multimedia (AREA)
- Signal Processing (AREA)
- Physics & Mathematics (AREA)
- General Physics & Mathematics (AREA)
- Theoretical Computer Science (AREA)
- Picture Signal Circuits (AREA)
- Controls And Circuits For Display Device (AREA)
- Two-Way Televisions, Distribution Of Moving Picture Or The Like (AREA)
- Transforming Electric Information Into Light Information (AREA)
- Management Or Editing Of Information On Record Carriers (AREA)
- Television Signal Processing For Recording (AREA)
Abstract
輝度特性生成方法は、動画像を構成する複数のフレームのそれぞれについて、当該フレームを構成する複数の画素のうち第1輝度以下の画素の数を、当該フレームを構成する全画素の数で除すことで得られた値を、第1輝度特性として決定する第1決定ステップ(S32)と、第1決定ステップにおいて決定された第1輝度特性を出力する出力ステップ(S33)と、を含む。
Description
本開示は、映像の輝度特性を生成する輝度特性生成方法に関する。
特許文献1には、HDR(High Dynamic Range)映像において、動的HDRメタデータに基づいてHDR信号の表示方法を更新する表示装置について記載されている。
White Paper Blu-ray Disc Read-Only Format (Ultra HD Blu-ray), Audio Visual Application Format Specifications for BD-ROM Version 3.1, August 2016(http://www.blu-raydisc.com/Assets/Downloadablefile/BD-ROM_Part3_V3.1_WhitePaper_160729_clean.pdf)
本開示は、映像表示装置において表示する映像の質を向上できる輝度特性生成方法を提供する。
本開示の一態様に係る輝度特性生成方法は、動画像を構成する複数のフレームのそれぞれについて、当該フレームを構成する複数の画素のうち第1輝度以下の画素の数を、当該フレームを構成する全画素の数で除すことで得られた値を、第1輝度特性として決定する第1決定ステップと、前記第1決定ステップにおいて決定された前記第1輝度特性を出力する出力ステップと、を含む。
本開示は、映像表示装置において表示する映像の質を向上できる輝度特性生成方法を提供できる。
[1-1.背景]
まず、映像技術の変遷について、図1を用いて説明する。図1は、映像技術の進化について説明するための図である。
まず、映像技術の変遷について、図1を用いて説明する。図1は、映像技術の進化について説明するための図である。
これまで、映像の高画質化としては、表示画素数の拡大に主眼がおかれ、Standard Definition(SD)の720×480画素から、High Definition(HD)の1920×1080画素の映像が普及している。
近年、更なる高画質化を目指して、Ultra High Definition(UHD)の3840×1920画素、あるいは、4Kの4096×2048画素の、所謂4K映像の導入が開始された。
4Kの導入と共に、ダイナミックレンジ拡張、色域拡大、又は、フレームレートの追加或いは向上なども検討されている。
その中でも、ダイナミックレンジについては、暗部階調を維持しつつ、現行のテレビ信号で表現不能な鏡面反射光などの明るい光を、より現実に近い明るさで表現するための方式として、HDR(High Dynamic Range)が注目されている。具体的には、これまでのテレビ信号は、SDR(Standard Dynamic Range)と呼ばれ、最高輝度が100nitであった。これに対して、HDRでは1000nit以上まで最高輝度を拡大することが想定されている。HDRは、SMPTE(Society of Motion Picture & Television Engineers)、及びITU-R(International Telecommunications Union Radiocommunications Sector)などにおいて、マスタリングディスプレー用規格の標準化が進行中である。
HDRの具体的な適用先としては、HD及びUHDと同様に、放送、パッケージメディア(Blu-ray(登録商標) Disc等)、及びインターネット配信などが想定されている。
[1-2.マスター生成、配信方式、及び表示装置の関係]
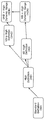
図2は、コンテンツに新たな映像表現を導入するときの、映像制作、配信方式、及び表示装置の関係について説明するための図である。
図2は、コンテンツに新たな映像表現を導入するときの、映像制作、配信方式、及び表示装置の関係について説明するための図である。
映像の高画質化のために新たな映像表現(画素数の増加等)を導入する場合には、図2に示すように、(1)映像制作側のHome Entertainment向けマスターを変更する必要がある。それに応じて、(2)放送、通信、及びパッケージメディア等の配信方式も、(3)その映像を表示するテレビ、又はプロジェクター等の表示装置も更新する必要がある。
[1-3.トーンマップ]
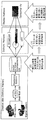
トーンマップ(Tone Mapping)は、HDR映像の輝度と映像表示装置の最大輝度(Display Peak Luminance:DPL)との関係から、映像の最大輝度(Maximum Content Luminance Level:MaxCLL)がDPLを超える場合に、映像の輝度を変換し、映像の輝度をDPL以内に収める処理である。この処理により、映像の最大輝度付近の情報を失うことなく映像を表示できる。この変換は、映像表示装置の特性にも依存し、どのように表示するかの考え方にも依存するので、映像表示装置毎に異なった変換カーブが用いられる。
トーンマップ(Tone Mapping)は、HDR映像の輝度と映像表示装置の最大輝度(Display Peak Luminance:DPL)との関係から、映像の最大輝度(Maximum Content Luminance Level:MaxCLL)がDPLを超える場合に、映像の輝度を変換し、映像の輝度をDPL以内に収める処理である。この処理により、映像の最大輝度付近の情報を失うことなく映像を表示できる。この変換は、映像表示装置の特性にも依存し、どのように表示するかの考え方にも依存するので、映像表示装置毎に異なった変換カーブが用いられる。
図3A及び図3Bは、トーンマップの一例を示す図である。図3Aは、DPLが500nitの場合を示し、図3Bは、DPLが1000nitの場合を示す。また、図3A及び図3Bは、MaxCLLが1000nitの映像を表示した場合のトーンマップと、MaxCLLが4000nitの映像を表示した場合のトーンマップとの例である。
図3Aに示すように、DPLが500nitの場合、どちらの映像も500nit以下でMaxCLLまでを表示できるように、輝度が変換されるが、MaxCLLが高い映像のほうが変換の度合いは大きくなる。
図3Bに示すように、DPLが1000nitの場合、MaxCLLが1000nitの映像では、トーンマップが行われない。MaxCLLが4000nitの映像では、トーンマップが行われ、4000nitの輝度が1000nitに変換されて表示される。
[1-4.ダイナミックメタデータとダイナミックトーンマップ]
図4Aは、スタティックメタデータを用いたトーンマップの例を示す図である。図4Bは、ダイナミックメタデータを用いたダイナミックトーンマップの例を示す図である。
図4Aは、スタティックメタデータを用いたトーンマップの例を示す図である。図4Bは、ダイナミックメタデータを用いたダイナミックトーンマップの例を示す図である。
図4Aに示すように、スタティックメタデータ(MaxCLL)が用いられる場合、MaxCLLは一連の映像内で最も高い輝度を示すため、映像表示装置は、一連の映像に対して、固定的なトーンマップしか行えない。これに対して、映像表示装置は、図4Bの(a)に示すように、時間変化する輝度に合わせたメタデータ(ここではDynamic MaxCLLと称す)を用いることで、輝度が低い場合は、トーンマップを行わず(図4Bの(b))、輝度が高い場合はトーンマップを行う(図4Bの(c))というように、時間変化する輝度に合わせた最適なトーンマップを実現できる。ダイナミックメタデータは、映像の輝度特性の時系列の変化を示す動的輝度特性である。ダイナミックメタデータに用いられる映像の輝度特性は、例えば、映像の所定の区間ごとにおける最大輝度、平均輝度などである。本開示では、映像の輝度特性として、映像の最大輝度を例に説明する。映像の所定の区間とは、例えば、シーン、チャプター、フレームなどである。
[1-5.EOTFについて]
ここで、EOTFについて、図5Aおよび図5Bを用いて説明する。
ここで、EOTFについて、図5Aおよび図5Bを用いて説明する。
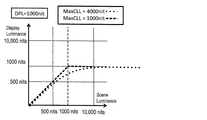
図5Aは、HDRおよびSDRのそれぞれに対応したEOTF(Electro-Optical Transfer Function)の例について示す図である。
EOTFは、一般的にガンマカーブと呼ばれるものであり、コード値と輝度値との対応を示し、コード値を輝度値に変換するものである。つまり、EOTFは、複数のコード値と輝度値との対応関係を示す関係情報である。
また、図5Bは、HDRおよびSDRのそれぞれに対応した逆EOTFの例について示す図である。
逆EOTFは、輝度値とコード値との対応を示し、EOTFとは逆に輝度値を量子化してコード値に変換するものである。つまり、逆EOTFは、輝度値と複数のコード値との対応関係を示す関係情報である。例えば、HDRに対応した映像の輝度値を10ビットの階調のコード値で表現する場合、10000nitまでのHDRの輝度範囲における輝度値は、量子化されて、0~1023までの1024個の整数値にマッピングされる。つまり、逆EOTFに基づいて量子化することで、0~10000nitの輝度範囲の輝度値(HDRに対応した映像の輝度値)を、10ビットのコード値であるHDR信号に変換する。HDRに対応したEOTF(以下、「HDRのEOTF」という。)またはHDRに対応した逆EOTF(以下、「HDRの逆EOTF」という。)においては、SDRに対応したEOTF(以下、「SDRのEOTF」という。)またはSDRに対応した逆EOTF(以下、「SDRの逆EOTF」という。)よりも高い輝度値を表現することが可能である。例えば、図5Aおよび図5Bにおいては、輝度の最大値(ピーク輝度)は、10000nitである。つまり、HDRの輝度範囲は、SDRの輝度範囲を全て含み、HDRのピーク輝度は、SDRのピーク輝度より大きい。HDRの輝度範囲は、SDRの輝度範囲と比較して、その最大値である100nitを10000nitに拡大した輝度範囲である。
例えば、HDRのEOTFおよびHDRの逆EOTFは、一例として、米国映画テレビ技術者協会(SMPTE)で規格化されたSMPTE 2084がある。
[1-6.従来技術]
従来技術では、コンテンツ全体に対して一つの最大輝度情報を示すメタデータが示されており、1つのコンテンツに対して1つの設定のトーンマップを用いて表示処理を行っている。よって、例えばシーン内に高輝度情報が無い暗いシーンでは、シーン内に高輝度情報が無くても、従来の映像表示装置は、高輝度まで表示できるような、最大輝度情報により示されるコンテンツの最大輝度を映像表示装置の表示最大輝度に合わせるトーンマップを行う。
従来技術では、コンテンツ全体に対して一つの最大輝度情報を示すメタデータが示されており、1つのコンテンツに対して1つの設定のトーンマップを用いて表示処理を行っている。よって、例えばシーン内に高輝度情報が無い暗いシーンでは、シーン内に高輝度情報が無くても、従来の映像表示装置は、高輝度まで表示できるような、最大輝度情報により示されるコンテンツの最大輝度を映像表示装置の表示最大輝度に合わせるトーンマップを行う。
しかし、この課題は、シーンごとの輝度情報等を示す動的メタデータ(ダイナミックメタデータ)を映像表示装置に与えることで解決することができる。つまり、映像表示装置は、ダイナミックメタデータを用いてシーンごとに最適なトーンマップを行うことができ、輝度および階調を改善することができる。
[1-6-1.課題1]
上述したとおり、シーンごとの輝度のダイナミックレンジを用いることで、従来技術の課題は解決することができる。
上述したとおり、シーンごとの輝度のダイナミックレンジを用いることで、従来技術の課題は解決することができる。
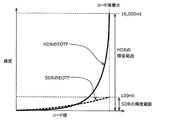
しかしながら、図6のように最大輝度情報を用いるだけでは、トーンマップに用いられる変換カーブを具体的にどのように描けば最適なのかがわからず、コンテンツによっては、輝度や階調性を損なう場合がある。
[1-6-2.課題1の解決案]
そこで、本開示では、トーンマップに用いる変換カーブを最適化するためのダイナミックメタデータを定義し、そのダイナミックメタデータを元にして、トーンマップに用いる変換カーブを生成するためのアルゴリズムを示す。このように、ダイナミックメタデータ、または、主映像を解析することにより得られる、ダイナミックメタデータに相当する映像の特徴データを用いて、トーンマップの最適化を行うことで、映像表示装置は、映像の輝度ごとの重みづけにより、最適なトーンマップを実現した映像を表示することが可能となる。
そこで、本開示では、トーンマップに用いる変換カーブを最適化するためのダイナミックメタデータを定義し、そのダイナミックメタデータを元にして、トーンマップに用いる変換カーブを生成するためのアルゴリズムを示す。このように、ダイナミックメタデータ、または、主映像を解析することにより得られる、ダイナミックメタデータに相当する映像の特徴データを用いて、トーンマップの最適化を行うことで、映像表示装置は、映像の輝度ごとの重みづけにより、最適なトーンマップを実現した映像を表示することが可能となる。
詳細は、以降に実施例として示す。
なお、図6は、入力される映像の輝度(Scene Luminance)と実際のディスプレイに出力される輝度(Display Luminance)との関係を表す図である。つまり、図6は、トーンマップに用いられる変換カーブが示されている。
[1-7.ダイナミックメタデータ]
図7は、ダイナミックメタデータの一例を示す図である。
図7は、ダイナミックメタデータの一例を示す図である。
ダイナミックメタデータは、図7に示す情報を含む。
具体的には、ダイナミックメタデータは、99Y、18G、maxRGB Percentile(1%)、maxRGB Percentile(25%)、maxRGB Percentile(50%)maxRGB Percentile(75%)maxRGB Percentile(90%)、maxRGB Percentile(95%)、(99.98%)、averrage maxRGB、knee_point_x、knee_point_y、Bezier_anchor(0-9)、DY100を含む。特に、ダイナミックメタデータは、99YおよびDY100を含んでいればよい。
これらのダイナミックメタデータは、主映像を構成する複数のフレームのそれぞれの輝度特性を示す情報であってもよいし、複数のフレーム単位のシーンごとの輝度特性を示す情報であってもよい。なお、シーンごとの輝度特性を示す情報である場合、ダイナミックメタデータは、各シーンを構成する複数のフレームの輝度特性の最大値または平均値としてもよい。
以下では、ダイナミックメタデータが1シーンごとの輝度特性を示す情報である場合を例に説明する。ここで、図8は、99YおよびDY100算出方法について説明するための図である。図9は、18Gの算出方法について説明するための図である。図8および図9は、1フレーム中の画素の輝度分布を示す図である。
99YFは、図8に示すように、1フレームの全画素について、輝度と当該輝度の画素数との関係を示す輝度ヒストグラムを低輝度側から累積したとき、99.99%を超えない範囲の最大輝度値を示す。99Yは、シーンを構成する複数のフレームの99YFのうちの最大値に設定される。なお、99Yは、輝度値(0nit~10000nit)を12bit(0~4095)に正規化した0から4095までの整数である。
18Gは、以下の条件により求められる。
・1シーンを構成する複数のフレームのそれぞれについて、当該フレームの輝度ヒストグラムに対し、対象輝度をスタートポイントとして、50nitの幅で累積値のヒストグラム(50nit累積ヒストグラム)を求める
・50nit積算ヒストグラムの中で累積値が最大となる点(最大累積値)とその輝度値を求める
・上記輝度値から輝度を増やしていき、初めて最大累積値の10%を下回った輝度値を18Gとする
・0nitから18Gまでの輝度分布が全体の80%を超える場合の18Gを有効値とし、そうでない場合の18Gを無効値とする
・50nit積算ヒストグラムの中で累積値が最大となる点(最大累積値)とその輝度値を求める
・上記輝度値から輝度を増やしていき、初めて最大累積値の10%を下回った輝度値を18Gとする
・0nitから18Gまでの輝度分布が全体の80%を超える場合の18Gを有効値とし、そうでない場合の18Gを無効値とする
つまり、18Gは、図9に示すDistribution_Cuttoffにおける輝度値として導出される。18Gは、シーンを構成する複数のフレームの18Gの平均である。18Gは、0に等しい場合、それは18Gの計算に含まれてはならない。
なお、Distribution_Cuttoffは、Cutoff_ThresholdおよびDistribution_Peakの乗算で得られた閾値である。Distribution_Peakは、フレーム中の画素の輝度分布のピークにおける画素数である。Cutoff_Thresholdは、例えば、0.10である。つまり、Distribution_Cutoffは、Distribution_Peakの10%の画素数である。
maxRGB Percentile[k]は、以下の計算により求められる。なお、kは、1、25、50、75、90、95、および99.98のいずれか1つである。
・画面の各画素RGBをEOTF変換することで得られた値を正規化する
・各画素に対し正規化されたRGB値の最大値(maxRGB)のヒストグラムを算出する
・0から累積し、カウントされた画素面積がk%の値になったときの値をmaxRGB Percentile[k]とする
・各画素に対し正規化されたRGB値の最大値(maxRGB)のヒストグラムを算出する
・0から累積し、カウントされた画素面積がk%の値になったときの値をmaxRGB Percentile[k]とする
averrage maxRGBは、1フレームの画素ごとのmaxRGB値を全画面で平均化した値である。
knee_point_xおよびknee_point_yは、トーンマップに用いられる変換カーブの直線部分の範囲を表す。つまり、変換カーブは、(0,0)から(knee_point_x、knee_point_y)までは直線的な表現となる。
Bezier_anchor(0-9)は、上記knee_point_x,y以上の領域をBezier係数により導かれるカーブにからトーンマップに用いられる変換カーブを決定するためのBezier係数を示す。
DY100(DistributionY100nit)Fは、1フレームの輝度ヒストグラムにおいて、100nit以下である画素数の全画素数に占める割合を示す。DY100Fは、「Distribution MaxRGB Percentile」値から推定するのではなく、低輝度のピクセルの分布をより正確に知るために、1フレーム中の画素の0~100.23[nit]の範囲において累積された画素数である。なお、DY100Fは、フレーム内の100.23nit(10bit/[0:1023]でY=520)以下のピクセルのパーセンタイルとして導出されるものとする。DY100は、シーンを構成する複数のフレームのDY100Fの平均値に設定される。DY100は、0から100までの整数である。
なお、99YおよびDY100の両方を導出するための画素の輝度値(単位はnitまたはcd/m2)は、SMPTE ST.2084で定義された方法でYから変換しなければならない。また、Y’[0:1]、正規化されたYは、下記の式1に示すように、ITU-T BT.2020で定義された方法でR’G’B’画素値から変換されなければならない。
Y’=0.2627R’+0.6780G’+0.0593B’
(式1)
(式1)
なお、ダイナミックメタデータは、コンテンツ情報として映像データに含まれ、映像を再生している映像再生装置から、映像の再生時にシーンごとに主映像に付加されて映像表示装置に送られる。ただし、ダイナミックメタデータに相当する主映像の輝度特性は、コンテンツの主映像を解析することで取得することも可能である。つまり、本開示は、映像表示装置において主映像を解析することで得られた、ダイナミックメタデータに相当する輝度特性に基づいて行うトーンマップも含む。本開示では、動画像の輝度特性の時系列の変化を示す動的輝度特性として、ダイナミックメタデータ、主映像をフレーム単位、複数のフレームから構成されるシーン単位で、解析することにより得られる輝度特性など例示する。
(18Gの生成方法)
トーンマップのKneePointを決める場合、輝度分布の情報が必要である。特に、1フレーム全体の輝度ヒストグラムにおける集中度を求めることで、kneepointの設定を行うため、精度のある値が必要になる。
トーンマップのKneePointを決める場合、輝度分布の情報が必要である。特に、1フレーム全体の輝度ヒストグラムにおける集中度を求めることで、kneepointの設定を行うため、精度のある値が必要になる。
パーセンタイル値は、1フレーム中の画素の小さい輝度からの積算値であり、離散的である。よって、パーセンタイル値は、決められた輝度の面積分布を示す。このため、パーセンタイル値は、輝度の集中度を十分に表せていない。例えば、maxRGB Percentile[75]を用いて輝度の集中度を判断しようとすると、例えば74%までが輝度集中していて、74%の輝度から離れた輝度に75%がある場合と、75%までが輝度集中している場合とを判別することができない。
このため、18Gを使うことで、輝度分布の連続性を判定できる輝度分布を検出できる18Gは、輝度集中を表すために、輝度ヒストグラムから、最大カウント数となる輝度値(Distribution_Peak_count_Luminance)と、その最大カウント数(Distribution_Peak)とを検出する。また、Distribution_Peak_count_Luminanceから輝度値を上げていき、Distribution_Peakの10%を下回るカウント数になる輝度を特定し、特定した輝度を18G_mesureとする。
18G生成の第1の課題として、単純なヒストグラムからの演算では、瞬間的にカウント数が小さくなり、間違った値を取ってしまう恐れがある。これに対して、18Gの生成方法では、50nit幅の積分値での輝度ヒストグラムを構成することで、瞬時的な変化の感度を軽減し、最適な値を得られるようにしている。
また、18G生成の第2の課題として、50nit幅の積分値での輝度ヒストグラムから求まる値を用いても、ピークが高く集中しているがフレーム全体として平均的な輝度分布の場合などでは集中度が小さい可能性がある。このように、集中度が小さいことを除外するために、得られた結果に対し、18Gまでの輝度ヒストグラムの積算値(パーセンタイル値)が80%を超えることという条件をつける。これにより、80%未満の積算値では18Gとならないため、集中度が小さい場合を除外できる。
[1-8.構成]
次に、本実施の形態に係る映像表示装置100の構成について説明する。
次に、本実施の形態に係る映像表示装置100の構成について説明する。
図10は、実施の形態の映像表示装置の構成の一例を示すブロック図である。図11は、実施の形態のHDR信号変換機の構成の一例を示すブロック図である。
映像表示装置100は、映像受信部110と、トーンマップ処理部120と、表示部130とを備える。
映像受信部110は、動画像である主映像と動的輝度特性とを含む映像データを受信する。つまり、映像受信部110は、映像データを取得する取得部として機能する。映像受信部110は、受信した映像データをトーンマップ処理部120に出力する。
トーンマップ処理部120は、所定の変換カーブを用いてトーンマップを行う処理部である。トーンマップ処理部120は、HDR信号変換機121と、トーンマップ生成装置122とを有する。
HDR信号変換機121は、HDR映像である主映像の輝度情報を表示部130の輝度に最適化して出力する。
また、HDR信号変換機121は、図11に示すように、主映像の輝度を示すコード値を輝度へ変換する入力信号-輝度変換回路123と、輝度を表示部130の輝度へ換算したコード値に変換する輝度-出力レベル変換回路124とを有する。輝度-出力レベル変換回路124は、トーンマップ生成装置122により生成された変換カーブを用いてトーンマップ処理を行うことで、当該トーンマップ処理を行うことで得られた映像を表示部130に最適に表示させることができる。
トーンマップ生成装置122は、表示部130の輝度に応じて、HDR信号変換機121において用いられる変換カーブの最適化を行う。トーンマップ生成装置122は、映像受信部110から映像データのうちの動的輝度特性を取得し、動的輝度特性に応じて、トーンマップに用いるのに最適な変換カーブの生成処理を行う。変換カーブの生成処理の具体的な方法は、別途実施例1~5で説明する。
表示部130は、トーンマップ処理後の映像を表示する。
[1-9.動作]
図12は、本実施の形態に係る映像表示装置の動作を示すフローチャートである。
図12は、本実施の形態に係る映像表示装置の動作を示すフローチャートである。
映像表示装置100では、まず、映像受信部110が動画像である主映像と、当該種映像の輝度特性の時系列の変化を示す動的輝度特性とを含む映像データを取得する(S1)。
次に、トーンマップ処理部120は、動的輝度特性、および、表示装置の最大輝度である表示最大輝度に応じて、動的輝度特性および表示最大輝度に最適な変換カーブを用いて、主映像にトーンマップ処理を行う(S2)。
そして、表示部130は、トーンマップ処理後の映像を表示する(S3)。
[1-10.トーンマップ処理]
次に、トーンマップ処理の例について説明する。
次に、トーンマップ処理の例について説明する。
[1-10-1.トーンマップ処理の第1の例]
第1の例におけるトーンマップ処理について説明する。
第1の例におけるトーンマップ処理について説明する。
第1の例では、ダイナミックメタデータとしてDY100と99Yとを使用してトーンマップを生成する例について説明する。
まず、トーンマップ生成装置122は、99Yを用いて主映像の輝度ダイナミックレンジを特定し、特定した輝度ダイナミックレンジについて、(1)輝度圧縮をするか、(2)輝度圧縮をしないかを決定する。なお、輝度圧縮とは、主映像の輝度を小さくすることで、表示部130に表示させる映像の輝度ダイナミックレンジを縮小する処理である。輝度圧縮とは、例えば、主映像の最高輝度が表示最大輝度を超える場合には、主映像の最高輝度を表示部130に表示させることができないため、主映像の最高輝度が表示最大輝度となるように輝度ダイナミックレンジを縮小させる処理である。また、トーンマップ生成装置122は、輝度圧縮をする場合、さらに、主映像の輝度ダイナミックレンジを、(1-1)高輝度領域で輝度圧縮するか、(1-2)全範囲で輝度圧縮するかを決定してもよい。
また、トーンマップ生成装置122は、上記の(1-2)全範囲を圧縮する場合に、暗部の階調性および視認性を維持するために、DY100に応じて暗部の輝度圧縮率を制御する。
例えば、トーンマップ生成装置122は、ダイナミックメタデータの99Yと、表示最大輝度を示すディスプレイ輝度(DPB:Display Peak Brightness)とから、下記式2を用いて輝度圧縮率を算出する。
輝度圧縮率=DPB/99Y (式2)
トーンマップ生成装置122は、算出した輝度圧縮率に応じて、異なる変換カーブを生成する。トーンマップ生成装置122は、例えば、次の(1)~(3)に示すように、輝度圧縮率に応じて異なる変換カーブを生成する処理行う。
(1)輝度圧縮率が1以上の場合
この場合、トーンマップ生成装置122は、トーンマップ処理は不要であるため、変換カーブを生成しない。つまり、この場合、トーンマップ生成装置122は、輝度圧縮をしないと決定する。
この場合、トーンマップ生成装置122は、トーンマップ処理は不要であるため、変換カーブを生成しない。つまり、この場合、トーンマップ生成装置122は、輝度圧縮をしないと決定する。
よって、HDR信号変換機121は、動画像の99Yまでの範囲の輝度をそのまま変換せずに出力する。このため、Scene LuminanceとDisplay Luminanceとは等しくなる。
(2)閾値TH_A<輝度圧縮率<1の場合
閾値TH_Aは、DPBに所定の係数(例えば、0.5より大きい1未満の数)をかけることで得られた値である。所定の係数は、経験に基づき最適化した値を用いる。この場合、輝度圧縮率は、1に近く輝度圧縮が小さいので、高輝度領域で輝度圧縮する変換カーブを生成する。つまり、この場合、トーンマップ生成装置122は、高輝度領域において輝度圧縮すると決定する。
閾値TH_Aは、DPBに所定の係数(例えば、0.5より大きい1未満の数)をかけることで得られた値である。所定の係数は、経験に基づき最適化した値を用いる。この場合、輝度圧縮率は、1に近く輝度圧縮が小さいので、高輝度領域で輝度圧縮する変換カーブを生成する。つまり、この場合、トーンマップ生成装置122は、高輝度領域において輝度圧縮すると決定する。
トーンマップ生成装置122は、具体的には、図13の「3」に示すように、(i)kneepoint以下の低輝度領域において出力輝度(つまり、表示輝度)を入力輝度(つまり、シーン輝度)と同じ輝度で出力するPQカーブを有し、かつ、(ii)kneepointより大きい高輝度領域において99YをDPBに合わせた輝度圧縮をするカーブを有する、変換カーブを生成する。
(3)輝度圧縮率<閾値TH_A
この場合、輝度圧縮率が大きくなるため、トーンマップ生成装置122は、全範囲を輝度圧縮することで画像全体のバランスを維持する変換カーブを生成する。つまり、この場合、トーンマップ生成装置122は、全範囲を輝度圧縮すると決定する。
この場合、輝度圧縮率が大きくなるため、トーンマップ生成装置122は、全範囲を輝度圧縮することで画像全体のバランスを維持する変換カーブを生成する。つまり、この場合、トーンマップ生成装置122は、全範囲を輝度圧縮すると決定する。
ここで、全範囲を輝度圧縮する上で特に100nit以下の低輝度領域に着目する。絶対輝度で表現されるPQ方式において低輝度領域にも輝度圧縮を行うと多くの場合で圧縮率が大きくなる。このため、低輝度領域は、ほとんどが小さい値で出力されることとなり、低輝度領域のディテールを損なってしまう恐れがある。それを回避するために、トーンマップ生成装置122は、DY100のパラメータを用いて100nit以下の信号に対し個別の処理を行うための変換カーブを生成する。DY100は、100nit以下の低輝度領域に含まれる画素の画面占有度を表す。このため、トーンマップ生成装置122は、全範囲の輝度圧縮の際に、100nit以下の輝度に対する圧縮率を制御する変換カーブを生成する。
つまり、トーンマップ生成装置122は、具体的には、DY100が閾値THを超えるか否かで異なる変換カーブを生成する。なお、閾値THには、経験に基づき最適化した閾値を用いる。
(3-1)DY100>閾値THの場合
この場合、トーンマップ生成装置122は、100nit以下の輝度を有する画素が占める全画素数に対する割合が閾値THより大きいため、100nit以下に重要なディテールがあると判定し、100nit以下の輝度領域において輝度圧縮しない変換カーブを生成する。つまり、トーンマップ生成装置122は、第1輝度(例えば、KneePoint)以下の輝度領域を低輝度領域とし、KneePointを超える輝度領域を高輝度領域としたとき、(i)動的輝度特性のうち、動画像の1フレームにおける低輝度領域に含まれる画素のうち第2輝度としての100nit以下の画素の数を示す第1輝度特性としてのDY100が閾値THを超える場合、100nit以下の範囲の輝度を変更しない第1変換カーブを生成する。トーンマップ生成装置122は、例えば、後述の図17の(c)に示す変換カーブを生成する。
この場合、トーンマップ生成装置122は、100nit以下の輝度を有する画素が占める全画素数に対する割合が閾値THより大きいため、100nit以下に重要なディテールがあると判定し、100nit以下の輝度領域において輝度圧縮しない変換カーブを生成する。つまり、トーンマップ生成装置122は、第1輝度(例えば、KneePoint)以下の輝度領域を低輝度領域とし、KneePointを超える輝度領域を高輝度領域としたとき、(i)動的輝度特性のうち、動画像の1フレームにおける低輝度領域に含まれる画素のうち第2輝度としての100nit以下の画素の数を示す第1輝度特性としてのDY100が閾値THを超える場合、100nit以下の範囲の輝度を変更しない第1変換カーブを生成する。トーンマップ生成装置122は、例えば、後述の図17の(c)に示す変換カーブを生成する。
(3-2)DY100<閾値THの場合
この場合、トーンマップ生成装置122は、100nit以下の輝度を有する画素が占める全画素数に対する割合が閾値TH以下であるため、輝度圧縮の影響が小さいと判定し、低輝度領域においても輝度圧縮する変換カーブを生成する。つまり、トーンマップ生成装置122は、DY100が閾値TH以下である場合、100nit以下の範囲の輝度を当該輝度よりも小さくする第2変換カーブを生成する。トーンマップ生成装置122は、例えば、後述の図17の(b)に示す変換カーブを生成する。
この場合、トーンマップ生成装置122は、100nit以下の輝度を有する画素が占める全画素数に対する割合が閾値TH以下であるため、輝度圧縮の影響が小さいと判定し、低輝度領域においても輝度圧縮する変換カーブを生成する。つまり、トーンマップ生成装置122は、DY100が閾値TH以下である場合、100nit以下の範囲の輝度を当該輝度よりも小さくする第2変換カーブを生成する。トーンマップ生成装置122は、例えば、後述の図17の(b)に示す変換カーブを生成する。
なお、この場合の、輝度圧縮率は、DY100の値によって変化させ、最大圧縮率(例えば、0.8など)を規定し保護してもよい。つまり、トーンマップ生成装置122は、第2変換カーブとして、100nit以下の範囲における傾きが1未満である変換カーブを生成してもよい。また、トーンマップ生成装置122は、第2変換カーブとして、DY100が示す値が小さいほど、100nit以下の範囲の輝度の当該輝度に対する割合が小さい変換カーブを生成してもよい。
図14は、DY100<閾値THの場合に生成する変換カーブの生成方法について説明するための図である。図14は、シーン輝度(入力輝度)に対する表示輝度(出力輝度)の関係を示すグラフ、つまり、第2変換カーブの一例を示している。
図14に示すように、第2変換カーブは、低輝度領域では、100nitまでの範囲においてPQカーブの0.8から1.0の圧縮率で輝度圧縮がされるカーブとなる。なお、DY100<閾値THの場合には、圧縮率は、1.0未満となる。KneePointは、100nitとする。そして、第2変換カーブは、高輝度領域では、99Yまで逆ガンマベースのカーブA×Input(1/2.2)*Bのカーブとなる。最後に、第2変換カーブは、上述した低輝度領域のカーブおよび高輝度領域のカーブを傾きが連続となるカーブにより滑らかに接続することで得られるカーブである。
次に、第1の例のトーンマップ処理についてフローチャートを用いて説明する。
図15は、第1の例のトーンマップ処理を説明するためのフローチャートである。
トーンマップ処理は、トーンマップ処理部120において行われる。
第1の例では、上述した図12のフローチャートにおけるステップS2のトーンマップ処理が開始されると、トーンマップ生成装置122は、映像データのうちのダイナミックメタデータを取得する(S11)。
そして、トーンマップ生成装置122は、ダイナミックメタデータのうちの99Yと、映像表示装置100のDPBとを用いて、輝度圧縮率を算出し、算出した輝度圧縮率が1を超えているか否かを判定する(S12)。
トーンマップ生成装置122は、輝度圧縮率が1を超えていると判定した場合(S12でYes)、輝度圧縮無しと判定し、輝度圧縮をしない変換カーブをHDR信号変換機121に出力する。そして、HDR信号変換機121は、輝度圧縮をしない変換カーブを用いたトーンマップ処理Aを行い、トーンマップ処理Aにより得られた映像信号を表示部130に出力する(S13)。
トーンマップ生成装置122は、輝度圧縮率が1以下であると判定した場合(S12でNo)、輝度圧縮率が閾値TH_Aを超えているか否かを判定する(S14)。
トーンマップ生成装置122は、輝度圧縮率が閾値TH_Aを超えていると判定した場合(S14でYes)、高輝度領域に輝度圧縮を行うと判定し、図13に示す変換カーブをHDR信号変換機121に出力する。そして、HDR信号変換機121は、図13に示す変換カーブを用いたトーンマップ処理Bを行い、トーンマップ処理Bにより得られた映像信号を表示部130に出力する(S15)。
トーンマップ生成装置122は、輝度圧縮率が閾値TH_A以下であると判定した場合(S14でNo)、取得したダイナミックメタデータのうちのDY100が閾値THを超えているか否かを判定する(S16)。
トーンマップ生成装置122は、DY100が閾値THを超えていると判定した場合(S16でYes)、100nit以下の輝度領域において輝度圧縮しない変換カーブをHDR信号変換機121に出力する。そして、HDR信号変換機121は、出力された変換カーブを用いたトーンマップ処理Cを行い、トーンマップ処理Cにより得られた映像信号を表示部130に出力する(S17)。
トーンマップ生成装置122は、DY100が閾値TH以下であると判定した場合(S16でNo)、図14に示す、100nit以下の範囲の輝度を当該輝度よりも小さくする変換カーブをHDR信号変換機121に出力する。そして、HDR信号変換機121では、出力された変換カーブを用いたトーンマップ処理Dを行い、トーンマップ処理Dにより得られた映像信号を表示部130に出力する(S18)。
[1-10-2.トーンマップ処理の第2の例]
第2の例におけるトーンマップ処理について説明する。第2の例では、DY100および99Yを使用した第1の例とは異なる変換カーブの生成方法について説明する。
第2の例におけるトーンマップ処理について説明する。第2の例では、DY100および99Yを使用した第1の例とは異なる変換カーブの生成方法について説明する。
この例では、トーンマップ生成装置122は、99Yにより入力信号の最大値を求め、DY100により100nitポイントにおける傾きを決定する。
図16は、第2の例における変換カーブの生成方法について説明するための図である。
トーンマップ生成装置122は、第2の例では、図16に示す、原点座標、100nit座標(Ks)、最大値座標(99Y,DPB:Display Peak Brightness)で構成される変換カーブを生成する。トーンマップ生成装置122は、DY100を用いて、100nitにおける入力輝度の出力輝度(F1s(100))を算出し、100nit以下における変換カーブの傾きと、100nit座標Ksにおける変換カーブにおける傾きとを、例えば、1.0などに決定する。
次に、トーンマップ生成装置122は、99Yを用いて、99Yにおける変換カーブ傾きを決定し、原点座標、100nit座標Ksおよび最大値座標の3点をスプライン曲線で結ぶことでトーンマップを生成する。
トーンマップ生成装置122は、具体的には、図17の(b)に示すように、DY100が所定の閾値以下であれば、F1s(100)の値を小さくすることにより100nit座標までの傾きを小さくした変換カーブを生成してもよい。また、この場合、トーンマップ生成装置122は、100nit座標Ksにおける傾きを大きくすることで、100nit以上の範囲の傾きを100nit未満の範囲の傾きよりも大きくした変換カーブを生成する。これにより、100nit以上の範囲の階調性を確保することができる。
また、トーンマップ生成装置122は、その際に、パーセンタイル情報を用いて傾きに対して重みづけを行った変換カーブを生成してもよい。トーンマップ生成装置122は、例えば、maxRGB Percentile[75]が99Yに近い値(例えば、99Yを基準とする所定の輝度範囲内の値)となった場合、高輝度領域(99Y付近)の階調成分が多いと判定できる。このため、トーンマップ生成装置122は、maxRGB Percentile[75]から99Yの傾きを大きくする変換カーブを生成してもよい。これにより、maxRGB Percentile[75]から99Yの間の階調性を改善することができる。
なお、図16において、Ks(100, F1(100))は、DY100を評価することによって決定されるシーンのニーポイントを示す。また、F1s(Vi)は、映像入力信号の0~100nitの輝度範囲のような、シーンの低レベル信号用(低輝度領域)の線形関数を示す。F2s(Vi)は、映像入力信号の100nit~99Yの輝度範囲のような、シーンの中および高レベル信号用(中および高輝度領域)のスプライン曲線関数を示す。
[1-10-3.トーンマップ処理の第3の例]
第3の例におけるトーンマップ処理について説明する。第3の例では、高輝度領域におけるトーンマップ処理について説明する。
第3の例におけるトーンマップ処理について説明する。第3の例では、高輝度領域におけるトーンマップ処理について説明する。
図18は、第3の例のトーンマップ処理において生成する変換カーブについて説明するための図である。
この場合、トーンマップ生成装置122は、ダイナミックメタデータの18Gおよび99Yを用いて、18Gから99Yまでの輝度の範囲を18Gから映像表示装置100の最大輝度(Max_Luminance)で表現する変換カーブを生成する。このため、トーンマップ生成装置122は、maxRGB Percentile[90]およびmaxRGB Percentile[98]の少なくとも一方の値を用いることにより、図18の(b)に示すように、高輝度領域での階調の重みづけを大きくした変換カーブを生成する。つまり、トーンマップ生成装置122は、高輝度領域での傾きを大きくした変換カーブを生成する。
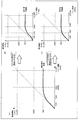
図19は、maxRGB Percentile[90]、および、maxRGB Percentile[98]が共に99Yよりも18Gに近い値の場合に生成する変換カーブの一例を示す図である。図20は、maxRGB Percentile[90]、および、maxRGB Percentile[98]が共に18Gよりも99Yに近い値の場合に生成する変換カーブの一例を示す図である。
例えば、トーンマップ生成装置122は、maxRGB Percentile[90]、および、maxRGB Percentile[98]が共に99Yよりも18Gに近い値の場合、KneePointを設定する範囲の上限であるknee_high_pointを、例えばmaxRGB Percentile[98]とする。これにより、トーンマップ生成装置122は、図19に示すように、18GからmaxRGB Percentile[98]までの階調性のウェイトを上げた、つまり、傾きが1に近い(例えば傾きが0.8より大きい)変換カーブを生成する。
反対に、トーンマップ生成装置122は、maxRGB Percentile[90]、および、maxRGB Percentile[98]が18Gよりも99Yに近い場合、knee_high_pointを、Max_Luminance付近とする。これにより、トーンマップ生成装置122は、図20に示すように、knee_high_pointから99Yまでの階調性のウェイトを上げた、つまり、傾きが1に近い(例えば傾きが0.8より大きい)変換カーブを生成する。
なお、図19および図20の例以外にも、これらの値により重みづけされたトーンマップを生成することは可能である。トーンマップ生成装置122は、knee_point_xおよびknee_point_y、bezier_anchorなどのダイナミックメタデータを利用して変換カーブを生成してもよい。
なお、第3の例のトーンマップ処理は、第1の例の(2)閾値TH_A<輝度圧縮率<1の場合、または、(3)輝度圧縮率<閾値TH_Aの(3-1)DY100>閾値THの場合に行ってもよい。
このように、トーンマップ生成装置122は、図15におけるトーンマップ処理Bまたはトーンマップ処理Cにおいて、(i)1フレームにおける各画素のmaxRGBのヒストグラムにおいて、0からの累積値が全画素における90%以上の第1割合としての90%および98%の少なくとも一方となるときの第3輝度(つまり、maxRGB Percentile[90]、および、maxRGB Percentile[98]の少なくとも一方)が、当該1フレームにおける最大輝度(つまり、99Y)よりも第2輝度としての18Gに近い値である場合、第2輝度から第3輝度までの傾きを、第3輝度を超える範囲の傾きよりも大きい変換カーブを生成する。
また、トーンマップ生成装置122は、図15におけるトーンマップ処理Bまたはトーンマップ処理Cにおいて、(ii)第3輝度が第2輝度よりも最大輝度に近い値である場合、第2輝度から第3輝度までの傾きが、第3輝度を超える範囲の傾きよりも小さい変換カーブを生成する。
これにより、トーンマップ処理部120は、maxRGB Percentile[90]、および、maxRGB Percentile[98]の少なくとも一方が99Yよりも18Gに近い値の場合、少なくとも全画素の90%は18Gに近い輝度に集中していると言える。このため、18GからmaxRGB Percentile[98]までの傾きをmaxRGB Percentile[98]を超える傾きよりも大きくした変換カーブを用いてトーンマップ処理を行うことで、18GからmaxRGB Percentile[98]までの階調性のウェイトを上げることができる。よって、1フレーム中に集中している輝度を有する画素の階調性を向上させることができ、映像の品質を向上させることができる。
また、トーンマップ処理部120は、maxRGB Percentile[90]、および、maxRGB Percentile[98]の少なくとも一方が18Gよりも99Yに近い値の場合、残りの10%または2%の画素が99Yまでの高輝度領域に集中していると言える。このため、maxRGB Percentile[90]から99Yまでの傾きを18GからmaxRGB Percentile[90]までの傾きよりも大きくした変換カーブを用いてトーンマップ処理を行うことで、maxRGB Percentile[90]から99Yまでの階調性のウェイトを上げることができる。よって、1フレーム中に集中している輝度を有する画素の階調性を向上させることができ、映像の品質を向上させることができる。
なお、第3の例では、第2輝度として18Gを例示したが、第2輝度は100nitであってもよい。
[1-10-4.トーンマップ処理の第4の例]
第4の例におけるトーンマップ処理について説明する。第4の例では、低輝度領域におけるトーンマップ処理について説明する。
第4の例におけるトーンマップ処理について説明する。第4の例では、低輝度領域におけるトーンマップ処理について説明する。
第1の例では、輝度圧縮を行う場合において、DY100が閾値TH_A以下の場合に、低輝度領域において輝度圧縮を行うとしたが、これに限らない。例えば、maxRGB Percentile[1]の値に応じて、低輝度領域における輝度圧縮を行うか否かを決定してもよい。
具体的には、トーンマップ生成装置122は、ダイナミックメタデータのmaxRGB Percentile[1]が所定の輝度よりも高い輝度であるか否かに応じて、低輝度領域(暗部)の輝度分布が多いか少ないかを判定する。そして、トーンマップ生成装置122は、暗部の輝度分布が少ないと判定した場合、例えば上述した図17の(b)に示すように、暗部側をトーンマップすることで輝度ダイナミックレンジを圧縮し、全体のダイナミックレンジを拡張する変換カーブを生成してもよい。例えば、maxRGB Percentile[1]が200nitであれば、200nit以下の輝度になる画素が占める面積は画面全体の面積の1%以下になる。そのため、200nit以下の輝度情報を圧縮しても全体としての影響は低い。また、その際に、200nit以上の領域の傾きを1にすることで、200nit以上の入力信号の階調性を維持した映像信号を出力することができる。
[1-10-5.トーンマップ処理の第5の例]
第5の例におけるトーンマップ処理について説明する。第5の例では、KneePoint(ニーポイント)の決定方法について説明する。
第5の例におけるトーンマップ処理について説明する。第5の例では、KneePoint(ニーポイント)の決定方法について説明する。
トーンマップ生成装置122は、99Yおよび18Gを用いて、変換カーブのKneePoint(コンテンツ輝度の圧縮を開始する点)を決定する。これにより、特定輝度領域のコントラストを適切に向上させることができる。
トーンマップ生成装置122は、例えば、99Yが映像表示装置100のDPBより高い場合、収束点を99Yとして、変換カーブにおけるKneePointを決めるために、18Gを利用する。トーンマップ生成装置122は、99Yに対して以下の値を設定する。
トーンマップ生成装置122は、変換カーブが全階調を視認できる上限の値を、kneepoint_maxとして設定する。また、トーンマップ生成装置122は、変換カーブが全階調均等に視認できる値をkneepoint_minとして設定する。ここで、kneepoint_maxは、KneePointを決定するための輝度範囲の上限値であり、kneepoint_minは、KneePointを決定するための輝度範囲の下限値である。
また、トーンマップ生成装置122は、18Gが示す値以下に輝度分布の80%以上が集中するため、kneepointを、18Gを用いて決定する。
図21は、第5の例のトーンマップ処理を説明するためのフローチャートである。図22は、第5の例のトーンマップ処理において生成する変換カーブについて説明するための図である。
第5の例では、上述した図12のフローチャートにおけるステップS2のトーンマップ処理が開始されると、トーンマップ生成装置122は、映像データのうちのダイナミックメタデータを取得する(S21)。
そして、トーンマップ生成装置122は、ダイナミックメタデータのうちの99Yが映像表示装置100のDPB以下であるか否かを判定する(S22)。
トーンマップ生成装置122は、99YがDPB以下であると判定した場合(S22でYes)、変換カーブの高輝度側の収束点であるKnee_endをDPBに設定する(S23)。
トーンマップ生成装置122は、99YがDPBを超えると判定した場合(S22でNo)、Knee_endを99Yに設定する(S24)。
その後、トーンマップ生成装置122は、18GがKneePoint_max未満であるか否かを判定する(S25)。
トーンマップ生成装置122は、18GがKneePoint_max以上であると判定した場合(S25でNo)、KneePointをKneePoint_maxに設定する(S26)。
トーンマップ生成装置122は、18GがKneePoint_max未満であると判定した場合(S25でYes)、18GがKneePoint_min未満であるか否かを判定する(S27)。
トーンマップ生成装置122は、18GがKneePoint_min未満であると判定した場合(S27でYes)、KneePointをKneePoint_minに設定する(S28)。
トーンマップ生成装置122は、18GがKneePoint以上であると判定した場合(S27でNo)、KneePointを18Gに設定する。
ステップS23、S26、S28およびS29が終了すると、トーンマップ生成装置122は、ここでの処理を終了する。
トーンマップ生成装置122は、この処理において設定されたKneePointを用いて、上記の第1の例~第4の例の変換カーブの生成を行ってもよい。
[2.ダイナミックメタデータの生成方法]
次に、ダイナミックメタデータの生成方法について説明する。
次に、ダイナミックメタデータの生成方法について説明する。
以下では、ダイナミックトーンマップにより従来課題を解決するために必要なメタデータの生成方法を開示する。
[2-1.生成装置の構成]
ダイナミックメタデータを生成する生成装置の構成について説明する。
ダイナミックメタデータを生成する生成装置の構成について説明する。
図23は、実施の形態の生成装置の構成の一例を示すブロック図である。図24は、実施の形態の生成部の構成の一例を示すブロック図である。
生成装置200は、映像受信部210と、生成部220と、メモリ230とを備える。
映像受信部210は、動画像である主映像を受信する。つまり、映像受信部210は、主映像を取得する取得部として機能する。映像受信部210は、受信した主映像を生成部220に出力する。
生成部220は、映像受信部210により出力された主映像を解析することで、シーンごとの輝度特性を示すダイナミックメタデータを生成する。生成部220は、具体的には、1フレームごとにダイナミックメタデータを生成し、複数フレームから構成される1シーン分のダイナミックメタデータをメモリ230に一時記憶させる。そして、生成部220は、1シーン分のダイナミックメタデータを用いて、平均、または、最大値を取ることでシーンごとのダイナミックメタデータを生成する。なお、生成部220は、1フレームごとに生成したメタデータを出力してもよい。
また、生成部220は、映像情報輝度変換部221と、輝度ヒストグラム生成部222と、決定部223とを有する。
映像情報輝度変換部221は、RGB値で入力される映像信号を輝度信号に変換する。
輝度ヒストグラム生成部222は、映像情報輝度変換部221において輝度変換されることにより得られた信号情報から輝度ヒストグラムを生成する。
決定部223は、輝度ヒストグラム生成部222において生成された輝度ヒストグラムを用いて、フレームごとダイナミックメタデータを決定する。また、決定部223は、メモリ230に一時記憶された1シーン分の複数フレームのダイナミックデータを用いて、時間的に類似映像情報をマージする処理を行う。ここで、マージとは、99Yにおいてはシーン(類似フレーム)内の最大値を取る処理であり、100DYにおいてはシーン(類似フレーム)内の平均値を取る処理である。
メモリ230は、生成部220により生成された1フレームごとのダイナミックメタデータを一時記憶する。
[2-2.生成装置の動作]
次に、生成装置によるダイナミックメタデータの生成方法について説明する。
次に、生成装置によるダイナミックメタデータの生成方法について説明する。
図25は、生成方法の一例を示すフローチャートである。
まず、生成装置200では、映像受信部210が、主映像を取得する(S31)。
次に、生成部220は、映像受信部210により取得された主映像を構成する複数のフレームのそれぞれについてステップS32およびステップS33を繰り返すループを開始する。
生成部220は、処理対象のフレームについて輝度特性を決定する(S32)。輝度特性の決定処理の詳細について、図26を用いて説明する。
図26は、生成方法における輝度特性の決定処理を示すフローチャートである。
生成部220は、処理対象のフレームの全画素の輝度を解析することで、輝度ヒストグラムを生成する(S41)。
次に、生成部220は、輝度ヒストグラムにおいて、低輝度から順に積算値のカウントを開始する(S42)。具体的には、生成部220は、輝度ヒストグラムの0nitから順に1nitずつ増やしながら、設定した輝度を有する画素をカウントする。
そして、生成部220は、カウント対象となる輝度値が100nitであるか否かを判定する(S43)。
生成部220は、カウント対象となる輝度が100nitであると判定した場合(S43でYes)、現在までカウントした積算値を全画素数で除した値をDY100に決定する(S44)。つまり、生成部220は、動画像を構成する複数のフレームのそれぞれについて、当該フレームを構成する複数の画素のうち所定輝度としての100nit以下の画素の数を、当該フレームを構成する全画素の数で除すことで得られた値を、第1輝度特性としてのDY100として決定する。
生成部220は、ステップS44の後、または、カウント対象となる輝度が100nitでないと判定した場合(S43でNo)、現在の積算値を全画素数で除した値が99.99%を超えるか否かを判定する(S45)。
生成部220は、現在の積算値を全画素数で除した値が99.99%を超えると判定した場合(S45でYes)、現在カウント対象の輝度を99Yに決定する(S46)。つまり、ここでは、生成部2220は、動画像を複数のフレームのそれぞれについて、当該フレームにおける全画素を輝度が小さい画素から並べたときの、全画素の99.99%の数における輝度である最大輝度を特定し、特定した最大輝度を第2輝度特性としての99Yとして決定する。
生成部220は、ステップS46の後、または、現在の積算値を全画素数で除した値が99.99%以下であると判定した場合(S45でNo)、100DYおよび99Yを決定済みであるか否かを判定する(S47)。
生成部220は、100DYおよび99Yを決定済みであると判定した場合(S47でYes)、輝度特性の決定処理を終了する。
生成部220は、100DYまたは99Yを決定済みでないと判定した場合(S47でNo)、カウント対象とする輝度を1nit増やして、ステップS43に戻る。
図25に戻り、生成部220は、輝度特性の決定処理を終了すると、決定した輝度特性をメモリ230に出力する(S33)。そして、生成部220は、メモリ230に1シーン分の輝度特性が蓄積された場合、1シーン分の複数の輝度特性を用いて、マージを行い、マージ後のダイナミックメタデータを出力し、処理を終了する。
なお、生成装置200は、出力したダイナミックメタデータを、コンテンツのSEI情報に記録する。つまり、生成装置200は、ダイナミックメタデータを動画像と共にHDD、SSD、BDなどの記録媒体に記録してもよい。
なお、生成装置200が生成するダイナミックメタデータとして、ダイナミックメタデータのうちDY100および99Yを生成する例について説明しているが、他のダイナミックメタデータについても同様に生成してもよい。
このように、生成装置200は、動画像を解析することで、ダイナミックメタデータを生成することができる。よって、映像表示装置は、動画像の他に、動画像の動的輝度特性を示すダイナミックメタデータを取得できるため、ダイナミックメタデータが示す動画像の輝度特性に応じて、トーンマップ処理を実行することができる。つまり、映像表示装置は、動画像を解析しなくてもダイナミックトーンマップを実行することができ、処理負荷を軽減できる。また、映像表示装置は、動画像の解析に係る処理時間を軽減できるため、ダイナミックトーンマップを効果的に動画像に実行することができる。
[3.変形例]
主映像は、例えば、HDR映像である。HDR映像は、例えば、Blu-rayディスク、DVD、Internetの動画配信サイト、放送、又はHDD(Hard Disk Drive)内の映像であってもよい。
主映像は、例えば、HDR映像である。HDR映像は、例えば、Blu-rayディスク、DVD、Internetの動画配信サイト、放送、又はHDD(Hard Disk Drive)内の映像であってもよい。
映像再生装置は、ディスクプレイヤー、ディスクレコーダ、セットトップボックス、テレビ、パーソナルコンピュータ、又はスマートフォンなど、記録媒体、放送又はインターネットからの圧縮された映像信号を復号し、映像表示装置に送る装置でもよい。また、映像再生装置の機能の一部又は全てが、映像表示装置100に含まれてもよい。
映像再生装置からの映像信号を映像表示装置に伝送する映像信号伝送手段は、HDMI(登録商標)、DVI、又はDPなど映像信号を非圧縮の状態で伝送するものでもよいし、ネットワークを通じたように映像信号を圧縮した形式で伝送する手段であってもよい。
映像表示装置の最大輝度情報又はトーンマップ情報の映像再生装置への設定は、利用者が映像再生装置にリモートコントローラなどを用いて入力することで行われてもよいし、利用者が、映像再生装置が備える操作装置を用いて入力することで行われてもよい。または、利用者は、インターネット又はその他の手段を用いて、これらの情報を取得し、取得した情報をポータブル記憶媒体に保存し、ポータブル記憶媒体を介して、これらの情報を映像再生装置に送ってもよい。また、映像再生装置が直接、インターネットに接続され、映像再生装置は、サーバのデータベースから、これらの情報を取得してもよい。さらに、映像再生装置は、映像表示装置にテストパターンを表示し、表示されたテストパターンを用いて映像表示装置の特性を確認しながら、これらの情報を取得及び記憶してもよい。
以上、本開示の実施の形態に係る映像表示方法、輝度特性生成方法について説明したが、本開示は、この実施の形態に限定されるものではない。
また、上記実施の形態に係る映像表示装置、生成装置に含まれる各処理部は典型的には集積回路であるLSIとして実現される。これらは個別に1チップ化されてもよいし、一部又は全てを含むように1チップ化されてもよい。
また、集積回路化はLSIに限るものではなく、専用回路又は汎用プロセッサで実現してもよい。LSI製造後にプログラムすることが可能なFPGA(Field Programmable Gate Array)、又はLSI内部の回路セルの接続や設定を再構成可能なリコンフィギュラブル・プロセッサを利用してもよい。
また、上記各実施の形態において、各構成要素は、専用のハードウェアで構成されるか、各構成要素に適したソフトウェアプログラムを実行することによって実現されてもよい。各構成要素は、CPUまたはプロセッサなどのプログラム実行部が、ハードディスクまたは半導体メモリなどの記録媒体に記録されたソフトウェアプログラムを読み出して実行することによって実現されてもよい。
また、本開示は、映像表示装置、生成装置により実行される各種方法として実現されてもよい。
また、ブロック図における機能ブロックの分割は一例であり、複数の機能ブロックを一つの機能ブロックとして実現したり、一つの機能ブロックを複数に分割したり、一部の機能を他の機能ブロックに移してもよい。また、類似する機能を有する複数の機能ブロックの機能を単一のハードウェア又はソフトウェアが並列又は時分割に処理してもよい。
また、フローチャートにおける各ステップが実行される順序は、本開示を具体的に説明するために例示するためのものであり、上記以外の順序であってもよい。また、上記ステップの一部が、他のステップと同時(並列)に実行されてもよい。
以上、一つまたは複数の態様に係る映像表示装置、生成装置について、実施の形態に基づいて説明したが、本開示は、この実施の形態に限定されるものではない。本開示の趣旨を逸脱しない限り、当業者が思いつく各種変形を本実施の形態に施したものや、異なる実施の形態における構成要素を組み合わせて構築される形態も、一つまたは複数の態様の範囲内に含まれてもよい。
本開示は、輝度特性生成方法に適用できる。
100 映像表示装置
110 映像受信部
120 トーンマップ処理部
121 HDR信号変換機
122 トーンマップ生成装置
123 入力信号-輝度変換回路
124 輝度-出力レベル変換回路
130 表示部
200 生成装置
210 映像受信部
220 生成部
221 映像情報輝度変換部
222 輝度ヒストグラム生成部
223 決定部
230 メモリ
110 映像受信部
120 トーンマップ処理部
121 HDR信号変換機
122 トーンマップ生成装置
123 入力信号-輝度変換回路
124 輝度-出力レベル変換回路
130 表示部
200 生成装置
210 映像受信部
220 生成部
221 映像情報輝度変換部
222 輝度ヒストグラム生成部
223 決定部
230 メモリ
Claims (4)
- 動画像を構成する複数のフレームのそれぞれについて、当該フレームを構成する複数の画素のうち第1輝度以下の画素の数を、当該フレームを構成する全画素の数で除すことで得られた値を、第1輝度特性として決定する第1決定ステップと、
前記第1決定ステップにおいて決定された前記第1輝度特性を出力する出力ステップと、を含む
輝度特性生成方法。 - さらに、
前記出力ステップにおいて出力された前記第1輝度特性を、前記動画像の時系列における輝度特性を示す特性情報として、前記動画像と共に映像データとして記録する記録ステップを含む
請求項1に記載の輝度特性生成方法。 - さらに、
前記動画像を前記複数のフレームのそれぞれについて、当該フレームにおける全画素を輝度が小さい画素から並べたとき、全画素の99.99%の数における輝度である最大輝度を特定し、特定した前記最大輝度を第2輝度特性として決定する第2決定ステップを含み、
前記出力ステップでは、前記第1輝度特性とともに、前記第2決定ステップで決定された前記第2輝度特性を出力する
請求項1に記載の輝度特性生成方法。 - さらに、
前記出力ステップにおいて出力された前記第1輝度特性および前記第2輝度特性を、前記動画像の時系列における輝度特性を示す特性情報として、前記動画像とともに映像データとして記録する記録ステップを含む
請求項3に記載の輝度特性生成方法。
Priority Applications (4)
| Application Number | Priority Date | Filing Date | Title |
|---|---|---|---|
| EP23163831.3A EP4220541A1 (en) | 2017-09-13 | 2018-02-26 | Luminance characteristics generation method |
| JP2019510373A JP6709986B2 (ja) | 2017-09-13 | 2018-02-26 | 輝度特性生成方法 |
| EP18857102.0A EP3684063B1 (en) | 2017-09-13 | 2018-02-26 | Brightness characteristic generation method |
| US16/349,931 US10742945B2 (en) | 2017-09-13 | 2018-02-26 | Luminance characteristics generation method |
Applications Claiming Priority (4)
| Application Number | Priority Date | Filing Date | Title |
|---|---|---|---|
| US201762558092P | 2017-09-13 | 2017-09-13 | |
| US62/558,092 | 2017-09-13 | ||
| US201762580918P | 2017-11-02 | 2017-11-02 | |
| US62/580,918 | 2017-11-02 |
Publications (1)
| Publication Number | Publication Date |
|---|---|
| WO2019053917A1 true WO2019053917A1 (ja) | 2019-03-21 |
Family
ID=65722508
Family Applications (2)
| Application Number | Title | Priority Date | Filing Date |
|---|---|---|---|
| PCT/JP2018/006865 Ceased WO2019053917A1 (ja) | 2017-09-13 | 2018-02-26 | 輝度特性生成方法 |
| PCT/JP2018/006864 Ceased WO2019053916A1 (ja) | 2017-09-13 | 2018-02-26 | 映像表示装置及び映像表示方法 |
Family Applications After (1)
| Application Number | Title | Priority Date | Filing Date |
|---|---|---|---|
| PCT/JP2018/006864 Ceased WO2019053916A1 (ja) | 2017-09-13 | 2018-02-26 | 映像表示装置及び映像表示方法 |
Country Status (4)
| Country | Link |
|---|---|
| US (3) | US10659745B2 (ja) |
| EP (3) | EP4220541A1 (ja) |
| JP (2) | JP6709986B2 (ja) |
| WO (2) | WO2019053917A1 (ja) |
Families Citing this family (18)
| Publication number | Priority date | Publication date | Assignee | Title |
|---|---|---|---|---|
| US11032448B2 (en) | 2017-06-21 | 2021-06-08 | Panasonic Intellectual Property Management Co., Ltd. | Video display system and video display method |
| EP3654656B1 (en) | 2017-07-14 | 2024-06-19 | Panasonic Intellectual Property Management Co., Ltd. | Video display system and video display method |
| WO2019053917A1 (ja) | 2017-09-13 | 2019-03-21 | パナソニックIpマネジメント株式会社 | 輝度特性生成方法 |
| EP3694216A4 (en) * | 2017-10-06 | 2020-12-02 | Panasonic Intellectual Property Management Co., Ltd. | IMAGE DISPLAY SYSTEM AND IMAGE DISPLAY METHOD |
| EP3734954B1 (en) * | 2017-12-27 | 2023-03-22 | Panasonic Intellectual Property Management Co., Ltd. | Display device and display method |
| JP7280670B2 (ja) * | 2018-07-06 | 2023-05-24 | キヤノン株式会社 | 画像処理装置、制御方法、及びプログラム |
| KR102805644B1 (ko) * | 2018-09-18 | 2025-05-09 | 엘지전자 주식회사 | 영상표시장치 |
| JP7278096B2 (ja) * | 2019-02-20 | 2023-05-19 | キヤノン株式会社 | 画像処理装置、画像処理方法、およびプログラム |
| KR102666909B1 (ko) | 2019-06-19 | 2024-05-20 | 삼성전자주식회사 | 디스플레이장치 및 그 제어방법 |
| KR102903495B1 (ko) * | 2020-04-03 | 2025-12-24 | 에스케이하이닉스 주식회사 | 이미지 센싱 장치 및 그의 동작 방법 |
| CN113628106B (zh) * | 2020-05-08 | 2025-01-28 | 华为技术有限公司 | 图像动态范围处理方法和装置 |
| JP7459765B2 (ja) * | 2020-11-11 | 2024-04-02 | 株式会社Jvcケンウッド | 投影装置、投影方法及びプログラム |
| KR102375369B1 (ko) * | 2020-11-26 | 2022-03-18 | 엘지전자 주식회사 | 톤 매핑 장치 및 그 방법 |
| CN114640834B (zh) | 2020-12-15 | 2024-03-19 | 华为技术有限公司 | 一种图像处理的方法以及相关装置 |
| KR20240105409A (ko) * | 2021-11-15 | 2024-07-05 | 엘지전자 주식회사 | 영상표시기기 및 그 제어 방법 |
| US11734806B2 (en) * | 2021-11-24 | 2023-08-22 | Roku, Inc. | Dynamic tone mapping |
| CN114422767B (zh) * | 2022-01-29 | 2024-09-10 | Oppo广东移动通信有限公司 | 一种视频效果增强方法、装置、移动终端和存储介质 |
| JP2024054022A (ja) * | 2022-10-04 | 2024-04-16 | キヤノン株式会社 | プログラム、画像処理装置、画像処理装置の制御方法 |
Citations (5)
| Publication number | Priority date | Publication date | Assignee | Title |
|---|---|---|---|---|
| JP2000035774A (ja) * | 1998-07-17 | 2000-02-02 | Fujitsu Ltd | 表示装置 |
| WO2016027423A1 (ja) * | 2014-08-19 | 2016-02-25 | パナソニックIpマネジメント株式会社 | 伝送方法、再生方法及び再生装置 |
| US20160360171A1 (en) * | 2015-06-02 | 2016-12-08 | Samsung Electronics Co., Ltd. | Distribution-point-based adaptive tone mapping |
| WO2017089146A1 (en) * | 2015-11-24 | 2017-06-01 | Koninklijke Philips N.V. | Handling multiple hdr image sources |
| JP2017184249A (ja) | 2014-06-26 | 2017-10-05 | パナソニックIpマネジメント株式会社 | 表示装置、表示方法及びコンピュータプログラム |
Family Cites Families (27)
| Publication number | Priority date | Publication date | Assignee | Title |
|---|---|---|---|---|
| EP1111026B1 (en) * | 1998-08-18 | 2010-03-10 | Nichia Corporation | Red light-emitting afterglow photoluminescence phosphor and afterglow lamp using the phosphor |
| TW518882B (en) * | 2000-03-27 | 2003-01-21 | Hitachi Ltd | Liquid crystal display device for displaying video data |
| JP4006347B2 (ja) * | 2002-03-15 | 2007-11-14 | キヤノン株式会社 | 画像処理装置、画像処理システム、画像処理方法、記憶媒体、及びプログラム |
| US7359572B2 (en) * | 2003-03-26 | 2008-04-15 | Microsoft Corporation | Automatic analysis and adjustment of digital images with exposure problems |
| US8050511B2 (en) * | 2004-11-16 | 2011-11-01 | Sharp Laboratories Of America, Inc. | High dynamic range images from low dynamic range images |
| US7426312B2 (en) * | 2005-07-05 | 2008-09-16 | Xerox Corporation | Contrast enhancement of images |
| JP4650845B2 (ja) * | 2005-10-31 | 2011-03-16 | シャープ株式会社 | カラー液晶表示装置およびそのためのガンマ補正方法 |
| US7639893B2 (en) * | 2006-05-17 | 2009-12-29 | Xerox Corporation | Histogram adjustment for high dynamic range image mapping |
| CN102667907B (zh) * | 2009-11-27 | 2014-12-31 | 夏普株式会社 | 液晶显示装置和液晶显示装置的驱动方法 |
| TWI399985B (zh) * | 2009-12-16 | 2013-06-21 | Micro Star Int Co Ltd | 影像調校方法 |
| JP5577415B2 (ja) * | 2010-02-22 | 2014-08-20 | ドルビー ラボラトリーズ ライセンシング コーポレイション | ビットストリームに埋め込まれたメタデータを用いたレンダリング制御を備えるビデオ表示 |
| US8314847B2 (en) * | 2010-05-25 | 2012-11-20 | Apple Inc. | Automatic tone mapping curve generation based on dynamically stretched image histogram distribution |
| JP5791336B2 (ja) * | 2011-04-01 | 2015-10-07 | キヤノン株式会社 | 画像処理装置及びその制御方法 |
| US8781798B2 (en) * | 2011-04-18 | 2014-07-15 | International Business Machines Corporation | Systems and methods for exploring and utilizing solutions to cyber-physical issues in a sandbox |
| PH12017502053B1 (en) | 2011-09-27 | 2024-06-21 | Koninklijke Philips Electronics Nv | Apparatus and method for dynamic range transforming of images |
| JP5197858B1 (ja) * | 2012-02-15 | 2013-05-15 | シャープ株式会社 | 映像表示装置およびテレビ受信装置 |
| JP5165802B1 (ja) * | 2012-02-17 | 2013-03-21 | シャープ株式会社 | 映像表示装置およびテレビ受信装置 |
| CN105493490B (zh) * | 2014-06-23 | 2019-11-29 | 松下知识产权经营株式会社 | 变换方法和变换装置 |
| ES2825699T3 (es) * | 2014-12-11 | 2021-05-17 | Koninklijke Philips Nv | Optimización e imágenes de alto rango dinámico para pantallas particulares |
| US9860504B2 (en) * | 2015-01-09 | 2018-01-02 | Vixs Systems, Inc. | Color gamut mapper for dynamic range conversion and methods for use therewith |
| WO2016181584A1 (ja) * | 2015-05-12 | 2016-11-17 | パナソニック インテレクチュアル プロパティ コーポレーション オブ アメリカ | 表示方法および表示装置 |
| CN111312133B (zh) * | 2015-11-10 | 2024-01-09 | 佳能株式会社 | 显示控制装置及其控制方法 |
| US9984446B2 (en) | 2015-12-26 | 2018-05-29 | Intel Corporation | Video tone mapping for converting high dynamic range (HDR) content to standard dynamic range (SDR) content |
| EP3220349A1 (en) * | 2016-03-16 | 2017-09-20 | Thomson Licensing | Methods, apparatus, and systems for extended high dynamic range ("hdr") hdr to hdr tone mapping |
| US10229484B2 (en) | 2016-11-30 | 2019-03-12 | Stmicroelectronics (Grenoble 2) Sas | Tone mapping method |
| EP3337170A1 (en) | 2016-12-15 | 2018-06-20 | Thomson Licensing | Color grading interpolation methods and devices |
| WO2019053917A1 (ja) | 2017-09-13 | 2019-03-21 | パナソニックIpマネジメント株式会社 | 輝度特性生成方法 |
-
2018
- 2018-02-26 WO PCT/JP2018/006865 patent/WO2019053917A1/ja not_active Ceased
- 2018-02-26 US US16/349,923 patent/US10659745B2/en active Active
- 2018-02-26 EP EP23163831.3A patent/EP4220541A1/en active Pending
- 2018-02-26 US US16/349,931 patent/US10742945B2/en active Active
- 2018-02-26 EP EP18857102.0A patent/EP3684063B1/en active Active
- 2018-02-26 EP EP18855339.0A patent/EP3684061B1/en active Active
- 2018-02-26 JP JP2019510373A patent/JP6709986B2/ja active Active
- 2018-02-26 JP JP2019505008A patent/JP6697755B2/ja active Active
- 2018-02-26 WO PCT/JP2018/006864 patent/WO2019053916A1/ja not_active Ceased
-
2020
- 2020-04-07 US US16/842,250 patent/US11228747B2/en active Active
Patent Citations (5)
| Publication number | Priority date | Publication date | Assignee | Title |
|---|---|---|---|---|
| JP2000035774A (ja) * | 1998-07-17 | 2000-02-02 | Fujitsu Ltd | 表示装置 |
| JP2017184249A (ja) | 2014-06-26 | 2017-10-05 | パナソニックIpマネジメント株式会社 | 表示装置、表示方法及びコンピュータプログラム |
| WO2016027423A1 (ja) * | 2014-08-19 | 2016-02-25 | パナソニックIpマネジメント株式会社 | 伝送方法、再生方法及び再生装置 |
| US20160360171A1 (en) * | 2015-06-02 | 2016-12-08 | Samsung Electronics Co., Ltd. | Distribution-point-based adaptive tone mapping |
| WO2017089146A1 (en) * | 2015-11-24 | 2017-06-01 | Koninklijke Philips N.V. | Handling multiple hdr image sources |
Non-Patent Citations (2)
| Title |
|---|
| "White Paper Blu-ray Disc Read-Only Format (Ultra HD Blu-ray", AUDIO VISUAL APPLICATION FORMAT SPECIFICATIONS FOR BD-ROM VERSION 3.1, August 2016 (2016-08-01), Retrieved from the Internet <URL:httpV/www.blu-raydisc.com/Assets/Downloadablefile/BD-ROM_Part3_V3.1_WhitePaper_160729_clean.pdf> |
| See also references of EP3684063A4 |
Also Published As
| Publication number | Publication date |
|---|---|
| EP3684063B1 (en) | 2023-05-03 |
| US10742945B2 (en) | 2020-08-11 |
| WO2019053916A1 (ja) | 2019-03-21 |
| JP6697755B2 (ja) | 2020-05-27 |
| JP6709986B2 (ja) | 2020-06-17 |
| EP3684063A1 (en) | 2020-07-22 |
| EP3684061B1 (en) | 2021-07-07 |
| EP3684061A4 (en) | 2020-07-22 |
| US20190335149A1 (en) | 2019-10-31 |
| EP4220541A1 (en) | 2023-08-02 |
| US20190342603A1 (en) | 2019-11-07 |
| US11228747B2 (en) | 2022-01-18 |
| US20200236334A1 (en) | 2020-07-23 |
| JPWO2019053916A1 (ja) | 2019-11-07 |
| EP3684063A4 (en) | 2020-07-22 |
| JPWO2019053917A1 (ja) | 2019-11-07 |
| US10659745B2 (en) | 2020-05-19 |
| EP3684061A1 (en) | 2020-07-22 |
Similar Documents
| Publication | Publication Date | Title |
|---|---|---|
| JP6709986B2 (ja) | 輝度特性生成方法 | |
| US11245868B2 (en) | Display system, display method, and display apparatus | |
| US10984510B2 (en) | Video display apparatus and video display method for luminance conversion | |
| CN110545413A (zh) | 用于执行高动态范围视频的色调映射的方法及装置 | |
| US11032448B2 (en) | Video display system and video display method | |
| JP6767629B2 (ja) | 信号処理装置、録画再生装置、信号処理方法、およびプログラム | |
| WO2019044171A1 (ja) | 映像処理装置、表示装置、映像処理方法、制御プログラム、および記録媒体 |
Legal Events
| Date | Code | Title | Description |
|---|---|---|---|
| ENP | Entry into the national phase |
Ref document number: 2019510373 Country of ref document: JP Kind code of ref document: A |
|
| 121 | Ep: the epo has been informed by wipo that ep was designated in this application |
Ref document number: 18857102 Country of ref document: EP Kind code of ref document: A1 |
|
| NENP | Non-entry into the national phase |
Ref country code: DE |
|
| ENP | Entry into the national phase |
Ref document number: 2018857102 Country of ref document: EP Effective date: 20200414 |