WO2019176925A1 - 産地推定方法 - Google Patents
産地推定方法 Download PDFInfo
- Publication number
- WO2019176925A1 WO2019176925A1 PCT/JP2019/009952 JP2019009952W WO2019176925A1 WO 2019176925 A1 WO2019176925 A1 WO 2019176925A1 JP 2019009952 W JP2019009952 W JP 2019009952W WO 2019176925 A1 WO2019176925 A1 WO 2019176925A1
- Authority
- WO
- WIPO (PCT)
- Prior art keywords
- stable isotope
- isotope ratio
- measured
- animal
- production area
- Prior art date
- Legal status (The legal status is an assumption and is not a legal conclusion. Google has not performed a legal analysis and makes no representation as to the accuracy of the status listed.)
- Ceased
Links
Images








Classifications
-
- G—PHYSICS
- G01—MEASURING; TESTING
- G01N—INVESTIGATING OR ANALYSING MATERIALS BY DETERMINING THEIR CHEMICAL OR PHYSICAL PROPERTIES
- G01N21/00—Investigating or analysing materials by the use of optical means, i.e. using sub-millimetre waves, infrared, visible or ultraviolet light
- G01N21/17—Systems in which incident light is modified in accordance with the properties of the material investigated
- G01N21/25—Colour; Spectral properties, i.e. comparison of effect of material on the light at two or more different wavelengths or wavelength bands
- G01N21/31—Investigating relative effect of material at wavelengths characteristic of specific elements or molecules, e.g. atomic absorption spectrometry
- G01N21/39—Investigating relative effect of material at wavelengths characteristic of specific elements or molecules, e.g. atomic absorption spectrometry using tunable lasers
-
- G—PHYSICS
- G01—MEASURING; TESTING
- G01N—INVESTIGATING OR ANALYSING MATERIALS BY DETERMINING THEIR CHEMICAL OR PHYSICAL PROPERTIES
- G01N21/00—Investigating or analysing materials by the use of optical means, i.e. using sub-millimetre waves, infrared, visible or ultraviolet light
- G01N21/62—Systems in which the material investigated is excited whereby it emits light or causes a change in wavelength of the incident light
- G01N21/71—Systems in which the material investigated is excited whereby it emits light or causes a change in wavelength of the incident light thermally excited
- G01N21/718—Laser microanalysis, i.e. with formation of sample plasma
-
- G—PHYSICS
- G01—MEASURING; TESTING
- G01N—INVESTIGATING OR ANALYSING MATERIALS BY DETERMINING THEIR CHEMICAL OR PHYSICAL PROPERTIES
- G01N1/00—Sampling; Preparing specimens for investigation
- G01N1/28—Preparing specimens for investigation including physical details of (bio-)chemical methods covered elsewhere, e.g. G01N33/50, C12Q
- G01N1/44—Sample treatment involving radiation, e.g. heat
-
- G—PHYSICS
- G01—MEASURING; TESTING
- G01N—INVESTIGATING OR ANALYSING MATERIALS BY DETERMINING THEIR CHEMICAL OR PHYSICAL PROPERTIES
- G01N21/00—Investigating or analysing materials by the use of optical means, i.e. using sub-millimetre waves, infrared, visible or ultraviolet light
- G01N21/17—Systems in which incident light is modified in accordance with the properties of the material investigated
- G01N21/25—Colour; Spectral properties, i.e. comparison of effect of material on the light at two or more different wavelengths or wavelength bands
- G01N21/31—Investigating relative effect of material at wavelengths characteristic of specific elements or molecules, e.g. atomic absorption spectrometry
- G01N21/35—Investigating relative effect of material at wavelengths characteristic of specific elements or molecules, e.g. atomic absorption spectrometry using infrared light
- G01N21/3504—Investigating relative effect of material at wavelengths characteristic of specific elements or molecules, e.g. atomic absorption spectrometry using infrared light for analysing gases, e.g. multi-gas analysis
-
- G—PHYSICS
- G01—MEASURING; TESTING
- G01N—INVESTIGATING OR ANALYSING MATERIALS BY DETERMINING THEIR CHEMICAL OR PHYSICAL PROPERTIES
- G01N33/00—Investigating or analysing materials by specific methods not covered by groups G01N1/00 - G01N31/00
- G01N33/48—Biological material, e.g. blood, urine; Haemocytometers
- G01N33/483—Physical analysis of biological material
- G01N33/4833—Physical analysis of biological material of solid biological material, e.g. tissue samples, cell cultures
-
- G—PHYSICS
- G01—MEASURING; TESTING
- G01N—INVESTIGATING OR ANALYSING MATERIALS BY DETERMINING THEIR CHEMICAL OR PHYSICAL PROPERTIES
- G01N21/00—Investigating or analysing materials by the use of optical means, i.e. using sub-millimetre waves, infrared, visible or ultraviolet light
- G01N21/17—Systems in which incident light is modified in accordance with the properties of the material investigated
- G01N21/25—Colour; Spectral properties, i.e. comparison of effect of material on the light at two or more different wavelengths or wavelength bands
- G01N21/31—Investigating relative effect of material at wavelengths characteristic of specific elements or molecules, e.g. atomic absorption spectrometry
- G01N21/35—Investigating relative effect of material at wavelengths characteristic of specific elements or molecules, e.g. atomic absorption spectrometry using infrared light
- G01N21/3504—Investigating relative effect of material at wavelengths characteristic of specific elements or molecules, e.g. atomic absorption spectrometry using infrared light for analysing gases, e.g. multi-gas analysis
- G01N2021/354—Hygrometry of gases
-
- G—PHYSICS
- G01—MEASURING; TESTING
- G01N—INVESTIGATING OR ANALYSING MATERIALS BY DETERMINING THEIR CHEMICAL OR PHYSICAL PROPERTIES
- G01N2201/00—Features of devices classified in G01N21/00
- G01N2201/06—Illumination; Optics
- G01N2201/061—Sources
- G01N2201/06113—Coherent sources; lasers
Definitions
- the present invention relates to a production area estimation method for estimating the production area of an object to be measured collected from an animal.
- animal hair product As a product made from hair collected from animals.
- cashmere fibers collected from cashmere goats have unique and excellent properties and are traded at high prices.
- cashmere fibers collected from cashmere goats grown in specific brand areas such as Arazen and Chifeng districts in China are high-grade and are traded at particularly high prices.
- JIS L 1030 Fiber product mix rate test method
- stable isotope ratios of oxygen elements and hydrogen elements are used to estimate the production area of grains (see, for example, Patent Document 2, Non-Patent Documents 1 and 2).
- the stable isotope ratio of oxygen and hydrogen contained in precipitation (rainwater) is geographically dependent.
- the stable isotope ratios of oxygen and hydrogen that make up the crops grown using the rain that falls on the land as growth water also show the same geographical dependence as precipitation.
- the method using stable isotope ratio is limited to the estimation of the production area of grains. For this reason, at present, there is no method for easily estimating the production area of the object to be measured collected from animals such as animal hair.
- An object of the present invention is to provide a production area estimation method capable of easily estimating an object to be measured collected from an animal.
- the present invention provides a first step of measuring a stable isotope ratio of a carbon element contained in a measurement object collected from an animal, and a first step of measuring a stable isotope ratio of a constituent element of water contained in the measurement object. And a third step of estimating the area where the animal grew up from the measured stable isotope ratio of the carbon element and the measured stable isotope ratio of the constituent elements of water.
- the production area of the object to be measured can be easily estimated.
- FIG. 1 is a flowchart showing a procedure of a production area estimation method according to an embodiment of the present invention.
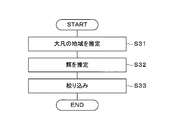
- FIG. 2 is a flowchart showing a detailed procedure of the estimation step.
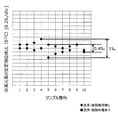
- FIG. 3 is a diagram showing a difference in solid isotope ratios of carbon elements contained in animal hair depending on solids, with and without pretreatment.
- FIG. 4 is a diagram showing the results of measuring the stable isotope ratio of carbon elements while changing the placement time of ethanol.
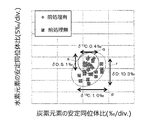
- FIG. 5 is a diagram showing measurement results regarding the stable isotope ratios of the carbon element and the hydrogen element when the pretreatment is performed and when the pretreatment is not performed.
- FIG. 6 is a diagram showing the influence of bait on the stable isotope ratio of carbon elements contained in animal hair.
- FIG. 1 is a flowchart showing a procedure of a production area estimation method according to an embodiment of the present invention.
- FIG. 2 is a flowchart showing a detailed procedure of the estimation step.
- FIG. 3 is
- FIG. 7 is a diagram showing the difference in the stable isotope ratio of oxygen element and the stable isotope ratio of hydrogen element contained in precipitation depending on the collection site.
- FIG. 8 is a diagram showing the relationship between the stable isotope ratio of the hydrogen element contained in precipitation and the latitude of the sampling site.
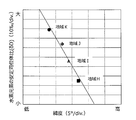
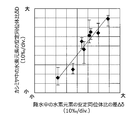
- FIG. 9 is a diagram showing the relationship between the stable isotope ratio of the hydrogen element contained in animal hair and the latitude of the collection site (production area).
- FIG. 10 shows the difference ⁇ between the stable isotope ratio of the hydrogen element contained in the precipitation at the reference point and the stable isotope ratio of the hydrogen element contained in the precipitation at the estimation target area, and the cashmere goat growing in the estimation target area.
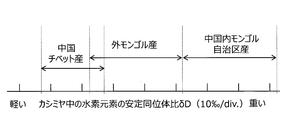
- FIG. 11 is a diagram showing the relationship between the stable isotope ratio of the hydrogen element contained in cashmere and the production area.
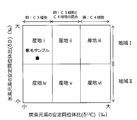
- FIG. 12 is a diagram for explaining a procedure for estimating the collection site (production area) from the stable isotope ratio of hydrogen element and the stable isotope ratio of carbon element contained in animal hair.
- FIG. 13 is a flowchart showing a procedure for estimating the collection site (production area) from the stable isotope ratio of hydrogen element and the stable isotope ratio of carbon element contained in animal hair.
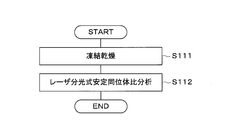
- FIG. 14 is a flowchart showing a detailed procedure for measuring a stable isotope ratio of a hydrogen element contained in animal hair.
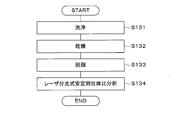
- FIG. 15 is a flowchart showing a detailed procedure for measuring a stable isotope ratio of a carbon element contained in animal hair.
- FIG. 16 is a diagram illustrating the relationship between the stable isotope ratio of carbon elements contained in animal hair, the stable isotope ratio of hydrogen elements, and the collection location (production area).
- FIG. 17 is a diagram illustrating the relationship between the stable isotope ratio of the hydrogen element and the stable isotope ratio of the carbon element contained in the cashmere and the collection place (production area).
- FIG. 18 is a block diagram showing the configuration of the production area estimator.
- the production area estimation method is to estimate a region where an animal has grown from a stable isotope ratio of a carbon element and a water constituent element contained in an object collected from the animal. It is a feature.
- this locality estimation method includes step S ⁇ b> 1 for measuring the stable isotope ratio of the carbon element contained in the measurement object, and the stability of the constituent elements of water contained in the measurement object Estimate the region where the animal from which the object was collected grew from the step S2 of measuring the isotope ratio and the stable isotope ratio of the measured carbon element and the measured stable isotope ratio of the constituent elements of water.
- the constituent element of water is a hydrogen element or an oxygen element.
- the stable isotope ratio of either hydrogen element or oxygen element may be measured.
- estimation may be performed using the measured stable isotope ratio of either hydrogen or oxygen.
- the stable isotope ratio of the constituent elements of water contained in the sample collected from animals depends on the stable isotope ratio of the constituent elements of water ingested by the animals. became.
- the water that animals consume is due to precipitation in each region.
- the stable isotope ratio of water constituent elements contained in precipitation is region-dependent. Therefore, the stable isotope ratio of the constituent elements of the water contained in the measurement object collected from the animal shows region dependence. Therefore, it has been found from the research of the inventor of the present invention that the region where the animal grows can be narrowed down from the value of the stable isotope ratio of the constituent elements of water for the object collected from the animal.
- the stable isotope ratio of the carbon element contained in the measurement object collected from the animal depends on the type of plant that the animal eats.
- the inventor has paid attention to the fact that the plants and food that the animals eat differ depending on the region where the animals grow. In other words, it was found that by estimating the plant type from the stable isotope ratio of the carbon element, it was possible to narrow down the growing area of the animals eating the plant from the distribution of the habitat of the plant.
- step S3 for estimating the growth area of the animal can be executed according to the procedure shown in FIG.
- an approximate region where an animal has grown is estimated from the stable isotope ratio of the constituent elements of water measured in step S2 (step S31).
- the bait used for animal growth is estimated from the stable isotope ratio of the carbon element measured in step S1 (step S32). From the approximate areas estimated in step S31, the areas where the food estimated in step S32 is used are narrowed down, and the narrowed areas are estimated as areas where the animals grew (step S33).
- the stable isotope ratios of the carbon element and the constituent elements of water in steps S1 and S2 From these measurement results, it is possible to immediately obtain the estimation result of the animal growing area.
- the estimation method using this database is substantially the same as the estimation method in steps S31 to S33.
- step S1 for measuring the stable isotope ratio of the carbon element and step S2 for measuring the stable isotope ratio of the constituent elements of water may be executed in the order of step S1 and step S2, or vice versa. Alternatively, it may be executed in the order of step S2 and step S1. If possible, step S1 and step S2 may be performed simultaneously to measure the stable isotope ratio of the carbon element and the stable isotope ratio of the hydrogen element in parallel.
- stable isotope ratio the ratio of naturally occurring non-radioactive isotopes is used.
- the ratio of 12 C to 13 C is used as the stable isotope ratio of the carbon element.
- a ratio of 1 H to D ( 2 H) is used as the stable isotope ratio of hydrogen element.
- these stable isotope ratios are not usually expressed as absolute ratios but are expressed as ⁇ values as deviations from the isotope ratio of the standard sample.
- the stable isotope ratio of the carbon element can be represented by the following formula (1) as ⁇ 13 C.
- the stable isotope ratio of the hydrogen element can be expressed by the following formula (2) as ⁇ D.
- SAMP indicates the isotope ratio in the analysis sample
- STD indicates the isotope ratio in the standard sample.
- stable isotope ratio of hydrogen element it is usually expressed using standard mean seawater (Vienna Standard Sea Mean Ocean Water: VSMOW).
- VSMOW Standard Sea Mean Ocean Water
- stable isotope ratio of the carbon element it is usually expressed by using a fossil (Vienna Pee Dee Belemnite: VPDB) of the peedee layer.
- carbon dioxide gas is generated by burning 10 animal hair samples.
- the generated carbon dioxide gas is irradiated with laser light.
- the stable isotope ratio of the carbon element is measured by measuring and analyzing the amount of absorption (light absorption intensity) of the laser beam by laser spectroscopy.
- Measured values obtained in this way are stable isotope ratios for all carbon elements contained in organic matter (keratin) constituting animal hair and dirt attached to animal hair.
- the measurement results are indicated by diamond points in FIG.
- the difference in stable isotope ratio of the carbon element of animal hair of sample numbers 1 to 10 was 1 ⁇ at the maximum.
- pretreatment is performed to remove dirt such as sebum oil and dandruff from the 10 animal hair samples.
- 10 animal hair samples are washed with any neutral detergent. Dry 10 washed animal hair samples.
- Degrease treatment is performed by placing 10 samples of dried animal hair in ethanol for 10 minutes. The degreased sample is analyzed for stable isotope ratio of carbon element by laser spectroscopic stable isotope ratio analysis.
- FIG. 4 shows the results of measuring the stable isotope ratio of the carbon element while changing the time for placing the ethanol.
- Increasing the placement time of ethanol reduces the variation in individual stable isotope ratios of carbon elements, and the variation is constant over 10 minutes. Therefore, if the setting time of ethanol is 10 minutes or more, the carbon element contained in the dirt adhering to the animal hair is completely removed, and only the carbon element contained in the organic matter constituting the animal hair is a stable isotope. The ratio can be measured.
- the stable isotope ratio of hydrogen element can be analyzed by the laser spectroscopic stable isotope ratio analysis method as well as the stable isotope ratio of carbon element.
- the animal hair samples absorb hydrogen atoms contained in the surrounding environment as moisture. It will change.
- the wash water containing the neutral detergent used to wash the animal hair sample is absorbed into the animal hair sample, which may affect the measurement results of the stable isotope ratio of the hydrogen element in the animal hair sample. There is. This makes it difficult to estimate the locality by comparing stable isotope ratios of hydrogen elements. Therefore, by evaporating and removing moisture from the animal hair sample by freeze-drying, only the stable isotope ratio of the hydrogen element contained in the organic matter constituting the animal hair sample can be measured.
- FIG. 5 shows the measurement results regarding the stable isotope ratios of the carbon element and the hydrogen element when the pretreatment is performed and when the pretreatment is not performed.
- the animal hair sample was degreased with ethanol for 10 minutes, and then freeze-dried for 6 hours under conditions of a temperature of ⁇ 50 ° C. and a vacuum of 8 Pa.
- diamond-shaped points indicate measurement results with pre-processing
- rectangular points indicate measurement results without pre-processing.
- the degreasing treatment reduced the variation in individual stable isotope ratios of carbon elements from 1 ⁇ to 0.4 ⁇ .
- the freeze-drying process reduced the variation in stable isotope ratio of hydrogen element due to individual differences from 10.3 ⁇ to 5.1 ⁇ .
- Animal feed sample A that is fed and grown with grass classified as C3 plants, feed that consists of plants classified as C4 plants such as corn, and grass that is classified as C3 plants
- the animal hair sample C of the animal currently grown is prepared using the animal hair sample B of the grown animal and the plant classified into C4 plants such as corn.
- the stable isotope ratio of carbon element is sample A, sample B, and sample C in order of increasing values.
- the difference in carbon element stable isotope ratio between sample A and sample B is 5 ⁇
- the difference in carbon element stable isotope ratio between sample B and sample C is 3 ⁇ .
- the stable isotope ratio of the carbon element of the C3 plant is smaller than the stable isotope ratio of the carbon element of the C4 plant.
- the stable isotope ratio of the carbon element of the animal hair sample A of the animal feeding on the C3 plant is smaller than the stable isotope ratio of the carbon element of the animal hair sample C of the animal feeding on the C4 plant.
- the stable isotope ratio of the carbon element of the animal hair sample B of the animal which uses both the C3 plant and the C4 plant as a staple food takes the value between the sample A and the sample C. From these, it can be seen that there is a correlation between the type of food and the stable isotope ratio of the carbon element of animal hair. From this correlation, by estimating the stable isotope ratio of the carbon element contained in the measurement object (animal hair), it is possible to estimate the food that the animal from which the measurement object (animal hair) was collected is eating It becomes possible.
- the stable isotope ratio of the carbon element contained in the animal hairs of the animals growing on the C3 plant was -21 ⁇ or less (range a), and the mixed feed of the C3 plant and the C4 plant
- the stable isotope ratio of the carbon element contained in the animal hair of animals growing in the region is -21 ⁇ to -16 ⁇ (range b), and is contained in the animal hair of animals growing on C4 plants such as corn. It was found that the stable isotope ratio of the carbon element was -16 ⁇ or more (range c).
- the water samples D to G in the regions D to G are on this straight line.
- Figure 8 shows the relationship between the stable isotope ratio of hydrogen and latitude. The higher the latitude, the smaller the stable isotope ratio of the hydrogen element. In the region D to the region G, when the latitude becomes higher, the stable isotope ratio of the hydrogen element in the precipitation is reduced by 2.8 ⁇ .
- animal hair sample H grown in region H animal hair sample I grown in region I
- animal hair sample J grown in region J animal hair sample K of the grown animal is prepared.
- the stable isotope ratio of hydrogen element is measured by a laser spectroscopic stable isotope ratio analysis method.
- FIG. 9 shows the relationship between the measurement result of the stable isotope ratio of the hydrogen element contained in the animal hair sample and the latitude of the growing region of the animal from which the animal hair sample was collected. It can be seen that the higher the latitude of the growing region, the smaller the stable isotope ratio of the hydrogen element contained in the animal hair, and a correlation is seen between the two.
- ⁇ A ( ⁇ ) ⁇ b ⁇ ⁇ Y (3)
- ⁇ Y the latitude difference (°)
- b a constant.
- the constant b is in the range of 2.8 to 4.4 as a value suitable for estimating the cashmere production area.
- ⁇ B ( ⁇ ) ⁇ 0.0065 ⁇ c ⁇ ⁇ Z (4)
- ⁇ Z is the altitude difference (m)
- c is a constant.
- the constant c is set to 3.1.
- Equation (5) indicates that the stable isotope ratio of hydrogen elements contained in precipitation differs from the reference point by ⁇ at a point where the latitude differs from the reference point (arbitrary point) by ⁇ Y and the altitude by ⁇ Z. .
- the reference point is 0 degree latitude and the altitude is 0 degree. From the latitude and altitude of the collected animal hair sample area (the area where the cashmere goats grew), it is included in the precipitation at the reference point using the above formula (5) The difference ⁇ between the stable isotope ratio of the hydrogen element and the stable isotope ratio of the hydrogen element contained in the precipitation of the collected animal hair sample is obtained. The calculation of the difference ⁇ is performed for all animal hair production regions (the plurality of regions) in which the stable isotope ratio of the hydrogen element has been measured.
- a graph is created with ⁇ D on the vertical axis (see FIG. 10). Then, by the least square method, the difference ⁇ in the stable isotope ratio of the hydrogen element contained in the precipitation between the reference point and the animal hair sample production area, that is, the animal from which the reference point and the animal sample were collected grew.
- Estimated areas Difference in stable isotope ratios of hydrogen elements in precipitation between regions that may be present (hereinafter referred to as “estimated areas”) and the amount of hydrogen elements in animal hair samples Equation (6) showing the relationship with the stable isotope ratio ⁇ D is derived.
- ⁇ D ⁇ ⁇ ⁇ + ⁇ (6)
- ⁇ and ⁇ are constants.
- Equation (7) ⁇ ⁇ ( ⁇ b ⁇ ⁇ Y ⁇ 0.0065 ⁇ c ⁇ ⁇ Z) + ⁇ (7)
- ⁇ D is a function of latitude ( ⁇ Y) and altitude ( ⁇ Z).
- Non-Patent Document 8 the value of ⁇ corresponding to the altitude, latitude, and longitude of the above region was referred to.
- the stable isotope ratio of hydrogen elements in precipitation collected in the cashmere goat growing area was actually measured, and the ⁇ and ⁇ values in equation (6) were calculated by the least squares method. Also good.
- the object to be measured may be produced in Akamine, and if it is out of the range, the object to be measured is produced in Akamine. It is determined that there is no possibility.
- the latitude ( ⁇ Y) and altitude ( ⁇ Z) of each country or region are substituted into Equation (7), and the hydrogen contained in cashmere
- the range of possible values of the stable isotope ratio ⁇ D of the element is calculated.
- the range of the stable isotope ratio ⁇ D of the hydrogen element contained in the cashmere is obtained for each production area.
- the stable isotope ratio ⁇ D of the hydrogen element contained in cashmere becomes heavier (larger) in order from light (small) to Chinese matters, Outer Mongolia, and Inner Mongolia Autonomous Region.
- the stable isotope ratio ⁇ D of the hydrogen element contained in the object to be measured (cashmere) is measured, and the range of the measured stable isotope ratio ⁇ D in FIG. Can be estimated.
- the ⁇ value and ⁇ value in equation (6) can be obtained from the precipitation (growth water) collected in the cashmere goat growing area and the stable isotope ratio of the hydrogen element contained in each cashmere. is there.
- the range of the stable isotope ratio ⁇ D of the hydrogen element contained in cashmere can be obtained for each production area by using the equation (6) in which the ⁇ value and the ⁇ value are set instead of the equation (7). For this reason, it is possible to estimate the production area by measuring the stable isotope ratio ⁇ D of the hydrogen element contained in the object to be measured (cashmere) and collating the measurement result with the range obtained by equation (6). It is.
- the stable isotope ratio of the hydrogen element contained in the animal hair sample is measured (step S101 in FIG. 13). More specifically, the animal hair sample is freeze-dried (step S111 in FIG. 14). The stable isotope ratio of the hydrogen element contained in the freeze-dried animal hair sample is measured by a laser spectroscopic stable isotope ratio analysis method (step S112 in FIG. 14).
- an approximate region where the animal from which the animal hair sample was collected grew is estimated (step S102 in FIG. 13).
- an arbitrary animal hair sample is classified as animal hair grown in a plurality of regions depending on the range of stable isotope ratios of hydrogen elements. For example, as shown in FIG. 12, animal hair sample production areas are classified into five regions with a stable isotope ratio of hydrogen elements every 20 ⁇ .
- the stable isotope ratio of the hydrogen element is -20 to -40 ⁇ , it is region I, when it is -40 to -60 ⁇ , region II, when it is -60 to -80 ⁇ , region III, -80 to -100 ⁇ In the case of the region IV, and in the case of ⁇ 100 to ⁇ 120 ⁇ , the region V. If the stable isotope ratio of the hydrogen element of the animal hair sample is -100 ⁇ , it is estimated that the sample was collected in Region IV.
- the stable isotope ratio of the carbon element contained in the animal hair sample is measured (step S103 in FIG. 13). More specifically, first, the animal hair sample is washed with a neutral detergent (step S131 in FIG. 15). The washed animal hair sample is dried (step S132 in FIG. 15). The dried animal hair sample is immersed in ethanol and degreased (step S133 in FIG. 15). For the degreased sample, the stable isotope ratio of the carbon element is analyzed by a laser spectroscopic stable isotope ratio analysis method (step S134 in FIG. 15).
- the type of food of the animal from which the animal hair sample was collected is estimated (step S104 in FIG. 13).
- the bait is estimated to be a C3 plant, a C4 plant, or a mixed bait of a C3 plant and a C4 plant.
- the area where the food estimated in step S104 is used is narrowed down from the approximate areas estimated in step S102, and the narrowed area is estimated as the area where the animal from which the animal hair sample was collected grew (FIG. 13 step S105).
- the habitat is estimated to be region I from the stable isotope ratio of the hydrogen element, and further, the food is estimated to be a C3 plant
- the animal is raised in the region I using the grass of the C3 plant as food.
- the area is narrowed down to i.
- the area (production area) where the animal from which the animal hair sample was collected grew is estimated in a narrower unit, and the accuracy of the production area estimation is increased.
- FIG. 16 illustrates the relationship between the stable isotope ratio of carbon elements contained in animal hair, the stable isotope ratio of hydrogen elements, and the collection site (production area).
- the measurement result of the stable isotope ratio of the hydrogen element of the animal hair sample is within the range of the stable isotope ratio of the hydrogen element of the animal hair grown in region I. It was included. For this reason, this area I is estimated to be a general area where the animal from which the animal hair sample was collected grew.
- the measurement result of the stable isotope ratio of the carbon element was included in the range of the stable isotope ratio of the carbon element of the animal hair grown on the diet C3. For this reason, the area where the animal from which the animal hair sample was collected grew is narrowed down to the production area i.
- FIG. 17 exemplifies the relationship between the stable isotope ratio of carbon elements contained in cashmere, the stable isotope ratio of hydrogen elements, and the collection site (production area).
- the range of stable isotope ratios of hydrogen elements in cashmere from Kyrgyzstan (Kyrgyz region) overlaps with the range of stable isotope ratios of hydrogen elements in cashmere from Inner Mongolia Autonomous Region of China (region of Inner Mongolia Autonomous Region of China).
- the value of the stable isotope ratio of the carbon element contained in cashmere is used to determine whether it is from Inner Mongolia Autonomous Region or Kyrgyz.
- cashmere goats growing in Kyrgyz are mainly affected by the C3 plant, and thus are affected by the stable isotope ratio of the carbon element of the C3 plant.
- cashmere goats that grow in the Inner Mongolia Autonomous Region of China are fed by both C3 and C4 plants, and are therefore affected by the stable isotope ratio of carbon elements between C3 and C4 plants. This makes it possible to determine whether the product is from Inner Mongolia Autonomous Region or Kyrgyz from the value of stable isotope ratio of carbon elements contained in cashmere.
- the stable isotope ratio of the carbon element and the stable isotope ratio of the hydrogen element are measured for a plurality of animal hair samples whose production areas are known in advance, and the carbon as shown in FIG. Prepare a table showing the relationship between the stable isotope ratio of the element, the stable isotope ratio of the hydrogen element, and the sampling location (production area). Then, for animal hair whose origin is unknown, the stable isotope ratio of carbon element and the stable isotope ratio of hydrogen element are measured, and the measurement results are applied to a table such as FIG. 16 or FIG. Estimate the area (origin) where the collected animals grew up.
- FIG. 7 shows that the stable isotope ratio of the hydrogen element in precipitation and the stable isotope ratio of the oxygen element are in a proportional relationship. Since the stable isotope ratio of the hydrogen element of animal hair correlates with the water (precipitation) ingested by the animal that owns the animal hair, the stable isotope ratio of the oxygen element of animal hair is also the area where the animal grew There is a correlation with the stable isotope ratio of oxygen element in precipitation. Therefore, the habitat of the animal can be estimated from the stable isotope ratio of the oxygen element as well as the stable isotope ratio of the hydrogen element of animal hair.
- Examples of stable isotope ratio analysis methods include isotope ratio mass spectrometry (IRMS) and nuclear magnetic resonance spectroscopy (NMR).
- IRMS isotope ratio mass spectrometry
- NMR nuclear magnetic resonance spectroscopy
- a laser spectroscopic stable isotope ratio analyzer can be used for measuring the stable isotope ratio of oxygen element, the stable isotope ratio of hydrogen element, and the stable isotope ratio of carbon element.
- a laser spectroscopic stable isotope ratio analyzer carbon dioxide gas and water vapor generated by burning an object to be measured are irradiated with laser light, and the amount of absorption of the laser light is analyzed to be included in the object to be measured.
- the stable isotope ratio of oxygen element, hydrogen element, and carbon element can be easily analyzed (see, for example, Non-Patent Document 5).
- the laser spectroscopic stable isotope ratio analyzer is cheaper, smaller, and easier to operate than isotope ratio mass spectrometry and nuclear magnetic resonance spectroscopy instruments. Further, chemical pretreatment necessary for stable isotope ratio analysis by mass spectrometry is not required, and the production area can be estimated in a short time (for example, within one hour). Therefore, time and cost can be reduced by using a laser spectroscopic stable isotope ratio analyzer.
- the laser spectroscopic stable isotope ratio analyzer may be used only for either the measurement of the stable isotope ratio of oxygen element / hydrogen element or the measurement of the stable isotope ratio of carbon element.
- the production area display of any animal hair is correct using equation (8) Can be determined.
- the stable isotope ratio (Y) of the hydrogen element of any animal hair is examined. The value (Y) is substituted into equation (8) to obtain latitude (X). If the obtained latitude (X) matches the latitude value of the production area display, it can be determined that the production area display is correct.
- the above-mentioned production area estimation method can also be implemented using a computer.
- the computer 10 includes a CPU 11, a memory 12, and input / output interfaces (I / F) 13 and 14. These circuits are connected to each other by a bus 15.
- a laser spectroscopic stable isotope ratio analyzer 20 is connected to the input / output interface 13.
- the measurement result about the stable isotope ratio of hydrogen element or oxygen element contained in the measurement object (animal hair) and the measurement result about the stable isotope ratio of carbon element are obtained from the laser spectroscopic stable isotope ratio analyzer 20.
- the data are sequentially output to the computer 10.
- the operator may manually input the measurement result to the computer 10.
- a monitor 30 is connected to the input / output interface 14.
- the memory 12 stores a program necessary for executing step S3 in FIG. 1, steps S31 to S33 in FIG. 2, or steps S102, S104, and S105 in FIG.
- the CPU 11 operates in accordance with a program recorded in the memory 12, and estimates the area where the animal from which the object to be measured was grown grew from the measurement results of the stable isotope ratios of various elements. It may be determined whether or not the display of the measurement object is correct.
- the CPU 11 displays these estimation results on the monitor 30.
- step S111 and S131 to 133 when measuring the stable isotope ratio of the hydrogen element and the carbon element, by performing pre-processing (steps S111 and S131 to 133), more accurate measurement results can be obtained. It is possible to estimate the production area with high accuracy. However, in the case where a rough estimation result is obtained, the preprocessing may be omitted.
- the production area of animal hair, particularly cashmere hair, is estimated as an object to be measured has been described.
- the present invention can also be used for estimating the production area of wool, for example.
Landscapes
- Physics & Mathematics (AREA)
- Health & Medical Sciences (AREA)
- Life Sciences & Earth Sciences (AREA)
- Chemical & Material Sciences (AREA)
- Engineering & Computer Science (AREA)
- Immunology (AREA)
- General Physics & Mathematics (AREA)
- Pathology (AREA)
- Analytical Chemistry (AREA)
- Biochemistry (AREA)
- General Health & Medical Sciences (AREA)
- Spectroscopy & Molecular Physics (AREA)
- Biomedical Technology (AREA)
- Optics & Photonics (AREA)
- Biophysics (AREA)
- Hematology (AREA)
- Molecular Biology (AREA)
- Urology & Nephrology (AREA)
- Food Science & Technology (AREA)
- Medicinal Chemistry (AREA)
- Plasma & Fusion (AREA)
- Nuclear Medicine, Radiotherapy & Molecular Imaging (AREA)
- Investigating Or Analysing Materials By Optical Means (AREA)
- Other Investigation Or Analysis Of Materials By Electrical Means (AREA)
Abstract
動物から採取された被測定物に含まれる炭素元素の安定同位体比と水素元素の安定同位体比を測定する(S1,S2)。測定された炭素元素の安定同位体比と水素元素の安定同位体比から、動物が育った地域を推定する(S3)。これにより、被測定物の産地を容易に推定することができる。
Description
本発明は、動物から採取された被測定物の産地を推定する産地推定方法に関する。
動物から採取された毛を素材とする製品として獣毛製品がある。獣毛製品の中でもカシミヤ山羊から採取されるカシミヤ繊維は、特有の優れた性質を持ち、高値で取引されている。その中でも、中国内の阿拉善地区および赤峰地区など、特定のブランド地域で育ったカシミヤ山羊から採取されるカシミヤ繊維は高級であり、特に高額な値で取引されている。
しかし、最近では、これら特定のブランド地域以外の産地で採取されるカシミヤ繊維を原料とした衣類等が、ブランド地域で育ったカシミヤ山羊から採取されたカシミヤ繊維で作ったような表示をしている産地偽装が発生しており、問題となっている。このようなカシミヤ繊維の産地偽装抑止のために、科学的な産地判定法が望まれている。
現在、衣料品に係る表示に関して、繊維鑑別や繊維混用率の試験方法として、日本工業規格「JIS L 1030(繊維製品の混用率試験方法)」により、光学顕微鏡法を用いた試験方法が規定されている。光学顕微鏡法では、毛の外観を鑑別の手がかりとしている。カシミヤ山羊とその他の動物の毛の繊維表面は違うため、光学顕微鏡法は有用である。しかし、同じカシミヤ山羊では外観がよく似ており、産地の鑑定は困難である。
近年、DNAによる鑑別法や、獣毛の主たる成分であるタンパク質を直接分析することによって獣毛の種類を特定する方法も提案されている(例えば、特許文献1参照)。しかし、両手法とも動物の種の違いは識別できるが、同じ種でも生育した地域の違うカシミヤ山羊に対して、生育地域の違いを識別し、生育地域を特定することは不可能である。
産地を推定する手法として、対象となるものを構成する元素の安定同位体比を利用する技術が報告されている。例えば、穀物の産地を推定するのに、酸素元素や水素元素の安定同位体比が利用される(例えば、特許文献2、非特許文献1,2参照)。降水(雨水)に含まれる酸素元素や水素元素の安定同位体比には地理的依存性がある。その土地に降った雨を生育水として育った農作物を構成する酸素元素や水素元素の安定同位体比も、降水と同様な地理的依存性を示す。
一方、羽毛に関して、窒素元素や炭素元素の安定同位体比と食性の関連性が高いことを示した研究がある(例えば、非特許文献3参照)。また、ツキノワグマに関して、任意の期間毎に、餌をC4植物であるトウモロコシとC3植物である大麦に変え、その時期に生えた体毛に含まれる炭素元素の安定同位体比を調べることで、炭素元素の安定同位体比と食性の関連性が高いことを示した研究もある(例えば、非特許文献4参照)。しかし、いずれの研究においても、炭素元素の安定同位体比と産地との関連性を示す結果は得られていない。
したがって、現在のところ、安定同位体比を利用する手法は、穀物の産地推定にとどまっている。このため、獣毛など動物から採取された被測定物の産地を容易に推定する方法がないのが現状である。
鈴木・中下・伊永:"安定同位体比分析による国産米の産地及び有機栽培判別の可能性,"分析化学,Vol.58,No.12,pp.1053-1058,2009.
吉村・神徳・藤井・阪本・界:"高感度レーザガスセンシング技術と同位体比分析応用,"NTT技術ジャーナル,Vol.26,No.2,pp.27-30,2014.
松原、南:"鳥類生態学における安定同位体測定法の応用,"山階鳥研報,vol.30,pp.59-82,1998.
中下、林:"窒素・炭素安定同位体を用いたツキノワグマ「駆除」個体の生息環境履歴の解明,"プロ・ナトゥーラ・ファンド第14期 助成成果報告書,pp.113-120,2005.
「Picarro製品説明資料」、〔平成30年10月3日検索〕、インターネット<URL:http://www.bristol.ac.uk/media-library/sites/cabot/migrated/documents/measuring-co2-1.pdf>
芳村圭:"水の安定同位体比情報を用いた広域大気水循環過程の解明に関する研究," 東京大学大学院博士論文,2002.
芳村圭, 一柳錦平, 杉本敦子, 2009: 日本気象学会, 気象研究ノート第220号
「Waterisotopes.org」、〔平成30年10月3日検索〕、インターネット<URL:http://wateriso.utah.edu/waterisotopes/pages/data_access/oipc.html>
本発明の目的は、動物から採取された被測定物を容易に推定することが可能な産地推定方法を提供することにある。
本発明は、動物から採取された被測定物に含まれる炭素元素の安定同位体比を測定する第1のステップと、被測定物に含まれる水の構成元素の安定同位体比を測定する第2のステップと、測定された炭素元素の安定同位体比と測定された水の構成元素の安定同位体比とから動物が育った地域を推定する第3のステップとを備えている。
本発明によれば、被測定物の産地を容易に推定することができる。
以下、本発明の実施の形態について図面を参照しながら詳細に説明する。
〔実施の形態の原理〕
本発明の一実施の形態である産地推定方法は、動物から採取された被測定物に含まれる炭素元素および水の構成元素の安定同位体比から、その動物が育った地域を推定することを特徴としている。
本発明の一実施の形態である産地推定方法は、動物から採取された被測定物に含まれる炭素元素および水の構成元素の安定同位体比から、その動物が育った地域を推定することを特徴としている。
より詳しく言うと、この産地推定方法は、図1に示すように、被測定物に含まれる炭素元素の安定同位体比を測定するステップS1と、被測定物に含まれる水の構成元素の安定同位体比を測定するステップS2と、測定された炭素元素の安定同位体比と測定された水の構成元素の安定同位体比とから、被測定物が採取された動物が育った地域を推定するステップS3とを備えている。なお、水の構成元素とは、水素元素または酸素元素である。ステップS2では、水素元素および酸素元素のいずれかの安定同位体比を測定すればよい。ステップS3では、測定された水素元素および酸素元素のいずれかの安定同位体比を用いて推定すればよい。
後述する実験により、動物から採取された被測定物に含まれる水の構成元素の安定同位体比は、その動物が摂取している水の構成元素の安定同位体比に依存することが明らかになった。動物が摂取している水は、各地域の降水によるものである。降水に含まれる水の構成元素の安定同位体比は、地域依存性がある。よって、動物から採取された被測定物に含まれる水の構成元素の安定同位体比は地域依存性を示す。したがって、本発明の発明者の研究によって、動物から採取された被測定物についても、水の構成元素の安定同位体比の値から、その動物の生育地域を絞り込めることがわかった。
また、後述する別の実験から明らかなように、動物から採取された被測定物に含まれる炭素元素の安定同位体比は、その動物が食べている植物の種類に依存する。ここで、発明者は、その動物が食べている植物や餌が、動物の生育地域によって異なることに着目した。すなわち、炭素元素の安定同位体比から植物の種類を推定することによって、その植物の生息地の分布から、その植物を食べている動物の生育地域を絞り込めることがわかった。
以上の知見に基づき、複数の元素の安定同位体比を用いて被測定物が採取された動物の生育地域を絞り込むことが、この産地推定方法の要諦である。
上述した原理に基づき、動物の生育地域を推定するステップS3を、図2に示す手順で実行することができる。先ず、ステップS2で測定された水の構成元素の安定同位体比から、動物が生育した大凡の地域を推定する(ステップS31)。ステップS1で測定された炭素元素の安定同位体比から、動物の生育に用いられた餌を推定する(ステップS32)。ステップS31で推定された大凡の地域の中から、ステップS32で推定された餌が用いられる地域を絞り込み、絞り込まれた地域を動物が育った地域と推定する(ステップS33)。
炭素元素および水の構成元素の両方の安定同位体比と動物の生育地域との関係を示すデータベースを予め用意しておけば、ステップS1,S2による炭素元素および水の構成元素の安定同位体比の測定結果から、直ちに動物の生育地域の推定結果を得ることができる。もっとも、餌が用いられる地域を考慮してデータベースが作成されている場合には、このデータベースを用いた推定方法は、ステップS31~S33による推定方法と実質的に同じである。
なお、上述した炭素元素の安定同位体比を測定するステップS1および水の構成元素の安定同位体比を測定するステップS2に関しては、ステップS1、ステップS2の順に実行してもよいし、その逆に、ステップS2、ステップS1の順に実行してもよい。可能であれば、ステップS1およびステップS2を同時に実行し、炭素元素の安定同位体比の測定と水素元素の安定同位体比の測定とを並行して行ってもよい。
〔安定同位体比の定義〕
次に、安定同位体比の定義について説明する。本実施の形態において測定される炭素元素および水素元素の安定同位体比には、天然に存在する非放射性同位体の比が用いられる。炭素元素の安定同位体比には12Cと13Cとの比が用いられる。水素元素の安定同位体比には1HとD(2H)との比が用いられる。ただし、これらの安定同位体比は、通常、絶対比ではなく、標準試料の同位体比からの千分偏差としてδ値で表現される。
次に、安定同位体比の定義について説明する。本実施の形態において測定される炭素元素および水素元素の安定同位体比には、天然に存在する非放射性同位体の比が用いられる。炭素元素の安定同位体比には12Cと13Cとの比が用いられる。水素元素の安定同位体比には1HとD(2H)との比が用いられる。ただし、これらの安定同位体比は、通常、絶対比ではなく、標準試料の同位体比からの千分偏差としてδ値で表現される。
炭素元素の安定同位体比は、δ13Cとして、下記の式(1)で示すことができる。水素元素の安定同位体比は、δDとして、下記の式(2)で示すことができる。なお、これらの式中、SAMPは分析試料における同位体比を示し、STDは標準試料における同位体比を示す。


水素元素の安定同位体比の標準試料としては、通常、標準平均海水(Vienna Standard Mean Ocean Water:VSMOW)を用いて表記される。炭素元素の安定同位体比の標準試料としては、通常は、PeeDee層のヤイシ類の化石(Vienna Pee Dee Belemnite:VPDB)を用いて表記される。
〔安定同位体比の測定〕
次に、安定同位体比の測定について説明する。同じ牧場でC3植物に分類される牧草を餌として与えられ生育されている同一種の動物10頭の獣毛をサンプルとして用意する。本実施の形態において、獣毛としてカシミヤ山羊の毛が用いられる。
次に、安定同位体比の測定について説明する。同じ牧場でC3植物に分類される牧草を餌として与えられ生育されている同一種の動物10頭の獣毛をサンプルとして用意する。本実施の形態において、獣毛としてカシミヤ山羊の毛が用いられる。
この用意した獣毛10サンプルについて、レーザ分光式安定同位体比分析法で炭素元素の安定同位体比を測定する。先ず獣毛10サンプルを燃焼することにより、二酸化炭素ガスを発生させる。発生させた二酸化炭素ガスにレーザ光を照射する。そのレーザ光の吸収量(光吸収強度)をレーザ分光法で測定および分析することにより、炭素元素の安定同位体比を測定する。
このようにして得られた測定値は、獣毛を構成する有機物(ケラチン)と獣毛に付着する汚れ等に含まれる炭素元素全てに対する安定同位体比である。その測定結果を図3中に菱形のポイントで示す。サンプル番号1から10の獣毛の炭素元素の安定同位体比の個体間の違いは、最大で1‰であった。
一方、上記獣毛10サンプルから皮脂油やフケ等の汚れを除去するために、前処理を行う。先ず、獣毛10サンプルを任意の中性洗剤で洗浄する。洗浄された獣毛10サンプルを乾燥させる。乾燥した獣毛10サンプルをエタノールに10分つけ置いて脱脂処理を施す。脱脂処理したサンプルについて、レーザ分光式安定同位体比分析法で炭素元素の安定同位体比を分析する。
獣毛を洗浄および脱脂処理することにより、獣毛に付着している汚れに含まれる炭素元素が除去される。これにより、獣毛を構成する有機物(例えば、ケラチン)に含まれる炭素元素のみの安定同位体比が測定可能となる。その結果を図3中に矩形のポイントで示す。獣毛を洗浄および脱脂処理することにより、炭素元素の安定同位体比の個体差は0.4‰以下と小さくなった。このことは、同じ牧場で同じ餌を食べて生育されている同種の動物では、獣毛を構成する有機物(例えば、ケラチン)に含まれる炭素元素の安定同位体比が、ほぼ同じ値であることを示している。
エタノールのつけ置き時間を変えて、炭素元素の安定同位体比の測定を行った結果を図4に示す。エタノールのつけ置き時間を長くすると、炭素元素の安定同位体比の個体毎のばらつきが低減され、10分以上でばらつきが一定となっている。よって、エタノールのつけ置き時間は10分以上であれば、獣毛に付着している汚れに含まれる炭素元素が完全に除去され、獣毛を構成する有機物に含まれる炭素元素のみの安定同位体比が測定可能となる。
水素元素の安定同位体比も炭素元素の安定同位体比と同じくレーザ分光式安定同位体比分析法で分析することができる。しかし、獣毛サンプルの保管や輸送中に、獣毛サンプルが周囲の環境中に含まれている水素原子を水分として吸収してしまうことで、獣毛サンプルの水素元素の安定同位体比が経時変化を起こしてしまう。また、獣毛サンプルの洗浄に使われた中性洗剤を含む洗浄水が獣毛サンプルに吸収されることで、獣毛サンプルの水素元素の安定同位体比の測定結果に影響を与えてしまうことがある。これにより、水素元素の安定同位体比の比較による産地推定が難しくなる。そこで、凍結乾燥処理で獣毛サンプル中の水分を気化して取り除くことにより、獣毛サンプルを構成する有機物に含まれる水素元素の安定同位体比のみが測定可能となる。
図5に、前処理を行った場合と行わなかった場合について、炭素元素および水素元素の安定同位体比に関する測定結果を示す。前処理としては、獣毛サンプルに対し、エタノールによる脱脂処理を10分間施し、その後に、温度-50℃、真空度8Paの条件下で6時間凍結乾燥処理を施した。図5中、菱形のポイントは前処理ありの場合の測定結果を示し、矩形のポイントは前処理無しの場合の測定結果を示している。
符号pで示すように、脱脂処理(エタノール処理)を行わなかった場合、炭素元素の安定同位体比(δ13C)のばらつきは1‰であった。これに対し、符号qで示すように、脱脂処理(エタノール処理)を行なった場合、炭素元素の安定同位体比(δ13C)のばらつきは0.4‰であった。したがって、脱脂処理により、炭素元素の安定同位体比の個体の違いによるばらつきが1‰から0.4‰に低減した。
符号rで示すように、凍結乾燥処理を行わなかった場合、水素元素の安定同位体比(δD)のばらつきは10.3‰であった。これに対し、符号sで示すように、凍結乾燥処理を行った場合、水素元素の安定同位体比(δD)のばらつきは5.1‰であった。したがって、凍結乾燥処理により、水素元素の安定同位体比の個体の違いによるばらつきが10.3‰から5.1‰に低減した。これらの前処理により、同一産地の獣毛サンプルの水素元素の安定同位体比および炭素元素の安定同位体比をより精度高く測定可能となる。
〔炭素元素の安定同位体比からの餌の推定〕
C3植物に分類される牧草を餌として与えられ生育されている動物の獣毛サンプルA、トウモロコシ等のC4植物に分類される植物から成る飼料とC3植物に分類される牧草の両方を餌として与えられ生育されている動物の獣毛サンプルB、トウモロコシ等のC4植物に分類される植物を飼料として生育されている動物の獣毛サンプルCを用意する。
C3植物に分類される牧草を餌として与えられ生育されている動物の獣毛サンプルA、トウモロコシ等のC4植物に分類される植物から成る飼料とC3植物に分類される牧草の両方を餌として与えられ生育されている動物の獣毛サンプルB、トウモロコシ等のC4植物に分類される植物を飼料として生育されている動物の獣毛サンプルCを用意する。
これら3種類のサンプルA~Cのそれぞれに対し、上記の洗浄・乾燥・脱脂処理を施す。この洗浄・乾燥・脱脂処理が施された3種類のサンプルA~Cのそれぞれについて、レーザ分光式安定同位体比分析法で炭素元素の安定同位体比を分析する。その分析結果を図6に示す。
炭素元素の安定同位体比は、小さな値の順に、サンプルA、サンプルB、サンプルCとなっている。サンプルAとサンプルBとの炭素元素の安定同位体比の差は5‰、サンプルBとサンプルCとの炭素元素の安定同位体比の差は3‰である。
C3植物の炭素元素の安定同位体比は、C4植物の炭素元素の安定同位体比よりも、小さいことが知られている。一方、C3植物を主食としている動物の獣毛サンプルAの炭素元素の安定同位体比が、C4植物を主食としている動物の獣毛サンプルCの炭素元素の安定同位体比よりも小さい値をとっている。また、C3植物とC4植物の両方を主食としている動物の獣毛サンプルBの炭素元素の安定同位体比が、サンプルAとサンプルCとの間の値をとっている。これらのことから、餌の種類と獣毛の炭素元素の安定同位体比に相関が見られることが分かる。この相関関係から、被測定物(獣毛)に含まれる炭素元素の安定同位体比を測定することにより、被測定物(獣毛)が採取された動物が食している餌を推定することが可能となる。
この種の実験を繰り返し行った結果、C3植物で生育している動物の獣毛に含まれる炭素元素の安定同位体比は-21‰以下(範囲a)となり、C3植物およびC4植物の混合餌で生育している動物の獣毛に含まれる炭素元素の安定同位体比は-21‰~-16‰(範囲b)となり、トウモロコシ等のC4植物で生育している動物の獣毛に含まれる炭素元素の安定同位体比は-16‰以上(範囲c)となることが分かった。
〔水素元素の安定同位体比からの産地の推定:推定例1〕
緯度が高い順に、地域D、地域E、地域F、地域Gのそれぞれの水サンプルD、水サンプルE、水サンプルF、水サンプルGについて、レーザ分光式安定同位体比分析法で水素元素の安定同位体比および酸素元素の安定同位体比を測定する。先ず水サンプルD~Gのそれぞれを蒸発させる。発生させた水蒸気にレーザ光を照射する。そのレーザ光の吸収量(光吸収強度)をレーザ分光法で測定および分析することにより、水素元素の安定同位体比および酸素元素の安定同位体比を測定する。その測定結果を図7に示す。
緯度が高い順に、地域D、地域E、地域F、地域Gのそれぞれの水サンプルD、水サンプルE、水サンプルF、水サンプルGについて、レーザ分光式安定同位体比分析法で水素元素の安定同位体比および酸素元素の安定同位体比を測定する。先ず水サンプルD~Gのそれぞれを蒸発させる。発生させた水蒸気にレーザ光を照射する。そのレーザ光の吸収量(光吸収強度)をレーザ分光法で測定および分析することにより、水素元素の安定同位体比および酸素元素の安定同位体比を測定する。その測定結果を図7に示す。
緯度が高い地域ほど、水素元素の安定同位体比(δD)も酸素元素の安定同位体比(δ18O)も小さくなる。図中の直線は、世界の天水線(Global Meteoric Water Line)と呼ばれるもので、世界の降水に関する平均的な水素元素の安定同位体比と酸素元素の安定同位体比との関係(δD=8×δ18O+10‰)を示している。地域D~Gの水サンプルD~Gは、この直線上に乗っている。
図8に水素元素の安定同位体比と緯度との関係を示す。緯度が高くなる程、水素元素の安定同位体比が小さくなっている。この地域Dから地域Gにおいては、1度緯度が高くなると、降水中の水素元素の安定同位体比が2.8‰小さくなっている。
次に、緯度が高い順に、地域Hで生育された動物の獣毛サンプルH、地域Iで生育された動物の獣毛サンプルI、地域Jで生育された動物の獣毛サンプルJ、地域Kで生育された動物の獣毛サンプルKを用意する。これら獣毛サンプルについて、レーザ分光式安定同位体比分析法で水素元素の安定同位体比を測定する。
図9に、獣毛サンプルに含まれる水素元素の安定同位体比の測定結果と、獣毛サンプルが採取された動物の生育地域の緯度との関係を示す。生育地域の緯度が高い程、獣毛に含まれる水素元素の安定同位体比が小さくなっており、両者に相関が見られることが分かる。
図8図9から分かるように、地域の緯度が高いほど、降水中の水素元素の安定同位体比が小さくなる。動物はその地域の水(降水)を摂取して生育するため、動物の獣毛を構成する有機物(例えば、ケラチン)に含まれる水素元素の安定同位体比は、生育過程で摂取した地域の水の水素元素の安定同位体比と相関関係にある。このため、図9から分かるように、獣毛に含まれる水素元素の安定同位体比も、地域の緯度が高いほど小さくなる。この相関関係から、被測定物(獣毛)に含まれる水素元素の安定同位体比を測定することにより、被測定物(獣毛)が採取された動物が育った大凡の地域(緯度)を推定することが可能となる。
〔水素元素の安定同位体比からの産地の推定:推定例2〕
〈降水に含まれている水素元素の安定同位体比の差Δδ〉
任意の地点を基準地点とした場合、この基準地点の降水に含まれる水素元素の安定同位体比と任意の地域の降水に含まれる水素元素の安定同位体比との差Δδは、基準地点と任意の地域との間の緯度差から算出される差ΔδAと、基準地点と任意の地域との間の高度差から算出される差ΔδBとの和として表される(例えば、非特許文献6、7参照)。
〈降水に含まれている水素元素の安定同位体比の差Δδ〉
任意の地点を基準地点とした場合、この基準地点の降水に含まれる水素元素の安定同位体比と任意の地域の降水に含まれる水素元素の安定同位体比との差Δδは、基準地点と任意の地域との間の緯度差から算出される差ΔδAと、基準地点と任意の地域との間の高度差から算出される差ΔδBとの和として表される(例えば、非特許文献6、7参照)。
緯度差から算出される差ΔδAは(3)式で示される。
ΔδA(‰)=-b×ΔY ・・・・(3)
但し、ΔYは緯度差 (°)、bは定数。ここでは、カシミヤの産地推定に適した値として、定数bを2.8から4.4の範囲とする。
ΔδA(‰)=-b×ΔY ・・・・(3)
但し、ΔYは緯度差 (°)、bは定数。ここでは、カシミヤの産地推定に適した値として、定数bを2.8から4.4の範囲とする。
高度差から算出される差ΔδBは(4)式で示される。
ΔδB(‰)=-0.0065×c×ΔZ ・・・・(4)
但し、ΔZは高度差(m)、cは定数。ここでは定数cを3.1とする。
ΔδB(‰)=-0.0065×c×ΔZ ・・・・(4)
但し、ΔZは高度差(m)、cは定数。ここでは定数cを3.1とする。
(3)式および(4)式より、基準地点と任意の地域との間の降水に含まれる水素元素の安定同位体比の差Δδは、下記の(5)式で示される。
Δδ(‰)=ΔδA+ΔδB=-b×ΔY-0.0065×c×ΔZ ・・・・(5)
(5)式は、基準地点(任意の地点)から緯度がΔYだけ、高度がΔZだけ異なる地点では、降水に含まれる水素元素の安定同位体比が基準地点からΔδだけ異なることを表している。
Δδ(‰)=ΔδA+ΔδB=-b×ΔY-0.0065×c×ΔZ ・・・・(5)
(5)式は、基準地点(任意の地点)から緯度がΔYだけ、高度がΔZだけ異なる地点では、降水に含まれる水素元素の安定同位体比が基準地点からΔδだけ異なることを表している。
〈ΔδとδDとの関係を示す式〉
複数の地域で生育した動物から採取された獣毛サンプルに含まれる水素元素の安定同位体比を測定する。以下の説明では、特にことわりがない限り、動物はカシミヤ山羊とし、動物から採取された獣毛(獣毛サンプル)はカシミヤとする。
複数の地域で生育した動物から採取された獣毛サンプルに含まれる水素元素の安定同位体比を測定する。以下の説明では、特にことわりがない限り、動物はカシミヤ山羊とし、動物から採取された獣毛(獣毛サンプル)はカシミヤとする。
基準地点を緯度0度、高度0度とし、採取された獣毛サンプルの産地(カシミヤ山羊が生育した地域)の緯度と高度から、上記の(5)式を用いて、基準地点の降水に含まれる水素元素の安定同位体比と、採取された獣毛サンプルの産地の降水に含まれる水素元素の安定同位体比との差Δδを求める。この差Δδの算出は、水素元素の安定同位体比の測定が行われたすべての獣毛サンプルの産地(上記複数の地域)について行われる。
基準地点と獣毛サンプルの産地との間の降水に含まれる水素元素の安定同位体比の差Δδを横軸に、その差Δδを求めた獣毛サンプルに含まれる水素元素の安定同位体比δDを縦軸にとったグラフを作成する(図10参照)。そして、最小二乗法により、基準地点と獣毛サンプルの産地との間の降水に含まれる水素元素の安定同位体比の差Δδ、すなわち基準地点と獣毛サンプルが採取された動物が生育している可能性がある地域(以下、この地域を「推定対象地域」と呼ぶ。)との間の降水に含まれる水素元素の安定同位体比の差Δδと、獣毛サンプルに含まれる水素元素の安定同位体比δDとの関係を示す(6)式を導出する。
δD=α×Δδ+β ・・・・(6)
但し、α、βは定数。
但し、α、βは定数。
なお、この(6)式の導出に際しては、同一産地の獣毛サンプルに含まれる水素元素の安定同位体比にばらつきがあるとき、また、同一地域の降水に含まれる水素元素の安定同位体比にばらつきがあるときは、それぞれの平均値を用いる。
(5)式を(6)式に代入すると、(7)式が得られる。
δD=α×(-b×ΔY-0.0065×c×ΔZ)+β ・・(7)
(7)式のδDは、緯度(ΔY)と高度(ΔZ)の関数である。
δD=α×(-b×ΔY-0.0065×c×ΔZ)+β ・・(7)
(7)式のδDは、緯度(ΔY)と高度(ΔZ)の関数である。
(7)式の導出の際には、最低3地域の水素元素の安定同位体比データが必要である。地域が多いほど関係式の精度が高くなるので望ましい。図10には、8地域のデータがプロットされている。
(7)式において、b=4.0、c=3.1とした場合、α=1.41、β=198となる。すなわち、b=4.0、c=3.1とした場合、上記の(6)式は(6a)式のように表される。
δD=1.41×Δδ+198 ・・・・(6a)
δD=1.41×Δδ+198 ・・・・(6a)
なお、ここでは、インターネット上で公開されているデータベース(例えば、非特許文献8参照)において、上記の地域の高度、緯度および経度に対応するΔδの値を参考にした。しかし、カシミヤ山羊の生育地域で採取した降水に含まれる水素元素の安定同位体比を実際に測定し、その値を用いて(6)式中のα値とβ値を最小二乗法により求めてもよい。
〈ΔδとδDとの関係を示す式を用いての産地の推定〉
被測定物をカシミヤとし、このカシミヤの産地が内モンゴル自治区赤峰市の産地かどうかを識別する場合について説明する。赤峰市の緯度(ΔY)および高度(ΔZ)を(7)式に代入し、カシミヤに含まれる水素元素の安定同位体比δDが取り得る値の範囲を算出する。被測定物(カシミヤ)に含まれる水素元素の安定同位体比を測定する。測定された水素元素の安定同位体比が計算から求められた値の範囲に入っていれば、被測定物は赤峰産の可能性があり、範囲から外れていれば、被測定物は赤峰産の可能性はないと判定する。
被測定物をカシミヤとし、このカシミヤの産地が内モンゴル自治区赤峰市の産地かどうかを識別する場合について説明する。赤峰市の緯度(ΔY)および高度(ΔZ)を(7)式に代入し、カシミヤに含まれる水素元素の安定同位体比δDが取り得る値の範囲を算出する。被測定物(カシミヤ)に含まれる水素元素の安定同位体比を測定する。測定された水素元素の安定同位体比が計算から求められた値の範囲に入っていれば、被測定物は赤峰産の可能性があり、範囲から外れていれば、被測定物は赤峰産の可能性はないと判定する。
また、カシミヤの産地として知られる、外モンゴル、中国チベット、中国内モンゴル自治区に関しても、それぞれの国または地域の緯度(ΔY)および高度(ΔZ)を(7)式に代入し、カシミヤに含まれる水素元素の安定同位体比δDが取り得る値の範囲を算出する。これにより、図11に示すように、産地毎にカシミヤに含まれる水素元素の安定同位体比δDの範囲が求まる。この例では、カシミヤに含まれる水素元素の安定同位体比δDが、軽い(小さい)方から、中国チベット、外モンゴル、中国内モンゴル自治区の順に、重く(大きく)なる。被測定物(カシミヤ)に含まれる水素元素の安定同位体比δDを測定し、測定された安定同位体比δDが図11中のどの範囲に入っているかを調べることで、被測定物の産地を推定することが可能となる。
なお、カシミヤ山羊の生育地域で採取した降水(生育水)およびカシミヤのそれぞれに含まれる水素元素の安定同位体比から、(6)式中のα値とβ値が求まることは上述した通りである。(7)式の代わりに、α値とβ値が設定された(6)式を用いても、カシミヤに含まれる水素元素の安定同位体比δDの範囲が産地毎に求まる。このため、被測定物(カシミヤ)に含まれる水素元素の安定同位体比δDを測定し、その測定結果を(6)式で求められた範囲と照合することにより、産地を推定することが可能である。
〔水素元素の安定同位体比と炭素元素の安定同位体比とからの産地の絞り込み〕
図12~図15を参照しながら、被測定物としての獣毛サンプルから、その獣毛サンプルが採取された動物の生育地(獣毛の産地)を推定する方法について説明する。
図12~図15を参照しながら、被測定物としての獣毛サンプルから、その獣毛サンプルが採取された動物の生育地(獣毛の産地)を推定する方法について説明する。
先ず、獣毛サンプルに含まれる水素元素の安定同位体比を測定する(図13のステップS101)。より詳しくは、獣毛サンプルに対して凍結乾燥処理を施す(図14のステップS111)。凍結乾燥した獣毛サンプルに含まれる水素元素の安定同位体比をレーザ分光式安定同位体比分析法で測定する(図14のステップS112)。
測定された水素元素の安定同位体比から、その獣毛サンプルが採取された動物が生育した大凡の地域を推定する(図13のステップS102)。前述した推定例1を採用した場合、任意の獣毛サンプルは、水素元素の安定同位体比の範囲によって、複数の地域で生育した動物の獣毛に分類される。例えば、図12に示すように、獣毛サンプルの産地を水素元素の安定同位体比を20‰毎に5つの地域に分類される。水素元素の安定同位体比が-20~-40‰の場合は地域I、-40~-60‰の場合は地域II、-60~-80‰の場合は地域III、-80~-100‰の場合は地域IV、-100~-120‰の場合は地域Vである。獣毛サンプルの水素元素の安定同位体比が-100‰だった場合、地域IVで採取されたサンプルであると推定される。
前述した推定例2を採用した場合、予め定められた基準地点と推定対象地域(被測定物が採取された動物が生育している可能性がある地域)との間の降水に含まれる水素元素の安定同位体比の差Δδと推定対象地域で生育した動物から採取された獣毛サンプルに含まれる水素元素の安定同位体比δDとの関係を示す式((6)式、(6a)式または(7)式)と、ステップS101で測定された水素元素の安定同位体比とから、獣毛サンプルが採取された動物が育った大凡の地域が推定される。
次に、獣毛サンプルに含まれる炭素元素の安定同位体比を測定する(図13のステップS103)。より詳しくは、先ず、獣毛サンプルを中性洗剤で洗浄する(図15のステップS131)。洗浄された獣毛サンプルを乾燥させる(図15のステップS132)。乾燥した獣毛サンプルをエタノールに浸して脱脂処理を施す(図15のステップS133)。脱脂処理したサンプルについて、レーザ分光式安定同位体比分析法で炭素元素の安定同位体比を分析する(図15のステップS134)。
測定された炭素元素の安定同位体比から、その獣毛サンプルが採取された動物の餌の種類を推定する(図13のステップS104)。このでは、餌が、C3植物、C4植物、C3植物とC4植物の混合餌のいずれかを推定する。
そして、ステップS102で推定された大凡の地域の中からステップS104で推定された餌が用いられる地域を絞り込み、絞り込まれた地域を獣毛サンプルが採取された動物が育った地域と推定する(図13のステップS105)。例えば、図12において、水素元素の安定同位体比から生育地が地域Iと推定され、さらに餌がC3植物と推定された場合、地域Iの中でC3植物の牧草を餌として動物を育てている地域は産地iに絞り込まれる。これにより、獣毛サンプルが採取された動物が育った地域(産地)がより狭い単位で推定され、産地推定の確度が上がる。
図16に、獣毛に含まれる炭素元素の安定同位体比と水素元素の安定同位体比と採取地(産地)との関係を例示する。図12~図15を用いて説明した例では、獣毛サンプルの水素元素の安定同位体比の測定結果が、地域Iで生育された動物の獣毛の水素元素の安定同位体比の範囲に含まれていた。このため、この地域Iが、獣毛サンプルが採取された動物が生育した大凡の地域と推定される。次に、炭素元素の安定同位体比の測定結果が、餌C3で生育された動物の獣毛の炭素元素の安定同位体比の範囲に含まれていた。このため、獣毛サンプルが採取された動物が育った地域が産地iに絞り込まれる。
図17に、カシミヤに含まれる炭素元素の安定同位体比と水素元素の安定同位体比と採取地(産地)との関係を例示する。キルギス産のカシミヤの水素元素の安定同位体比の範囲(キルギス領域)は、中国内モンゴル自治区産のカシミヤの水素元素の安定同位体比の範囲(中国内モンゴル自治区領域)と重なっている。この場合、カシミヤに含まれる炭素元素の安定同位体比の値で、中国内モンゴル自治区産かキルギス産かの判別を行う。
すなわち、図17に示すように、キルギスで生育するカシミヤ山羊はC3植物を主な餌としているため、C3植物の炭素元素の安定同位体比の影響を受ける。一方、中国内モンゴル自治区で生育するカシミヤ山羊はC3植物とC4植物の両方を餌としているため、C3植物とC4植物の間の炭素元素の安定同位体比の影響を受ける。これにより、カシミヤに含まれる炭素元素の安定同位体比の値から、中国内モンゴル自治区産かキルギス産かの判別を行うことができる。
実際の処理では、予め産地が分かっている複数の獣毛サンプルについて、炭素元素の安定同位体比と水素元素の安定同位体比とを測定し、測定結果から図16または図17のような炭素元素の安定同位体比と水素元素の安定同位体比と採取地(産地)との関係を示す表を作成しておく。そして、産地が未知の獣毛について、炭素元素の安定同位体比と水素元素の安定同位体比とを測定し、測定結果を図16または図17のような表に当てはめて、その獣毛が採取された動物が育った地域(産地)を推定する。
〔酸素元素の安定同位体比の使用〕
図7より、降水の水素元素の安定同位体比と酸素元素の安定同位体比とは比例関係にあることが分かる。獣毛の水素元素の安定同位体比は、獣毛を所有する動物が摂取した水(降水)と相関関係があるため、獣毛の酸素元素の安定同位体比も、その動物が生育した地域の降水の酸素元素の安定同位体比と相関がある。よって、獣毛の水素元素の安定同位体比と同様に、酸素元素の安定同位体比から、動物の生育地を推定することができる。
図7より、降水の水素元素の安定同位体比と酸素元素の安定同位体比とは比例関係にあることが分かる。獣毛の水素元素の安定同位体比は、獣毛を所有する動物が摂取した水(降水)と相関関係があるため、獣毛の酸素元素の安定同位体比も、その動物が生育した地域の降水の酸素元素の安定同位体比と相関がある。よって、獣毛の水素元素の安定同位体比と同様に、酸素元素の安定同位体比から、動物の生育地を推定することができる。
〔レーザ分光法の利用〕
安定同位体比分析の手法には、同位体比質量分析法(IRMS:Isotope Ratio Mass Spectrometry)や核磁気共鳴分光法(NMR:Nuclear Magnetic Resonance Spectroscopy)などがある。しかし、これらの手法では、高価で大型で操作が複雑な計測装置を用いる必要があり、時間とコストがかかるという問題があった。このため、市中の流通過程における検査項目に安定同位体比分析を導入することは困難であった。
安定同位体比分析の手法には、同位体比質量分析法(IRMS:Isotope Ratio Mass Spectrometry)や核磁気共鳴分光法(NMR:Nuclear Magnetic Resonance Spectroscopy)などがある。しかし、これらの手法では、高価で大型で操作が複雑な計測装置を用いる必要があり、時間とコストがかかるという問題があった。このため、市中の流通過程における検査項目に安定同位体比分析を導入することは困難であった。
そこで、本実施の形態では、酸素元素の安定同位体比、水素元素の安定同位体比、炭素元素の安定同位体比の測定に際して、レーザ分光式安定同位体比分析装置を用いることができる。レーザ分光式安定同位体比分析装置では、被測定物を燃焼させることにより発生した二酸化炭素ガスおよび水蒸気にレーザ光を照射し、レーザ光の吸収量を分析することで、被測定物に含まれる酸素元素、水素元素、炭素元素の安定同位体比を簡単に分析することができる(例えば、非特許文献5参照)。
レーザ分光式安定同位体比分析装置は、同位体比質量分析法や核磁気共鳴分光法の計測装置と比べて、安価で小型で操作が簡単である。また、質量分析法による安定同位体比分析に必要な化学的な前処理が不要となり、短時間(例えば、1時間以内)での産地の推定が可能となる。したがって、レーザ分光式安定同位体比分析装置の使用により、時間とコストを低減できる。なお、レーザ分光式安定同位体比分析装置は、酸素元素/水素元素の安定同位体比の測定と、炭素元素の安定同位体比の測定のいずれかだけに用いてもよい。
〔水素元素の安定同位体比からの産地表示の正当性判定〕
図9より、動物の生育地の緯度が1度高くなると、獣毛の水素元素の安定同位体比が6‰小さくなることが分かる。産地(緯度X’)が確実な獣毛の水素元素の安定同位体比がY’とする。その他の獣毛サンプルの産地の緯度(X)と水素元素の安定同位体比(Y)との関係は、(8)式で表せる。
Y=-6×(X-X’)+Y’・・・・(8)
図9より、動物の生育地の緯度が1度高くなると、獣毛の水素元素の安定同位体比が6‰小さくなることが分かる。産地(緯度X’)が確実な獣毛の水素元素の安定同位体比がY’とする。その他の獣毛サンプルの産地の緯度(X)と水素元素の安定同位体比(Y)との関係は、(8)式で表せる。
Y=-6×(X-X’)+Y’・・・・(8)
産地(緯度X’)が確実な獣毛の水素元素の安定同位体比(Y’)を基本データとして取得しておけば、(8)式を用いて、任意の獣毛の産地表示が正しいかを判断することができる。先ず、任意の獣毛の水素元素の安定同位体比(Y)を調べる。その値(Y)を(8)式に代入して緯度(X)を求める。求められた緯度(X)が産地表示の産地の緯度の値と一致していれば、産地表示が正しいと判定できる。
〔炭素元素の安定同位体比からの主食の推定〕
獣毛に含まれる炭素元素の安定同位体比が-21‰より小さい場合(図6の範囲a)、その獣毛を所有する動物の主食がC3植物であると推定する。獣毛に含まれる炭素元素の安定同位体比が-21‰~-16‰の場合(図6の範囲b)、その獣毛を所有する動物の主食がC3植物とC4植物の混合餌であると推定する。獣毛に含まれる炭素元素の安定同位体比が-16‰より大きい場合(図6の範囲c)、その獣毛を所有する動物の主食がC4植物であると推定する。
獣毛に含まれる炭素元素の安定同位体比が-21‰より小さい場合(図6の範囲a)、その獣毛を所有する動物の主食がC3植物であると推定する。獣毛に含まれる炭素元素の安定同位体比が-21‰~-16‰の場合(図6の範囲b)、その獣毛を所有する動物の主食がC3植物とC4植物の混合餌であると推定する。獣毛に含まれる炭素元素の安定同位体比が-16‰より大きい場合(図6の範囲c)、その獣毛を所有する動物の主食がC4植物であると推定する。
〔コンピュータへの適用〕
上述した産地推定方法は、コンピュータを用いて実施することもできる。図18に示すように、コンピュータ10は、CPU11と、メモリ12と、入出力インターフェース(I/F)13,14とを含んでいる。これらの回路はバス15によって相互に接続されている。
上述した産地推定方法は、コンピュータを用いて実施することもできる。図18に示すように、コンピュータ10は、CPU11と、メモリ12と、入出力インターフェース(I/F)13,14とを含んでいる。これらの回路はバス15によって相互に接続されている。
入出力インターフェース13には、レーザ分光式安定同位体比分析装置20が接続されている。被測定物(獣毛)に含まれる水素元素または酸素元素の安定同位体比についての測定結果と、炭素元素の安定同位体比についての測定結果が、レーザ分光式安定同位体比分析装置20から順次コンピュータ10に出力される。なお、レーザ分光式安定同位体比分析装置20がコンピュータ10に接続されていない場合には、オペレータが測定結果をマニュアルでコンピュータ10に入力してもよい。入出力インターフェース14には、モニタ30が接続されている。
メモリ12には、図1のステップS3、図2のステップS31~S33、または、図13のステップS102,S104,S105を実行するために必要なプログラムが記録されている。CPU11は、メモリ12に記録されているプログラムにしたがって動作し、各種元素の安定同位体比についての測定結果から、被測定物が採取された動物が育った地域を推定する。被測定物の産地表示が正しいかどうかの判断をしてもよい。CPU11は、これらの推定結果をモニタ30に表示する。
〔実施の形態の拡張〕
以上、本発明の実施の形態について説明したが、本発明は上記の実施の形態に限定されるものではない。本発明の構成や詳細には、本発明の技術思想の範囲内で当業者が理解し得る様々な変更をすることができる。
以上、本発明の実施の形態について説明したが、本発明は上記の実施の形態に限定されるものではない。本発明の構成や詳細には、本発明の技術思想の範囲内で当業者が理解し得る様々な変更をすることができる。
例えば、上述したように、水素元素および炭素元素の安定同位体比を測定する際には、それぞれ前処理(ステップS111,S131~133)を行うことで、より正確な測定結果が得られ、より確度の高い産地の推定が可能となる。しかし、大まかな推定結果が得られればよい場合などでは、前処理を省略してもよい。
また、被測定物として獣毛、特にカシミヤの毛の産地を推定する場合について説明した。しかし、本発明は例えば羊毛の産地推定にも利用できる。
10…コンピュータ、11…CPU、12…メモリ、13,14…入出力インターフェース、15…バス、20…レーザ分光式安定同位体比分析装置、30…モニタ。
Claims (11)
- 動物から採取された被測定物に含まれる炭素元素の安定同位体比を測定する第1のステップと、
前記被測定物に含まれる水の構成元素の安定同位体比を測定する第2のステップと、
前記測定された炭素元素の安定同位体比と前記測定された水の構成元素の安定同位体比とから前記動物が育った地域を推定する第3のステップと
を備える産地推定方法。 - 請求項1に記載された産地推定方法において、
前記第1のステップは、
前記被測定物を中性洗剤で洗浄するステップと、
前記洗浄された被測定物を乾燥させるステップと、
前記乾燥した被測定物をエタノールに浸して脱脂処理を施すステップと、
脱脂処理を施された前記被測定物に含まれる前記炭素元素の安定同位体比を測定するステップと
を含む産地推定方法。 - 請求項1または2に記載された産地推定方法において、
前記第2のステップは、
前記被測定物を凍結乾燥するステップと、
凍結乾燥した前記被測定物に含まれる前記水の構成元素の安定同位体比を測定するステップと
を含む産地推定方法。 - 請求項1~3の何れか1項に記載された産地推定方法において、
前記第3のステップは、
前記測定された水の構成元素の安定同位体比から前記動物が生育した大凡の地域を推定するステップと、
前記測定された炭素元素の安定同位体比から前記動物の生育に用いられた餌を推定するステップと、
前記推定された大凡の地域の中から前記推定された餌が用いられる地域を絞り込み、絞り込まれた地域を前記動物が育った地域と推定するステップと
を含む産地推定方法。 - 請求項4に記載された産地推定方法において、
前記大凡の地域を推定するステップは、前記測定された水の構成元素の安定同位体比と関係式とから前記大凡の地域を推定するステップを含み、前記関係式は、予め定められた基準地点の降水に含まれる水の構成元素の安定同位体比と推定対象地域の降水に含まれる水の構成元素の安定同位体比との差Δδと、前記推定対象地域で生育した動物から採取される被測定物に含まれる水の構成元素の安定同位体比δDとの関係を示している産地推定方法。 - 請求項5に記載された産地推定方法において、
前記関係式は、
δD=1.41×Δδ+198
である産地推定方法。 - 請求項1~6の何れか1項に記載された産地推定方法において、
前記第1のステップおよび前記第2のステップの少なくとも一方は、前記被測定物を燃焼させることにより発生した二酸化炭素ガスおよび水蒸気にレーザ光を照射し、前記レーザ光の吸収量を分析することで、前記被測定物に含まれる炭素元素および水の構成元素の少なくとも一方の安定同位体比を分析するレーザ分光式安定同位体比分析装置を用いるステップを含む産地推定方法。 - 請求項1~7の何れか1項に記載された産地推定方法において、
前記被測定物は、獣毛である産地推定方法。 - 請求項1~7の何れか1項に記載された産地推定方法において、
前記被測定物は、カシミヤ山羊の毛である産地推定方法。 - 請求項1~9の何れか1項に記載された産地推定方法において、
前記水の構成元素は、水素元素である産地推定方法。 - 請求項1~9の何れか1項に記載された産地推定方法において、
前記水の構成元素は、酸素元素である産地推定方法。
Priority Applications (4)
| Application Number | Priority Date | Filing Date | Title |
|---|---|---|---|
| EP19766849.4A EP3767280B1 (en) | 2018-03-13 | 2019-03-12 | Method for estimating production location |
| US16/979,665 US11275024B2 (en) | 2018-03-13 | 2019-03-12 | Method for estimating production location |
| CN201980018897.1A CN111868507A (zh) | 2018-03-13 | 2019-03-12 | 产地推定方法 |
| JP2020506550A JP6826232B2 (ja) | 2018-03-13 | 2019-03-12 | 産地推定方法 |
Applications Claiming Priority (4)
| Application Number | Priority Date | Filing Date | Title |
|---|---|---|---|
| JP2018-045288 | 2018-03-13 | ||
| JP2018045288 | 2018-03-13 | ||
| JP2018-203823 | 2018-10-30 | ||
| JP2018203823 | 2018-10-30 |
Publications (1)
| Publication Number | Publication Date |
|---|---|
| WO2019176925A1 true WO2019176925A1 (ja) | 2019-09-19 |
Family
ID=67906770
Family Applications (1)
| Application Number | Title | Priority Date | Filing Date |
|---|---|---|---|
| PCT/JP2019/009952 Ceased WO2019176925A1 (ja) | 2018-03-13 | 2019-03-12 | 産地推定方法 |
Country Status (5)
| Country | Link |
|---|---|
| US (1) | US11275024B2 (ja) |
| EP (1) | EP3767280B1 (ja) |
| JP (1) | JP6826232B2 (ja) |
| CN (1) | CN111868507A (ja) |
| WO (1) | WO2019176925A1 (ja) |
Cited By (1)
| Publication number | Priority date | Publication date | Assignee | Title |
|---|---|---|---|---|
| WO2021124560A1 (ja) * | 2019-12-20 | 2021-06-24 | 日本電信電話株式会社 | 判定システム、照合装置、および判定方法 |
Families Citing this family (1)
| Publication number | Priority date | Publication date | Assignee | Title |
|---|---|---|---|---|
| US12352738B2 (en) * | 2022-09-01 | 2025-07-08 | Saudi Arabian Oil Company | Mixing model to determine the composition of produced water using oxygen and hydrogen isotope ratios |
Citations (6)
| Publication number | Priority date | Publication date | Assignee | Title |
|---|---|---|---|---|
| JP2006189351A (ja) * | 2005-01-07 | 2006-07-20 | Mitsubishi Materials Corp | 米の生産地特定方法 |
| JP2010276466A (ja) | 2009-05-28 | 2010-12-09 | Tokyo Metropolitan Univ | バイオマス試料の由来判別方法およびコメの産地判別方法 |
| US20130154208A1 (en) | 2011-12-16 | 2013-06-20 | GM Global Technology Operations LLC | Suspension system and method of varying a stiffness of a suspension of a vehicle |
| JP2015224901A (ja) * | 2014-05-26 | 2015-12-14 | 日本電信電話株式会社 | 同位体比分析システム、及び分析方法 |
| WO2016063918A1 (ja) * | 2014-10-23 | 2016-04-28 | 国立研究開発法人理化学研究所 | ガス分析装置、ガス分析方法、メタボローム解析方法およびデータベース |
| JP2017219428A (ja) * | 2016-06-08 | 2017-12-14 | 日本電信電話株式会社 | レーザ分光式安定同位体比分析法、装置、および多地点安定同位体比分析システム |
Family Cites Families (7)
| Publication number | Priority date | Publication date | Assignee | Title |
|---|---|---|---|---|
| JP2005130755A (ja) * | 2003-10-30 | 2005-05-26 | New Energy & Industrial Technology Development Organization | 農産物の植物種および植物栽培地域の特定方法 |
| CN202053164U (zh) | 2011-04-25 | 2011-11-30 | 中芯国际集成电路制造(上海)有限公司 | 一种抛光垫清洁装置及抛光装置 |
| US9625436B2 (en) * | 2013-04-29 | 2017-04-18 | Hewlett-Packard Development Company, L.P. | Determining the geographic origin of metals |
| CN105259160B (zh) * | 2015-11-03 | 2018-09-11 | 中国农业科学院茶叶研究所 | 一种基于离子组学的西湖龙井茶产地识别方法 |
| CN106248810A (zh) * | 2016-06-08 | 2016-12-21 | 深圳出入境检验检疫局食品检验检疫技术中心 | 一种基于多元素和稳定同位素的葡萄酒产地溯源方法 |
| CN106841493A (zh) * | 2017-03-31 | 2017-06-13 | 华测检测认证集团股份有限公司 | 一种基于稳定同位素比率差异的东方美人茶产地判别方法 |
| CN107424003A (zh) * | 2017-05-05 | 2017-12-01 | 浙江省农业科学院 | 一种基于稳定性同位素比率和多元素的杨梅产地溯源方法 |
-
2019
- 2019-03-12 WO PCT/JP2019/009952 patent/WO2019176925A1/ja not_active Ceased
- 2019-03-12 US US16/979,665 patent/US11275024B2/en active Active
- 2019-03-12 CN CN201980018897.1A patent/CN111868507A/zh active Pending
- 2019-03-12 EP EP19766849.4A patent/EP3767280B1/en active Active
- 2019-03-12 JP JP2020506550A patent/JP6826232B2/ja active Active
Patent Citations (6)
| Publication number | Priority date | Publication date | Assignee | Title |
|---|---|---|---|---|
| JP2006189351A (ja) * | 2005-01-07 | 2006-07-20 | Mitsubishi Materials Corp | 米の生産地特定方法 |
| JP2010276466A (ja) | 2009-05-28 | 2010-12-09 | Tokyo Metropolitan Univ | バイオマス試料の由来判別方法およびコメの産地判別方法 |
| US20130154208A1 (en) | 2011-12-16 | 2013-06-20 | GM Global Technology Operations LLC | Suspension system and method of varying a stiffness of a suspension of a vehicle |
| JP2015224901A (ja) * | 2014-05-26 | 2015-12-14 | 日本電信電話株式会社 | 同位体比分析システム、及び分析方法 |
| WO2016063918A1 (ja) * | 2014-10-23 | 2016-04-28 | 国立研究開発法人理化学研究所 | ガス分析装置、ガス分析方法、メタボローム解析方法およびデータベース |
| JP2017219428A (ja) * | 2016-06-08 | 2017-12-14 | 日本電信電話株式会社 | レーザ分光式安定同位体比分析法、装置、および多地点安定同位体比分析システム |
Non-Patent Citations (16)
| Title |
|---|
| "Investigation of habitat history using carbon and nitrogen stable isotopes in Asiatic black bears captured and killed ", PRO NATURA FUND, vol. 14, 28 September 2011 (2011-09-28), XP009523005, Retrieved from the Internet <URL:https://www/nacsj.or.jp/pn/houkoku/h14/h14-no13.html> [retrieved on 20190418] * |
| ANONYMOUS: "High sensitivity laser gas sensing technology and application of isotope ratio analysis", NTT TECHNICAL JOURNAL, vol. 26, no. 2, February 2014 (2014-02-01), pages 27 - 30, XP009522965, ISSN: 0915-2318 * |
| KEI YOSHIMURA: "Tokyo University Graduate School Doctoral Dissertation", 2002, article "A Study for Atmospheric Water Circulation Processes by Applying Stable Isotopic Information" |
| KEI YOSHIMURAKIMPEI ICHIYANAGIATSUKO SUGIMOTO: "Meteorological Research Note No. 220", 2009, THE METEOROLOGICAL SOCIETY OF JAPAN |
| MATSUBARA, TAKESHI: "Stable Isotope Analysis in Avian Ecology", JOURNAL OF THE YAMASHINA INSTITUTE FOR ORNITHOLOGY, vol. 30, no. 2, 1998, pages 59 - 82, XP009100376 * |
| MATUSBARAMINAMI: "Stable Isotope Analysis in Avian Ecology", JOURNAL OF THE YAMASHINA INSTITUTE FOR ORNITHOLOGY, vol. 30, 1998, pages 59 - 82, XP009100376 |
| NAKASHITAHAYASHI: "Investigation of Habitat History Using Carbon and Nitrogen Stable Isotopes in Asiatic Black Bears Captured and Killed", PRO NATURA FUND, 14TH GRANT PERFORMANCE REPORT, 2005, pages 113 - 120 |
| PICARRO PRODUCT EXPLANATORY MATERIALS, 3 October 2018 (2018-10-03), Retrieved from the Internet <URL:http://www.bristol.ac.uk/media-library/sites/cabot/migrated/documents/measuring-co2-1.pdf> |
| RUMIKO NAKASHITA, MITSUAKI GOTO, SHIGEYUKI IZUMIYAMA, HIDETAKE HAYASHI, MUNEOKI YOH: "Carbon and nitrogen stable isotope evidence for the involvement of a captured Asiatic black bear in damages at a rainbow trout farm", HONYURUI KAGAKU (MAMMALIAN SCIENCE), vol. 47, no. 1, 2007, pages 19 - 23, XP055731429, ISSN: : 0385-437X, DOI: 10.11238/mammalianscience.47.19 * |
| RYOKO YOSHIMURA, TAKAKO YASUI, YOSHIHISA SAKAI: "Laser Gas Sensing Technology and isotopic analysis using the Applied", JOURNAL OF THE INSTITUTE OF ELECTRONICS, INFORMATION AND COMMUNICATION ENGINEERS C, vol. J100-C, no. 8, 14 July 2017 (2017-07-14), pages 310 - 315, XP009523006 * |
| SAAD, NABIL: "Geographical Analysis of Olive Oil Samples Originating from Eight Countries Using Picarro's Novel Simultaneous 13C + D CM-CRDS Isotope Analyzer", PICARRO APPLICATION NOTE, 2011, XP055641253 * |
| See also references of EP3767280A4 |
| SUZUKINAKASHITAKORENAGA: "Multiple Stable Isotope Analyses for Verifying Geographical Origin and Agricultural Practice of Japanese Rice Samples", BUNSEKI KAGAKU, vol. 58, no. 12, 2009, pages 1053 - 1058 |
| WATERISOTOPES.ORG, 3 October 2018 (2018-10-03), Retrieved from the Internet <URL:http://wateriso.utah.edu/waterisotopes/pages/data_access/oipc.html> |
| YAEKO SUZUKI: "Development of determination method for the geographical origin of agricultural products using chemical analysis", ABSTRACTS OF THE 65TH ANNUAL MEETING OF THE JAPANESE SOCIETY OF FOOD STORAGE SCIENCE; JUNE 25-26, 2016, 25 June 2016 (2016-06-25), pages 27 - 30, XP009523007 * |
| YOSHIMURAKOUTOKUFUJIISAKAMOTOSAKAI: "High Sensitivity Laser Gas Sensing Technology and Application of Isotope Ratio Analysis", NTT TECHNICAL JOURNAL, vol. 26, no. 2, 2014, pages 27 - 30, XP009522965 |
Cited By (4)
| Publication number | Priority date | Publication date | Assignee | Title |
|---|---|---|---|---|
| WO2021124560A1 (ja) * | 2019-12-20 | 2021-06-24 | 日本電信電話株式会社 | 判定システム、照合装置、および判定方法 |
| JPWO2021124560A1 (ja) * | 2019-12-20 | 2021-06-24 | ||
| CN114846327A (zh) * | 2019-12-20 | 2022-08-02 | 日本电信电话株式会社 | 判定系统、验证装置和判定方法 |
| JP7287502B2 (ja) | 2019-12-20 | 2023-06-06 | 日本電信電話株式会社 | 判定システム、照合装置、および判定方法 |
Also Published As
| Publication number | Publication date |
|---|---|
| EP3767280A1 (en) | 2021-01-20 |
| EP3767280B1 (en) | 2022-11-16 |
| US20210025817A1 (en) | 2021-01-28 |
| JPWO2019176925A1 (ja) | 2020-10-22 |
| CN111868507A (zh) | 2020-10-30 |
| JP6826232B2 (ja) | 2021-02-03 |
| EP3767280A4 (en) | 2021-11-24 |
| US11275024B2 (en) | 2022-03-15 |
Similar Documents
| Publication | Publication Date | Title |
|---|---|---|
| Harfenmeister et al. | Agricultural monitoring using polarimetric decomposition parameters of sentinel-1 data | |
| Ma et al. | Estimation of cotton leaf area index (LAI) based on spectral transformation and vegetation index | |
| Sun et al. | OCO-2 advances photosynthesis observation from space via solar-induced chlorophyll fluorescence | |
| Turner et al. | Integrating remote sensing and ecosystem process models for landscape-to regional-scale analysis of the carbon cycle | |
| Chen | A comparison of two approaches for estimating the wheat nitrogen nutrition index using remote sensing | |
| Camin et al. | Isotopic and elemental data for tracing the origin of European olive oils | |
| Cummings et al. | Corn nitrogen status diagnosis with an innovative multi-parameter crop circle phenom sensing system | |
| Yang et al. | Leaf nitrogen spectral reflectance model of winter wheat (Triticum aestivum) based on PROSPECT: simulation and inversion | |
| Wu et al. | Alleviating moisture content effects on the visible near-infrared diffuse-reflectance sensing of soils | |
| Goranov et al. | TEnvR: MATLAB-based toolbox for environmental research | |
| An et al. | The optimal soil water content models based on crop-LAI and hyperspectral data of winter wheat | |
| Lin et al. | Using hyper-spectral indices to detect soil phosphorus concentration for various land use patterns | |
| JP6826232B2 (ja) | 産地推定方法 | |
| Hu et al. | Handling the challenges of small-scale labeled data and class imbalances in classifying the N and K statuses of rubber leaves using hyperspectroscopy techniques | |
| Kang et al. | Assessing grapevine water status through fusion of hyperspectral imaging and 3D point clouds | |
| Peacock et al. | Understanding dissolved organic matter reactivity and composition in lakes and streams using proton-transfer-reaction mass spectrometry (PTR-MS) | |
| Jie et al. | Determination of Nitrogen Concentration in Fresh Pear Leaves by Visible/Near‐Infrared Reflectance Spectroscopy | |
| Sewpersad et al. | The assessment of soil organic matter in the KwaZulu-natal province of South Africa and its relationship to spectroscopy data | |
| Li et al. | Early warning potential of banana spoilage based on 3D fluorescence data of storage room gas | |
| He et al. | Rapid nondestructive metabolite identification in fresh tobacco leaves using hyperspectral imaging and deep learning models | |
| Guo et al. | Nondestructive quantification of foliar chlorophyll in an apple orchard by visible/near-infrared reflectance spectroscopy and partial least squares | |
| Misbah et al. | Use of hyperspectral prisma level-1 data and ISDA soil fertility map for soil macronutrient availability quantification in a Moroccan Agricultural Land | |
| Moeneclaey et al. | Disentangling the effects of phosphorus, nitrogen and species identity on the vegetation reflectance spectrum | |
| Gedminas et al. | Soil organic matter mapping using hyperspectral imagery and elevation data | |
| Barthès et al. | Near infrared reflectance spectroscopy (NIRS) could be used for characterization of soil nematode community |
Legal Events
| Date | Code | Title | Description |
|---|---|---|---|
| 121 | Ep: the epo has been informed by wipo that ep was designated in this application |
Ref document number: 19766849 Country of ref document: EP Kind code of ref document: A1 |
|
| ENP | Entry into the national phase |
Ref document number: 2020506550 Country of ref document: JP Kind code of ref document: A |
|
| NENP | Non-entry into the national phase |
Ref country code: DE |
|
| ENP | Entry into the national phase |
Ref document number: 2019766849 Country of ref document: EP Effective date: 20201013 |