WO2020054473A1 - 電解質濃度測定装置 - Google Patents
電解質濃度測定装置 Download PDFInfo
- Publication number
- WO2020054473A1 WO2020054473A1 PCT/JP2019/034355 JP2019034355W WO2020054473A1 WO 2020054473 A1 WO2020054473 A1 WO 2020054473A1 JP 2019034355 W JP2019034355 W JP 2019034355W WO 2020054473 A1 WO2020054473 A1 WO 2020054473A1
- Authority
- WO
- WIPO (PCT)
- Prior art keywords
- potential
- response curve
- ion
- electrode
- unit
- Prior art date
- Legal status (The legal status is an assumption and is not a legal conclusion. Google has not performed a legal analysis and makes no representation as to the accuracy of the status listed.)
- Ceased
Links
Images



Classifications
-
- G—PHYSICS
- G01—MEASURING; TESTING
- G01N—INVESTIGATING OR ANALYSING MATERIALS BY DETERMINING THEIR CHEMICAL OR PHYSICAL PROPERTIES
- G01N27/00—Investigating or analysing materials by the use of electric, electrochemical, or magnetic means
- G01N27/26—Investigating or analysing materials by the use of electric, electrochemical, or magnetic means by investigating electrochemical variables; by using electrolysis or electrophoresis
- G01N27/416—Systems
- G01N27/4163—Systems checking the operation of, or calibrating, the measuring apparatus
-
- G—PHYSICS
- G01—MEASURING; TESTING
- G01N—INVESTIGATING OR ANALYSING MATERIALS BY DETERMINING THEIR CHEMICAL OR PHYSICAL PROPERTIES
- G01N27/00—Investigating or analysing materials by the use of electric, electrochemical, or magnetic means
- G01N27/26—Investigating or analysing materials by the use of electric, electrochemical, or magnetic means by investigating electrochemical variables; by using electrolysis or electrophoresis
- G01N27/416—Systems
- G01N27/4166—Systems measuring a particular property of an electrolyte
-
- G—PHYSICS
- G01—MEASURING; TESTING
- G01N—INVESTIGATING OR ANALYSING MATERIALS BY DETERMINING THEIR CHEMICAL OR PHYSICAL PROPERTIES
- G01N27/00—Investigating or analysing materials by the use of electric, electrochemical, or magnetic means
- G01N27/26—Investigating or analysing materials by the use of electric, electrochemical, or magnetic means by investigating electrochemical variables; by using electrolysis or electrophoresis
- G01N27/28—Electrolytic cell components
- G01N27/30—Electrodes, e.g. test electrodes; Half-cells
- G01N27/301—Reference electrodes
-
- G—PHYSICS
- G01—MEASURING; TESTING
- G01N—INVESTIGATING OR ANALYSING MATERIALS BY DETERMINING THEIR CHEMICAL OR PHYSICAL PROPERTIES
- G01N27/00—Investigating or analysing materials by the use of electric, electrochemical, or magnetic means
- G01N27/26—Investigating or analysing materials by the use of electric, electrochemical, or magnetic means by investigating electrochemical variables; by using electrolysis or electrophoresis
- G01N27/28—Electrolytic cell components
- G01N27/30—Electrodes, e.g. test electrodes; Half-cells
- G01N27/333—Ion-selective electrodes or membranes
-
- G—PHYSICS
- G01—MEASURING; TESTING
- G01N—INVESTIGATING OR ANALYSING MATERIALS BY DETERMINING THEIR CHEMICAL OR PHYSICAL PROPERTIES
- G01N1/00—Sampling; Preparing specimens for investigation
- G01N1/28—Preparing specimens for investigation including physical details of (bio-)chemical methods covered elsewhere, e.g. G01N33/50, C12Q
- G01N1/38—Diluting, dispersing or mixing samples
- G01N2001/386—Other diluting or mixing processes
Definitions
- the present invention relates to an electrolyte concentration measuring device for measuring the concentration of an electrolyte in a liquid.
- An automatic analyzer is known as an apparatus for analyzing a sample containing a protein contained in a specimen such as blood or urine with high accuracy and high throughput.
- An electrolyte concentration measuring device is often mounted on such an automatic analyzer, but there are also a composite measuring device with blood gas and the like, and an electrolyte concentration measuring device alone.
- the electrolyte concentration measuring device is configured to analyze electrolyte components such as sodium (Na) ions, potassium (K) ions, and chlorine (Cl) ions in a sample.
- ISE method measures an electrolyte concentration in a sample by measuring a potential difference between an ion-selective electrode (ISE electrode) and a reference electrode that generates a reference potential.
- ISE electrode ion-selective electrode
- the ion-selective electrode includes an ion-sensitive membrane that generates a potential difference in response to an ionic component.
- these electrodes are consumables, for example, have a useful life of 2-3 months or thousands of tests and are replaced with new electrodes.
- reagents are constantly used in the electrolyte concentration measuring device.
- the type of reagent to be used varies depending on the device configuration, and includes, for example, an internal standard solution, a diluting solution for diluting the sample, and a comparative electrode solution supplied to the comparative electrode and forming a liquid junction with the sample solution.
- Patent Literature 1 in order to manage an electrode from manufacture to life, the type of ion to be measured, the expiration date after manufacture of the electrode, the number of days of use by the current user of the electrode, the number of measurement samples of the electrode, The electrode sensitivity (latest sensitivity measurement result), electrode accuracy (latest accuracy measurement result), electrode accuracy (latest accuracy measurement result), and electrode potential (latest potential measurement result) are described. It has an information table, and calculates a prediction of the performance life (replacement time) of the electrode based on each information stored in the information table and a calculation formula or a criterion provided in advance by the manufacturer or the user. Techniques are disclosed.
- Patent Document 2 discloses a technique in which potential data from suction of a sample liquid to stabilization of the potential are measured before and after suction. A technique is disclosed in which, when the value falls outside the allowable range calculated from the value of the potential difference of the sample solution, the analysis data of the sample after suction is abnormal.
- the timing of replacing various components and electrodes is determined based on the set period and the number of samples to be analyzed.
- a slope (slope) of the calibration curve, an electromotive force, a change in measurement reproducibility, and the like are also used as a material for determining the timing of replacement.
- the present invention is capable of accurately detecting various signs of abnormality of an apparatus while operating the apparatus, enabling optimization of maintenance frequency and calibration frequency, and improving substantial throughput. It is an object of the present invention to provide an electrolyte concentration measuring device capable of performing the following.
- An electrolyte concentration measurement device is an electrolyte concentration measurement device for measuring the concentration of ions in a liquid, wherein the liquid is supplied with an ion-selective electrode, a reference electrode serving as a potential reference, and the ion-selectivity.
- a potential measuring unit for acquiring the potential of the electrode, a concentration calculating unit for calculating the concentration of ions contained in the liquid from the potential acquired by the potential measuring unit, and a potential for monitoring the potential of the ion-selective electrode.
- a potential monitoring unit that generates a response curve
- a timing signal acquisition unit that acquires a timing signal related to the timing of various operations
- a potential response curve analysis that detects an abnormality sign of the device based on the relationship between the potential response curve and the timing signal Unit.
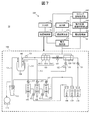
- FIG. 1 is a schematic diagram illustrating an example of a flow-type electrolyte concentration measurement device 10 according to a first embodiment. It is a flow chart explaining a procedure of measurement of an electrolyte concentration measuring device concerning a 1st embodiment.
- 5 is an example of a graph of a potential response curve acquired by a potential monitoring unit.
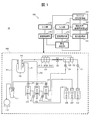
- FIG. 1 is a schematic diagram illustrating an example of a flow-type electrolyte concentration measurement device 10 according to the first embodiment.
- the electrolyte concentration measuring device 10 is generally constituted by a measuring unit 100 and a calculation control unit 200.
- the electrolyte concentration measuring device 10 measures the potential difference between the electrodes by alternately performing the measurement of the sample and the measurement of the internal standard solution, and can measure the concentration of a specific ion in the sample using the potential difference and the calibration curve. It is configured.
- the electrolyte concentration measuring apparatus 10 physically deteriorates the electrodes and the like and controls the slow leak of the solenoid valve based on a timing signal instructing a predetermined operation and a potential response curve indicating a potential change.
- the apparatus is configured to be able to detect an abnormality of the apparatus including the above.
- the measuring unit 100 includes an ion-selective electrode 101, a comparative electrode 102, a pinch valve 103, a dilution tank 104, a syringe pump 105 for an internal standard solution, a syringe pump 106 for a diluent solution, a sipper syringe pump 107, an internal standard solution bottle 108, A liquid bottle 109, a comparative electrode liquid bottle 110, a waste liquid tank 111, and a vacuum pump 112 are provided.
- the ion-selective electrode 101 includes, for example, a chlorine ion electrode 101A, a potassium ion electrode 101B, and a sodium ion electrode 101C.
- the ion-selective electrode 101 is supplied with a diluted sample liquid (diluted sample liquid) or an internal standard solution mixed with a diluent from a dilution tank 104 via a sipper nozzle N0.
- the comparative electrode 102 is supplied with a comparative electrode solution as described later.
- the comparative electrode solution is stored in the comparative electrode solution bottle 110, and is discharged to the comparative electrode 102 via a flow path provided with an electromagnetic valve V1 as appropriate.
- the chlorine ion electrode 101A, the potassium ion electrode 101B, and the sodium ion electrode 101C may be collectively referred to as "ion-selective electrodes 101A to 101C".
- the pinch valve 103 switches between opening and shutting off a flow path connecting the ion-selective electrode 101 and the comparative electrode 102.
- the dilution tank 104 is filled with a sample solution diluted with a diluent or an internal standard solution.
- the internal standard liquid syringe pump 105 is a pump for discharging the internal standard liquid toward the dilution tank 104.
- the internal standard solution is stored in an internal standard solution bottle 108 and is discharged to the dilution tank 104 by the internal standard solution syringe pump 105.
- An electromagnetic valve V2 is provided in a flow path connecting the internal standard solution bottle 108 and the internal standard solution syringe pump 105, and an electromagnetic valve V3 is provided in the internal standard solution nozzle N1.
- the internal standard solution nozzle N1 may be provided with a pre-heater (not shown) for heating the internal standard solution.
- the diluent syringe pump 106 is a pump for discharging the diluent toward the diluting tank 104.
- the diluent is stored in a diluent bottle 109 and is discharged to the diluting tank 104 by the diluent syringe pump 106.
- An electromagnetic valve V4 is provided in a flow path connecting the diluent bottle 109 and the diluent syringe pump 106, and an electromagnetic valve V5 is provided in the shipper nozzle N2.
- the sipper nozzle N2 may be provided with a preheater (not shown) for heating the diluent.
- the internal standard solution nozzle N1 and the shipper nozzle N2 can be inserted into and removed from the dilution tank 104 as needed.
- the sipper syringe pump 107 is a pump that operates when sucking a sample liquid or the like from the dilution tank 104 to the ion-selective electrode 101 side.
- the pinch valve 103 is also opened. The sample liquid sucked by the sipper syringe pump 107 is discarded as waste liquid toward the waste liquid tank 111.
- the sipper syringe pump 107 also operates when the comparative electrode solution is sucked toward the comparative electrode 102 and when the comparative electrode solution is sucked from the comparative electrode 102 and discarded.
- the electromagnetic valve V8 in the flow path between the comparison electrode 102 and the sipper syringe pump 107 and the electromagnetic valve V7 between the sipper syringe pump 107 and the waste liquid tank 111 are opened, while the pinch valve 103 is closed.
- the vacuum pump 112 operates when the waste liquid is further discharged from the waste liquid tank 111 to the outside.
- the arithmetic control unit 200 includes a potential measurement unit 171, a concentration calculation unit 172, an output unit 174, a device control unit 175, an input unit 176, a potential monitoring unit 181, a timing signal acquisition unit 182, a potential response curve analysis unit 183, The data storage unit 184 is provided.
- the potential measuring unit 171 has a function of measuring a potential difference (electromotive force) between the ion-selective electrodes 101A to 101C and the comparison electrode 102. More specifically, the potential measuring section 171 has a function of measuring a stable potential after a certain time has elapsed from the introduction of the liquid into the flow paths of the ion-selective electrodes 101A to 101C.
- the concentration calculating section 172 calculates the concentration of specific ions (Cl ⁇ , K + , Na + ) in the diluted sample solution or the internal standard solution based on the potential difference calculated by the potential measuring section 171.
- the output unit 174 includes a display and the like for outputting the calculation result and the like in the density calculation unit 172.
- the device control unit 175 controls the measurement unit 100.
- the input unit 176 is an interface for inputting various data or commands to the device control unit 175.
- the potential monitoring unit 181 continuously monitors the potentials of the ion-selective electrodes 101A to 101C and generates a potential response curve indicating a temporal change of the monitored potential. More specifically, the potential monitoring unit 181 has a function of monitoring a transient potential change (potential response curve) from the introduction of the liquid to the flow path of the ion-selective electrodes 101A to 101C until the liquid is discharged. .
- transient is different from the timing at which a stable measured potential is obtained, and is a temporary potential change caused by the actual operation of various parts, the flow of liquid in a pipe, or the diffusion of a substance or liquid. Means significant change.
- the timing signal acquisition unit 182 acquires various timing signals output from the device control unit 175 to the measurement unit 100.
- the potential response curve analysis unit 183 has a function of analyzing the potential response curve generated by the potential monitoring unit 181.
- the potential response curve analysis unit 183 also acquires the above-described timing signal from the timing signal acquisition unit 182 and associates the timing signal with the potential response curve. More specifically, the potential response curve analysis unit 183 determines a physical change of the electrode and a sign of deterioration of the various mechanisms from the waveforms of the potential response curves during and immediately after the operation of the various mechanisms.
- the potential response curve analysis unit 183 determines the surface of the ion-sensitive membrane of the ion-selective electrode 101 from the waveform of the potential response curve when the operation of the various mechanisms related to the movement of the liquid in the liquid flow path is stopped. To determine the contamination.
- the reference electrode solution introduced into the flow path of the reference electrode 102 and the diluted analyte solution (or internal standard solution) introduced into the ion-selective electrode 101 come into contact at the liquid junction 120 to form a liquid junction. .
- This liquid junction electrically connects the ion-selective electrode 101 and the comparative electrode 102.
- the potential difference (electromotive force) between each ion-selective electrode 101 and the comparison electrode 102 is determined by the analysis target ion of the diluted sample liquid (or the internal standard liquid) introduced into the flow path of the ion-selective electrode 101. Varies with concentration.
- the electromotive force can be measured by the potential measuring unit 171, and the ion concentration can be calculated by the concentration calculating unit 172. Details of the calculation method will be described later.
- FIG. 2A shows a procedure at the time of starting the apparatus
- FIG. 2B shows a procedure in the case where the sample and the internal standard solution are alternately and continuously measured after the apparatus is started (“continuous analysis”). Is shown.
- the power supply (not shown) is turned on to start up the apparatus 10 (step S201), and the reagent bottles 108, 109, and 110 are installed (step S202). Thereafter, the reagent in the reagent bottle is initially charged (reagent prime) into the device 10 (step S203).
- Step S204 After the completion of the temperature adjustment, the internal standard solution is continuously measured (Step S204), and it is confirmed that the potential of the electrode is stable. Subsequently, in order to obtain a calibration curve for the ion-selective electrodes 101A to 101C, two kinds of standard solutions having known concentrations (high concentration (H) and low concentration (L)) were measured, and the slope sensitivity SL of the calibration curve was determined. It is calculated (step S205). Subsequently, the concentration Cis of the internal standard solution is calculated based on the slope sensitivity SL obtained in step S205 and the measured electromotive force (step S206).
- a timing signal for operating the various pumps 105 to 107, the solenoid valve, and other various driving units in the electrolyte concentration measuring device 10 is output from the device control unit 175.
- the timing signal is acquired by the timing signal acquisition unit 182.
- the potentials of the ion-selective electrodes 101A to 101C fluctuate, and the fluctuations are monitored by the potential monitoring unit 181.
- the monitored potential data is also transmitted to the timing signal acquisition unit 182, and is subjected to data processing in association with the timing signal.
- the potential response curve analysis unit 183 generates a potential response curve according to the data of the potential, and associates the timing signal with the potential response curve to analyze the characteristics of the potential response curve at each timing.
- steps S205 and S206 will be described.
- a standard solution (L) having a known low concentration (concentration CL ) is dispensed into the dilution tank 104
- the diluent in the diluent bottle 109 is further dispensed into the dilution tank 104 using the diluent syringe pump 106
- a known low concentration standard solution (L) is diluted at the set ratio D1.
- the sipper syringe pump 107 is operated to suck the diluted known low-concentration standard solution (L) in the diluting tank 104 through the sipper nozzle N0 and introduce it into the flow paths of the ion-selective electrodes 101A to 101C. I do. Further, the reference electrode solution is introduced into the flow path of the reference electrode 102 from the inside of the reference electrode solution bottle 110.
- each potential difference (electromotive force EMF L of the known low-concentration standard solution (L)) between the ion-selective electrodes 101A to 101C and the reference electrode 102 is measured by the potential measurement unit 171.
- the standard solution (L) remaining in the dilution tank 104 is sucked by the vacuum suction nozzle N3 and discarded in the waste liquid tank 111. Thereafter, the internal standard solution in the internal standard solution bottle 108 is newly dispensed into the dilution tank 104 by using the internal standard solution syringe pump 105. Then, the internal standard solution in the dilution tank 104 is sucked using the sipper syringe pump 107, and the flow paths of the ion-selective electrodes 101A to 101C are filled with the internal standard solution. Subsequently, the comparative electrode solution is introduced from the comparative electrode solution bottle 110 into the flow path of the comparative electrode 102.
- the electromotive force (measured electromotive force EMF IS of the internal standard solution) of the ion-selective electrodes 101A to 101C in the state where the internal standard solution and the reference electrode solution are filled is set to the The measurement is performed by the measurement unit 171.
- the measurement unit 171 the internal standard solution remaining in the dilution tank 104 is sucked by the vacuum suction nozzle N3 and discarded in the waste liquid tank 111.
- a standard solution (H) having a known concentration (C H ) is dispensed into the dilution tank 104, and the diluent in the diluent bottle 109 is dispensed into the dilution tank 104 using the diluent syringe pump 106.
- a known high concentration standard solution (H) is diluted at the set ratio D1.
- the standard solution (H) having a known high concentration diluted in the dilution tank 104 is sucked from the sipper nozzle N0 and introduced into the flow paths of the ion-selective electrodes 101A to 101C. Further, the reference electrode solution is introduced into the flow path of the reference electrode 102 from the inside of the reference electrode solution bottle 110.
- the reference electrode solution comes into contact with the diluted standard solution (H) having a known high concentration. Thereafter, each potential difference between the ion-selective electrodes 101A to 101C and the reference electrode 102 (the electromotive force EMF H of the known high-concentration standard solution (H)) is measured by the potential measurement unit 171.
- the standard solution (H) remaining in the dilution tank 104 is sucked by the vacuum suction nozzle N3 and discarded in the waste liquid tank 111. Thereafter, the internal standard solution in the internal standard solution bottle 108 is newly dispensed into the dilution tank 104 using the internal standard solution syringe pump 105. Then, the internal standard solution in the dilution tank 104 is sucked using the sipper syringe pump 107, and the flow paths of the ion-selective electrodes 101A to 101C are filled with the internal standard solution.
- the reference electrode solution is introduced into the flow path of the reference electrode 102 from the inside of the reference electrode solution bottle 110.
- the electromotive force of the ion-selective electrodes 101A to 101C is measured by the potential measuring unit 171.
- the internal standard solution remaining in the dilution tank 104 is sucked by the vacuum suction nozzle N3 and discarded in the waste liquid tank 111.
- the concentration calculating unit 172 calculates the slope sensitivity SL of the calibration curve using the following equation (1).
- E E0 + 2.303 ⁇ (RT / zF) ⁇ log (f ⁇ C) (2)
- E0 constant potential determined by the measurement system z: valence of the ion to be measured
- F Faraday constant
- R gas constant
- T absolute temperature
- f activity coefficient
- C ion concentration
- the slope sensitivity SL can be obtained by calculation from the absolute temperature T and the valence z of the ion to be measured. However, in order to further improve the analysis accuracy, in the first embodiment, the above-described calibration is performed by executing the above calibration. The slope sensitivity SL unique to the electrode is determined.
- the concentration Cis of the internal standard solution is obtained by the following equations (3) and (4) by the measured electromotive force EMF IS of the internal standard solution.
- the calibration procedure is not limited to the above.
- the measurement of the known high concentration standard solution is performed after the measurement of the known low concentration standard solution, but this order may be reversed.
- each potential difference (electromotive force EMF S of the sample) between the ion-selective electrodes 101A to 101C and the reference electrode 102 is measured by the potential measuring unit 171 to analyze the diluted sample solution (step S211). .
- the diluted sample liquid remaining in the dilution tank 104 is sucked by the vacuum suction nozzle N3 and discarded in the waste liquid tank 111. Thereafter, an internal standard solution is newly dispensed from the internal standard solution bottle 108 into the dilution tank 104 by using the internal standard solution syringe pump 105. Then, the internal standard solution in the dilution tank 104 is sucked using the sipper syringe pump 107, and the flow paths of the ion-selective electrodes 101A to 101C are filled with the internal standard solution.
- the reference electrode solution is introduced into the flow path of the reference electrode 102 from the inside of the reference electrode solution bottle 110. Thereafter, the electromotive force of each electrode is measured by the potential measuring unit 171 and the internal standard solution is analyzed (step S212).
- the sample concentration is calculated according to the result. From the slope sensitivity SL and the concentration Cis of the internal standard solution, the concentration Cs of the sample is calculated using the following formula (step S213).
- the measurement of the internal standard solution having a constant concentration is also performed before and after the measurement of the diluted sample solution. Then, the measured value of the diluted sample solution is corrected based on the measured value of the internal standard solution. Therefore, accurate measurement can be realized even if a gradual potential change (potential drift phenomenon) occurs due to a change in the surface of the sensitive film of the ion-selective electrodes 101A to 101C or a change in temperature.
- timing signals for operating the various pumps 105 to 107, the solenoid valves V1 to V8, and other various driving units in the electrolyte concentration measuring device 10 are output from the device control unit 175. .
- the timing signal is acquired by the timing signal acquisition unit 182.
- steps S201 to S206 the potentials of the ion-selective electrodes 101A to 101C fluctuate, and the fluctuations are continuously monitored by the potential monitoring unit 181.
- the data of the potential response curve which is the data of the monitored potential, is also transmitted to the timing signal acquisition unit 182, and is subjected to data processing in association with the timing signal.
- the potential response curve analysis unit 183 associates this potential response curve with the timing signal, acquires and analyzes the characteristic amount of the potential response curve at each timing.
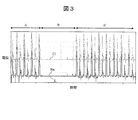
- FIG. 3 shows an example of a graph of a potential response curve obtained by the potential monitoring unit 181.
- the horizontal axis represents time, and the vertical axis represents potential.
- the potential of the chloride ion electrode 101A, the potential of the sodium ion electrode 101C, and the potential of the potassium ion electrode 101B are shown in descending order of potential.
- sections A and A ′ are measurement sections in which a diluted sample solution or an internal standard solution is measured
- section B is a temporary suspension section, including a return operation to the measurement section. That is, the sections A and A 'are measurement sections that are continuously executed with the temporary pause section B interposed therebetween.
- FIG. 3 shows only two measurement sections A and A ', such measurement sections A and A' can be executed a plurality of times.
- the internal standard solution and the diluted sample solution are alternately analyzed.
- the flow path is once shut off by the pinch valve 103.
- the ion-selective electrodes 101A to 101C are used.
- 101C sometimes shows a high potential.
- an air gap is introduced for segmentation between the diluted sample solution and the internal standard solution. In this case, too, the potentials of the ion-selective electrodes 101A to 101C may fluctuate greatly.
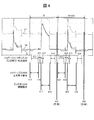
- FIG 4 shows an enlarged view of a part of the potential response curve in the measurement section A acquired by the potential monitoring unit 181 and the timing signal acquired by the timing signal acquiring unit 182 in a superimposed manner.
- the potential measuring unit 171 measures the potentials of the internal standard solution and the diluted sample solution at timings 401 and 402 at which the potential is relatively stable. At each of the timings 401 and 402, not only data at one point but also potentials can be measured a plurality of times at short time intervals, and an average value thereof can be obtained.
- the concentration calculation section 172 calculates the sample concentration using the data of the potential.
- the potential monitoring unit 181 can acquire the potential at intervals of 10 ms (sampling rate), for example. Note that the acquisition interval at the potential monitoring unit 181 can be changed, but acquisition at an interval shorter than 100 ms is suitable for monitoring a transient potential at the time of a pressure change or the like.
- the sampling rate in the potential monitoring unit 181 does not need to be always constant, and may be changed as appropriate.
- the sampling rate in the potential monitoring unit 181 may be set to a specific value only at the timing when the device component, electrode, or the like of interest operates, and may be set to a different value in other cases. Further, the sampling rate may be changed according to the type of the device component or the electrode of interest or the state of operation.
- the deterioration mode may be set, the timing at which the state change can be monitored is determined in advance, and only the potential before and after the timing is obtained by the timing signal obtaining unit 182 may be obtained by the potential monitoring unit 181.
- the sipper nozzle N0 descends into the dilution tank 104 filled with the internal standard solution (415), and the tip of the shipper nozzle N0 enters the internal standard solution in the dilution tank 104. Thereafter, the sipper syringe pump 107 is operated, and the internal standard solution is sucked from the dilution tank 104 via the sipper nozzle N0 (411) and introduced into the measurement flow paths of the ion-selective electrodes 101A to 101C.
- the tip of the sipper nozzle N0 is raised to separate the tip from the level of the internal standard solution (416), and thereafter, the air gap is introduced into the measurement flow channel by suction with the sipper syringe pump 107 (412). Thereafter, the pinch valve is closed (417), the sipper syringe pump 107 is operated again, the comparative electrode liquid is sucked from the comparative electrode liquid bottle 110 (413), and the comparative electrode liquid is introduced into the flow path of the comparative electrode 102. .
- the pinch valve is opened again (418), and after a certain period of time, the potentials of the ion-selective electrodes 101A to 101C are measured by the potential measuring unit 171 (401).
- the electromagnetic valve V8 and the like connected to the measurement flow path are closed, and the liquid in the sipper syringe pump 107 is discharged (414).
- the sample is diluted with the diluent supplied from the diluent tank 109. Thereafter, the shipper nozzle N0 descends into the dilution tank 104 filled with the diluted sample liquid (425), and the tip of the shipper nozzle N0 enters the diluted sample liquid in the dilution tank 104.
- the sipper syringe pump 107 is operated, the diluted sample liquid is sucked from the dilution tank 104 via the sipper nozzle N0 (421), and the diluted sample liquid is introduced into the measurement flow path of the ion-selective electrodes 101A to 101C. .
- the tip of the sipper nozzle N0 is raised to separate the tip from the liquid surface of the diluted sample liquid (426), and thereafter, the air gap is introduced into the measurement flow path by sucking with the sipper syringe pump 107 (422).
- the pinch valve is closed (427), the sipper syringe pump 107 is operated again, the comparative electrode solution is sucked from the comparative electrode solution bottle 110 (423), and the comparative electrode solution is introduced into the flow path of the comparative electrode 102.
- the pinch valve is opened again (428), and after a certain period of time, the potentials of the ion-selective electrodes 101A to 101C are measured by the potential measuring unit 171 (402).
- the electromagnetic valve V8 and the like connected to the measurement flow path are closed, and the liquid in the sipper syringe pump 107 is discharged (424).
- the timing signals (411 to 428) for instructing the start and end of the driving of the various members as described above are acquired from the device control unit 175 by the timing signal acquisition unit 182.
- the acquired timing signal is sent to the potential response curve analyzer 183.
- a timing signal for instructing opening and closing of the solenoid valves V1 to V8 a timing signal for instructing a dispensing operation in the dilution tank 104, and a timing for instructing a vacuum suction operation Signals and the like are also output from the device control unit 175 and acquired by the timing signal acquisition unit 182.
- the potential monitoring unit 181 can be configured to monitor the potential not only during the continuous analysis of the measurement sections A and A ′ in FIG. 3 but also during the temporary pause section B, the apparatus startup, and the calibration. .
- various information can be read by recording the timing signals 411 to 428 and the potential response curves obtained by the potential monitoring unit 181 in a time-series manner. For example, when the shipper nozzle N0 descends or rises, a potential change that appears to be caused by contact with the liquid in the dilution tank 104 or vibration of the liquid in the flow path appears on the potential response curve. Also, the suction / discharge operation of the sipper syringe pump 107 causes vibration to be transmitted to various electrodes and other components, thereby changing the potential of the potential response curve.
- the transient state acquired by the potential monitoring unit 181 is obtained. From the potential, information such as pressure fluctuation, vibration, and electrical noise can be obtained as well as the ion concentration and temperature in the liquid.
- the state (degree of deterioration, failure, etc.) of a component or an electrode to be operated at that time becomes clear from the analysis result of the potential response curve. For example, based on a potential change appearing in a potential response curve when a timing signal instructing closing of the pinch valve 103 is output, the degree of deterioration of a tube in the pinch valve 103, the presence or absence of a failure of the pinch valve 103 itself, and the like. Can be determined.
- the potential response before and after the internal standard solution, an ionic solution having a known concentration different from the internal standard solution, or an ionic solution containing interfering ions is sucked into the flow path of the ion selective electrodes 101A to 101C together with a predetermined timing signal. From the curves, it is possible to determine the contamination state of the sensitive membrane surfaces of the ion-selective electrodes 101A to 101C.
- the measurement channel is refreshed by cleaning the electrode channel including the sensitive membrane surface with a cleaning liquid during maintenance. be able to.
- any of the ion-selective electrodes 101A to 101C has a sign of deterioration or failure.
- a similar peculiar change appears in all the potentials of the ion-selective electrodes 101A to 101C, it is a sign of an abnormality not in the ion-selective electrodes 101A to 101C but in other components in the apparatus or the comparative electrode 102. It can be determined that there is a high possibility that the event has occurred.
- the ⁇ ⁇ potential response curve analysis unit 183 is provided with a data storage unit 184, which stores library data relating to the characteristic amount of the potential response curve.
- the library data is a set of data relating to various characteristic amounts relating to a standard potential response curve that may be obtained when the device is in a normal state.
- the potential response curve analysis unit 183 compares the characteristic amount of the library data with the characteristic amount of the potential response curve obtained as a result of the measurement at the timing when each timing signal is output. Thereby, it is possible to determine the state of deterioration of various electrodes and device parts, the surface contamination of the sensitive films of the ion-selective electrodes 101A to 101C, and the like.
- the library data may be standard data obtained as a result of simulation, or a potential response curve obtained immediately after the user first installs and operates the device 10 may be used as the library data.
- the library data can be appropriately updated based on the result of the measurement performed thereafter. Vibration and electric noise due to the environment and the like may differ depending on the installation location of the device 10. Therefore, it is expected that the accuracy of the abnormality sign will be improved by actually operating the device 10 and obtaining the library data.
- the library may be uploaded or downloaded via a network or the like.
- the timing signal indicating the timing of various operations is associated with the potential response curve obtained by measuring the potential of the ion-selective electrode.
- a sign of abnormality is detected and predicted, so that maintenance can be planned before abnormality appears in the measured potential, and then maintenance can be performed according to the plan.
- the potential response curve analysis unit 183 the physical change of the ion-selective electrode 101 and the deterioration of the various mechanism units are determined based on the waveforms of the potential response curves during and immediately after the operation of the various mechanism units due to the timing signal. Sign can be determined.
- the potential response curve analysis unit 183 detects the ion-selective electrode 101 based on the waveform of the potential response curve when the operation of various mechanisms related to the movement of the liquid in the liquid flow path due to the timing signal is stopped. Of the surface of the ion-sensitive membrane can be determined.
- a method of analyzing the potential response curve a general method used in analyzing time-series data can be used, and machine learning, deep learning, and the like can also be used.
- the behavior of various components and other components in the device that are affected by the operation of the electrodes according to the timing signal is predicted or simulated from the device configuration and physical equations, and the results are used to analyze the potential response curve. Can also.
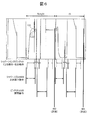
- FIG. 5 shows a potential response curve (NA1) obtained by measuring a predetermined sample liquid with the sodium ion electrode 101Ce whose storage expiration date has passed, and a relatively new sodium ion electrode 101Cn whose storage expiration date has not yet passed.
- the potential response curve (NA2) obtained by measuring the same sample liquid is shown.
- FIG. 5 also shows the timing of the suction / discharge operation of the sipper syringe pump 107, the timing of raising / lowering the sipper nozzle N0, and the timing signal for instructing the timing of the opening / closing operation of the pinch valve 103.
- the slope sensitivity of the old sodium ion electrode 101Ce was 59.2 mV / digit
- the slope sensitivity of the new sodium ion electrode 101Cn was 60.0 mV / digit, both of which were within the allowable range.
- both the potential response curve NA1 obtained by the old sodium ion electrode 101Ce and the potential response curve NA2 obtained by the new sodium ion electrode 101Cn provided measurement accuracy within an allowable range.
- the output unit 174 issues a warning to the operator to replace the sodium ion electrode 101 Ce at the next maintenance of the apparatus.
- the measurement accuracy is within the allowable range, it can be determined that there is a sign of abnormality by analyzing the shape of the potential response curve. By detecting a sign of an abnormality in this manner, the operator can accurately formulate a maintenance plan and execute maintenance according to the plan.
- FIG. 6 shows a potential response curve (Cl1) obtained by measuring a predetermined sample liquid with the chloride ion electrode 101Ae having the first state as the surface state of the ion-sensitive membrane, and a second state different from the first state.
- Cl1 a potential response curve obtained by measuring a predetermined sample liquid with the chloride ion electrode 101Ae having the first state as the surface state of the ion-sensitive membrane, and a second state different from the first state.
- 3 shows a potential response curve (Cl2) obtained by measuring the same sample liquid with the chloride ion electrode 101An having the state of FIG.
- FIG. 6 also shows the timing of the suction / discharge operation of the sipper syringe pump 107, the timing of raising / lowering the sipper nozzle N0, and the timing signal for instructing the timing of the opening / closing operation of the pinch valve 103.
- FIG. 6 is a graph when an aqueous solution containing interfering ions is measured as a measurement target (sample).
- the shape characteristic of the waveform in the potential response curve at the timing when the timing signal is output (the presence / absence of a convex peak, its amplitude, and width) is calculated as the characteristic amount, and is compared with the reference value. Signs can be determined.
- the difference between the waveforms of the potential response curves Cl1 and Cl2 at the time of sample aspiration and after the aspiration is due to the difference in the state of the ion-sensitive membrane surfaces of the chloride ion electrodes 101Ae and 101An, or the difference in the ion balance in the ion-sensitive membrane. It is considered to be based on
- FIG. 7 is a schematic diagram illustrating an example of a flow-type electrolyte concentration measurement device 10 according to the second embodiment.
- the same components as those in the first embodiment (FIG. 1) are denoted by the same reference numerals, and redundant description is omitted below.
- the electrolyte concentration measuring device 10 includes various sensors for detecting the behavior in the device 10, the detection signals of these sensors are acquired by a timing signal acquiring unit 182, and the potential response curve analyzing unit At 183, the potential response curve is analyzed based on the relevance of the timing signal, the detection signal of the sensor, and the potential response curve, and a sign of abnormality of the device is determined based on the result.
- a bubble sensor 121 that detects bubbles in the pipe and a pressure sensor 122 that is arranged in a flow path connecting the sipper syringe pump 107 and the liquid junction 120 and detects the pressure in the flow path are shown. ing.
- the type of the sensor is not limited to this.
- a liquid level sensor for detecting a change in the liquid level to the dilution tank 104 or the like, a vibration sensor for detecting the vibration of electrodes and other various components, and the like are provided in the apparatus 10.
- the bubble sensor 121 generates a pulse signal when bubbles of a predetermined size or more pass through a predetermined position.
- the pressure sensor 122 generates a pulse signal when the pressure at the measurement point reaches a predetermined value.
- the invention is not limited thereto, and the pressure value may be continuously output as needed.
- FIG. 8 shows an enlarged view of a part of the potential response curve in the measurement section A acquired by the potential monitoring unit 181, the timing signal acquired by the timing signal acquiring unit 182, and the sensor detection signal in a superimposed manner.
- the timing signal output by the device control unit 175 is acquired by the timing signal acquisition unit 182 and is associated with the potential response curve.
- the sensor 121, The sensor detection signal at 122 is also associated with the potential response curve.
- the timing at which the predetermined sensor detection signal is output is related to the timing at which the timing signal is output from the device control unit 175. Therefore, by acquiring the sensor detection signal by the timing signal acquiring unit 182, it is possible to more accurately associate the operation of the device 10 with the potential response curve, and to more accurately determine a sign of abnormality.
- the present invention is not limited to the above embodiment, and includes various modifications.
- the above embodiment has been described in detail for easy understanding of the present invention, and is not necessarily limited to one having all the described configurations.
- a part of the configuration of one embodiment can be replaced with the configuration of another embodiment, and the configuration of one embodiment can be added to the configuration of another embodiment.
- 101 ion-selective electrode
- 101A chloride ion electrode
- 101B potassium ion electrode
- 101C sodium ion electrode
- 102 comparative electrode
- 103 pinch valve
- 104 dilution tank
- 105 syringe pump for internal standard liquid
- 106 ... Syringe pump for diluting liquid
- 107 ... Shipper syringe pump
- 108 Internal standard liquid bottle
- 109 ... Diluting liquid bottle
- 110 Comparative electrode liquid bottle
- 111 ... Waste liquid tank
- 112 ... Vacuum pump
- 120 ... Liquid junction
- 121 ... bubble sensor
- 122 ... pressure sensor
- V1 to V8 ... solenoid valve 171 ...
- potential measuring unit 172 ... concentration calculating unit, 174 ... output unit, 175 ... device control unit, 176 ... input unit, 181 ... potential monitoring unit 182: timing signal acquisition unit; 183: potential response curve analysis unit; 184: data storage unit.
Landscapes
- Chemical & Material Sciences (AREA)
- Life Sciences & Earth Sciences (AREA)
- Health & Medical Sciences (AREA)
- Physics & Mathematics (AREA)
- Chemical Kinetics & Catalysis (AREA)
- Electrochemistry (AREA)
- Molecular Biology (AREA)
- Analytical Chemistry (AREA)
- Biochemistry (AREA)
- General Health & Medical Sciences (AREA)
- General Physics & Mathematics (AREA)
- Immunology (AREA)
- Pathology (AREA)
- Automatic Analysis And Handling Materials Therefor (AREA)
Abstract
この電解質濃度測定装置は、液体を供給されるイオン選択性電極と、電位の基準となる比較電極と、イオン選択性電極の電位を取得する電位測定部と、電位測定部にて取得した電位から液体中に含まれるイオンの濃度を算出する濃度算出部と、イオン選択性電極の電位を継続的に監視して電位応答曲線を生成する電位監視部と、各種動作のタイミングに関するタイミング信号を取得するタイミング信号取得部と、電位応答曲線及びタイミング信号の関連性に基づき装置の異常予兆を検知する電位応答曲線解析部とを備える。
Description
本発明は、液体中の電解質濃度を測定する電解質濃度測定装置に関する。
血液や尿などの検体に含まれるタンパク質を含む試料を高精度かつ高スループットで分析する装置として、自動分析装置が知られている。電解質濃度測定装置は、このような自動分析装置に搭載されることが多いが、血ガスなどとの複合測定装置や電解質濃度測定装置単体機などもある。電解質濃度測定装置は、例えば、試料中のナトリウム(Na)イオン、カリウム(K)イオン、塩素(Cl)イオンなどの電解質成分を分析するよう構成されている。
このような電解質濃度測定装置の多くは、イオン選択電極法(ISE法)と呼ばれる方式を利用している。ISE法は、イオン選択性電極(ISE電極)と基準電位を生じる比較電極との間の電位差を測定することで検体中の電解質濃度を測定する。イオン選択性電極はイオン成分に応答して電位差が生じるイオン感応膜を備える。一般的にこれらの電極は消耗品であり、例えば、2~3ヶ月もしくは数千テストで使用寿命となり新しい電極に交換される。
また、電解質濃度測定装置内では、定常的に数種類の試薬が使用される。使用する試薬の種類は装置構成によって異なるが、例えば、内部標準液、検体を希釈するための希釈液、比較電極に供給され検体液と液絡を形成する比較電極液などがある。
電解質濃度測定装置では、装置の立上げの際、電極交換の際、又は試薬ボトル交換の際などに、既知濃度の標準液を用いてキャリブレーションが実行され、検量線が作成される。このように、定期的にキャリブレーションを実施することで分析精度の担保を行っている。
一方、電極や装置の異常の予兆を判断する方法として、一般的に、装置立上げ時や電極・試薬交換時に実施されるキャリブレーションの結果から異常の予兆を判断する方法が知られている。例えば、特許文献1では、電極を製造から寿命まで管理するために、測定するイオンの種類と、電極の製造後の有効期限と、電極の現ユーザの使用日数と、電極の測定検体数と、電極の感度(最新の感度測定結果)と、電極の精度(最新の精度測定結果)と、電極の確度(最新の確度測定結果)と、電極の電位(最新の電位測定結果)が記載された情報テーブルを有しており、この情報テーブルに格納される各情報、及びメーカー側又はユーザ側で予め設けた計算式や判断基準に基づいて、電極の性能寿命(交換時期)の予測を算出する技術が開示されている。
また、電極や装置の異常の予兆とは異なるが、測定値が正常か否かを判断する技術として、特許文献2には、試料液の吸引から電位安定化するまでの電位データが、吸引前後の試料液の電位差の値から算出した許容範囲から外れた場合に、吸引後の試料の分析データが異常であると判定する技術が開示されている。
電解質濃度測定装置において、24時間連続稼動や分析スループット向上を達成するためには、常に装置が安定して稼動すること、すなわち装置の稼動率を高めることが必要である。これを実現するためには、キャリブレーション頻度やメンテナンス頻度の適正化が重要となる。
従来の電解質濃度測定装置においては、高い測定精度を維持するため、例えば数時間に一回など比較的高頻度でキャリブレーションが行われる。キャリブレーションの頻度が高くなることは、装置の稼働率の向上の障害となるため、キャリブレーションの間隔を長く(頻度を低く)することが求められる。その場合、キャリブレーションの合間において電極や装置の状態に大きな変化がないかを常時監視することが重要となる。
また、従来装置においては、各種部品や電極の交換のタイミングは、設定された期間や分析検体数に基づいて判定される。その他、検量線の傾斜(スロープ)、起電力、測定再現性の変化なども、交換のタイミングの判断において判断材料とされる。このように、キャリブレーション時に装置異常が見つかった場合、装置を停止させ、異常原因を特定し、交換部品を準備し、交換作業を実施し、再度キャリブレーションを実施する、などの作業が必要となる。この間、オペレータも長時間拘束され、装置のダウンタイムとなり、実質的なスループットが低下してしまう。
このような異常の予兆が事前に把握できれば、装置を止めることなく、装置を稼働させつつメンテナンス計画を立案することができる。しかし、イオン選択性電極の感応膜表面の汚染や膜の剥がれなどによる性能劣化や、電磁弁のスローリークなどは、イオン選択性電極の測定電位には明らかな異常として現れない。従って、これらの異常の予兆を的確に検知することは困難であった。
本発明は、装置を稼働させつつも装置の各種の異常予兆を的確に検知することができ、メンテナンス頻度やキャリブレーション頻度を適正化することが可能になると共に、実質的なスループットを向上させることができる電解質濃度測定装置を提供することを目的とする。
本発明に係る電解質濃度測定装置は、液体中のイオンの濃度を測定する電解質濃度測定装置において、前記液体を供給されるイオン選択性電極と、電位の基準となる比較電極と、前記イオン選択性電極の電位を取得する電位測定部と、前記電位測定部にて取得した電位から前記液体中に含まれるイオンの濃度を算出する濃度算出部と、前記イオン選択性電極の電位を監視して電位応答曲線を生成する電位監視部と、各種動作のタイミングに関するタイミング信号を取得するタイミング信号取得部と、前記電位応答曲線及び前記タイミング信号の関連性に基づき装置の異常予兆を検知する電位応答曲線解析部とを備える。
本発明によれば、装置を稼働させつつも装置の各種の異常予兆を的確に検知することができ、メンテナンス頻度やキャリブレーション頻度を適正化することが可能になると共に、実質的なスループットを向上させることができる電解質濃度測定装置を提供することができる。
以下、添付図面を参照して本実施形態について説明する。添付図面では、機能的に同じ要素は同じ番号で表示される場合もある。なお、添付図面は本開示の原理に則った実施形態と実装例を示しているが、これらは本開示の理解のためのものであり、決して本開示を限定的に解釈するために用いられるものではない。本明細書の記述は典型的な例示に過ぎず、本開示の特許請求の範囲又は適用例を如何なる意味においても限定するものではない。
本実施形態では、当業者が本開示を実施するのに十分詳細にその説明がなされているが、他の実装・形態も可能で、本開示の技術的思想の範囲と精神を逸脱することなく構成・構造の変更や多様な要素の置き換えが可能であることを理解する必要がある。従って、以降の記述をこれに限定して解釈してはならない。
[第1の実施の形態]
第1の実施の形態に係る電解質濃度測定装置10を、図1~図6を参照して説明する。図1は、第1の実施の形態に関わるフロー型の電解質濃度測定装置10の一例を示す概略図である。この電解質濃度測定装置10は、測定部100と、演算制御部200とから大略構成されている。この電解質濃度測定装置10は、検体の測定と内部標準液の測定とを交互に実行して電極間の電位差を測定し、電位差と検量線を用いて検体中の特定イオンの濃度を測定可能に構成されている。そして、この電解質濃度測定装置10は、後述するように、所定の動作を指示するタイミング信号と、電位変化を示す電位応答曲線とに基づき、電極等の物理的な劣化や、電磁弁のスローリークなどを含む、装置の異常を検知可能に構成されている。
第1の実施の形態に係る電解質濃度測定装置10を、図1~図6を参照して説明する。図1は、第1の実施の形態に関わるフロー型の電解質濃度測定装置10の一例を示す概略図である。この電解質濃度測定装置10は、測定部100と、演算制御部200とから大略構成されている。この電解質濃度測定装置10は、検体の測定と内部標準液の測定とを交互に実行して電極間の電位差を測定し、電位差と検量線を用いて検体中の特定イオンの濃度を測定可能に構成されている。そして、この電解質濃度測定装置10は、後述するように、所定の動作を指示するタイミング信号と、電位変化を示す電位応答曲線とに基づき、電極等の物理的な劣化や、電磁弁のスローリークなどを含む、装置の異常を検知可能に構成されている。
測定部100は、イオン選択性電極101、比較電極102、ピンチ弁103、希釈槽104、内部標準液用シリンジポンプ105、希釈液用シリンジポンプ106、シッパーシリンジポンプ107、内部標準液ボトル108、希釈液ボトル109、比較電極液ボトル110、廃液タンク111、及び真空ポンプ112を備えている。
イオン選択性電極101は、一例として、塩素イオン電極101A、カリウムイオン電極101B、及びナトリウムイオン電極101Cを備えている。イオン選択性電極101は、後述するように、希釈液と混合され希釈された検体液(希釈検体液)、又は内部標準液を希釈槽104からシッパーノズルN0を介して供給される。比較電極102は、後述するように比較電極液を供給される。比較電極液は、比較電極液ボトル110に格納されており、適宜電磁弁V1が設けられた流路を介して比較電極102に吐出される。なお以下の説明では、塩素イオン電極101A、カリウムイオン電極101B、及びナトリウムイオン電極101Cを総称して「イオン選択性電極101A~101C」のように称する場合もある。
ピンチ弁103は、イオン選択性電極101と比較電極102とを結ぶ流路の開放/遮断を切り換える。
希釈槽104は、希釈液で希釈された検体液、又は内部標準液が満たされる。内部標準液用シリンジポンプ105は、希釈槽104に向けて内部標準液を吐出するためのポンプである。内部標準液は、内部標準液ボトル108に格納されており、内部標準液用シリンジポンプ105により希釈槽104に吐出される。なお、内部標準液ボトル108と内部標準液用シリンジポンプ105を接続する流路には電磁弁V2が設けられ、内部標準液用ノズルN1には電磁弁V3が設けられる。内部標準液の吐出時には電磁弁V2及びV3は開弁される。なお、内部標準液用ノズルN1には、内部標準液を加熱するためのプリヒータ(図示せず)が設けられていてもよい。
希釈液用シリンジポンプ106は、希釈槽104に向けて希釈液を吐出するためのポンプである。希釈液は、希釈液ボトル109に格納されており、希釈液用シリンジポンプ106により希釈槽104に吐出される。なお、希釈液ボトル109と希釈液用シリンジポンプ106とを接続する流路には電磁弁V4が設けられ、シッパーノズルN2には電磁弁V5が設けられる。なお、シッパーノズルN2には、希釈液を加熱するためのプリヒータ(図示せず)が設けられていてもよい。なお、内部標準液用ノズルN1、及びシッパーノズルN2は、必要に応じて希釈槽104に対し挿脱可能に構成されている。
シッパーシリンジポンプ107は、希釈槽104から検体液等をイオン選択性電極101側に吸引する場合に動作するポンプである。シッパーシリンジポンプ107による検体液等の吸引動作が行われる場合、ピンチ弁103も開弁される。シッパーシリンジポンプ107が吸引した検体液は、廃液として廃液タンク111に向けて廃棄される。
また、シッパーシリンジポンプ107は、比較電極102に向けて比較電極液を吸引する場合、及び比較電極102から比較電極液を吸引し廃棄する場合においても動作する。その場合、比較電極102とシッパーシリンジポンプ107の間の流路の電磁弁V8、及びシッパーシリンジポンプ107と廃液タンク111の間の電磁弁V7は開弁させる一方で、ピンチ弁103は閉弁される。真空ポンプ112は、廃液タンク111から更に外部に廃液を排出する場合に動作する。
このようにして、イオン選択性電極101に検体液等が注入され、比較電極102に比較電極液が注入されると、イオン選択性電極101と比較電極102の間の電位差が生じる。この電位差は、イオン選択性電極101の流路に導入された液体の分析対象イオン濃度によって変化する。そのため、その電位差を計測することにより、分析対象のイオン(例えば、Cl、K、Na)の溶液中の濃度を算出することができる。
一方、演算制御部200は、電位測定部171、濃度算出部172、出力部174、装置制御部175、入力部176、電位監視部181、タイミング信号取得部182、電位応答曲線解析部183、及びデータ収納部184を備えている。
電位測定部171は、イオン選択性電極101A~101Cと比較電極102との間の電位差(起電力)を測定する機能を有する。より具体的には、電位測定部171は、イオン選択性電極101A~101Cの流路に液体を導入後から一定時間経過後の安定した電位を測定する機能を有する。濃度算出部172は、電位測定部171で演算された電位差に基づき、希釈検体液又は内部標準液中の特定イオン(Cl-、K+、Na+)の濃度を演算する。出力部174は、濃度算出部172での演算結果等を出力するためのディスプレイ等を備えている。装置制御部175は、測定部100に対する制御を司る。入力部176は、装置制御部175に向けて各種データ又は命令を入力するためのインタフェースである。
電位監視部181は、イオン選択性電極101A~101Cの電位を継続的に監視し、監視された電位の時間的変化を示す電位応答曲線を生成する。より具体的には、電位監視部181は、イオン選択性電極101A~101Cの流路への液体の導入から排出までの間の過渡的な電位の変化(電位応答曲線)を監視する機能を有する。ここで、「過渡的」とは、安定した測定電位を取得するタイミングとは異なり、各種部品の実際の動作や配管内の液体の流動や物質や液体の拡散などに起因して生じる電位の一時的な変化を意味する。また、タイミング信号取得部182は、装置制御部175が測定部100に向けて出力した各種タイミング信号を取得する。
電位応答曲線解析部183は、電位監視部181で生成された電位応答曲線を解析する機能を有する。また、電位応答曲線解析部183は、タイミング信号取得部182から前述のタイミング信号も取得し、電位応答曲線と関連付ける。より具体的には、電位応答曲線解析部183は、各種機構部の動作時及びその直後の電位応答曲線の波形から、電極の物理的な変化及び各種機構部の劣化の予兆を判断する。また、電位応答曲線解析部183は、液体の流路内での記液体の移動に関係する各種機構部の動作停止時における電位応答曲線の波形から、イオン選択性電極101のイオン感応膜の表面の汚染を判断する。
なお、比較電極102の流路に導入された比較電極液と、イオン選択性電極101に導入された希釈検体液(又は内部標準液)とは液絡部120で接触して液絡を形成する。この液絡が、イオン選択性電極101と比較電極102とを電気的に接続させる。このときに、各イオン選択性電極101と比較電極102との間の電位差(起電力)は、イオン選択性電極101の流路に導入された希釈検体液(又は内部標準液)の分析対象イオン濃度によって変化する。その起電力を電位測定部171で測定し、イオン濃度を濃度算出部172にて算出することができる。算出方法の詳細は後述する。
次に、第1の実施の形態に係る電解質濃度装置における測定の手順を、図2のフローチャートを参照して説明する。図2では、(a)において装置立ち上げ時の手順を示し、(b)において装置立ち上げ後において、検体と内部標準液とを交互に連続的に測定する場合(「連続分析」)の手順を示している。
まず、装置立上げ時の手順について図2(a)を参照して説明する。まず、図示しない電源を投入して装置10を立上げ(ステップS201)、試薬用のボトル108、109、110を設置する(ステップS202)。その後、試薬用のボトル内の試薬を、装置10内に初期充填(試薬プライム)する(ステップS203)。
温度調節の完了後、内部標準液の連続測定を行い(ステップS204)、電極の電位が安定していることを確認する。続いて、イオン選択性電極101A~101Cの検量線を求めるために、2種類の既知濃度(高濃度(H)、低濃度(L))の標準液を測定し、検量線のスロープ感度SLを算出する(ステップS205)。続いて、ステップS205で求められたスロープ感度SL、及び測定された起電力に基づいて、内部標準液の濃度Cisを算出する(ステップS206)。
上述のステップS201~S206における各種動作では、電解質濃度測定装置10内の各種ポンプ105~107、電磁弁、その他各種駆動部を動作させるためのタイミング信号が装置制御部175から出力される。タイミング信号は、タイミング信号取得部182において取得される。また、上記ステップS201~S206において、イオン選択性電極101A~101Cの電位が変動し、その変動は電位監視部181において監視される。監視された電位のデータは、タイミング信号取得部182にも送信され、タイミング信号と関連付けてデータ処理される。電位応答曲線解析部183は、この電位のデータに従い電位応答曲線を生成すると共に、タイミング信号と電位応答曲線とを関連付けて、各タイミングでの電位応答曲線の特徴を解析する。
ここで、ステップS205とS206の具体的な操作について説明する。既知低濃度(濃度CL)の標準液(L)を希釈槽104に分注後、更に希釈液用シリンジポンプ106を用いて希釈液ボトル109内の希釈液を希釈槽104に分注し、設定した割合D1で既知低濃度の標準液(L)を希釈する。
次に、シッパーシリンジポンプ107を動作させ、希釈槽104中の希釈した既知低濃度の標準液(L)を、シッパーノズルN0を介して吸引し、イオン選択性電極101A~101Cの流路に導入する。更に、比較電極液ボトル110内から比較電極102の流路に比較電極液を導入する。
液絡部120では、比較電極液と、希釈した既知低濃度の標準液(L)とが接触する。その後、イオン選択性電極101A~101Cと比較電極102との間の各電位差(既知低濃度標準液(L)の起電力EMFL)が電位測定部171により測定される。
既知低濃度の標準液(L)の起電力EMFLを測定している間に、希釈槽104に残存した標準液(L)は真空吸引ノズルN3で吸引されて廃液タンク111に廃棄される。その後、希釈槽104に内部標準液ボトル108内の内部標準液を、内部標準液用シリンジポンプ105を用いて新たに分注する。そして、希釈槽104内の内部標準液をシッパーシリンジポンプ107を用いて吸引し、イオン選択性電極101A~101Cの流路を内部標準液で満たす。続いて、比較電極液ボトル110から比較電極102の流路に比較電極液を導入する。
その後、既知低濃度の標準液の場合と同様に、内部標準液と比較電極液が満たされた状態におけるイオン選択性電極101A~101Cの起電力(内部標準液の測定起電力EMFIS)を電位測定部171で測定する。この内部標準液を測定している間に、希釈槽104に残存している内部標準液は、真空吸引ノズルN3で吸引されて廃液タンク111に廃棄される。その後、既知の濃度(CH)の標準液(H)を希釈槽104に分注後、希釈液用シリンジポンプ106を用いて希釈液ボトル109内の希釈液を希釈槽104に分注し、設定した割合D1で既知高濃度の標準液(H)を希釈する。
希釈槽104中の希釈した既知高濃度の標準液(H)をシッパーノズルN0から吸引し、イオン選択性電極101A~101Cの流路に導入する。更に、比較電極液ボトル110内から比較電極102の流路に比較電極液を導入する。
液絡部120では、比較電極液と、希釈した既知高濃度の標準液(H)とが接触する。その後、イオン選択性電極101A~101Cと比較電極102との間の各電位差(既知高濃度の標準液(H)の起電力EMFH)が電位測定部171で測定される。
既知高濃度の標準液(H)の起電力EMFHを測定している間に、希釈槽104に残存した標準液(H)は真空吸引ノズルN3で吸引されて廃液タンク111に廃棄される。その後、希釈槽104に内部標準液ボトル108内の内部標準液を、内部標準液シリンジポンプ105を用いて新たに分注する。そして、希釈槽104内の内部標準液をシッパーシリンジポンプ107を用いて吸引し、イオン選択性電極101A~101Cの流路を内部標準液で満たす。続いて、比較電極液ボトル110内から比較電極102の流路に比較電極液を導入する。その後、上記と同様に、イオン選択性電極101A~101Cの起電力を電位測定部171で測定する。希釈槽104に残存している内部標準液は、真空吸引ノズルN3で吸引されて廃液タンク111に廃棄される。
以上のようにして電位測定部171で測定された起電力EMFH、EMFLから、濃度算出部172において下記の式(1)を用いて、検量線のスロープ感度SLを算出する。
〔数1〕
SL=(EMFH-EMFL)/(LogCH-LogCL) ・・・・・・式(1)
〔数1〕
SL=(EMFH-EMFL)/(LogCH-LogCL) ・・・・・・式(1)
以上の操作により、キャリブレーションが行われる。なお、スロープ感度SLは、以下の式(2)(ネルンストの式)における2.303×(RT/zF)に相当する。
〔数2〕
E=E0+2.303×(RT/zF)×log(f×C)・・・・・式(2)
E0:測定系により定まる一定電位
z:測定対象イオンの価数
F:ファラデー定数
R:気体定数
T:絶対温度
f:活量係数
C:イオン濃度
E=E0+2.303×(RT/zF)×log(f×C)・・・・・式(2)
E0:測定系により定まる一定電位
z:測定対象イオンの価数
F:ファラデー定数
R:気体定数
T:絶対温度
f:活量係数
C:イオン濃度
スロープ感度SLは、絶対温度Tと測定対象イオンの価数zから計算で求めることができるが、より分析精度を高めるため、この第1の実施の形態では、上記のキャリブレーションを実行することによって電極に固有のスロープ感度SLを求めている。
また、内部標準液の濃度Cisは、内部標準液の測定起電力EMFISにより、以下の式(3)、(4)により求められる。
〔数3〕
Cis=CL×10a・・・・・・・・・・・・・・・・・・・式(3)
a=(EMFIS-EMFL)/SL ・・・・・・・・・・・式(4)
Cis=CL×10a・・・・・・・・・・・・・・・・・・・式(3)
a=(EMFIS-EMFL)/SL ・・・・・・・・・・・式(4)
以上、具体的なキャリブレーションの手順を説明したが、キャリブレーションの手順は上記のものには限定されない。上記の例では、既知低濃度の標準液の測定の後、既知高濃度の標準液の測定を実行しているが、この順序は逆であってもよい。
図2(a)のようにして装置の立ち上げが完了すると、続いて検体の分析が実行される。検体の分析においては、検体の分析と、内部標準液の分析とが交互に、連続的に実行される。
検体と内部標準液の連続分析の動作について、図2(b)を参照して説明する。キャリブレーション後、血清や尿などを検体として分析を行う。具体的には、検体を検体分注ノズル(図示せず)を用いて希釈槽104に分注後、希釈液用シリンジポンプ106を用いて希釈液ボトル109内の希釈液を希釈槽104に分注し、設定した割合D2で検体を希釈し、希釈検体液を生成する。希釈槽104中の希釈検体液をシッパーノズルN0から吸引し、イオン選択性電極101A~101Cの流路に導入する。加えて、比較電極液ボトル110から比較電極102の流路に比較電極液を導入する。
液絡部120では、比較電極液と希釈検体液が接触する。その後、イオン選択性電極101A~101Cと比較電極102との間の各電位差(検体の起電力EMFS)が電位測定部171により測定され、これにより希釈検体液の分析が行われる(ステップS211)。
希釈検体液の起電力を測定している間に、希釈槽104に残存した希釈検体液は真空吸引ノズルN3で吸引されて廃液タンク111に廃棄される。その後、希釈槽104に内部標準液ボトル108から内部標準液を内部標準液用シリンジポンプ105を用いて新たに分注する。そして、希釈槽104内の内部標準液をシッパーシリンジポンプ107を用いて吸引し、イオン選択性電極101A~101Cの流路を内部標準液で満たす。続いて、比較電極液ボトル110内から比較電極102の流路に比較電極液を導入する。その後、各電極の起電力を電位測定部171で測定し、内部標準液の分析を行う(ステップS212)。
このようにして、希釈検体液と内部標準液の分析が完了すると、その結果に従い、検体濃度が算出される。
スロープ感度SLと内部標準液の濃度Cisから、下記の計算式を用いて検体の濃度Csを算出する(ステップS213)。
スロープ感度SLと内部標準液の濃度Cisから、下記の計算式を用いて検体の濃度Csを算出する(ステップS213)。
〔数4〕
Cs=Cis×10b・・・・・・・・・・・・・・・・・・・・・・・式(5)
b=(EMFIS-EMFS)/SL ・・・・・・・・・・・・・・・式(6)
Cs=Cis×10b・・・・・・・・・・・・・・・・・・・・・・・式(5)
b=(EMFIS-EMFS)/SL ・・・・・・・・・・・・・・・式(6)
なお、以上の計算式は基本的なものである。本実施の形態の装置では、希釈検体液の測定の前後に、濃度一定の内部標準液の測定も実行する。そして、希釈検体液の測定値を、この内部標準液の測定値に基づいて補正する。このため、イオン選択性電極101A~101Cの感応膜の表面の変化や、温度変化などに起因する緩やかな電位変動(電位ドリフト現象)が起こっても、正確な測定が実現できる。
上述のステップS211~S213における各種動作では、電解質濃度測定装置10内の各種ポンプ105~107、電磁弁V1~V8、その他各種駆動部を動作させるためのタイミング信号が装置制御部175から出力される。タイミング信号は、タイミング信号取得部182において取得される。また、上記ステップS201~S206において、イオン選択性電極101A~101Cの電位が変動し、その変動は電位監視部181において継続的に監視される。監視された電位のデータである電位応答曲線のデータは、タイミング信号取得部182にも送信され、タイミング信号と関連付けてデータ処理される。電位応答曲線解析部183は、この電位応答曲線をタイミング信号と関連付けて、各タイミングでの電位応答曲線の特徴量を取得し、解析する。
図3は、電位監視部181で取得される電位応答曲線のグラフの一例を示す。このグラフは、横軸が時間、縦軸が電位を示しており、電位の高い方から順に、塩素イオン電極101Aの電位、ナトリウムイオン電極101Cの電位、カリウムイオン電極101Bの電位を示している。
図3のグラフにおいて、区間AとA’は希釈検体液又は内部標準液を測定している測定区間であり、区間Bは一時休止区間であり、測定区間への復帰動作を含む区間である。すなわち、区間AとA’とは、一時休止区間Bを挟んで連続的に実行される測定区間である。なお、図3では、2つの測定区間A、A’のみが示されているが、このような測定区間A、A’を複数回実行することができる。
一時休止区間Bを挟んで測定区間A、A’を連続的に実行する場合には、内部標準液と希釈検体液とが交互に分析の対象とされる。詳細な動作は後述するが、内部標準液や希釈検体液をイオン選択性電極101A~101Cに導入する際に、ピンチ弁103で流路を一旦遮断するが、この場合、イオン選択性電極101A~101Cが高い電位を示すことがある。また、希釈検体液と内部標準液との分節のためにエアギャップを導入するが、この場合にもイオン選択性電極101A~101Cの電位が大きく変動することがある。
図4は、電位監視部181で取得される測定区間Aにおける電位応答曲線の一部の拡大図と、タイミング信号取得部182で取得されたタイミング信号とを重ね合わせて表示している。
連続分析時は、内部標準液と希釈検体液とが交互にイオン選択性電極101A~101Cに導入される。電位測定部171では、電位が比較的安定したタイミング401、402で、それぞれ内部標準液と希釈検体液の電位が計測される。タイミング401、402では、それぞれ、1点のデータだけでなく、短い時間間隔で複数回にわたって電位を計測し、それらの平均値などを取ることもできる。
電位測定部171において電位が得られると、この電位のデータを用いて濃度算出部172にて検体の濃度が算出される。電位監視部181は、一例として10ms間隔(サンプリングレート)で電位を取得することができる。なお、電位監視部181での取得間隔は変更可能であるが、圧力変動時などの過渡的な電位を監視するためには、100msより短い間隔での取得が適している。
また、サンプリングレートが高すぎると、データサイズが膨大になるため、0.01ms以上の間隔での電位のデータを取得することが好適である。また、電位監視部181でのサンプリングレートは常に一定である必要はなく、適宜変更されてもよい。例えば、着目する装置部品や電極等が動作するタイミングにおいてのみ、電位監視部181でのサンプリングレートを特定の値に設定し、その他では異なる値に設定してもよい。また、着目する装置部品や電極の種類、又は動作の状況に応じて、サンプリングレートを変更してもよい。
また、劣化モードを設定し、状態変化が監視できるタイミングを予め定め、タイミング信号取得部182で該当するタイミングを得た前後の電位のみを電位監視部181で取得するようにしても良い。
ここで、図4を参照して、測定区間Aにおいて発生する各種動作の一例を、図4中の参照符号を引用して説明する。内部標準液の測定時は、内部標準液で満たされた希釈槽104内にシッパーノズルN0が降下し(415)、シッパーノズルN0の先端が希釈槽104中の内部標準液に進入する。その後、シッパーシリンジポンプ107が作動して、内部標準液が希釈槽104からシッパーノズルN0を介して吸引され(411)、イオン選択性電極101A~101Cの測定流路に導入される。
次にシッパーノズルN0を上昇させてその先端を内部標準液の液面から離脱させ(416)、その後シッパーシリンジポンプ107で吸引することでエアギャップを測定流路内に導入する(412)。その後、ピンチ弁を閉弁し(417)、再度シッパーシリンジポンプ107を作動させ、比較電極液ボトル110から比較電極液を吸引し(413)、比較電極液を比較電極102の流路に導入する。
その後、再度ピンチ弁を開弁し(418)、一定時間後に電位測定部171でイオン選択性電極101A~101Cの電位を計測する(401)。その間に、測定流路に繋がる電磁弁V8等を閉じ、シッパーシリンジポンプ107内の液体を排出する(414)。
また、図4の検体測定時も、内部標準液測定時と殆ど同様の動作が行われる。希釈槽104で検体が希釈液タンク109から供給される希釈液で希釈される。その後、希釈検体液で満たされた希釈槽104内にシッパーノズルN0が降下し(425)、シッパーノズルN0の先端が希釈槽104内の希釈検体液に進入する。その後、シッパーシリンジポンプ107が作動して、希釈検体液が希釈槽104からシッパーノズルN0を介して吸引され(421)、イオン選択性電極101A~101Cの測定流路に希釈検体液が導入される。
次にシッパーノズルN0を上昇させてその先端を希釈検体液の液面から離脱させ(426)、その後シッパーシリンジポンプ107で吸引することでエアギャップを測定流路内に導入する(422)その後、ピンチ弁を閉弁し(427)、再度シッパーシリンジポンプ107を作動させ、比較電極液ボトル110から比較電極液を吸引し(423)、比較電極液を比較電極102の流路に導入する。
その後、再度ピンチ弁を開弁し(428)、一定時間後に電位測定部171でイオン選択性電極101A~101Cの電位を計測する(402)。その間に、測定流路に繋がる電磁弁V8等を閉じ、シッパーシリンジポンプ107内の液体を排出する(424)。
その後、再度ピンチ弁を開弁し(428)、一定時間後に電位測定部171でイオン選択性電極101A~101Cの電位を計測する(402)。その間に、測定流路に繋がる電磁弁V8等を閉じ、シッパーシリンジポンプ107内の液体を排出する(424)。
上述のような各種部材の駆動開始及び終了などを指令するタイミング信号(411~428)が、タイミング信号取得部182において装置制御部175から取得される。取得されたタイミング信号は電位応答曲線解析部183に送られる。これら一連の動作がほぼ同時に行われる。なお、図4に具体的に示したタイミング信号以外にも、電磁弁V1~V8の開閉を指示するタイミング信号、希釈槽104内の分注操作を指示するタイミング信号、真空吸引操作を指示するタイミング信号なども装置制御部175から出力され、タイミング信号取得部182に取得される。また、電位監視部181は、図3における測定区間A、A’の連続分析時だけでなく、一時休止区間Bや、装置立上げ時やキャリブレーション時にも電位を監視するよう構成することができる。
図4のようにタイミング信号411~428と電位監視部181で得られる電位応答曲線とを時系列的に関連付けて記録することで、様々な情報が読み取れる。例えば、シッパーノズルN0の降下や上昇時には、希釈槽104内の液との接触や流路内の液の振動などに起因すると推測される電位変化が電位応答曲線に現れる。また、シッパーシリンジポンプ107の吸引・吐出動作によっても、各種電極やその他の構成部品に振動が伝達し、これにより電位応答曲線の電位が変化する。
このように、この第1の実施の形態の装置では、液の吸引・吐出、流路の切替え動作などが短い時間間隔で頻繁に実施されるため、電位監視部181で取得される過渡的な電位から、液中のイオン濃度や温度だけでなく圧力変動や振動、電気的ノイズなどの情報が得られる。
シッパーシリンジポンプ107を用いて希釈検体液や内部標準液を吸引した際は、液のイオン濃度変化に由来すると考えられる過渡的な応答曲線が見られる。さらに、ピンチ弁103でイオン溶液(希釈検体液又は内部標準液)の流路となるチューブを閉塞する場合には、当該流路においてイオン溶液の分断が生じ、電位の急激な上昇が見られる。
このように、各タイミング信号において、その際に動作の対象となる部品や電極の状態(劣化の程度、故障、その他)が、電位応答曲線の解析結果から明らかになる。例えば、ピンチ弁103の閉弁を指示するタイミング信号が出力された際に電位応答曲線に現れる電位変化に基づき、ピンチ弁103内のチューブの劣化の程度や、ピンチ弁103自体の故障の有無等を判断することができる。
また、シッパーシリンジポンプ107でイオン溶液を吸引や吐出したタイミングには、イオン溶液の移動、気泡の移動、圧力変動、電気的なノイズなどが電位の変化として現れる。その他、電磁弁のリークの度合の変化、シリンジポンプ105~107のシール部の劣化、イオン選択性電極101A~101Cの感応膜の物理的な性質の変化なども、タイミング信号との関連で検出することが可能である。このような劣化や変動に関する情報は、イオン選択性電極101A~101Cの測定電位には現れにくく、他のセンサを付加したとしても検出しにくい。しかし、この第1の実施の形態によれば、タイミング信号と電位応答曲線とが関連付けられ電位応答曲線解析部183において解析されるため、劣化の程度を電位応答曲線に従って容易に判定することができる。
また、内部標準液、内部標準液とは異なる既知の濃度を有するイオン溶液や妨害イオンを含むイオン溶液を、所定のタイミング信号と共にイオン選択性電極101A~101Cの流路に吸引した前後の電位応答曲線から、イオン選択性電極101A~101Cの感応膜表面の汚染状態を判断することができる。なお、イオン選択性電極101A~101Cの感応膜表面の汚染が疑われる測定結果が得られた場合、メンテナンス時に洗浄液で感応膜表面を含む電極流路を洗浄することにより、測定流路をリフレッシュさせることができる。
イオン選択性電極101A~101Cのいずれかの電位に特異な変化が検出された場合、イオン選択性電極101A~101Cのいずれかに劣化や故障の予兆が生じた可能性が高いと判断できる。一方、イオン選択性電極101A~101Cの全ての電位に同様の特異な変化が現れた場合、それはイオン選択性電極101A~101Cではなく、その他の装置中の部品、又は比較電極102に異常の予兆が生じた可能性が高いと判断できる。
電位応答曲線解析部183には、データ収納部184が設けられており、電位応答曲線の特徴量に関するライブラリデータが収納されている。ライブラリデータは、装置が正常の状態にある場合に得られるであろう標準的な電位応答曲線に関する各種特徴量に関するデータの集合である。電位応答曲線解析部183は、このライブラリデータの特徴量を、測定の結果得られた電位応答曲線の特徴量と、各タイミング信号が出力されたタイミングにおいて比較する。これにより、各種電極や装置部品の劣化、イオン選択性電極101A~101Cの感応膜の表面汚染などの状態を判断することができる。
ライブラリデータは、シミュレーションの結果として得られる標準的なデータであってもよいし、ユーザが最初に装置10を設置し動作させた直後に得られる電位応答曲線をライブラリデータとすることもできる。ライブラリデータは、その後に実行された測定の結果に基づいて適宜更新することも可能である。装置10の設置場所によって、環境などによる振動や電気ノイズなどが異なることがある。このため、装置10を実際に動作させてライブラリデータを得ることにより、異常予兆の精度が向上することが期待できる。また、ネットワーク経由などで、ライブラリのアップロードやダウンロードできるようにしても良い。
以上説明したように、第1の実施の形態の電解質濃度測定装置10では、各種動作のタイミングを示すタイミング信号と、イオン選択性電極の電位を計測して得られる電位応答曲線とを対応付けて取得し、これを解析することで、異常の兆候を検出し、予知することで測定電位に異常が現れる前にメンテナンスを計画し、その後計画に従ってメンテナンスを実行することができる。一例としては、電位応答曲線解析部183において、タイミング信号に起因する各種機構部の動作時及びその直後の電位応答曲線の波形から、イオン選択性電極101の物理的な変化及び各種機構部の劣化の予兆を判断することができる。また、電位応答曲線解析部183において、タイミング信号に起因する、液体の流路内での記液体の移動に関係する各種機構部の動作停止時における電位応答曲線の波形から、イオン選択性電極101のイオン感応膜の表面の汚染を判断することができる。
なお、電位応答曲線の解析方法として、時系列データの解析で使われる一般的な手法も使うことができ、機械学習やディープラーニングなどを用いることもできる。また、タイミング信号に従う各種部品や電極の動作によって影響される他の装置内の部品などの挙動を、装置構成や物理方程式などから予測又はシミュレートし、その結果を電位応答曲線の解析に用いることもできる。
図5を参照して、ナトリウムイオン電極101Cの電位に関する電位の監視及び異常予兆の判定の方法について具体的に説明する。図5は、保管期限が経過したナトリウムイオン電極101Ceにより所定の検体液を計測して得られた電位応答曲線(NA1)と、比較的新しい、保管期限が経過していないナトリウムイオン電極101Cnにより、同一の検体液を計測して得られた電位応答曲線(NA2)を示している。図5において、シッパーシリンジポンプ107の吸引・吐出し動作のタイミング、シッパーノズルN0の上昇・降下タイミング、ピンチ弁103の開閉動作のタイミングを指示するタイミング信号も併せて図示されている。
図5のグラフにおいては、古いナトリウムイオン電極101Ceのスロープ感度が59.2mV/桁であり、新しいナトリウムイオン電極101Cnのスロープ感度は60.0mV/桁であり、両方とも許容範囲内であった。また、古いナトリウムイオン電極101Ceにより得られた電位応答曲線NA1、及び新しいナトリウムイオン電極101Cnにより得られた電位応答曲線NA2のいずれによっても、許容範囲内の測定精度が得られた。
しかし、図5に示すように、シッパーノズルN0が降下後にシッパーシリンジポンプ107で検体液の吸引を開始した直後においては、電位応答曲線NA2に比べ電位応答曲線NA1の電位の変化は急峻であり、その後、徐々に電位が回復した。このとき、図5では図示していないが、塩素イオン電極101Aとカリウムイオン電極101Bの電位応答曲線に関しては、急峻な変化は確認されなかった。
以上説明した情報が得られた場合には、ナトリウムイオン電極101Ceの劣化が進んでいると判断することができる。この判断の結果は出力部174に出力される。出力部174は、オペレータに対し、次回の装置メンテナンス時に、ナトリウムイオン電極101Ceを交換するよう警報を出す。このように、測定精度は許容範囲内であるが、電位応答曲線の形状を解析することにより、異常の予兆があると判定できる。このようにして異常の予兆を検知することにより、オペレータはメンテナンス計画を的確に立案し、計画に従ってメンテナンスを実行することができる。
図6を参照して、塩素イオン電極101Aの電位に関する電位の監視及び異常予兆の判定の方法について具体的に説明する。図6は、イオン感応膜の表面状態として第1の状態を有する塩素イオン電極101Aeにより所定の検体液を計測して得られた電位応答曲線(Cl1)と、第1の状態とは異なる第2の状態を有する塩素イオン電極101Anにより、同一の検体液を計測して得られた電位応答曲線(Cl2)を示している。図6において、シッパーシリンジポンプ107の吸引・吐出し動作のタイミング、シッパーノズルN0の上昇・降下タイミング、ピンチ弁103の開閉動作のタイミングを指示するタイミング信号も併せて図示されている。また、この図6は、測定対象(サンプル)として、妨害イオンを含む水溶液を測定した場合のグラフである。
図6に示すように、シッパーノズルN0の降下後にシッパーシリンジポンプ107でサンプルの吸引を開始した直後では、塩素イオン電極101Ae、塩素イオン電極101Anとも、電位が急激に立ち上がった。これは、電極101Ae、101Anの流路内の液体が内部標準液からサンプルに置換されて液組成が変わったことによる。サンプル吸引動作の後半で、曲線Cl1は上に凸のピークを有する一方で、曲線Cl2はなだらかに上昇し、上に凸のピークは現れなかった。一方で、サンプルの濃度算出を行うタイミング402における測定電位は、曲線Cl1とCl2とで殆ど同一であった。このように、タイミング信号が出力されるタイミングにおける電位応答曲線における波形の形状的特徴(凸のピークの有無、その振幅、幅)を特徴量として算出し、基準値と比較することで、異常の予兆を判断することができる。
サンプル吸引時及び吸引後の電位応答曲線Cl1、Cl2の波形に相違が生じた理由は、塩素イオン電極101Ae、101Anのイオン感応膜表面の状態の相違、又は、イオン感応膜中のイオンバランスの相違に基づいたものと考えられる。
このように、測定電位を単純に測定したのみでは検知し難かった現象を、タイミング信号と電位応答曲線とを関連付けることにより、検知可能となることが分かる。
[第2の実施の形態]
次に、第2の実施の形態に係る第1の実施の形態に係る電解質濃度測定装置10を、図7~図8を参照して説明する。図7は、第2の実施の形態に関わるフロー型の電解質濃度測定装置10の一例を示す概略図である。第1の実施の形態(図1)と同一の構成要素に関しては同一の参照符号を付し、以下では重複する説明は省略する。
次に、第2の実施の形態に係る第1の実施の形態に係る電解質濃度測定装置10を、図7~図8を参照して説明する。図7は、第2の実施の形態に関わるフロー型の電解質濃度測定装置10の一例を示す概略図である。第1の実施の形態(図1)と同一の構成要素に関しては同一の参照符号を付し、以下では重複する説明は省略する。
この第2の実施の形態の電解質濃度測定装置10は、装置10内の挙動を検知する各種センサを備え、これらのセンサの検知信号を、タイミング信号取得部182において取得し、電位応答曲線解析部183において、タイミング信号、センサの検出信号、及び電位応答曲線の関連性に基づいて電位応答曲線を解析し、その結果に基づいて装置の異常予兆を判定する。センサの一例として、ここでは、配管内の気泡を検知する気泡センサ121と、シッパーシリンジポンプ107と液絡部120とを結ぶ流路に配置され流路の圧力を検知する圧力センサ122とを示している。センサの種類はこれに限定されるものではなく、例えば、希釈槽104等への液面の変化を検知する液面センサ、電極やその他各種部品の振動を検知する振動センサなどを装置10内に含めることができる。気泡センサ121は、所定サイズ以上の気泡が所定位置を通過した場合にパルス信号を発生させる。また、圧力センサ122は、測定箇所における圧力が所定値に達した場合にパルス信号を発生させる。これに限らず、圧力値を随時出力し続けても良い。
図8を参照して、第2の実施の形態の動作を説明する。図8は、電位監視部181で取得される測定区間Aにおける電位応答曲線の一部の拡大図と、タイミング信号取得部182で取得されたタイミング信号と、センサ検知信号とを重ね合わせて表示している。第1の実施の形態では、装置制御部175が出力するタイミング信号をタイミング信号取得部182で取得し、電位応答曲線と関連付けるが、第2の実施の形態では、タイミング信号に加えてセンサ121、122におけるセンサ検知信号も電位応答曲線と関連付ける。所定のセンサ検知信号が出力されるタイミングは、装置制御部175からタイミング信号が出力されるタイミングと関連している。このため、センサ検知信号をタイミング信号取得部182で取得することで、更に装置10の動作と電位応答曲線とを的確に関連付け、異常の予兆をより正確に判断することが可能になる。
本発明は上記実施形態に限定されるものではなく、様々な変形例が含まれる。例えば、上記実施形態は本発明を分かりやすく説明するために詳細に説明したものであり、必ずしも説明した全ての構成を備えるものに限定されるものではない。また、ある実施形態の構成の一部を他の実施形態の構成に置き換えることが可能であり、また、ある実施形態の構成に他の実施形態の構成を加えることも可能である。また、各実施形態の構成の一部について、他の構成の追加・削除・置換をすることが可能である。
101…イオン選択性電極、101A…塩素イオン電極、101B…カリウムイオン電極、101C…ナトリウムイオン電極、102…比較電極、103…ピンチ弁、104…希釈槽、105…内部標準液用シリンジポンプ、106…希釈液用シリンジポンプ、107…シッパーシリンジポンプ、108…内部標準液ボトル、109…希釈液ボトル、110…比較電極液ボトル、111…廃液タンク、112…真空ポンプ、120…液絡部、121…気泡センサ、122…圧力センサ、V1~V8…電磁弁、171…電位測定部、172…濃度算出部、174…出力部、175…装置制御部、176…入力部、181…電位監視部、182…タイミング信号取得部、183…電位応答曲線解析部、184…データ収納部。
Claims (6)
- 液体中のイオンの濃度を測定する電解質濃度測定装置において、
前記液体を供給されるイオン選択性電極と、
電位の基準となる比較電極と、
前記イオン選択性電極の電位を取得する電位測定部と、
前記電位測定部にて取得した電位から前記液体中に含まれるイオンの濃度を算出する濃度算出部と、
前記イオン選択性電極の電位を監視して電位応答曲線を生成する電位監視部と、
各種動作のタイミングに関するタイミング信号を取得するタイミング信号取得部と、
前記電位応答曲線及び前記タイミング信号の関連性に基づき装置の異常予兆を検知する電位応答曲線解析部と
を備える電解質濃度測定装置。 - 前記電位応答曲線解析部は、前記タイミング信号が得られたタイミングにおける前記電位応答曲線の特徴量を算出し、この特徴量に従って装置の異常予兆を検知する、請求項1に記載の電解質濃度測定装置。
- 前記電位応答曲線解析部は、
前記電位応答曲線の特徴量に関するライブラリデータを有し、前記ライブラリデータの特徴量を、電位応答曲線の特徴量と比較して装置の異常予兆を検知する、請求項2に記載の電解質濃度測定装置。 - 前記電位応答曲線解析部は、機構部の動作時及びその直後の前記電位応答曲線の波形から、電極の物理的な変化及び前記機構部の劣化の予兆を判断する、請求項1に記載の電解質濃度測定装置。
- 前記電位応答曲線解析部は、前記液体の流路内での前記液体の移動に関係する機構部の動作停止時における電位応答曲線の波形から、前記イオン選択性電極のイオン感応膜の表面の汚染を判断する、請求項1に記載の電解質濃度測定装置。
- 装置内の挙動を検知するセンサを更に備え、
前記電位応答曲線解析部は、前記電位応答曲線、前記タイミング信号、及び前記センサの検出信号の関連性に基づき異常予兆を検知する、請求項1に記載の電解質濃度測定装置。
Priority Applications (3)
| Application Number | Priority Date | Filing Date | Title |
|---|---|---|---|
| CN201980046965.5A CN112654862B (zh) | 2018-09-13 | 2019-09-02 | 电解质浓度测量装置 |
| EP19860479.5A EP3851842A4 (en) | 2018-09-13 | 2019-09-02 | DEVICE FOR MEASURING ELECTROLYTE CONCENTRATION |
| US17/265,698 US11782021B2 (en) | 2018-09-13 | 2019-09-02 | Electrolyte concentration measurement device |
Applications Claiming Priority (2)
| Application Number | Priority Date | Filing Date | Title |
|---|---|---|---|
| JP2018171277A JP6896684B2 (ja) | 2018-09-13 | 2018-09-13 | 電解質濃度測定装置 |
| JP2018-171277 | 2018-09-13 |
Publications (1)
| Publication Number | Publication Date |
|---|---|
| WO2020054473A1 true WO2020054473A1 (ja) | 2020-03-19 |
Family
ID=69776818
Family Applications (1)
| Application Number | Title | Priority Date | Filing Date |
|---|---|---|---|
| PCT/JP2019/034355 Ceased WO2020054473A1 (ja) | 2018-09-13 | 2019-09-02 | 電解質濃度測定装置 |
Country Status (5)
| Country | Link |
|---|---|
| US (1) | US11782021B2 (ja) |
| EP (1) | EP3851842A4 (ja) |
| JP (1) | JP6896684B2 (ja) |
| CN (1) | CN112654862B (ja) |
| WO (1) | WO2020054473A1 (ja) |
Cited By (4)
| Publication number | Priority date | Publication date | Assignee | Title |
|---|---|---|---|---|
| EP4001910A4 (en) * | 2019-07-19 | 2023-08-02 | Hitachi High-Tech Corporation | ANALYTICAL DEVICE AND ANALYTICAL METHOD |
| CN116783477A (zh) * | 2021-01-19 | 2023-09-19 | 株式会社日立高新技术 | 电解质分析装置及其异常判定方法 |
| US20250327769A1 (en) * | 2022-05-09 | 2025-10-23 | Hitachi High-Tech Corporation | Analyzing device, and state detecting method |
| WO2025258698A1 (ja) * | 2024-06-11 | 2025-12-18 | 株式会社日立ハイテク | 自動分析装置、異常検知システム及び異常検知方法 |
Families Citing this family (12)
| Publication number | Priority date | Publication date | Assignee | Title |
|---|---|---|---|---|
| WO2021024527A1 (ja) * | 2019-08-05 | 2021-02-11 | 株式会社日立ハイテク | 脱気装置及び電解質測定システム |
| JP7231576B2 (ja) * | 2020-03-09 | 2023-03-01 | 株式会社日立ハイテク | 電解質濃度測定装置 |
| WO2022185641A1 (ja) * | 2021-03-02 | 2022-09-09 | 株式会社日立ハイテク | 電解質測定装置、および電解質濃度測定ユニットの異常判定方法 |
| JP2023142443A (ja) * | 2022-03-25 | 2023-10-05 | 株式会社日立ハイテク | 電解質分析装置 |
| JPWO2024154466A1 (ja) * | 2023-01-16 | 2024-07-25 | ||
| CN120548477A (zh) * | 2023-05-30 | 2025-08-26 | 株式会社日立高新技术 | 自动分析装置以及分析槽的分配方法 |
| WO2025018126A1 (ja) * | 2023-07-19 | 2025-01-23 | 株式会社日立ハイテク | 分析装置および異常の有無を判定する方法 |
| US12601704B2 (en) | 2023-08-25 | 2026-04-14 | Analog Devices International Unlimited Company | System and method for measurement of ion concentration in fluid samples |
| WO2025045153A1 (zh) * | 2023-08-31 | 2025-03-06 | 深圳迈瑞生物医疗电子股份有限公司 | 样本分析仪及其电极组件的活化方法 |
| CN117607227B (zh) * | 2023-11-27 | 2024-06-21 | 南京机电职业技术学院 | 基于深度学习的电解质分析仪实时监测与异常预警方法 |
| WO2025182751A1 (ja) * | 2024-02-27 | 2025-09-04 | 京セラ株式会社 | 検出装置、推定システム、検出方法、検出装置の制御プログラム、記録媒体 |
| WO2025220386A1 (ja) * | 2024-04-15 | 2025-10-23 | 株式会社日立ハイテク | 電解質分析装置、制御方法 |
Citations (8)
| Publication number | Priority date | Publication date | Assignee | Title |
|---|---|---|---|---|
| US4189367A (en) * | 1978-10-19 | 1980-02-19 | Leeds & Northrup Company | Method for testing ion selective electrodes in continuous measuring systems |
| JPS62185161A (ja) * | 1986-02-12 | 1987-08-13 | Toshiba Corp | 電解質測定装置 |
| JPH0242349A (ja) * | 1988-08-03 | 1990-02-13 | Hitachi Ltd | 電解質濃度測定装置 |
| JPH0376161U (ja) * | 1989-11-29 | 1991-07-30 | ||
| JP2001004586A (ja) * | 1999-06-16 | 2001-01-12 | Hitachi Ltd | 電解質分析装置 |
| JP2004219352A (ja) | 2003-01-17 | 2004-08-05 | Toshiba Corp | 分析装置及び管理システム |
| JP2009121817A (ja) * | 2007-11-09 | 2009-06-04 | Olympus Corp | 分析装置 |
| JP2012042359A (ja) | 2010-08-19 | 2012-03-01 | Toshiba Corp | 自動分析装置 |
Family Cites Families (12)
| Publication number | Priority date | Publication date | Assignee | Title |
|---|---|---|---|---|
| JPS57199949A (en) * | 1981-06-03 | 1982-12-08 | Toshiba Corp | Deciding device for deterioration of ion selecting electrode |
| JPS5868656A (ja) * | 1981-10-20 | 1983-04-23 | Toshiba Corp | イオン濃度測定装置 |
| US4468608A (en) * | 1981-12-11 | 1984-08-28 | Instrumentation Laboratory Inc. | Electrochemical sensor instrumentation |
| JPS61173150A (ja) * | 1985-01-28 | 1986-08-04 | Shimadzu Corp | フロ−スル形イオンメ−タ |
| DE3668991D1 (de) * | 1986-04-15 | 1990-03-15 | Yokagawa Electrofact B V | Vorrichtung zur pruefung der vollstaendigkeit einer elektrode in einem potentiometrischen elektrodensystem. |
| JPH0643133A (ja) * | 1992-07-23 | 1994-02-18 | Toshiba Corp | 生化学分析装置 |
| KR100342165B1 (ko) * | 1999-03-25 | 2002-06-27 | 배병우 | 자기 진단기능을 갖는 소형 고체상 기준전극 |
| JP5331669B2 (ja) | 2009-12-08 | 2013-10-30 | 株式会社日立ハイテクノロジーズ | 電解質分析装置 |
| JP5965248B2 (ja) * | 2012-08-22 | 2016-08-03 | 株式会社日立ハイテクノロジーズ | 電解質分析装置 |
| JP6475405B2 (ja) * | 2013-05-07 | 2019-02-27 | 株式会社日立ハイテクノロジーズ | 電解質濃度測定装置およびそれを用いた測定方法 |
| US20160341692A1 (en) * | 2015-05-21 | 2016-11-24 | Jeol Ltd. | Electrolyte Measuring Apparatus and Electrolyte Measuring Method |
| JP6250105B2 (ja) * | 2016-07-01 | 2017-12-20 | 株式会社日立ハイテクノロジーズ | 電解質分析装置及び電解質分析方法 |
-
2018
- 2018-09-13 JP JP2018171277A patent/JP6896684B2/ja active Active
-
2019
- 2019-09-02 CN CN201980046965.5A patent/CN112654862B/zh active Active
- 2019-09-02 WO PCT/JP2019/034355 patent/WO2020054473A1/ja not_active Ceased
- 2019-09-02 EP EP19860479.5A patent/EP3851842A4/en active Pending
- 2019-09-02 US US17/265,698 patent/US11782021B2/en active Active
Patent Citations (8)
| Publication number | Priority date | Publication date | Assignee | Title |
|---|---|---|---|---|
| US4189367A (en) * | 1978-10-19 | 1980-02-19 | Leeds & Northrup Company | Method for testing ion selective electrodes in continuous measuring systems |
| JPS62185161A (ja) * | 1986-02-12 | 1987-08-13 | Toshiba Corp | 電解質測定装置 |
| JPH0242349A (ja) * | 1988-08-03 | 1990-02-13 | Hitachi Ltd | 電解質濃度測定装置 |
| JPH0376161U (ja) * | 1989-11-29 | 1991-07-30 | ||
| JP2001004586A (ja) * | 1999-06-16 | 2001-01-12 | Hitachi Ltd | 電解質分析装置 |
| JP2004219352A (ja) | 2003-01-17 | 2004-08-05 | Toshiba Corp | 分析装置及び管理システム |
| JP2009121817A (ja) * | 2007-11-09 | 2009-06-04 | Olympus Corp | 分析装置 |
| JP2012042359A (ja) | 2010-08-19 | 2012-03-01 | Toshiba Corp | 自動分析装置 |
Cited By (5)
| Publication number | Priority date | Publication date | Assignee | Title |
|---|---|---|---|---|
| EP4001910A4 (en) * | 2019-07-19 | 2023-08-02 | Hitachi High-Tech Corporation | ANALYTICAL DEVICE AND ANALYTICAL METHOD |
| US12474295B2 (en) | 2019-07-19 | 2025-11-18 | Hitachi High-Tech Corporation | Analysis device and analysis method |
| CN116783477A (zh) * | 2021-01-19 | 2023-09-19 | 株式会社日立高新技术 | 电解质分析装置及其异常判定方法 |
| US20250327769A1 (en) * | 2022-05-09 | 2025-10-23 | Hitachi High-Tech Corporation | Analyzing device, and state detecting method |
| WO2025258698A1 (ja) * | 2024-06-11 | 2025-12-18 | 株式会社日立ハイテク | 自動分析装置、異常検知システム及び異常検知方法 |
Also Published As
| Publication number | Publication date |
|---|---|
| EP3851842A4 (en) | 2022-05-18 |
| US20210318266A1 (en) | 2021-10-14 |
| US11782021B2 (en) | 2023-10-10 |
| CN112654862B (zh) | 2024-03-22 |
| JP6896684B2 (ja) | 2021-06-30 |
| EP3851842A1 (en) | 2021-07-21 |
| JP2020041968A (ja) | 2020-03-19 |
| CN112654862A (zh) | 2021-04-13 |
Similar Documents
| Publication | Publication Date | Title |
|---|---|---|
| JP6896684B2 (ja) | 電解質濃度測定装置 | |
| CN112666234B (zh) | 电解质浓度测定装置、电解质浓度测定方法 | |
| CN102648407B (zh) | 电解质分析装置的管理系统 | |
| CN114127549B (zh) | 分析装置以及分析方法 | |
| JP6890569B2 (ja) | 電解質測定装置 | |
| JP6945479B2 (ja) | 分析物濃度を決定する方法 | |
| JP2023142443A (ja) | 電解質分析装置 | |
| US20240159789A1 (en) | Automated analysis device | |
| WO2025018126A1 (ja) | 分析装置および異常の有無を判定する方法 | |
| CN111788479A (zh) | 自动分析装置、自动分析方法 | |
| US20250327769A1 (en) | Analyzing device, and state detecting method | |
| US12601711B2 (en) | Automated analysis apparatus | |
| US20250044208A1 (en) | Wettability evaluation device and method | |
| CN115087864B (zh) | 电解质浓度测定装置 | |
| JP6738717B2 (ja) | 分析処理システム及び分析処理方法 | |
| WO2022185641A1 (ja) | 電解質測定装置、および電解質濃度測定ユニットの異常判定方法 | |
| WO2025134483A1 (ja) | 自動分析装置、及び自動分析装置の電解質測定方法 | |
| US20240060931A1 (en) | Electrolyte analysis device and method for identifying abnormality in same | |
| CN117825471A (zh) | 样本分析仪及其控制方法 |
Legal Events
| Date | Code | Title | Description |
|---|---|---|---|
| 121 | Ep: the epo has been informed by wipo that ep was designated in this application |
Ref document number: 19860479 Country of ref document: EP Kind code of ref document: A1 |
|
| NENP | Non-entry into the national phase |
Ref country code: DE |
|
| ENP | Entry into the national phase |
Ref document number: 2019860479 Country of ref document: EP Effective date: 20210413 |