WO2020067464A1 - 標的の特性の予測を行うための方法、コンピュータシステム、プログラム - Google Patents
標的の特性の予測を行うための方法、コンピュータシステム、プログラム Download PDFInfo
- Publication number
- WO2020067464A1 WO2020067464A1 PCT/JP2019/038242 JP2019038242W WO2020067464A1 WO 2020067464 A1 WO2020067464 A1 WO 2020067464A1 JP 2019038242 W JP2019038242 W JP 2019038242W WO 2020067464 A1 WO2020067464 A1 WO 2020067464A1
- Authority
- WO
- WIPO (PCT)
- Prior art keywords
- data
- target
- burst
- activity data
- parameter set
- Prior art date
- Legal status (The legal status is an assumption and is not a legal conclusion. Google has not performed a legal analysis and makes no representation as to the accuracy of the status listed.)
- Ceased
Links
Images


Classifications
-
- G—PHYSICS
- G01—MEASURING; TESTING
- G01N—INVESTIGATING OR ANALYSING MATERIALS BY DETERMINING THEIR CHEMICAL OR PHYSICAL PROPERTIES
- G01N33/00—Investigating or analysing materials by specific methods not covered by groups G01N1/00 - G01N31/00
- G01N33/48—Biological material, e.g. blood, urine; Haemocytometers
- G01N33/483—Physical analysis of biological material
- G01N33/4833—Physical analysis of biological material of solid biological material, e.g. tissue samples, cell cultures
- G01N33/4836—Physical analysis of biological material of solid biological material, e.g. tissue samples, cell cultures using multielectrode arrays
-
- G—PHYSICS
- G01—MEASURING; TESTING
- G01N—INVESTIGATING OR ANALYSING MATERIALS BY DETERMINING THEIR CHEMICAL OR PHYSICAL PROPERTIES
- G01N21/00—Investigating or analysing materials by the use of optical means, i.e. using sub-millimetre waves, infrared, visible or ultraviolet light
- G01N21/62—Systems in which the material investigated is excited whereby it emits light or causes a change in wavelength of the incident light
- G01N21/63—Systems in which the material investigated is excited whereby it emits light or causes a change in wavelength of the incident light optically excited
- G01N21/64—Fluorescence; Phosphorescence
- G01N21/6428—Measuring fluorescence of fluorescent products of reactions or of fluorochrome labelled reactive substances, e.g. measuring quenching effects, using measuring "optrodes"
-
- G—PHYSICS
- G01—MEASURING; TESTING
- G01N—INVESTIGATING OR ANALYSING MATERIALS BY DETERMINING THEIR CHEMICAL OR PHYSICAL PROPERTIES
- G01N21/00—Investigating or analysing materials by the use of optical means, i.e. using sub-millimetre waves, infrared, visible or ultraviolet light
- G01N21/62—Systems in which the material investigated is excited whereby it emits light or causes a change in wavelength of the incident light
- G01N21/63—Systems in which the material investigated is excited whereby it emits light or causes a change in wavelength of the incident light optically excited
- G01N21/64—Fluorescence; Phosphorescence
- G01N21/645—Specially adapted constructive features of fluorimeters
- G01N21/6456—Spatial resolved fluorescence measurements; Imaging
- G01N21/6458—Fluorescence microscopy
-
- G—PHYSICS
- G16—INFORMATION AND COMMUNICATION TECHNOLOGY [ICT] SPECIALLY ADAPTED FOR SPECIFIC APPLICATION FIELDS
- G16C—COMPUTATIONAL CHEMISTRY; CHEMOINFORMATICS; COMPUTATIONAL MATERIALS SCIENCE
- G16C20/00—Chemoinformatics, i.e. ICT specially adapted for the handling of physicochemical or structural data of chemical particles, elements, compounds or mixtures
- G16C20/30—Prediction of properties of chemical compounds, compositions or mixtures
-
- G—PHYSICS
- G01—MEASURING; TESTING
- G01N—INVESTIGATING OR ANALYSING MATERIALS BY DETERMINING THEIR CHEMICAL OR PHYSICAL PROPERTIES
- G01N21/00—Investigating or analysing materials by the use of optical means, i.e. using sub-millimetre waves, infrared, visible or ultraviolet light
- G01N21/62—Systems in which the material investigated is excited whereby it emits light or causes a change in wavelength of the incident light
- G01N21/63—Systems in which the material investigated is excited whereby it emits light or causes a change in wavelength of the incident light optically excited
- G01N21/64—Fluorescence; Phosphorescence
- G01N21/6428—Measuring fluorescence of fluorescent products of reactions or of fluorochrome labelled reactive substances, e.g. measuring quenching effects, using measuring "optrodes"
- G01N2021/6439—Measuring fluorescence of fluorescent products of reactions or of fluorochrome labelled reactive substances, e.g. measuring quenching effects, using measuring "optrodes" with indicators, stains, dyes, tags, labels, marks
-
- G—PHYSICS
- G16—INFORMATION AND COMMUNICATION TECHNOLOGY [ICT] SPECIALLY ADAPTED FOR SPECIFIC APPLICATION FIELDS
- G16C—COMPUTATIONAL CHEMISTRY; CHEMOINFORMATICS; COMPUTATIONAL MATERIALS SCIENCE
- G16C20/00—Chemoinformatics, i.e. ICT specially adapted for the handling of physicochemical or structural data of chemical particles, elements, compounds or mixtures
- G16C20/70—Machine learning, data mining or chemometrics
Definitions
- the present invention relates to a method, a computer system, and a program for predicting a property of a target. More specifically, the present invention relates to a method for predicting characteristics of a target compound and the like.
- Non-Patent Document 1 a micro-electrode array (MEA) or the like and to examine the effect of a drug.
- MEA micro-electrode array
- An object of the present invention is to provide a method for predicting unknown properties of a target such as a target compound.
- the present invention provides, for example, the following items.
- (Item 1) A method for predicting a property of a target, (1) obtaining first data for a first object; (2) obtaining second data for the second object; (3) performing a multivariate analysis of the first data and the second data for all combinations of the candidate parameters in the candidate parameter set, and specifying a prediction parameter set; (4) A method comprising predicting the characteristic based on the prediction parameter set from target data for the target.
- the step (3) of specifying the prediction parameter set includes specifying the combination of the candidate parameters capable of separating the first target and the second target by the multivariate analysis as the prediction parameter set. 3.
- the target data is compared with the first data and the second data, and a characteristic of an object that has given data similar to the target data is defined as a characteristic of the target. 3.
- the method further comprising predicting a second characteristic from second target data for the target based on a second set of prediction parameters corresponding to the characteristic predicted in the step (4). 6. The method according to any one of 1 to 5.
- (Item 7) The method according to any one of items 1 to 6, wherein the multivariate analysis is a principal component analysis or a cluster analysis.
- Item 8 The method according to any one of items 1 to 7, wherein the target is a compound.
- Item 12 Item 12. The method according to Item 10 or 11, wherein the nerve cell is a neural stem cell.
- Item 15 Item 15. The method of item 14, wherein the basic activity parameters include TS, NoB, burst frequency, burst percentage, and interquartile range of burst length.
- (Item 16) Item 16. The method according to any of items 10 to 15, wherein the candidate parameter set includes an average value of a burst structure parameter.
- burst structure parameters include burst length, number of spikes during burst, IBI, IPI, PS, peak time percentage, average ISI within burst, central ISI within burst, central ISI within burst / average ISI. the method of.
- the parameters relating to the periodicity include burst length, number of spikes during burst, IBI, IPI, PS, peak time percentage, average ISI within burst, central ISI within burst, central ISI within burst / average ISI, and burst coefficient. 21.
- a method for predicting a property of a target Obtaining data for a first subject, a second subject and each of said targets; Performing a multivariate analysis on a set of prediction parameters for each data; Determining whether the data of the target is similar to the data of the first object or the data of the second object; If the data of the target is determined to be more similar to the data of the first object than the data of the second object, the characteristic of the first object is identified as the characteristic of the target And b.
- a computer system for predicting a property of a target comprising: Means for receiving first data for a first object and second data for a second object; Means for performing a multivariate analysis of the first data and the second data for all combinations of each candidate parameter in the candidate parameter set; Means for specifying a prediction parameter set based on the result of the multivariate analysis, Means for predicting the characteristic based on the prediction parameter set from target data for the target.
- a program for predicting a characteristic of a target wherein the program is executed in a computer system including a processor, wherein the program includes: (1) receiving first data for a first object; (2) receiving second data for a second object; (3) performing a multivariate analysis of the first data and the second data for all combinations of the candidate parameters in the candidate parameter set to specify a prediction parameter set; (4) predicting the characteristic based on the set of prediction parameters from target data for the target.
- a computer system for predicting a property of a target comprising: Means for receiving data for a first object, a second object and each of the targets; Means for performing a multivariate analysis on a set of prediction parameters for each data, Means for determining whether the data of the target is similar to the data of the first object or the data of the second object; If the data of the target is determined to be more similar to the data of the first object than the data of the second object, the characteristic of the first object is identified as the characteristic of the target Computer system comprising:
- a program for predicting a characteristic of a target wherein the program is executed in a computer system including a processor, wherein the program includes: Receiving data for a first subject, a second subject, and each of the targets; Performing a multivariate analysis on a set of prediction parameters for each data; Determining whether the data of the target is similar to the data of the first object or the data of the second object; If the data of the target is determined to be more similar to the data of the first object than the data of the second object, the characteristic of the first object is identified as the characteristic of the target And causing the processor to execute a process including the step of:
- a target such as a target compound (for example, toxicity to the nervous system and efficacy).
- FIG. 1 is a block diagram showing an example of a configuration of a computer system 100 for predicting characteristics of a target compound of the present invention.
- FIG. 2 is a block diagram illustrating an example of a configuration of a processor 120. The figure explaining an example of the candidate parameter contained in a candidate parameter set.
- A A diagram in which a raster plot image is combined with a histogram generated from the raster plot image.
- B A diagram showing a power spectrum derived by performing a discrete Fourier transform (DFT) on the histogram of (a). The figure which shows an example of Dominant @ frequency @ band.
- the bar graph which shows the value of Periodicity and NoB when the value before compound administration is set to 100%.
- FIG. 1 is a block diagram showing an example of a configuration of a computer system 100 for predicting characteristics of a target compound of the present invention.
- FIG. 2 is a block diagram illustrating an example of a configuration of a processor 120. The figure explaining an example of the candidate parameter contained
- FIG. 4 is a diagram schematically illustrating an example of a waveform image decomposed into a plurality of frequency components.
- 5B is a graph illustrating an example of a result of calculating the intensity for each frequency component in FIG. 5A.
- 3 is an example of a principal component plot of a first known compound, a second known compound, and a target compound. The figure which shows an example of the result at the time of performing a cluster analysis with respect to the 1st-11th known compounds and the object compound A and the object compound B.
- 9 is a flowchart showing an example of processing in the computer system 100 for predicting characteristics of a target compound.
- 11 is a flowchart illustrating an example of a process in which the processor 120 predicts characteristics of a target compound in step S704.
- FIG. 9 is a flowchart showing an example of processing in the computer system 100 for predicting characteristics of a target compound.
- target compound refers to a compound whose properties are to be predicted.
- the target compound may be an unknown compound or a known compound.
- the properties of the subject compound include, but are not limited to, for example, efficacy, toxicity, and mode of action.
- “medicinal effect” refers to an effect that results when a drug is applied to a subject.
- the drug is an anti-cancer drug
- the efficacy could be directly related to the reduction of cancer area under X-ray observation, delay of cancer progression, and prolongation of the survival time of cancer patients. It may be an effect or an indirect effect such as a decrease in a biomarker correlated with the progression of cancer.
- “efficacy” is intended to mean an effect under any applicable conditions.
- the efficacy may be an effect in a specific subject (eg, a man over 80 years old) or a specific application condition (eg, other anti-cancer therapy). Under the combined use with).
- an agent may have a single efficacy or multiple efficacies.
- the agents may have different efficacy under different application conditions. In general, efficacy refers to the effect aimed at achieving.
- toxicity is an unfavorable effect that occurs when a drug is applied to a subject.
- toxicity is an effect that is different from the intended effect of a drug.
- Toxicity may occur with a different mechanism of action than the effect or with the same mechanism of action as the effect.
- the drug is an anticancer drug
- the hepatotoxicity due to normal hepatocyte killing may occur at the same time as the efficacy of cancer cell killing through the mechanism of action of cell growth suppression
- the toxicity of neurological dysfunction via the mechanism of action of membrane stabilization may occur simultaneously with the efficacy of cancer cell killing through the mechanism of action of inhibition.
- mechanism of action is the manner in which an agent interacts with a biological mechanism. For example, if the drug was an anticancer drug, the mechanism of action would be to activate the immune system, kill fast-growing cells, block proliferative signaling, block certain receptors, and block specific genes. There can be various levels of events, such as transcription inhibition. Once the mechanism of action is identified, the efficacy, toxicity and / or appropriate mode of use can be predicted based on the accumulated information.
- the present inventors have developed a method for predicting the properties of a target compound using multivariate analysis in order to evaluate the properties of the target compound on the nervous system in a non-clinical test.
- a prediction parameter set suitable for separating the response of a known compound is obtained. Can be derived.
- the prediction parameter set and analyzing activity data acquired when the target compound is administered to nerve cells it is predicted which characteristics of the target compound are similar to those of which known compound.
- a plurality of known compounds each having a property to be separated (for example, when separating the property of “toxicity”, a known compound A having a property of “toxic” and a known compound having a property of “no toxicity”
- a prediction parameter set capable of separating its characteristics is derived.
- activity data obtained when the target compound is administered to nerve cells using this prediction parameter set, it can be determined whether the property of the target compound is “toxic” or “non-toxic”. Can be predicted.
- the target compound By deriving a set of predictive parameters according to the property to be separated, it is possible to determine whether the target compound has any medicinal effect, or has any toxicity, or has a mechanism of action. Be able to predict. This makes it possible to predict the efficacy, toxicity, and mechanism of action of the target compound in a non-clinical test. For example, by performing an analysis using human iPS cells, the action and toxicity of the compound on the human nervous system can be predicted, and the development of pharmaceuticals and the development of all compounds can be realized quickly and at low cost.
- the target compound has an expected mechanism of action in the predicted efficacy, or a predicted toxicity, also predicts and has an action mechanism in the output. be able to.
- the target compound has an expected mechanism of action in the predicted efficacy, or a predicted toxicity, also predicts and has an action mechanism in the output. be able to.
- a known compound when used as the target compound, it becomes possible to perform drug repositioning of the known compound. That is, a new drug effect of the known compound can be found based on the drug effect, toxicity, and mechanism of action predicted by analyzing activity data obtained when the known compound is administered to nerve cells. . As a result, a new drug effect of a known compound can be found in a non-clinical test, and the development cost of a therapeutic drug can be significantly reduced.
- the derived prediction parameter set when deriving the prediction parameter set, the difference between cell types, the difference between samples, or by using data having a difference between facilities, the derived prediction parameter set, the difference between cell types, the difference between samples, It does not depend on the difference between facilities. This makes it possible to construct a unified drug evaluation system using neural activity data.
- ⁇ ⁇ Predicting the characteristics of a target compound using such multivariate analysis can be realized by, for example, a computer system for predicting the characteristics of a target compound described below.
- FIG. 1 shows an example of a configuration of a computer system 100 for predicting properties of a target compound of the present invention.
- the computer system 100 includes a receiving unit 110, a processor 120, a memory 130, and an output unit 140.
- the computer system 100 can be connected to the database unit 200.
- the receiving means 110 is configured to be able to receive data from outside the computer system 100.
- the receiving unit 110 may, for example, receive data from outside the computer system 100 via a network, or receive data from a storage medium (for example, a USB memory, an optical disk, or the like) connected to the computer system 100 or a database unit 200. May be received.
- a storage medium for example, a USB memory, an optical disk, or the like
- the receiving unit 110 may receive data using a wireless LAN such as Wi-Fi, for example, or may receive data via the Internet.
- the receiving means 110 receives, for example, activity data of a nerve cell for a known compound or a target compound.
- the nerve cell activity data is data that can be obtained by any known technique.
- the activity data of nerve cells is, for example, potential data measured using a micro-electrode array (MEA).
- the potential data is obtained by, for example, culturing a nerve cell on the MEA and measuring an action potential and a synaptic current component of the nerve cell when a known compound or a target compound is administered to the cultured nerve cell.
- a CMOS-MEA using CMOS may be used as the MEA.
- the use of the CMOS-MEA makes it possible to acquire relatively high-resolution data.
- Activity data of a nerve cell is, for example, potential data measured using a multipoint electrode. This potential data is obtained, for example, by puncturing a multipoint electrode into the brain of an animal in an animal experiment and measuring the action potential of a nerve cell when a known compound or a target compound is administered.
- the activity data of the nerve cells may be, for example, image data acquired by an optical measurement method.
- the optical measurement method is, for example, a Ca 2+ imaging method.
- Image data is obtained by imaging the state of the activity of the nerve cell when the known compound or the target compound is administered to the nerve cell by the Ca 2+ imaging method.
- the optical measurement method is, for example, a membrane potential imaging method using a membrane potential sensitive dye.
- image data is obtained by imaging the state of activity of a nerve cell when a known compound or a target compound is administered to the nerve cell by a membrane potential imaging method.
- MEA it may be preferable to use MEA from the viewpoint of time resolution. This is because the MEA has a higher time resolution and can accurately detect individual spikes as compared with the Ca 2+ imaging method and the membrane potential imaging method, and the amount of information of the obtained activity data increases. Membrane potential imaging has a higher temporal resolution than Ca 2+ imaging.
- MEA is more non-invasive than Ca 2+ imaging and membrane potential imaging
- Ca 2+ imaging or membrane potential imaging from the viewpoint of cell resolution. Since the Ca 2+ imaging method or the membrane potential imaging method can mark all cells by microscopic observation, the spatial resolution is higher than that of MEA, and a raster plot image can be easily created in subsequent processing. is there.
- the receiving unit 110 may receive, for example, an image obtained by converting activity data of a nerve cell for a known compound or a target compound.
- the converted image may be, for example, activity data of nerve cells obtained as potential data, or a raster plot image obtained by converting activity data of nerve cells obtained as image data, and may be obtained as potential data.
- Activity data of nerve cells may be a histogram obtained by converting the activity data of nerve cells obtained as image data, even if it is a waveform image converted from the activity data of nerve cells obtained as potential data It is often a frequency intensity map or a spectrum intensity map converted by performing frequency component analysis (for example, wavelet transform, Fourier transform (for example, fast Fourier transform (FFT))) on the activity data of a nerve cell acquired as potential data.
- the spectral intensity map may be, for example, potential data.
- the acquired activity data of the nerve cells may be converted into a waveform (or a frequency-divided waveform), and the waveform divided at a predetermined time interval (for example, 1 second interval) may be acquired by FFT, where frequency division is performed.
- the waveform refers to a waveform obtained by extracting a specific frequency band component.
- the specific frequency band component is, for example, a ⁇ wave band component (about 4 to about 8 Hz) and an ⁇ wave band component (about 8 to about 13 Hz). , ⁇ -band component (about 13 to about 30 Hz), ⁇ -band component (about 30 to about 100 Hz), etc.
- the frequency band component may be a ⁇ -band component.
- the frequency band component may be an ⁇ -wave band component.
- the frequency band component may be a ⁇ -wave band component.
- the component is the ⁇ -wave band component
- the use of frequency-divided waveforms enables analysis focusing on phenomena found in living organisms, such as the frequency division of gamma-band components because the gamma-band components of brain waves are enhanced during epileptic seizures.
- By using the waveform it becomes possible to analyze characteristics of the target compound related to epileptic seizure.
- the nerve cells are, for example, neural stem cells.
- the neural stem cell may be, for example, an animal neural stem cell or a human god neural stem cell.
- Neural stem cells are, for example, iPS cells.
- the nerve cell may be, for example, a primary nerve cell collected from an animal.
- the data received by the receiving means 110 is passed to the processor 120 for the subsequent processing.
- the processor 120 controls the operation of the entire computer system 100.
- the processor 120 reads out a program stored in the memory 130 and executes the program. Thereby, it is possible to cause the computer system 100 to function as a device that executes a desired step.
- Processor 120 may be implemented by a single processor, or may be implemented by multiple processors.
- the data processed by processor 120 is passed to output means 140 for output.
- the memory 130 stores a program for executing a process in the computer system 100, data required for executing the program, and the like.
- the memory 130 stores, for example, a program for predicting the characteristics of the target compound (for example, a program for realizing the processes shown in FIGS. 7, 8, and 9 described below).
- the memory 130 may store an application that implements an arbitrary function. For example, a program for converting received potential data or image data into a raster plot image, a histogram, a waveform image, or the like may be stored.
- the program may be preinstalled in the memory 130.
- the program may be installed in the memory 130 by being downloaded via a network.
- the memory 130 can be implemented by any storage means.
- the output unit 140 is configured to be able to output data to the outside of the computer system 100. It does not matter in what manner the output means 140 enables the computer system 100 to output information. For example, when the output unit 140 is a display screen, information may be output to the display screen. Alternatively, when the output unit 140 is a speaker, the information may be output by voice from the speaker. Alternatively, when the output unit 140 is a data writing device, the information may be output by writing the information to a storage medium or the database unit 200 connected to the computer system 100. Alternatively, when the output unit 140 is a transmitter, the transmitter may output the information by transmitting the information to the outside of the computer system 100 via a network. In this case, the type of network does not matter.
- the transmitter may transmit information via the Internet or may transmit information via a LAN.
- the output unit 140 converts the data into a format that can be handled by the hardware or software to which the data is output, or adjusts the data to a response speed that can be handled by the hardware or software to which the data is output, and outputs the data. You may make it.
- the database unit 200 connected to the computer system 100 may store, for example, activity data of nerve cells for known compounds. Neuronal activity data for a known compound may be stored in association with characteristics of the known compound. In the database unit 200, for example, activity data of a nerve cell with respect to the target compound can be stored. The database unit 200 may store, for example, data output by the computer system 100 (for example, predicted characteristics of the target compound). The database unit 200 may store the specified prediction parameters. The database unit 200 may store the result data of the multivariate analysis of the nerve cell activity data for the known compound and / or the nerve cell activity data for the target compound. The activity data of a nerve cell with respect to a known compound or a target compound stored in the database unit 200 may be stored, for example, after excluding outlier data.
- the database unit 200 is provided outside the computer system 100, but the present invention is not limited to this.
- the database unit 200 can be provided inside the computer system 100.
- the database unit 200 may be implemented by the same storage as the storage that implements the memory 130, or may be implemented by a storage that is different from the storage that implements the memory 130.
- the database unit 200 is configured as a storage unit for the computer system 100.
- the configuration of the database unit 200 is not limited to a specific hardware configuration.
- the database unit 200 may be configured by a single hardware component, or may be configured by a plurality of hardware components.
- the database unit 200 may be configured as an external hard disk device of the computer system 100, or may be configured as a storage on a cloud connected via a network.
- FIG. 2 shows an example of the configuration of the processor 120.
- the processor 120 includes at least a multivariate analysis unit 121, a prediction parameter identification unit 122, and a prediction unit 123.
- the multivariate analysis means 121 is configured to perform a multivariate analysis on the input data.
- the multivariate analysis means 121 performs a multivariate analysis on the received nerve cell activity data for the first known compound and the received nerve cell activity data for the second known compound.
- the multivariate analysis is, for example, a principal component analysis.
- the principal component analysis at least a first principal component and a second principal component of the data can be calculated.
- the third principal component, the fourth principal component,..., The (n ⁇ 1) th principal component may be calculated by principal component analysis (where n is the number of dimensions of the input data).
- the multivariate analysis is, for example, cluster analysis. Cluster analysis allows data to be categorized into multiple clusters.
- the Ward method can be used as an algorithm for cluster analysis, and an average distance, a distance between centroids, a maximum distance, and a shortest distance can also be used.
- the Euclidean distance can be used as an index for determining the similarity
- the Mahalanobis distance and Spearman's rank correlation can also be used.
- a cosine similarity may be used as an index for determining the similarity.
- a combination of the Euclidean distance and the cosine similarity can be used as an index for determining the similarity.
- the threshold value of the index for determining the similarity can be set to an arbitrary value according to the data.
- the data input to the multivariate analysis means 121 includes, for example, a plurality of data when the same compound is administered to different cell types, and a plurality of data when the same compound is administered to the same cell type supplied from different vendors.
- Data, multiple data when the same compound is administered to samples from different lots supplied by the same vendor, multiple data when the same compound is administered to samples supplied from the same vendor on different days May contain multiple data when the same compound is tested at different centers.
- the prediction parameter specifying means 122 described later specifies a prediction parameter set that does not depend on the difference between samples, the difference between cell types, and the difference between facilities. Will be able to
- the data input to the multivariate analysis means 121 may be, for example, nerve cell activity data for a known compound or a target compound, or an image obtained by converting the data.
- the converted image may be, for example, activity data of nerve cells obtained as potential data, or a raster plot image obtained by converting activity data of nerve cells obtained as image data, and may be obtained as potential data.
- Activity data of nerve cells or may be a histogram obtained by converting the activity data of nerve cells obtained as image data, even if it is a waveform image converted from the activity data of nerve cells obtained as potential data
- a frequency intensity map obtained by performing frequency component analysis (for example, wavelet transform) on nerve cell activity data acquired as potential data may be used.
- the converted image may be, for example, an image received by the receiving unit 110 or an image converted by the processor 120 at a stage prior to the multivariate analyzing unit 121.
- the multivariate analysis means 121 for example, for all combinations of each candidate parameter in the candidate parameter set, multiply the nerve cell activity data for the first known compound and the nerve cell activity data for the second known compound. Perform a variate analysis.
- the multivariate analysis means 121 may perform a multivariate analysis on the activity data of nerve cells for three or more compounds for all combinations of the candidate parameters in the candidate parameter set.
- the parameter set for multivariate analysis must include three or more candidate parameters because multivariate analysis cannot be performed with two or less candidate parameters. For example, if the candidate parameter set consists of 10 candidate parameters, all combinations of each candidate parameter result in 968 parameter sets (each parameter set includes 3 to 10 candidate parameters). At this time, the multivariate analysis means 121 performs a multivariate analysis on the activity data of the nerve cell for the first known compound and the activity data of the nerve cell for the second known compound for each of the 968 parameter sets. .
- FIG. 3 is a diagram illustrating an example of candidate parameters included in a candidate parameter set.
- the graph in FIG. 3 is a diagram in which a raster plot image and a histogram generated from the raster plot image are combined, in which a raster plot image is shown below the graph and a histogram is shown above the graph. .
- the vertical axis indicates electrodes
- the horizontal axis indicates time
- the black plot indicates spikes.
- the vertical axis indicates the number of spikes per second
- the horizontal axis indicates time.
- TS total number
- the candidate parameters include, for example, basic activity parameters.
- the basic activity parameters are ⁇ TS, ⁇ NoB, Burst Frequency (burst frequency: NoB / measurement time (s)), Burst percentage (burst percentage: number of spikes during firing of all synchronous bursts / TS), and Burst Duration Interquartile Range (quartile range of burst length). including.
- basic activity parameters particularly parameters such as TS and NoB
- multivariate analysis is performed including the concept of increasing or decreasing the neural network activity. The effect is that the response of the compound can be separated using the and direction as indices.
- the basic activity parameter can be effective and essential for separation of a compound in which a compound response is remarkably observed in increasing or decreasing the number of firings, the number of burst firings, or the like.
- the candidate parameters include, for example, the average value of the burst structure parameters in all bursts.
- the burst structure parameter is a parameter related to synchronous burst firing, for example, ⁇ Burst length, ⁇ Number of spikes during burst, ⁇ IBI, ⁇ IPI, ⁇ PS, Peak time percentage (percentage of peak time: the time when a peak spike appears in a burst when the burst length is 100%, expressed in%.
- Mean ISI with Burst mean ISI with Burst: average value of ISI (inter spike interval: spike interval) within burst), Median ISI with Burst (central ISI in burst: median ISI in burst), Median / mean ISI with Burst (central ISI within burst / average ISI: median / average ISI within burst) including.
- burst structure parameter in the candidate parameter set, multivariate analysis is performed so as to separate the compound response in which the burst structure parameter is changed, so that the dose-dependent change of the compound can be detected, and the compound response can be separated. And the effect of improving the accuracy of the mechanism of action prediction is obtained.
- Candidate parameters include, for example, burst structure parameters (eg, burst length, number of spikes in burst, IBI, IPI, PS, peak time percentage, average ISI in burst, central ISI in burst, central ISI in burst / average ISI) Or at least one) standard deviation or median absolute deviation over all bursts.
- burst structure parameters eg, burst length, number of spikes in burst, IBI, IPI, PS, peak time percentage, average ISI in burst, central ISI in burst, central ISI in burst / average ISI
- Candidate parameters include, for example, burst structure parameters (eg, burst length, number of spikes in burst, IBI, IPI, PS, peak time percentage, average ISI in burst, central ISI in burst, central ISI in burst / average ISI) (At least one) of all bursts.
- burst structure parameters eg, burst length, number of spikes in burst, IBI, IPI, PS, peak time percentage, average ISI in burst, central ISI in burst, central ISI in burst / average ISI
- the candidate parameters include parameters related to periodicity.
- the parameter related to periodicity includes, for example, Periodicity (periodicity parameter).
- Periodicity (periodicity parameter) is represented by the following equation.
- the All frequency band is the total bandwidth of frequencies included when frequency analysis is performed on the histogram of the number of spikes, and is, for example, about 5 Hz.
- Dominant frequency band is a bandwidth of a frequency at which power when a frequency analysis is performed on a histogram of the number of spikes exceeds a threshold value.
- Periodicity (periodicity parameter) is derived, for example, as shown in FIGS. 4A to 4C.
- FIG. 4A-a is a diagram in which a raster plot image is combined with a histogram generated from the raster plot image.
- the raster plot image is shown below the graph, and the histogram is shown above the graph. .
- the vertical axis indicates electrodes
- the horizontal axis indicates time
- the black plot indicates spikes.
- the vertical axis indicates the number of spikes per second
- the horizontal axis indicates time.
- raster plot images and histograms when vehicle was administered raster plot images and histograms when compound was administered at about 0.1 ⁇ M
- 5 shows a raster plot image and a histogram when the compound is administered at 1 ⁇ M
- FIG. 4A-b show power spectra derived by performing a discrete Fourier transform (DFT) on the histogram of FIG. 4A-a.
- the vertical axis indicates power, and the horizontal axis indicates frequency. From the top, the power spectrum when the vehicle is administered, the power spectrum when the compound is administered at about 0.1 ⁇ M, the power spectrum when the compound is administered at about 0.3 ⁇ M, and the power when the compound is administered at about 1 ⁇ M 5 shows the spectrum, the power spectrum when the compound was administered at about 3 ⁇ M, and the power spectrum when the compound was administered at 10 ⁇ M.
- DFT discrete Fourier transform
- a bandwidth of a frequency band exceeding the threshold is defined as Dominant frequency band, and The entire bandwidth of the frequency included in the spectrum is defined as an All frequency band.
- Periodicity can be calculated for each of the power spectra of FIGS. 4A-b. For example, as shown in FIG. 4B, when a plurality of bandwidths exceed a threshold, Dominant The value of the frequency band is the sum of a plurality of bandwidths.
- FIG. 4C is a bar graph showing the values of Periodicity and NoB when the value when the vehicle was administered was taken as 100%.
- a black bar graph shows the value of Periodicity
- a white bar graph shows the value of NoB.
- the value of NoB hardly changes according to the concentration of the compound, while the value of Periodicity greatly changes according to the concentration of the compound. That is, it can be said that the value of Periodicity is an index reflecting the change in density.
- the parameters related to the periodicity are, for example, burst structure parameters (for example, burst length, number of spikes during burst, IBI, IPI, PS, peak time percentage, average ISI within burst, central ISI within burst, central ISI within burst / average ISI). (At least one of them).
- burst structure parameters for example, burst length, number of spikes during burst, IBI, IPI, PS, peak time percentage, average ISI within burst, central ISI within burst, central ISI within burst / average ISI.
- the parameter relating to the periodicity is, for example, an average value, a standard deviation, a standard error, a median value, a median absolute deviation, or a variation of CV ISI within Burst (CV ISI in a burst: coefficient of variation of ISI in a burst) in all bursts.
- a coefficient may be included. Since the variation coefficient of ISI is calculated for each burst, the average value, standard deviation, median absolute value, or variation coefficient of all bursts is calculated using the variation coefficient of ISI of each burst. You. By including the coefficient of variation of intra-burst ISI in the candidate parameter set, multivariate analysis is performed with the concept of regularity of intra-burst firing. The effect of improving the accuracy of compound prediction is obtained.
- parameters related to periodicity are effective in separating types of compounds that excite neural network activity (convulsant-positive compounds).
- the candidate parameters include, for example, frequency analysis parameters.
- the frequency analysis parameter is, for example, a parameter capable of analyzing a frequency component of about 250 Hz or less.
- the frequency component of about 250 Hz or less is lower than the action potential component (about 1 kHz or more), and reflects the post-synaptic current component that is important in nerve function. It is possible to detect the properties of the compound on the cell.
- a parameter for analyzing a frequency component of about 250 Hz or less is an index that can be compared with an in vivo electroencephalogram, and makes it possible to take a correlation between in vivo and in vitro.
- the frequency analysis parameter includes, for example, the potential calculated from the potential data or the waveform image. This intensity is obtained by decomposing the potential data or the waveform image into a plurality of frequency components and expressing each of the decomposed frequency components by the following equation.
- the plurality of frequency components may include, for example, a ⁇ wave band of about 4 to about 8 Hz, an ⁇ wave band of about 8 to about 14 Hz, a ⁇ wave band of about 15 to about 30 Hz, a gamma wave band of about 35 to about 50 Hz, about 80 Includes a high-gamma band from about 150 Hz to about 150 Hz, and about 150 to about 200 Hz.
- the waveform image is decomposed into a plurality of frequency components as shown in FIG. 5A, for example. The decomposition is performed using, for example, a band-pass filter corresponding to each frequency component.
- FIG. 5A schematically shows an example of a waveform image decomposed into a plurality of frequency components.
- the graph shown in FIG. 5A is a potential waveform image, in which the vertical axis indicates potential and the horizontal axis indicates time.
- a waveform having a period including one burst is extracted, and a ⁇ wave band of about 4 to about 8 Hz, an ⁇ wave band of about 8 to about 14 Hz, and a ⁇ wave band of about 15 to about 30 Hz. , About 35 to about 50 Hz, a high- ⁇ wave band of about 80 to about 150 Hz, and a frequency component of about 150 to about 200 Hz.
- FIG. 5B is a graph showing an example of the result of calculating the intensity for each frequency component in FIG. 5A.
- the vertical axis shows the intensity value when the value before compound administration is taken as 100%.
- FIG. 5B shows the results at multiple concentrations (about 1 ⁇ M, about 10 ⁇ M, about 100 ⁇ M, about 1 mM).
- concentrations about 1 ⁇ M, about 10 ⁇ M, about 100 ⁇ M, about 1 mM.
- the value of the intensity changes according to the concentration of the compound. That is, it can be said that the value of the intensity is an index reflecting the change in density.
- the frequency analysis parameter includes, for example, the intensity calculated from the wavelet transform.
- This intensity is calculated from a potential data or a scalogram formed by performing a wavelet transform on a waveform image.
- the intensity can be calculated by taking a difference between a scalogram formed by performing wavelet transform on data before compound administration and a scalogram formed by performing wavelet transform on data after compound administration.
- the number of pixels on the X axis varies depending on the burst length, and the number of pixels on the Y axis is, for example, 170 pixels.
- the number of pixels on the Y axis occupying each frequency band is different for each frequency band.
- the number of pixels on the Y axis in the frequency band of about 5 to about 8 Hz is 21 pixels, and the frequency band of about 8 to about 14 Hz.
- the number of pixels on the Y-axis is 15 pixels, 24 pixels from about 15 to about 25 Hz, and the Y-axis pixels in the frequency band from about 30 to about 50 Hz are 31 pixels, and the frequency band from about 70 to about 150 Hz.
- WT A is a wavelet transform coefficient per pixel of each frequency band
- WT A is a wavelet transform coefficient per pixel of each frequency band
- WT B is a wavelet transform coefficient of each frequency band.
- N X is the number of pixels X axis
- N Y (f) is the number of pixels Y axis of each frequency band.
- the compound before administration of the data to derive the WT A in scalograms formed by wavelet transform the data after compound administration the WT A derived in scalograms formed by wavelet transform, prior to administration Compound WT A
- the strength can be calculated by taking the difference between the WT A and the WT A after administration of the compound.
- the frequency analysis parameter includes, for example, the spectrum intensity calculated by the FFT.
- the spectrum intensity is calculated from a spectrum intensity map formed by converting the potential data into a waveform and performing a fast Fourier transform (FFT) on the waveform divided at a predetermined time interval (for example, 1 second interval). For example, the spectrum intensity of each frequency of 1 Hz to 250 Hz can be calculated from the spectrum intensity map formed by performing the FFT on the waveform. These spectral intensities can be used as 250 parameters. Further, by using the time-series spectrum intensity using the waveforms in a plurality of time intervals, it is possible to analyze the time-series change of the multivariate analysis result. Thereby, separation of a known compound and prediction of a target compound based on a time-series change can be performed.
- FFT fast Fourier transform
- the candidate parameters include, for example, nonlinear time-series analysis parameters.
- the nonlinear time-series analysis parameter is, for example, a scaling index ⁇ calculated by Detrended fractionation analysis (DFA).
- DFA Detrended fractionation analysis
- the DFA is a method of characterizing a long-term fluctuation correlation by a scaling index ⁇ except for an unsteady fluctuation component (trend).
- the time-series ISI can be quantified by the scaling index ⁇ .
- the candidate parameters may include, for example, Zscore of the firing interval between the electrodes.
- Zscore is an indicator of the synaptic connection strength of a cell.
- Zscore is calculated, for example, by the following equation.
- N real is a value spike interval between the two electrodes (ISI) has counted that the (a Synchronized spikes) within 100 ms. Specifically, it is the total number of cases where the difference between the time at which the spike was detected at the first electrode and the time at which the spike was detected at the second electrode was within 100 ms.
- Ave randomly sorts the detected spikes, counts the sorted data where the ISI of the two electrodes is within 100 ms (Synchronized spikes), and repeats this multiple times (eg, 100 times).
- the SD surrogate randomly sorts the detected spikes, counts the sorted data where the ISI of the two electrodes is within 100 ms (Synchronized spikes), and repeats this multiple times (eg, 100 times). Is the standard deviation of the number of Synchronized spikes obtained. Since Zscore is an index of synaptic binding strength, by performing multivariate analysis including Zscore, it becomes possible to predict the properties of the target compound in consideration of the effect on synaptic binding strength. A more specific calculation method of Zcore is, for example, Sasaki T, Suzuki I, Yokoi R, Sato K, Ikegaya Y.
- the candidate parameters may include, for example, the following parameters.
- -Normalized Duration IQR quartile range of burst length normalized by median
- ⁇ Full Width at Half Height of Normalized Cross Correlation Half-width of Cross-Correlogram
- the candidate parameter set may include all of the parameters described above or may include some of the parameters described above.
- the candidate parameter set includes at least one of the basic activity parameters, at least one of the burst structure parameters, at least one of the parameters related to periodicity, at least one of the frequency analysis parameters, and the nonlinear time series analysis. It may be preferable to include at least one of the parameters. This allows analysis including spike information, information on synaptic current components by frequency analysis, and time sequence information on spike occurrence by non-linear time series analysis. More preferably, the candidate parameter set includes all of the candidate parameter sets described above. Thereby, it becomes possible to predict the characteristics of the target compound with high accuracy.
- the prediction parameter specifying unit 122 is configured to specify a prediction parameter set based on the result of the multivariate analysis by the multivariate analysis unit 121.
- the prediction parameter specifying unit 122 specifies, as a prediction parameter set, a combination of candidate parameters that can separate the first known compound and the second known compound, for example, based on the result of the multivariate analysis.
- the prediction parameter specifying unit 122 may specify a combination of candidate parameters that can separate three or more compounds as a prediction parameter set based on the result of the multivariate analysis.
- the first principal component score and the second known component of the nerve cell activity data for the first known compound are obtained from the result of the principal component analysis for a certain combination of candidate parameters.
- a significant difference test is performed on the first principal component score of the activity data of the nerve cells for the compound, and if a significant difference is found, the combination of the candidate parameters can be specified as a prediction parameter set.
- the first principal component score of the activity data of the nerve cell for the first known compound and the first principal component of the activity data of the nerve cell for the second known compound are obtained.
- Component score A significant difference test is performed on the first principal component score of the activity data of the nerve cell with respect to the n-th known compound. If a significant difference is found, the combination of the candidate parameters is specified as a prediction parameter set. can do. Such a significant difference test is performed for all combinations of candidate parameters subjected to multivariate analysis, and a combination of one or more candidate parameters having a significant difference is identified as a prediction parameter set.
- the prediction parameter specifying means 122 can perform a significant difference test using any significant difference test method.
- the significance test can be performed using, for example, ANOVA (analysis of variance), and in the case of multivariate, it can be performed using MANOVA (multivariate analysis of variance).
- ANOVA analysis of variance
- MANOVA multivariate analysis of variance
- ANOVA analysis of variance
- MANOVA multivariate analysis of variance
- the threshold value of the p value at which a significant difference is recognized is not limited to 0.05, and may be an arbitrary value.
- the multivariate analysis is a cluster analysis
- the activity data of the nerve cell for the first known compound and the activity data of the nerve cell for the second known compound are respectively obtained.
- the combination of the candidate parameters can be specified as a prediction parameter set.
- the combination of the candidate parameters can be specified as a prediction parameter set. In this way, cluster analysis is performed for all combinations of candidate parameters, and a combination of one or more candidate parameters in which all data is classified into different clusters is specified as a prediction parameter set.
- the prediction parameter specifying unit 122 specifies a plurality of prediction parameter sets that can separate a plurality of sets of compounds. This is because a plurality of characteristics can be predicted. It may be more preferable that the prediction parameter specifying unit 122 specifies a plurality of prediction parameter sets capable of separating a plurality of sets of related compounds. This is because stepwise separation of a plurality of related sets of compounds makes it possible to predict properties in a stepwise manner and to perform property prediction with high accuracy.
- the prediction unit 123 is configured to predict a characteristic from the input data based on the prediction parameter set specified by the prediction parameter specifying unit 122.
- the prediction unit 123 receives the prediction parameter set from the prediction parameter set 122, and also receives the data for the target compound received by the reception unit 110.
- the data for the target compound may be, for example, activity data of the nerve cells for the target compound or image data obtained by converting the data (for example, a raster plot image, a histogram, a waveform image, etc.).
- the prediction unit 123 determines whether the data for the target compound is similar to the data for the first known compound or the data for the second known compound, and determines the determined first known compound or the second known compound.
- the properties of the known compound are predicted as the properties of the target compound.
- the prediction unit 123 may perform a multivariate analysis on the data for the target compound with respect to the prediction parameter set, and determine which one is most similar based on the result. For example, when the multivariate analysis is the principal component analysis, the prediction unit 123 calculates a principal component score of data for the target compound for the prediction parameter set, and performs similarity based on the principal component plot in which the principal component scores are plotted. To decide. For example, the similarity is determined by the Euclidean distance between the principal component plots, the cosine similarity, or a combination thereof.
- the prediction unit 123 performs a cluster analysis on the data for the first known compound, the data for the second known compound, and the data for the target compound for the prediction parameter set. , The data for the first known compound, the data for the second known compound, and the data for the target compound are each classified into clusters. Whether the data for the target compound is similar to the data for the first known compound or the data for the second known compound is determined based on whether or not the data is classified into the same cluster.
- the data for the target compound is not classified into either a cluster where the data for the first known compound is classified or a cluster where the data for the second known compound is classified, the data for the target compound is Will not be similar to either the data for the first known compound or the data for the second known compound.
- the prediction unit 123 may determine whether the data for the target compound is similar to the data for the first known compound or the data for the second known compound using, for example, a support vector machine (SVM). It can. For example, the prediction unit 123 derives a hyperplane that divides the data for the first known compound and the data for the second known compound using the SVM for the prediction parameter set, and the data for the target compound is By determining whether to belong to the data side for one known compound or to the data side for the second known compound, it is determined whether the data is similar to the data for the first known compound or the data for the second known compound. Can be determined.
- SVM support vector machine
- the processor has been described to include the multivariate analysis unit 121 and the prediction parameter specifying unit 122.
- the processor includes the multivariate analysis unit 121 and the prediction parameter identification unit 122.
- the parameter specifying unit 122 may not be provided. In this case, the processor receives the predetermined set of prediction parameters and predicts the characteristic based on the received set of prediction parameters.
- the processor performs a multivariate analysis on the data for the target compound, the data for the first known compound, and the data for the second known compound for the predetermined set of prediction parameters, and executes the target compound based on the result. Is similar to the data for the first known compound or the data for the second known compound, and the determined characteristics of the first known compound or the second known compound are compared with those of the subject compound. Predict as characteristics.
- principal component analysis is performed on the data for the target compound, the data for the first known compound, and the data for the second known compound, and based on the principal component plot (for example, similarity (Based on the degree S), determine whether the data is similar to the data for the first known compound or the data for the second known compound, and determine the property of the determined first or second known compound by: Predicted as characteristics of the target compound.
- cluster analysis is performed on the data for the target compound, the data for the first known compound, and the data for the second known compound, and the data for the target compound is obtained for the first known compound.
- the property of the first known compound or the second known compound is predicted as the property of the target compound. For example, using SVM, a hyperplane that divides the data for the first known compound and the data for the second known compound for a predetermined set of prediction parameters is derived, and the data for the target compound is the first data.
- the components of the computer system 100 are provided in the computer system 100, but the present invention is not limited to this. Any of the components of the computer system 100 may be provided outside the computer system 100.
- each hardware component may be connected via an arbitrary network. At this time, the type of network does not matter.
- Each hardware component may be connected, for example, via a LAN, may be connected wirelessly, or may be connected by wire.
- the computer system 100 is not limited to a specific hardware configuration.
- the configuration of the computer system 100 is not limited to the above as long as the functions can be realized.
- the components of the processor 120 are provided in the same processor 120, but the present invention is not limited to this.
- a configuration in which each component of the processor 120 is distributed to a plurality of processor units is also within the scope of the present invention.
- FIG. 7 shows an example of processing in the computer system 100 for predicting properties of a target compound.
- a process 700 for predicting the characteristics of the target compound will be described.
- the computer system 100 receives, via the receiving unit 110, first activity data of a nerve cell for the first known compound.
- the first activity data includes, for example, a plurality of data obtained when the first known compound is administered to different cell types, and a plurality of data obtained when the first known compound is administered to the same cell type sample supplied from different vendors.
- the received activity data is passed to the processor 120.
- the computer system 100 receives, via the receiving unit 110, the second activity data of the nerve cell for the second known compound.
- the second activity data includes, for example, a plurality of data obtained when the second known compound is administered to different cell types, and a plurality of data obtained when the second known compound is administered to the same cell type sample supplied from different vendors. Data when the second known compound is administered to samples of different lots supplied from the same vendor, and when the second known compound is administered to samples supplied on different days from the same vendor , A plurality of data when a second known compound is tested at a different facility.
- the received activity data is passed to the processor 120.
- step S703 the processor 120 performs a multivariate analysis of the first activity data and the second activity data for all combinations of the candidate parameters in the candidate parameter set, and specifies a prediction parameter set.
- the multivariate analysis means 121 of the processor 120 performs a multivariate analysis of the first activity data and the second activity data for all combinations of the candidate parameters in the candidate parameter set, and
- the parameter specifying unit 122 specifies a prediction parameter set based on the result of the multivariate analysis.
- the processor 120 determines from the target activity data of the nerve cell for the target compound from the target activity data.
- the characteristic is predicted based on the prediction parameter set specified in step S703.
- the prediction unit 123 of the processor 120 predicts the characteristics. In this way, the properties of the target compound can be predicted.
- step S701 when a plurality of first activity data are received, for each of the plurality of first activity data, the plurality of first activity data is multiplied by using a parameter capable of separating a known property of a first known compound.
- a random analysis may be performed and only the first activity data having properties similar to the known properties of the first known compound may be passed to the processor 120 for further processing. This includes, for example, determining whether the first activity data has similar properties to the known properties of the first known compound, and if not, the processor as an outlier. 120 by excluding it from the data passed to it. By detecting outliers and excluding data containing outliers from data passed to processor 120, the accuracy of prediction by processor 120 is further improved.
- step S702 described above outliers of the second activity data can be detected, and data including outliers can be excluded from data passed to the processor 120.
- step S704 described above outliers of the target activity data of the nerve cell with respect to the target compound can be detected, and data including the outliers can be excluded from the data passed to the processor 120.
- the above-described step of detecting outliers by multivariate analysis can be used in other applications. For example, it is effective in checking lot difference, quality check, and selecting cells from different cell types in cell production.
- a multivariate analysis is performed on each cell of a plurality of lots using parameters capable of separating a given property to determine whether or not the cell has a property similar to the given property. By doing so, outliers can be detected. This makes it possible to exclude a lot having a large difference between lots.
- a multivariate analysis is performed using parameters capable of separating desired quality, and determination is made as to whether or not the cells have the same quality as the desired quality. The value can be detected.
- FIG. 8 shows an example of processing in which the processor 120 predicts the characteristics of the target compound in step S704.
- step S801 the prediction means 123 of the processor 120 performs multivariate analysis of the target activity data of the target compound for the prediction parameter set specified in step S703. This allows the target activity data to be compared with the results of a multivariate analysis on the set of prediction parameters already performed on the first activity data and the second activity data.
- the multivariate analysis is, for example, a principal component analysis.
- the prediction unit 123 calculates a principal component score of the target activity data by principal component analysis.
- the multivariate analysis is, for example, cluster analysis.
- the prediction unit 123 classifies the target activity data into clusters by cluster analysis.
- the multivariate analysis performed in step S801 may be the same method as the multivariate analysis performed in step S703, or may be a different method.
- the principal component analysis may be performed in step S801, or a different multivariate analysis (for example, cluster analysis) may be performed.
- a prediction parameter set is specified by performing cluster analysis in step S703, cluster analysis may be performed in step S801, or different multivariate analysis (for example, principal component analysis) may be performed. .
- step S801 the prediction unit 123 of the processor 120 derives a hyperplane that divides the first activity data and the second activity data using the SVM for the prediction parameter set, and obtains a target of the target compound. It may be determined whether the activity data belongs to the first activity data side of the hyperplane or belongs to the second activity data side of the hyperplane.
- step S802 the prediction means 123 of the processor 120 determines whether the target activity data is more similar to the first activity data than to the second activity data.
- the prediction unit 123 can determine whether or not the similarity is based on the principal component score calculated in step S801. For example, the similarity between the target activity data and the first activity data and the similarity between the target activity data and the second activity data can be calculated based on the principal component plot created based on the principal component scores. .
- a first principal component score and a second principal component score of the first activity data are plotted, and a first principal component score and a second principal component score of the second activity data are plotted.
- the Euclidean distance between the plot of the target activity data and the plot of the first activity data, and the plot of the target activity data plot and the second activity data are plotted.
- the cosine similarity between the plot of the target activity data and the plot of the first activity data and the cosine similarity between the plot of the target activity data and the plot of the second activity data May be determined to be more similar to the first activity data than to the second activity data. For example, compare the Euclidean distance and cosine similarity between the plot of the target activity data and the plot of the first activity data, and the Euclidean distance and cosine similarity between the plot of the target activity data and the plot of the second activity data. Thereby, it can be determined whether the target activity data is more similar to the first activity data than the second activity data.
- the similarity is determined by a combination of the Euclidean distance and the cosine similarity of the principal component plot.
- the Euclidean distance d 1 between the plot of the target compound (target activity data) and the plot of the first known compound (first activity data), and the target compound (target activity data) plots and second known) of compound even Euclidean distance d 2 when are equal between the second plot of activity data
- capability determine similarity by cosine similarity.
- the similarity S is It is represented by
- the prediction unit 123 determines whether or not the target activity data is more similar to the first activity data than the second activity data based on, for example, which cluster the target activity data is classified in step S801. Can be.
- the prediction means 123 is based on, for example, whether the target activity data of the target compound belongs to the first activity data side or the second activity data side of the hyperplane derived by the SVM in step S801. , It can be determined whether the target activity data is more similar to the first activity data than the second activity data. If the target activity data belongs to the first activity data side of the hyperplane, the target activity data is determined to be more similar to the first activity data than the second activity data, and the second activity data of the hyperplane is determined. If so, it is determined that the target activity data is more similar to the second activity data than the first activity data.
- step S802 If it is determined in step S802 that the target activity data is more similar to the first activity data than the second activity data, the process proceeds to step S803, where the characteristics of the first known compound are specified as the characteristics of the target compound. For example, when the first known compound has the property of “toxic”, the property of the target compound is specified as “toxic”. For example, when the first known compound has the property (mechanism of action) of “effective on GABA”, the action mechanism of the target compound is specified as “effective on GABA”.
- step S802 it has been determined that the target activity data is less similar to the first activity data than the second activity data, ie, the target activity data is more similar to the second activity data than the first activity data.
- the process proceeds to step S804, where the characteristics of the second known compound are specified as the characteristics of the target compound.
- the second known compound has the property of “no toxicity”
- the property of the target compound is specified as “no toxicity”.
- the action mechanism of the target compound is specified as “effective on K channel”.
- the process 700 is performed using the first activity data for the first known compound and the second activity data for the second known compound.
- the process 700 for the third known compound is performed.
- the process 700 is performed using the activity data of No. 3, the fourth activity data of the fourth known compound,..., The n-th activity data of the n-th compound (where n is an integer of 3 or more). You may.
- step S802 the similarity between the target activity data and each of the first activity data, the second activity data,..., The nth activity data is compared.
- the process 700 can be performed using the first activity data for the first known compound, the second activity data for the second known compound,..., The eleventh activity data for the eleventh known compound.
- FIG. 6B shows an example of a result obtained when cluster analysis is performed as multivariate analysis in step S801.
- FIG. 6B shows an example of a result obtained when cluster analysis was performed on the first to eleventh known compounds, the target compound A and the target compound B.
- the vertical axis indicates the Euclidean distance.
- compounds having a short Euclidean distance for example, compounds having a Euclidean distance of about 150 or less (indicated by a two-dot chain line in FIG. 6B)
- the first to fifth known compounds each have the same property 1
- the sixth known compound has property 2
- the seventh known compound has property 3
- the eighth known compound has the following characteristics.
- the compound has property 4, the ninth known compound and the tenth known compound each have the same property 5, and the eleventh known compound has property 6.
- the target compound A is predicted to have the property 2 because it is classified into the same cluster as the sixth known compound.
- the target compound B is predicted to have the property 5 because it is classified into the same cluster as the ninth known compound and the tenth known compound.
- step S704 may be repeated using the second prediction parameter set.
- the second prediction parameter set may be, for example, a prediction parameter set specified by performing the processing of steps S701 to S703 using the third known compound and the fourth known compound.
- the second prediction parameter set uses the first known compound and the third known compound in steps S701 to S701.
- the prediction parameter set specified by performing the processing of S703 may be used, or when the characteristic of the second known compound is specified as the characteristic of the target compound in step S804, the second known compound and the third May be a prediction parameter set specified by performing the processing of steps S701 to S703 using the known compound of.
- the second prediction parameter set comes to correspond to the property of the target compound specified in step S803 or step S804. This may be preferred in that the properties can be identified step by step.
- step S803 or step S804 when the property of the target compound is specified as “effective on GABA” in step S803 or step S804, the third known compound having the property (action mechanism) of “effective on GABA-A” and “GABA-B” Using the first predicted compound or the fourth known compound having the property (action mechanism) of “Effective against” the second prediction parameter set specified by performing the processing of steps S701 to S703. Step S704 can be repeated. As a result, the property of the target compound “effective on GABA” can be specified up to the specific property of “effective on GABA-A” or “effective on GABA-B”.
- FIG. 9 shows an example of processing in the computer system 100 for predicting the characteristics of the target compound.
- a process 900 for predicting the characteristics of the target compound when the prediction parameter set is determined in advance will be described.
- the predetermined prediction parameter set includes at least one of the candidate parameters described above.
- the computer system 100 receives, via the receiving unit 110, first activity data of a nerve cell for a first known compound, second activity data of a nerve cell for a second known compound, and a nerve cell for a target compound.
- the first activity data includes, for example, a plurality of data obtained when the first known compound is administered to different cell types, and a plurality of data obtained when the first known compound is administered to the same cell type sample supplied from different vendors.
- a plurality of data when the first known compound is administered to samples of different lots supplied from the same vendor, and a plurality of data when the first known compound is administered to samples supplied on different days from the same vendor , A plurality of data when the first known compound is tested at different facilities.
- the second activity data includes, for example, a plurality of data obtained when the second known compound is administered to different cell types, and a plurality of data obtained when the second known compound is administered to the same cell type sample supplied from different vendors. Data when the second known compound is administered to samples of different lots supplied from the same vendor, and when the second known compound is administered to samples supplied on different days from the same vendor , A plurality of data when a second known compound is tested at a different facility. The received activity data is passed to the processor 120.
- step S901 when a plurality of first activity data are received, for each of the plurality of first activity data, the plurality of first activity data is multiplied by using a parameter capable of separating a known property of a first known compound.
- a random analysis may be performed and only the first activity data having properties similar to the known properties of the first known compound may be passed to the processor 120 for further processing. This includes, for example, determining whether the first activity data has similar properties to the known properties of the first known compound, and if not, the processor as an outlier. 120 by excluding it from the data passed to it. By detecting outliers and excluding data containing outliers from data passed to processor 120, the accuracy of prediction by processor 120 is further improved.
- the target activity data of the nerve cell for the target compound outliers can be detected, and data including the outliers can be excluded from the data passed to the processor 120.
- the prediction unit 123 of the processor 120 performs a multivariate analysis on a prediction parameter set for each data.
- the multivariate analysis is, for example, a principal component analysis.
- the prediction unit 123 calculates a principal component score of the first activity data, a principal component score of the second activity data, and a principal component score of the target activity data by the principal component analysis.
- the multivariate analysis is, for example, cluster analysis.
- the prediction unit 123 classifies the target activity data into clusters by cluster analysis.
- step S902 the prediction unit 123 of the processor 120 derives a hyperplane that divides the first activity data and the second activity data using the SVM for the prediction parameter set, and obtains a target of the target compound. It may be determined whether the activity data belongs to the first activity data side of the hyperplane or belongs to the second activity data side of the hyperplane.
- step S903 the prediction unit 123 of the processor 120 determines whether the target activity data is more similar to the first activity data than the second activity data. For example, the prediction unit 123 can determine whether or not they are similar based on the principal component score calculated in step S902. For example, the similarity between the target activity data and the first activity data and the similarity between the target activity data and the second activity data can be calculated based on the principal component plot created based on the principal component scores. .
- a first principal component score and a second principal component score of the first activity data are plotted, and a first principal component score and a second principal component score of the second activity data are plotted.
- the Euclidean distance between the plot of the target activity data and the plot of the first activity data, and the plot of the target activity data plot and the second activity data are plotted.
- the cosine similarity between the plot of the target activity data and the plot of the first activity data and the cosine similarity between the plot of the target activity data and the plot of the second activity data May be determined to be more similar to the first activity data than to the second activity data. For example, compare the Euclidean distance and cosine similarity between the plot of the target activity data and the plot of the first activity data, and the Euclidean distance and cosine similarity between the plot of the target activity data and the plot of the second activity data. Thereby, it can be determined whether the target activity data is more similar to the first activity data than the second activity data.
- the prediction unit 123 determines whether or not the target activity data is more similar to the first activity data than the second activity data based on, for example, which cluster the target activity data is classified in step S902. Can be.
- the prediction means 123 is based on, for example, whether the target activity data of the target compound belongs to the first activity data side or the second activity data side of the hyperplane derived by the SVM in step S902. , It can be determined whether the target activity data is more similar to the first activity data than the second activity data. If the target activity data belongs to the first activity data side of the hyperplane, the target activity data is determined to be more similar to the first activity data than the second activity data, and the second activity data of the hyperplane is determined. If so, it is determined that the target activity data is more similar to the second activity data than the first activity data.
- step S903 If it is determined in step S903 that the target activity data is more similar to the first activity data than the second activity data, the process proceeds to step S904, where the characteristics of the first known compound are specified as the characteristics of the target compound. For example, when the first known compound has the property of “toxic”, the property of the target compound is specified as “toxic”. For example, when the first known compound has the property (mechanism of action) of “effective on GABA”, the action mechanism of the target compound is specified as “effective on GABA”.
- step S903 It is determined in step S903 that the target activity data is less similar to the first activity data than the second activity data, ie, the target activity data is more similar to the second activity data than the first activity data.
- the process proceeds to step S905, where the characteristics of the second known compound are specified as the characteristics of the target compound. For example, when the first known compound has the property of “no toxicity”, the property of the target compound is specified as “no toxicity”. For example, when the second known compound has the property (effect mechanism) of “effective on the K channel”, the action mechanism of the target compound is specified as “effective on the K channel”.
- the process 900 is performed using the first activity data for the first known compound and the second activity data for the second known compound.
- the process 900 is performed for the third known compound.
- the process 700 is performed using the activity data of No. 3, the fourth activity data of the fourth known compound,..., The n-th activity data of the n-th compound (where n is an integer of 3 or more). You may.
- step S903 the similarities of the first activity data, the second activity data, and the... N-th activity data are compared.
- the target that can be predicted is not limited to the characteristics of the compound.
- a computer system that can predict the characteristics of any target is also within the scope of the present invention, as long as there is a set of prediction parameters that can separate the characteristics.
- the present invention can target a neural network as a target, and the characteristics of an unknown neural network can be predicted by the computer system of the present invention.
- the neural network can be, for example, a neural network made from iPS cells.
- the electrical activity data of the known disease neuron is specified, and based on the specified prediction parameter set, which disease neuron has a function similar to that of an unknown neural network Can be predicted.
- a candidate parameter set for all combinations of candidate parameters in the same candidate parameter set as used in predicting the properties of the compound, the combination of the known neural network of each part of the brain
- a set of predictive parameters that can separate the electrical activity data of the neural network in each part of the brain is specified, and based on the specified predictive parameter set, It is possible to predict whether or not it has a behavior close to that of the brain.
- prediction accuracy can be improved by using data such as gene expression data, synaptic function data, and metabolic function data in addition to the electrical activity data.
- separable characteristics can be increased.
- the present invention can target a cell as a target, and the computer system of the present invention can predict the characteristics of an unknown cell.
- all of the candidate parameters in the candidate parameter set (which may be a candidate parameter set including parameters for quantitative data of various cell characterization analyzes (eg, quantitative data of gene expression, autophagy, mitochondria, and senescent cells))
- Multivariate analysis of various data eg, gene expression data, autophagy data, mitochondrial analysis data, senescent cell analysis data, etc.
- data obtained from cells of patients with known diseases
- Such a computer system that can predict the characteristics of any target can have the same configuration as the computer system 100, and can predict the characteristics of any target by processing similar to that of the computer system 100. it can.
- the characteristics of any target can be predicted by a process similar to the process 700 described above.
- the computer system 100 receives the first data for the first target via the receiving unit 110.
- the first subject may be, for example, a first known diseased neuron, a neural network of a first site in the brain, cells of a first known diseased patient, etc., wherein the first data is a first known diseased patient, respectively.
- Electrical activity data of diseased neurons, electrical activity data of the neural network of the first part of the brain, various data of cells of patients with known first disease eg, gene expression data, autophagy data, mitochondrial analysis Data, senescent cell analysis data, etc.
- the received data is passed to the processor 120.
- the computer system 100 receives the second data for the second object via the receiving unit 110.
- the second subject may be, for example, a second known diseased neuron, a neural network at a second site in the brain, cells of a second known diseased patient, etc., wherein the second data are each a second known diseased patient.
- the received data, the received activity data is passed to the processor 120.
- the processor 120 performs multivariate analysis on the first data and the second data for all combinations of the candidate parameters in the candidate parameter set, and specifies the prediction parameter set.
- the multivariate analysis means 121 of the processor 120 performs the multivariate analysis of the first data and the second data for all the combinations of the candidate parameters in the candidate parameter set, and specifies the prediction parameter of the processor 120.
- Means 122 specifies a prediction parameter set based on the result of the multivariate analysis.
- the processor 120 converts the target data for the target from the target data for the target to the prediction parameter set specified in step S703. Predict the characteristics based on.
- the prediction unit 123 of the processor 120 predicts the characteristics.
- the target may be, for example, an unknown neural network, cells of an unknown disease patient, etc.
- the target data may be electrical data of an unknown neural network, various data of cells of an unknown disease patient (eg, data of gene expression). , Autophagy data, mitochondrial analysis data, senescent cell analysis data, etc.). In this way, the properties of any target can be predicted.
- each step illustrated in FIGS. 7, 8, and 9 is realized by a program stored in the processor 120 and the memory 130.
- the present invention is not limited to this.
- At least one of the processes of each step shown in FIGS. 7, 8, and 9 may be realized by a hardware configuration such as a control circuit.
- the process 700 and the process 900 may include a step of obtaining data from a target instead of the step of receiving data (steps S701, S702, and S901). Subsequent steps can be performed manually based on the obtained data.
- activity data when each of the five known compounds (4AP, Phenytoin, PTX (Picrotoxin), Strychine, Amoxicilline) was administered to nerve cells was obtained using MEA.
- MEA Axol Bioscience's Human iPSC-derived ⁇ neural ⁇ stem ⁇ cells (ax0019) was used as the neuron
- MEA was used as the MEA
- MEA $ 24 well @ Plate-comfort was used as the MEA.
- FED MED64-Presto MED-A384iN was used.
- the acquired data was input to the computer system of the present invention, and a principal component analysis was performed on all combinations of the candidate parameters in the candidate parameter set.
- the candidate parameter set includes 10 parameters ((1) TS, (2) NoB, (3) IBI, (4) burst length, (5) number of spikes during burst, (6) PS, (7) PS fluctuation.
- FIGS. 10A and 10B are diagrams showing the results of prediction of the mechanism of action of target compound A in this example.
- FIG. 10A is a graph showing principal component plots of target compound A and five known compounds.
- the horizontal axis represents the first principal component
- the vertical axis represents the second principal component.
- FIG. 10B (a) is a graph showing the average value of the principal component plot of the target compound A, the average value of each of the principal component plots of the five known compounds, and the Euclidean distance
- FIG. 10B (b) is the graph showing the Euclidean distance.
- the distance is indicated by a bar graph.
- the leftmost bar graph shows the Euclidean distance between the average value of the principal component plot of target compound A and the average value of the principal component plot of 4AP
- the second bar graph from the left shows the principal component plot of the target compound A.
- the Euclidean distance between the average value and the average value of the Phenytoin principal component plot is shown.
- the third bar graph from the left shows the average value of the principal component plot of the target compound A and the average value of the principal component plot of PTX (Pictoxin).
- the fourth bar graph from the left shows the Euclidean distance between the average value of the principal component plot of the target compound A and the average value of the principal component plot of Strychine, and the fifth bar graph from the left shows The average value of the principal component plot of the target compound A and the average value of the principal component plot of Amoxiciline are calculated as Shows the distance.
- the known compound having the Euclidean distance closest to the average value of the principal component plot of the target compound A is PTX (Picrotoxin), and the mechanism of action of the target compound A is the same as that of PTX (Picrotoxin). Predicted to be. Thus, the mechanism of action of the target compound A could be correctly predicted.
- the present invention is useful as providing a method for predicting unknown properties of a target such as a target compound (for example, toxicity to the nervous system and efficacy).
- a target compound for example, toxicity to the nervous system and efficacy.
Landscapes
- Health & Medical Sciences (AREA)
- Life Sciences & Earth Sciences (AREA)
- Engineering & Computer Science (AREA)
- Physics & Mathematics (AREA)
- Chemical & Material Sciences (AREA)
- Biomedical Technology (AREA)
- Immunology (AREA)
- General Health & Medical Sciences (AREA)
- Analytical Chemistry (AREA)
- Biochemistry (AREA)
- Pathology (AREA)
- General Physics & Mathematics (AREA)
- Optics & Photonics (AREA)
- Nuclear Medicine, Radiotherapy & Molecular Imaging (AREA)
- Theoretical Computer Science (AREA)
- Hematology (AREA)
- Bioinformatics & Computational Biology (AREA)
- Computing Systems (AREA)
- Crystallography & Structural Chemistry (AREA)
- Medicinal Chemistry (AREA)
- Biophysics (AREA)
- Bioinformatics & Cheminformatics (AREA)
- Molecular Biology (AREA)
- Urology & Nephrology (AREA)
- Food Science & Technology (AREA)
- Chemical Kinetics & Catalysis (AREA)
- Investigating Or Analysing Biological Materials (AREA)
- Measuring Or Testing Involving Enzymes Or Micro-Organisms (AREA)
- Investigating Or Analyzing Materials By The Use Of Electric Means (AREA)
Abstract
本発明の標的の特性の予測方法は、(1)第1の対象に対する第1のデータを得る工程と、(2)第2の対象に対する第2のデータを得る工程と、(3)候補パラメータセット中の各候補パラメータの全ての組み合わせについて、前記第1のデータおよび前記第2のデータの多変量解析を行い、予測パラメータセットを特定する工程と、(4)前記標的に対する標的データから、前記予測パラメータセットに基づいて前記特性を予測する工程を包含する。
Description
本発明は、標的の特性の予測を行うための方法、コンピュータシステム、プログラムに関する。より具体的には、対象化合物の特性を予測するための方法等に関する。
特性が未知である標的の効率的な特性予測法は分野を問わず探求されている課題である。
例えば、臨床試験において毒性が判明した薬剤のうち、34%が中枢神経系における毒性であるというデータがある。そこで、非臨床試験において、ヒト由来神経細胞などの神経ネットワーク活動を微小電極アレイ(MEA:Micro-Eelectrode Array)等で取得し、医薬品の効果を調べる研究が行われている(非特許文献1)ものの、非臨床試験で中枢神経系への毒性や薬効の有効な評価法は見出されていない。
A. Odawara, H. Katoh, N. Matsuda & I. Suzuki, "Physiological maturation and drug responses of human induced pluripotent stem cell-derived cortical neuronal networks in long-term culture", Scientific Reports volume 6, Article number: 26181 (2016)
本発明は、対象化合物等の標的の未知の特性を予測する方法等を提供することを目的とする。
本発明は、例えば、以下の項目を提供する。
(項目1)
標的の特性の予測方法であって、
(1)第1の対象に対する第1のデータを得る工程と、
(2)第2の対象に対する第2のデータを得る工程と、
(3)候補パラメータセット中の各候補パラメータの全ての組み合わせについて、前記第1のデータおよび前記第2のデータの多変量解析を行い、予測パラメータセットを特定する工程と、
(4)前記標的に対する標的データから、前記予測パラメータセットに基づいて前記特性を予測する工程
を包含する、方法。
標的の特性の予測方法であって、
(1)第1の対象に対する第1のデータを得る工程と、
(2)第2の対象に対する第2のデータを得る工程と、
(3)候補パラメータセット中の各候補パラメータの全ての組み合わせについて、前記第1のデータおよび前記第2のデータの多変量解析を行い、予測パラメータセットを特定する工程と、
(4)前記標的に対する標的データから、前記予測パラメータセットに基づいて前記特性を予測する工程
を包含する、方法。
(項目2)
前記予測パラメータセットを特定する工程(3)が、前記多変量解析によって前記第1の対象と前記第2の対象とを分離可能な前記候補パラメータの組み合わせを、前記予測パラメータセットと特定することを含む、項目1に記載の方法。
前記予測パラメータセットを特定する工程(3)が、前記多変量解析によって前記第1の対象と前記第2の対象とを分離可能な前記候補パラメータの組み合わせを、前記予測パラメータセットと特定することを含む、項目1に記載の方法。
(項目3)
前記予測する工程(4)が、前記標的データと、前記第1のデータおよび前記第2のデータとを比較し、前記標的データに類似するデータを与えた対象の特性を、前記標的の特性と特定することを含む、項目1または2に記載の方法。
前記予測する工程(4)が、前記標的データと、前記第1のデータおよび前記第2のデータとを比較し、前記標的データに類似するデータを与えた対象の特性を、前記標的の特性と特定することを含む、項目1または2に記載の方法。
(項目4)
前記標的データ、前記第1のデータおよび前記第2のデータの、前記予測パラメータセットについての多変量解析によって、前記標的データが、前記第1のデータまたは前記第2のデータのいずれと類似するかを決定することを含む、項目3に記載の方法。
前記標的データ、前記第1のデータおよび前記第2のデータの、前記予測パラメータセットについての多変量解析によって、前記標的データが、前記第1のデータまたは前記第2のデータのいずれと類似するかを決定することを含む、項目3に記載の方法。
(項目5)
前記類似が、ユークリッド距離、コサイン類似度、またはその組み合わせによって決定される、項目4に記載の方法。
前記類似が、ユークリッド距離、コサイン類似度、またはその組み合わせによって決定される、項目4に記載の方法。
(項目6)
(5)前記工程(4)で予測された特性に対応する第2の予測パラメータセットに基づいて、前記標的に対する第2の標的データから、第2の特性を予測する工程
をさらに包含する、項目1~5のいずれか1項に記載の方法。
(5)前記工程(4)で予測された特性に対応する第2の予測パラメータセットに基づいて、前記標的に対する第2の標的データから、第2の特性を予測する工程
をさらに包含する、項目1~5のいずれか1項に記載の方法。
(項目7)
前記多変量解析が主成分解析またはクラスター分析である、項目1~6のいずれか1項に記載の方法。
前記多変量解析が主成分解析またはクラスター分析である、項目1~6のいずれか1項に記載の方法。
(項目8)
前記標的が化合物である、項目1~7のいずれか1項に記載の方法。
前記標的が化合物である、項目1~7のいずれか1項に記載の方法。
(項目9)
前記特性が、前記化合物の薬効、毒性、作用機序の1つまたは複数を含む、項目8に記載の方法。
前記特性が、前記化合物の薬効、毒性、作用機序の1つまたは複数を含む、項目8に記載の方法。
(項目10)
前記データが、神経細胞の活動データである、項目9に記載の方法。
前記データが、神経細胞の活動データである、項目9に記載の方法。
(項目11)
前記活動データが、微小電極アレイ、Ca2+イメージング法、膜電位イメージング法のうちの1つを用いて得られたものである、項目10に記載の方法。
前記活動データが、微小電極アレイ、Ca2+イメージング法、膜電位イメージング法のうちの1つを用いて得られたものである、項目10に記載の方法。
(項目12)
前記神経細胞は神経幹細胞である、項目10または11に記載の方法。
前記神経細胞は神経幹細胞である、項目10または11に記載の方法。
(項目13)
前記神経幹細胞はiPS細胞である、項目12に記載の方法。
前記神経幹細胞はiPS細胞である、項目12に記載の方法。
(項目14)
前記候補パラメータセットが、基本活動パラメータを含む、項目10~13のいずれか1項に記載の方法。
前記候補パラメータセットが、基本活動パラメータを含む、項目10~13のいずれか1項に記載の方法。
(項目15)
前記基本活動パラメータが、TS、NoB、バースト周波数、バーストパーセンテージ、およびバースト長の四分位範囲を含む、項目14に記載の方法。
前記基本活動パラメータが、TS、NoB、バースト周波数、バーストパーセンテージ、およびバースト長の四分位範囲を含む、項目14に記載の方法。
(項目16)
前記候補パラメータセットが、バースト構造パラメータの平均値を含む、項目10~15のいずれか1項に記載の方法。
前記候補パラメータセットが、バースト構造パラメータの平均値を含む、項目10~15のいずれか1項に記載の方法。
(項目17)
前記候補パラメータセットが、バースト構造パラメータの標準偏差または中央絶対偏差を含む、項目10~15のいずれか1項に記載の方法。
前記候補パラメータセットが、バースト構造パラメータの標準偏差または中央絶対偏差を含む、項目10~15のいずれか1項に記載の方法。
(項目18)
前記バースト構造パラメータが、バースト長、バースト中スパイク数、IBI、IPI、PS、ピーク時間パーセンテージ、バースト内平均ISI、バースト内中央ISI、バースト内中央ISI/平均ISIを含む、項目16または17に記載の方法。
前記バースト構造パラメータが、バースト長、バースト中スパイク数、IBI、IPI、PS、ピーク時間パーセンテージ、バースト内平均ISI、バースト内中央ISI、バースト内中央ISI/平均ISIを含む、項目16または17に記載の方法。
(項目19)
前記候補パラメータセットが、周期性に関するパラメータをさらに含む、項目10~18のいずれか1項に記載の方法。
前記候補パラメータセットが、周期性に関するパラメータをさらに含む、項目10~18のいずれか1項に記載の方法。
(項目20)
前記周期性に関するパラメータが、周期性パラメータを含む、項目19に記載の方法。
前記周期性に関するパラメータが、周期性パラメータを含む、項目19に記載の方法。
(項目21)
前記周期性に関するパラメータが、バースト長、バースト中スパイク数、IBI、IPI、PS、ピーク時間パーセンテージ、バースト内平均ISI、バースト内中央ISI、バースト内中央ISI/平均ISIのそれぞれの変動係数と、バースト内CV ISIの平均値、バースト内CV ISIの標準偏差、バースト内CV ISIの中央絶対偏差、およびバースト内CV ISIの変動係数とをさらに含む、項目19または20に記載の方法。
前記周期性に関するパラメータが、バースト長、バースト中スパイク数、IBI、IPI、PS、ピーク時間パーセンテージ、バースト内平均ISI、バースト内中央ISI、バースト内中央ISI/平均ISIのそれぞれの変動係数と、バースト内CV ISIの平均値、バースト内CV ISIの標準偏差、バースト内CV ISIの中央絶対偏差、およびバースト内CV ISIの変動係数とをさらに含む、項目19または20に記載の方法。
(項目22)
前記候補パラメータセットが、周波数解析パラメータを含む、項目10~21のいずれか1項に記載の方法。
前記候補パラメータセットが、周波数解析パラメータを含む、項目10~21のいずれか1項に記載の方法。
(項目23)
前記周波数解析パラメータが、約250Hz以下の周波数解析パラメータを含む、項目22に記載の方法。
前記周波数解析パラメータが、約250Hz以下の周波数解析パラメータを含む、項目22に記載の方法。
(項目24)
前記候補パラメータセットが、非線形時系列解析パラメータを含む、項目10~23のいずれか1項に記載の方法。
前記候補パラメータセットが、非線形時系列解析パラメータを含む、項目10~23のいずれか1項に記載の方法。
(項目25)
標的の特性の予測方法であって、
第1の対象、第2の対象および前記標的それぞれに対する、データを得る工程、
それぞれのデータに対して、予測パラメータセットについて多変量解析を行う工程と、
前記標的のデータが前記第1の対象のデータまたは前記第2の対象のデータいずれに類似しているかを決定する工程と、
前記標的のデータが前記第2の対象のデータよりも前記第1の対象のデータに類似していると決定された場合に、前記第1の対象の特性を前記標的の前記特性であると特定する工程と
を包含する、方法。
標的の特性の予測方法であって、
第1の対象、第2の対象および前記標的それぞれに対する、データを得る工程、
それぞれのデータに対して、予測パラメータセットについて多変量解析を行う工程と、
前記標的のデータが前記第1の対象のデータまたは前記第2の対象のデータいずれに類似しているかを決定する工程と、
前記標的のデータが前記第2の対象のデータよりも前記第1の対象のデータに類似していると決定された場合に、前記第1の対象の特性を前記標的の前記特性であると特定する工程と
を包含する、方法。
(項目26)
前記予測パラメータセットが、周期性パラメータ、約250Hz以下の周波数解析パラメータ、または非線形時系列解析パラメータの1または複数を含む、項目25に記載の方法。
前記予測パラメータセットが、周期性パラメータ、約250Hz以下の周波数解析パラメータ、または非線形時系列解析パラメータの1または複数を含む、項目25に記載の方法。
(項目27)
標的の特性を予測するためのコンピュータシステムであって、
第1の対象に対する第1のデータおよび第2の対象に対する第2のデータを受信する手段と、
候補パラメータセット中の各候補パラメータの全ての組み合わせについて、前記第1のデータおよび前記第2のデータの多変量解析を行う手段と、
前記多変量解析の結果に基づいて予測パラメータセットを特定する手段と、
前記標的に対する標的データから、前記予測パラメータセットに基づいて前記特性を予測する手段と
を備えているコンピュータシステム。
標的の特性を予測するためのコンピュータシステムであって、
第1の対象に対する第1のデータおよび第2の対象に対する第2のデータを受信する手段と、
候補パラメータセット中の各候補パラメータの全ての組み合わせについて、前記第1のデータおよび前記第2のデータの多変量解析を行う手段と、
前記多変量解析の結果に基づいて予測パラメータセットを特定する手段と、
前記標的に対する標的データから、前記予測パラメータセットに基づいて前記特性を予測する手段と
を備えているコンピュータシステム。
(項目28)
標的の特性を予測するためのプログラムであって、前記プログラムは、プロセッサを備えるコンピュータシステムにおいて実行され、前記プログラムは、
(1)第1の対象に対する第1のデータを受信する工程と、
(2)第2の対象に対する第2のデータを受信する工程と、
(3)候補パラメータセット中の各候補パラメータの全ての組み合わせに対して、前記第1のデータおよび前記第2のデータの多変量解析を行い、予測パラメータセットを特定する工程と、
(4)前記標的に対する標的データから、前記予測パラメータセットに基づいて前記特性を予測する工程と
を包含する処理を前記プロセッサに実行させる、方法。
標的の特性を予測するためのプログラムであって、前記プログラムは、プロセッサを備えるコンピュータシステムにおいて実行され、前記プログラムは、
(1)第1の対象に対する第1のデータを受信する工程と、
(2)第2の対象に対する第2のデータを受信する工程と、
(3)候補パラメータセット中の各候補パラメータの全ての組み合わせに対して、前記第1のデータおよび前記第2のデータの多変量解析を行い、予測パラメータセットを特定する工程と、
(4)前記標的に対する標的データから、前記予測パラメータセットに基づいて前記特性を予測する工程と
を包含する処理を前記プロセッサに実行させる、方法。
(項目29)
標的の特性を予測するためのコンピュータシステムであって、
第1の対象、第2の対象および前記標的それぞれに対する、データを受信する手段と、
それぞれのデータに対して、予測パラメータセットについて多変量解析を行う手段と、
前記標的のデータが前記第1の対象のデータまたは前記第2の対象のデータいずれに類似しているかを決定する手段と、
前記標的のデータが前記第2の対象のデータよりも前記第1の対象のデータに類似していると決定された場合に、前記第1の対象の特性を前記標的の前記特性であると特定する手段と
を備えている、コンピュータシステム。
標的の特性を予測するためのコンピュータシステムであって、
第1の対象、第2の対象および前記標的それぞれに対する、データを受信する手段と、
それぞれのデータに対して、予測パラメータセットについて多変量解析を行う手段と、
前記標的のデータが前記第1の対象のデータまたは前記第2の対象のデータいずれに類似しているかを決定する手段と、
前記標的のデータが前記第2の対象のデータよりも前記第1の対象のデータに類似していると決定された場合に、前記第1の対象の特性を前記標的の前記特性であると特定する手段と
を備えている、コンピュータシステム。
(項目30)
標的の特性を予測するためのプログラムであって、前記プログラムは、プロセッサを備えるコンピュータシステムにおいて実行され、前記プログラムは、
第1の対象、第2の対象および前記標的それぞれに対する、データを受信する工程と、
それぞれのデータに対して、予測パラメータセットについて多変量解析を行う工程と、
前記標的のデータが前記第1の対象のデータまたは前記第2の対象のデータいずれに類似しているかを決定する工程と、
前記標的のデータが前記第2の対象のデータよりも前記第1の対象のデータに類似していると決定された場合に、前記第1の対象の特性を前記標的の前記特性であると特定する工程と
を包含する処理を前記プロセッサに実行させる、プログラム。
標的の特性を予測するためのプログラムであって、前記プログラムは、プロセッサを備えるコンピュータシステムにおいて実行され、前記プログラムは、
第1の対象、第2の対象および前記標的それぞれに対する、データを受信する工程と、
それぞれのデータに対して、予測パラメータセットについて多変量解析を行う工程と、
前記標的のデータが前記第1の対象のデータまたは前記第2の対象のデータいずれに類似しているかを決定する工程と、
前記標的のデータが前記第2の対象のデータよりも前記第1の対象のデータに類似していると決定された場合に、前記第1の対象の特性を前記標的の前記特性であると特定する工程と
を包含する処理を前記プロセッサに実行させる、プログラム。
本発明によれば、対象化合物等の標的の未知の特性(例えば、神経系への毒性や薬効)を予測する方法等を提供することができる。
以下、本発明を説明する。本明細書において使用される用語は、特に言及しない限り、当該分野で通常用いられる意味で用いられることが理解されるべきである。したがって、他に定義されない限り、本明細書中で使用される全ての専門用語および科学技術用語は、本発明の属する分野の当業者によって一般的に理解されるのと同じ意味を有する。矛盾する場合、本明細書(定義を含めて)が優先する。
(定義)
本明細書において、「対象化合物」とは、特性を予測する対象の化合物のことをいう。対象化合物は、未知の化合物であってもよいし、既知の化合物であってもよい。対象化合物の特性は、例えば、薬効、毒性、作用機序を含むがこれらに限定されない。
本明細書において、「対象化合物」とは、特性を予測する対象の化合物のことをいう。対象化合物は、未知の化合物であってもよいし、既知の化合物であってもよい。対象化合物の特性は、例えば、薬効、毒性、作用機序を含むがこれらに限定されない。
本明細書において、「薬効」とは、薬剤を対象に適用した場合に結果として生じる効果のことである。例えば、薬剤が抗がん剤であった場合、薬効は、X線観察下におけるがん面積の縮小、がんの進行の遅延、およびがん患者の生存期間の延長等の対象に生じる直接的効果であってもよいし、がんの進行と相関するバイオマーカーの減少などの間接的効果であってもよい。本明細書において、「薬効」とは、任意の適用条件下における効果が企図される。例えば、薬剤が抗がん剤であった場合、薬効は、特定の対象(例えば、80歳以上の男性)における効果であってもよいし、特定の適用条件(例えば、他の抗がん療法との併用下)における効果であってもよい。一つの実施形態では、薬剤は、単一の薬効を有してもよいし、複数の薬効を有してもよい。一つの実施形態では、薬剤は、異なる適用条件下において異なる薬効を有してもよい。一般的に、薬効は、達成を目的とする効果を指す。
本明細書において、「毒性」とは、薬剤を対象に適用した場合に生じる好ましくない効果である。一般的に、毒性は、薬剤の目的とする効果とは異なる効果である。毒性は、薬効とは異なる作用機序で生じる場合もあるし、薬効と同じ作用機序で生じる場合もある。例えば、薬剤が抗がん剤であった場合、細胞増殖抑制の作用機序を介して、がん細胞殺傷の薬効と同時に正常な肝細胞の殺傷による肝毒性が生じる場合もあるし、細胞増殖抑制の作用機序を介したがん細胞殺傷の薬効と同時に膜安定化の作用機序を介した神経機能障害の毒性が生じる場合もある。
本明細書において、「作用機序」とは、薬剤が生物的機構と相互作用する様式である。例えば、薬剤が抗がん剤であった場合、作用機序は、免疫系の活性化、増殖速度の速い細胞の殺傷、増殖性シグナル伝達の遮断、特定の受容体の遮断、特定の遺伝子の転写阻害など種々のレベルの事象であり得る。作用機序が特定されると、蓄積された情報に基づいて、薬効、毒性および/または適切な利用形態が予測され得る。
本明細書において、「約」とは、後に続く数値の±10%を意味する。
1.対象化合物の特性の予測
本発明の発明者は、非臨床試験において対象化合物の神経系に対する特性を評価するために、多変量解析を用いて対象化合物の特性を予測する手法を開発した。本発明の方法においては、複数の候補パラメータを含むパラメータセット中の複数(好ましくは全て)の組み合わせに対して、多変量解析を用いることにより、既知化合物の応答の分離に好適な予測パラメータセットを導出することができる。その予測パラメータセットを用いて、対象化合物を神経細胞に投与したときに取得された活動データを解析することによって、対象化合物の特性がどの既知化合物の特性に類似するかを予測する。
本発明の発明者は、非臨床試験において対象化合物の神経系に対する特性を評価するために、多変量解析を用いて対象化合物の特性を予測する手法を開発した。本発明の方法においては、複数の候補パラメータを含むパラメータセット中の複数(好ましくは全て)の組み合わせに対して、多変量解析を用いることにより、既知化合物の応答の分離に好適な予測パラメータセットを導出することができる。その予測パラメータセットを用いて、対象化合物を神経細胞に投与したときに取得された活動データを解析することによって、対象化合物の特性がどの既知化合物の特性に類似するかを予測する。
例えば、分離すべき特性をそれぞれ有する複数の既知化合物(例えば、「毒性の有無」の特性を分離する場合、「毒性有り」の特性を有する既知化合物Aおよび「毒性無し」の特性を有する既知化合物B)をそれぞれ神経細胞に投与したときに取得された活動データを多変量解析することにより、その特性を分離可能な予測パラメータセットを導出する。この予測パラメータセットを用いて、対象化合物を神経細胞に投与したときに取得された活動データを解析することによって、対象化合物の特性が「毒性有り」であるのか、「毒性無し」であるのかを予測することができる。分離すべき特性に応じた予測パラメータセットを導出することによって、対象化合物が、どのような薬効を有するか、または、どのような毒性を有するか、または、どのような作用機序を有するかを予測することができるようになる。これにより、非臨床試験において、対象化合物の薬効、毒性、作用機序を予測することが可能になる。例えば、ヒトiPS細胞を用いて解析を行うことにより、ヒト神経系への化合物作用や毒性が予測でき、医薬品の開発や化合物全般の開発を迅速かつ低コストに実現できるようになる。
さらに、本手法によると、例えば、対象化合物が、予測された薬効においてどのような作用機序を有するか、または、予測された毒性において、どのような作用機序を有するかも予測して出力することができる。このように、対象化合物の抽象的な特性のみならず、具体的な特性までも予測することができる。
さらに、対象化合物として既知の化合物を用いると、当該既知の化合物のドラッグリポジショニングを行うことが可能になる。すなわち、既知の化合物を神経細胞に投与したときに取得された活動データを解析することによって予測された薬効、毒性、作用機序に基づいて、当該既知の化合物の新たな薬効を見出すことができる。これにより、非臨床試験において、既知化合物の新たな薬効を見出すことができ、治療薬の開発コストを大幅に削減することができる。
また、予測パラメータセットを導出する際に、細胞種間差、サンプル間差、または、施設間差を有するデータを用いることにより、導出される予測パラメータセットが、細胞種間差、サンプル間差、施設間差に依存しないものとなる。これにより、神経活動データを用いた統一的な薬剤評価系の構築が可能になる。
このような多変量解析を用いて対象化合物の特性を予測することは、例えば、以下に説明する対象化合物の特性を予測するためのコンピュータシステムによって実現され得る。
以下、図面を参照しながら、本発明の実施の形態を説明する。
2.対象化合物の特性を予測するためのコンピュータシステムの構成
図1は、本発明の対象化合物の特性を予測するためのコンピュータシステム100の構成の一例を示す。
図1は、本発明の対象化合物の特性を予測するためのコンピュータシステム100の構成の一例を示す。
コンピュータシステム100は、受信手段110と、プロセッサ120と、メモリ130と、出力手段140とを備える。コンピュータシステム100は、データベース部200に接続され得る。
受信手段110は、コンピュータシステム100の外部からデータを受信することが可能であるように構成されている。受信手段110は、例えば、コンピュータシステム100の外部からネットワークを介してデータを受信してもよいし、コンピュータシステム100に接続された記憶媒体(例えば、USBメモリ、光ディスク等)またはデータベース部200からデータを受信してもよい。ネットワークを介してデータを受信する場合は、ネットワークの種類は問わない。受信手段110は、例えば、Wi-fi等の無線LANを利用してデータを受信してもよいし、インターネットを介してデータを受信してもよい。
受信手段110は、例えば、既知化合物または対象化合物に対する神経細胞の活動データを受信する。神経細胞の活動データは、公知の任意の手法によって取得され得るデータである。
神経細胞の活動データは、例えば、微小電極アレイ(MEA:Micro-Eelectrode Array)を用いて測定された電位データである。この電位データは、例えば、MEA上に神経細胞を培養し、培養された神経細胞に既知化合物または対象化合物を投与したときの神経細胞の活動電位およびシナプス電流成分を測定することによって取得される。例えば、CMOSを利用するCMOS-MEAをMEAとして用いてもよい。CMOS-MEAを用いると、比較的に高分解能のデータを取得することが可能になる。
神経細胞の活動データは、例えば、多点電極を用いて測定された電位データである。この電位データは、例えば、動物実験において動物の脳に多点電極を刺し、既知化合物または対象化合物を投与したときの神経細胞の活動電位を測定することによって取得される。
神経細胞の活動データは、例えば、光計測法によって取得される画像データであってもよい。光計測法は、例えば、Ca2+イメージング法である。神経細胞に既知化合物または対象化合物を投与したときの神経細胞の活動の様子をCa2+イメージング法で画像化することによって画像データが取得される。光計測法は、例えば、膜電位感受性色素を用いた膜電位イメージング法である。例えば、神経細胞に既知化合物または対象化合物を投与したときの神経細胞の活動の様子を膜電位イメージング法で画像化することによって画像データが取得される。
1つの実施形態において、時間分解能の観点から、MEAを用いることが好ましくあり得る。MEAは、Ca2+イメージング法および膜電位イメージング法に比べて、時間分解能が高く、1つ1つのスパイクを正確に検出することができ、得られる活動データの情報量が多くなるからである。膜電位イメージング法は、Ca2+イメージング法よりも時間分解能が高い。
別の実施形態において、長期計測の観点から、MEAを用いることが好ましくあり得る。MEAは、Ca2+イメージング法および膜電位イメージング法に比べて、非侵襲性が高いからである
さらに別の実施形態において、細胞分解能の観点から、Ca2+イメージング法または膜電位イメージング法を用いることが好ましくあり得る。Ca2+イメージング法または膜電位イメージング法は、顕微鏡観察により全ての細胞をマーキングすることができるため、MEAに比べて空間分解能が高く、後続処理においてラスタープロット画像を容易に作成することができるからである。
受信手段110は、例えば、既知化合物または対象化合物に対する神経細胞の活動データを変換した画像を受信するようにしてもよい。変換した画像は、例えば、電位データとして取得された神経細胞の活動データ、または、画像データとして取得された神経細胞の活動データを変換したラスタープロット画像であってもよく、電位データとして取得された神経細胞の活動データ、または、画像データとして取得された神経細胞の活動データを変換したヒストグラムであってもよく、電位データとして取得された神経細胞の活動データから変換された波形画像であってもよく、電位データとして取得された神経細胞の活動データを周波数成分解析(例えば、ウェーブレット変換、フーリエ変換(例えば高速フーリエ変換(FFT))することにより変換された周波数の強度マップまたはスペクトル強度マップであってもよい。スペクトル強度マップは、例えば、電位データとして取得された神経細胞の活動データを波形(または、周波数分割波形)に変換し、所定の時間間隔(例えば、1秒間隔)で区切った波形をFFTすることにより取得され得る。ここで、周波数分割波形とは、特定の周波数帯域成分を抽出した波形のことをいい、特定の周波数帯域成分は、例えば、θ波帯成分(約4~約8Hz)、α波帯成分(約8~約13Hz)、β波帯成分(約13~約30Hz)、γ波帯成分(約30~約100Hz)等であり得る。1つの実施形態においては、周波数帯域成分は、θ波帯成分であり得る。別の実施形態においては、周波数帯域成分は、α波帯成分であり得る。さらに別の実施形態においては、周波数帯域成分は、β波帯域成分であり得る。さらに別の実施形態においては、周波数帯域成分は、γ波帯域成分であり得る。周波数分割波形を用いることにより、生体で見られる現象に着目した解析が可能になる。例えば、てんかん発作時に脳波のγ波帯成分が増強されることから、γ波帯成分の周波数分割波形を用いることにより、てんかん発作に関連した対象化合物の特性を解析することが可能になる。
ここで、神経細胞は、例えば、神経幹細胞である。神経幹細胞は、例えば、動物の神経幹細胞であってもよく、ヒト神神経幹細胞であってもよい。神経幹細胞は、例えば、iPS細胞である。神経細胞は、例えば、動物から採取された初代神経細胞であってもよい。
受信手段110が受信したデータは、後続の処理のために、プロセッサ120に渡される。
プロセッサ120は、コンピュータシステム100全体の動作を制御する。プロセッサ120は、メモリ130に格納されているプログラムを読み出し、そのプログラムを実行する。これにより、コンピュータシステム100を所望のステップを実行する装置として機能させることが可能である。プロセッサ120は、単一のプロセッサによって実装されてもよいし、複数のプロセッサによって実装されてもよい。プロセッサ120によって処理されたデータは、出力のために、出力手段140に渡される。
メモリ130には、コンピュータシステム100における処理を実行するためのプログラムやそのプログラムの実行に必要とされるデータ等が格納されている。メモリ130には、例えば、対象化合物の特性を予測するためのプログラム(例えば、後述する図7、図8、図9に示される処理を実現するプログラム)が格納されている。メモリ130には、任意の機能を実装するアプリケーションが格納されていてもよい。例えば、受信した電位データまたは画像データをラスタープロット画像、ヒストグラム、波形画像等に変換するためのプログラムを格納してもよい。ここで、プログラムをどのようにしてメモリ130に格納するかは問わない。例えば、プログラムは、メモリ130にプリインストールされていてもよい。あるいは、プログラムは、ネットワークを経由してダウンロードされることによってメモリ130にインストールされるようにしてもよい。メモリ130は、任意の記憶手段によって実装され得る。
出力手段140は、コンピュータシステム100の外部にデータを出力することが可能であるように構成されている。出力手段140がどのような態様でコンピュータシステム100から情報を出力することを可能にするかは問わない。例えば、出力手段140が表示画面である場合、表示画面に情報を出力するようにしてもよい。あるいは、出力手段140がスピーカである場合には、スピーカからの音声によって情報を出力するようにしてもよい。あるいは、出力手段140がデータ書き込み装置である場合、コンピュータシステム100に接続された記憶媒体またはデータベース部200に情報を書き込むことによって情報を出力するようにしてもよい。あるいは、出力手段140が送信器である場合、送信器がネットワークを介してコンピュータシステム100の外部に情報を送信することにより出力してもよい。この場合、ネットワークの種類は問わない。例えば、送信器は、インターネットを介して情報を送信してもよいし、LANを介して情報を送信してもよい。例えば、出力手段140は、データの出力先のハードウェアまたはソフトウェアによって取り扱い可能な形式に変換して、または、データの出力先のハードウェアまたはソフトウェアによって取り扱い可能な応答速度に調整してデータを出力するようにしてもよい。
コンピュータシステム100に接続されているデータベース部200には、例えば、既知化合物に対する神経細胞の活動データが格納され得る。既知化合物に対する神経細胞の活動データは、その既知化合物の特性と関連付けられて格納されてもよい。データベース部200には、例えば、対象化合物に対する神経細胞の活動データが格納され得る。データベース部200には、例えば、コンピュータシステム100によって出力されたデータ(例えば、予測された対象化合物の特性)が格納され得る。データベース部200には、特定された予測パラメータが格納されてもよい。データベース部200には、既知化合物に対する神経細胞の活動データおよび/または対象化合物に対する神経細胞の活動データの多変量解析の結果データが格納されてもよい。データベース部200に格納される既知化合物または対象化合物に対する神経細胞の活動データは、例えば、外れ値を示すデータを除外したうえで格納され得る。これは、例えば、後述する多変量解析処理によって特定され得る化合物の特性を利用し、その特性と同様の特性を有しない活動データを外れ値として除外することによって達成され得る。これにより、データベース部200が格納し得るデータが洗練され得る。
図1に示される例では、データベース部200は、コンピュータシステム100の外部に設けられているが、本発明はこれに限定されない。データベース部200をコンピュータシステム100の内部に設けることも可能である。このとき、データベース部200は、メモリ130を実装する記憶手段と同一の記憶手段によって実装されてもよいし、メモリ130を実装する記憶手段とは別の記憶手段によって実装されてもよい。いずれにせよ、データベース部200は、コンピュータシステム100のための格納部として構成される。データベース部200の構成は、特定のハードウェア構成に限定されない。例えば、データベース部200は、単一のハードウェア部品で構成されてもよいし、複数のハードウェア部品で構成されてもよい。例えば、データベース部200は、コンピュータシステム100の外付けハードディスク装置として構成されてもよいし、ネットワークを介して接続されるクラウド上のストレージとして構成されてもよい。
図2は、プロセッサ120の構成の一例を示す。
プロセッサ120は、少なくとも、多変量解析手段121と、予測パラメータ特定手段122と、予測手段123とを備える。
多変量解析手段121は、入力されたデータに対して多変量解析を行うように構成されている。例えば、多変量解析手段121は、受信された第1の既知化合物に対する神経細胞の活動データおよび第2の既知化合物に対する神経細胞の活動データに対して多変量解析を行う。多変量解析は、例えば、主成分解析である。主成分解析によって、データの少なくとも第1主成分および第2主成分を算出することができる。例えば、主成分解析によって、第3主成分、第4主成分・・・第n-1主成分を算出するようにしてもよい(ここで、nは入力されたデータの次元数)。多変量解析は、例えば、クラスター分析である。クラスター分析によって、データを複数のクラスターに分類することができる。クラスター分析のアルゴリズムとして、例えば、ward法(内部平方距離)を用いることができ、平均の距離、重心間の距離、最大距離、最短距離を用いることもできる。類似度を決定するための指標として、例えば、ユークリッド距離を用いることができ、マハラノビス距離、スピアマンの順位相関を用いることもできる。類似度を決定するための指標として、例えば、コサイン類似度を用いることもできる。類似度を決定するための指標として、例えば、ユークリッド距離とコサイン類似度との組み合わせを用いることもできる。類似度を決定するための指標の閾値は、データに応じて任意の値に設定することができる。
多変量解析手段121に入力されるデータは、例えば、同一の化合物を異なる細胞種に投与した場合の複数のデータ、同一の化合物を異なるベンダーから供給された同一の細胞種に投与した場合の複数のデータ、同一の化合物を同一のベンダーから供給された異なるロットのサンプルに投与した場合の複数のデータ、同一の化合物を同一のベンダーから異なる日に供給されたサンプルに投与した場合の複数のデータ、同一の化合物を異なる施設で試験した場合の複数のデータを含み得る。このように、複数のデータを多変量解析手段121で処理することにより、後述する予測パラメータ特定手段122によって、サンプル間差、細胞種間差、施設間差に依存しない予測パラメータセットを特定することができるようになる。
多変量解析手段121に入力されるデータは、例えば、既知化合物または対象化合物に対する神経細胞の活動データまたはそれを変換した画像であり得る。変換した画像は、例えば、電位データとして取得された神経細胞の活動データ、または、画像データとして取得された神経細胞の活動データを変換したラスタープロット画像であってもよく、電位データとして取得された神経細胞の活動データ、または、画像データとして取得された神経細胞の活動データを変換したヒストグラムであってもよく、電位データとして取得された神経細胞の活動データから変換された波形画像であってもよく、電位データとして取得された神経細胞の活動データを周波数成分解析(例えば、ウェーブレット変換)することにより変換された周波数の強度マップであってもよい。変換した画像は、例えば、受信手段110によって受信されたものであってもよいし、多変量解析手段121の前段でプロセッサ120によって変換された画像であってもよい。
多変量解析手段121は、例えば、候補パラメータセット中の各候補パラメータの全ての組み合わせについて、第1の既知化合物に対する神経細胞の活動データおよび第2の既知化合物に対する神経細胞の活動データに対して多変量解析を行う。多変量解析手段121は、例えば、候補パラメータセット中の各候補パラメータの全ての組み合わせについて、3以上の化合物に対する神経細胞の活動データに対して多変量解析を行ってもよい。
多変量解析のためのパラメータ組は、2つ以下の候補パラメータでは多変量解析ができないため、3つ以上の候補パラメータを含む必要がある。例えば、候補パラメータセットが10個の候補パラメータから成る場合、各候補パラメータの全ての組み合わせは、968個のパラメータ組となる(各パラメータ組は、3~10個の候補パラメータを含む)。このとき、多変量解析手段121は、968個のパラメータ組のそれぞれについて、第1の既知化合物に対する神経細胞の活動データおよび第2の既知化合物に対する神経細胞の活動データに対して多変量解析を行う。
図3は、候補パラメータセットに含まれる候補パラメータの一例を説明する図である。
図3のグラフは、ラスタープロット画像と、そのラスタープロット画像から生成されたヒストグラムとを組み合わせた図であり、グラフの下側にラスタープロット画像が示され、グラフの上側にヒストグラムが示されている。ラスタープロット画像では、縦軸が電極を示し、横軸が時間を示しており、黒色のプロットがスパイクを表している。ヒストグラムでは、縦軸が1秒当たりのスパイク数を示し、横軸が時間を示している。
図3のグラフは、ラスタープロット画像と、そのラスタープロット画像から生成されたヒストグラムとを組み合わせた図であり、グラフの下側にラスタープロット画像が示され、グラフの上側にヒストグラムが示されている。ラスタープロット画像では、縦軸が電極を示し、横軸が時間を示しており、黒色のプロットがスパイクを表している。ヒストグラムでは、縦軸が1秒当たりのスパイク数を示し、横軸が時間を示している。
候補パラメータは、例えば、
(1)Total Spikes(TS:計測中に検出されたスパイクの総数)、
(2)Number of SBF(NoB:計測中に検出された同期バースト発火の総数)、
(3)Inter Burst Interval(IBI:同期バースト発火の終点から次の同期バースト発火の始点までの時間)、
(4)Duration of SBF(バースト長:同期バースト発火の始点から終点までの時間)、
(5)Spikes in a SBF(バースト中スパイク数:同期バースト発火中に検出されたスパイク数)、
(6)Peak Spikes(PS:スパイク数のヒストグラムのピーク値)、
(7)CV of Peak Spikes(PSの変動係数。変動係数(CV)=標準偏差/平均値)、
(8)Inter Peak Interval(IPI:ヒストグラムのピーク値から次のピーク値までの時間)、
(9)CV of Inter Peak Interval(IPIの変動係数)
を含む。
(1)Total Spikes(TS:計測中に検出されたスパイクの総数)、
(2)Number of SBF(NoB:計測中に検出された同期バースト発火の総数)、
(3)Inter Burst Interval(IBI:同期バースト発火の終点から次の同期バースト発火の始点までの時間)、
(4)Duration of SBF(バースト長:同期バースト発火の始点から終点までの時間)、
(5)Spikes in a SBF(バースト中スパイク数:同期バースト発火中に検出されたスパイク数)、
(6)Peak Spikes(PS:スパイク数のヒストグラムのピーク値)、
(7)CV of Peak Spikes(PSの変動係数。変動係数(CV)=標準偏差/平均値)、
(8)Inter Peak Interval(IPI:ヒストグラムのピーク値から次のピーク値までの時間)、
(9)CV of Inter Peak Interval(IPIの変動係数)
を含む。
(基本活動パラメータ)
候補パラメータは、例えば、基本活動パラメータを含む。基本活動パラメータは、
・TS、
・NoB、
・Burst Frequency(バーストの周波数:NoB/計測時間(s))、
・Burst percentage(バーストパーセンテージ:全同期バースト発火中のスパイク数/TS)、および
・Burst Duration Interquartile Range(バースト長の四分位範囲)
を含む。候補パラメータセットに、基本活動パラメータ、特にTS、NoB等のパラメータを含めることにより、神経ネットワーク活動の増減という概念を含んで多変量解析がなされるため、化合物投与による神経ネットワーク活動の基本的な変化と方向性とを指標として化合物の応答を分離することができるという効果が得られる。また、基本活動パラメータは、発火数やバースト発火回数等の増減に化合物応答が顕著に見られる化合物の分離に有効であり得、必須でもあり得る。候補パラメータセットに、基本活動パラメータを含めることにより、既知化合物の分離および対象化合物の予測の精度が向上し、誤った予測を防ぐことができるという利点も有する。
候補パラメータは、例えば、基本活動パラメータを含む。基本活動パラメータは、
・TS、
・NoB、
・Burst Frequency(バーストの周波数:NoB/計測時間(s))、
・Burst percentage(バーストパーセンテージ:全同期バースト発火中のスパイク数/TS)、および
・Burst Duration Interquartile Range(バースト長の四分位範囲)
を含む。候補パラメータセットに、基本活動パラメータ、特にTS、NoB等のパラメータを含めることにより、神経ネットワーク活動の増減という概念を含んで多変量解析がなされるため、化合物投与による神経ネットワーク活動の基本的な変化と方向性とを指標として化合物の応答を分離することができるという効果が得られる。また、基本活動パラメータは、発火数やバースト発火回数等の増減に化合物応答が顕著に見られる化合物の分離に有効であり得、必須でもあり得る。候補パラメータセットに、基本活動パラメータを含めることにより、既知化合物の分離および対象化合物の予測の精度が向上し、誤った予測を防ぐことができるという利点も有する。
(バースト構造パラメータ)
候補パラメータは、例えば、バースト構造パラメータの全バーストでの平均値を含む。バースト構造パラメータは、同期バースト発火に関するパラメータであり、例えば、
・バースト長、
・バースト中スパイク数、
・IBI、
・IPI、
・PS、
・Peak time percentage(ピーク時間パーセンテージ:バースト長を100%としたときにバースト内のピークスパイクが現れる時刻を%で表した値。バーストの開始時刻でピークスパイクが現れると0%、バーストの終了時刻でピークスパイクが現れると100%となる)、
・mean ISI within Burst(バースト内平均ISI:バースト内のISI(Inter spike interval:スパイク間隔)の平均値)、
・median ISI within Burst(バースト内中央ISI:バースト内のISIの中央値)、
・median/mean ISI within Burst(バースト内中央ISI/平均ISI:バースト内のISIの中央値/平均値)
を含む。候補パラメータセットに、バースト構造パラメータを含めることにより、バースト構造パラメータに変化が認められる化合物応答を分離するように多変量解析がなされるため、化合物の用量依存的な変化の検出、化合物応答の分離、および、作用機序予測の精度が向上するという効果が得られる。
候補パラメータは、例えば、バースト構造パラメータの全バーストでの平均値を含む。バースト構造パラメータは、同期バースト発火に関するパラメータであり、例えば、
・バースト長、
・バースト中スパイク数、
・IBI、
・IPI、
・PS、
・Peak time percentage(ピーク時間パーセンテージ:バースト長を100%としたときにバースト内のピークスパイクが現れる時刻を%で表した値。バーストの開始時刻でピークスパイクが現れると0%、バーストの終了時刻でピークスパイクが現れると100%となる)、
・mean ISI within Burst(バースト内平均ISI:バースト内のISI(Inter spike interval:スパイク間隔)の平均値)、
・median ISI within Burst(バースト内中央ISI:バースト内のISIの中央値)、
・median/mean ISI within Burst(バースト内中央ISI/平均ISI:バースト内のISIの中央値/平均値)
を含む。候補パラメータセットに、バースト構造パラメータを含めることにより、バースト構造パラメータに変化が認められる化合物応答を分離するように多変量解析がなされるため、化合物の用量依存的な変化の検出、化合物応答の分離、および、作用機序予測の精度が向上するという効果が得られる。
候補パラメータは、例えば、バースト構造パラメータ(例えば、バースト長、バースト中スパイク数、IBI、IPI、PS、ピーク時間パーセンテージ、バースト内平均ISI、バースト内中央ISI、バースト内中央ISI/平均ISIのうちの少なくとも1つ)の全バーストでの標準偏差または中央絶対偏差を含んでもよい。候補パラメータは、例えば、バースト構造パラメータ(例えば、バースト長、バースト中スパイク数、IBI、IPI、PS、ピーク時間パーセンテージ、バースト内平均ISI、バースト内中央ISI、バースト内中央ISI/平均ISIのうちの少なくとも1つ)の全バーストでの中央値を含んでもよい。候補パラメータは、例えば、バースト構造パラメータ(例えば、バースト長、バースト中スパイク数、IBI、IPI、PS、ピーク時間パーセンテージ、バースト内平均ISI、バースト内中央ISI、バースト内中央ISI/平均ISIのうちの少なくとも1つ)の全バーストでの標準誤差を含んでもよい。
(周期性に関するパラメータ)
候補パラメータは、周期性に関するパラメータを含む。周期性に関するパラメータは、例えば、Periodicity(周期性パラメータ)を含む。Periodicity(周期性パラメータ)は、以下の式で表される。

ここで、All frequency bandは、スパイク数のヒストグラムに対して周波数解析を行ったときに含まれる周波数の全帯域幅であり、例えば約5Hzである。Dominant frequency bandは、スパイク数のヒストグラムに対して周波数解析を行ったときのパワーが閾値を超える周波数の帯域幅である。Periodicity(周期性パラメータ)は、例えば、図4A~図4Cに示されるように導出される。
候補パラメータは、周期性に関するパラメータを含む。周期性に関するパラメータは、例えば、Periodicity(周期性パラメータ)を含む。Periodicity(周期性パラメータ)は、以下の式で表される。
ここで、All frequency bandは、スパイク数のヒストグラムに対して周波数解析を行ったときに含まれる周波数の全帯域幅であり、例えば約5Hzである。Dominant frequency bandは、スパイク数のヒストグラムに対して周波数解析を行ったときのパワーが閾値を超える周波数の帯域幅である。Periodicity(周期性パラメータ)は、例えば、図4A~図4Cに示されるように導出される。
図4A-aは、ラスタープロット画像と、そのラスタープロット画像から生成されたヒストグラムとを組み合わせた図であり、グラフの下側にラスタープロット画像が示され、グラフの上側にヒストグラムが示されている。ラスタープロット画像では、縦軸が電極を示し、横軸が時間を示しており、黒色のプロットがスパイクを表している。ヒストグラムでは、縦軸が1秒当たりのスパイク数を示し、横軸が時間を示している。上から、ビヒクルを投与した場合のラスタープロット画像およびヒストグラム、約0.1μMで化合物を投与した場合のラスタープロット画像およびヒストグラム、約0.3μMで化合物を投与した場合のラスタープロット画像およびヒストグラム、約1μMで化合物を投与した場合のラスタープロット画像およびヒストグラム、約3μMで化合物を投与した場合のラスタープロット画像およびヒストグラム、約10μMで化合物を投与した場合のラスタープロット画像およびヒストグラムである。
図4A-bは、図4A-aのヒストグラムに対して離散フーリエ変換(DFT)を行うことによって導出されるパワースペクトルを示す。縦軸がパワーを示し、横軸が周波数を示している。上から、ビヒクルを投与した場合のパワースペクトル、約0.1μMで化合物を投与した場合のパワースペクトル、約0.3μMで化合物を投与した場合のパワースペクトル、約1μMで化合物を投与した場合のパワースペクトル、約3μMで化合物を投与した場合のパワースペクトル、10μMで化合物を投与した場合のパワースペクトルである。
図4A-bのパワースペクトルの各々において、基本波のピーク値の約10%を閾値として、図4Bに示されるように、当該閾値を超える周波数帯域の帯域幅をDominant frequency bandと定義し、パワースペクトルに含まれる周波数の全帯域幅をAll frequency bandとして定義する。これにより、図4A-bのパワースペクトルの各々において、Periodicityを算出することができる。例えば、図4Bに示されるように、複数の帯域幅が閾値を超える場合、Dominant
frequency bandの値は、複数の帯域幅の合計値となる。
frequency bandの値は、複数の帯域幅の合計値となる。
図4Cは、ビヒクルを投与した場合の値を100%としたときのPeriodicityおよびNoBの値を示す棒グラフである。黒の棒グラフがPeriodicityの値を示し、白の棒グラフがNoBの値を示す。図4Cのグラフから分かるように、NoBの値は、化合物の濃度に応じてほとんど変化しない一方、Periodicityの値は、化合物の濃度に応じて大きく変化している。すなわち、Periodicityの値は、濃度変化を反映した指標であると言える。
周期性に関するパラメータは、例えば、バースト構造パラメータ(例えば、バースト長、バースト中スパイク数、IBI、IPI、PS、ピーク時間パーセンテージ、バースト内平均ISI、バースト内中央ISI、バースト内中央ISI/平均ISIのうちの少なくとも1つ)の変動係数(CV)を含んでもよい。候補パラメータセットに、バースト構造パラメータのCVを含めることにより、バーストの概形の規則性という概念を含んで多変量解析がなされるため、バーストの概形の規則性が変化する既知化合物の分離および対象化合物の予測の精度が向上するという効果が得られる。
周期性に関するパラメータは、例えば、CV ISI within Burst(バースト内CV ISI:バースト内のISIの変動係数)の全バーストでの平均値、標準偏差、標準誤差、中央値、中央絶対偏差、または、変動係数を含んでもよい。これらはそれぞれ、バースト毎にISIの変動係数が算出されるため、それぞれのバーストのISIの変動係数を用いて、全バーストでの平均値、標準偏差、中央絶対値、または、変動係数が算出される。候補パラメータセットに、バースト内ISIの変動係数を含めることにより、バースト内発火の規則性という概念を含んで多変量解析がなされるため、バースト内発火の規則性が変化する既知化合物の分離および対象化合物の予測の精度が向上するという効果が得られる。
上述した周期性に関するパラメータを候補パラメータセットに含めることにより、バースト発火の発生に周期性が認められる薬剤応答を分離するように多変量解析がなされるため、化合物の用量依存的な変化の検出、化合物応答の分離、および、作用機序予測の精度が向上するという効果が得られる。例えば、周期性に関するパラメータは、神経ネットワーク活動を興奮させる化合物(痙攣陽性化合物)の種類を分離するのに有効である。周期性に関するパラメータを候補パラメータセットに含めることにより、分離することのできる化合物の種類を増やすことができるという利点も有する。
(周波数解析パラメータ)
候補パラメータは、例えば、周波数解析パラメータを含む。周波数解析パラメータは、例えば、約250Hz以下の周波数成分を解析することが可能なパラメータである。約250Hz以下の周波数成分は、活動電位成分(約1kHz以上)よりも低く、神経機能で重要となるシナプス後電流成分が反映されているため、約250Hz以下の周波数成分を解析するパラメータにより、神経細胞に対する化合物の特性を検出することが可能になる。さらに、約250Hz以下の周波数成分を解析するパラメータは、in vivo脳波と比較可能な指標であり、in vivoとin vitroとの相関を取ることを可能にする。
候補パラメータは、例えば、周波数解析パラメータを含む。周波数解析パラメータは、例えば、約250Hz以下の周波数成分を解析することが可能なパラメータである。約250Hz以下の周波数成分は、活動電位成分(約1kHz以上)よりも低く、神経機能で重要となるシナプス後電流成分が反映されているため、約250Hz以下の周波数成分を解析するパラメータにより、神経細胞に対する化合物の特性を検出することが可能になる。さらに、約250Hz以下の周波数成分を解析するパラメータは、in vivo脳波と比較可能な指標であり、in vivoとin vitroとの相関を取ることを可能にする。
周波数解析パラメータは、例えば、電位データまたは波形画像から算出された強度を含む。この強度は、電位データまたは波形画像を複数の周波数成分に分解し、分解された各周波数成分に対して以下の式で表される。

複数の周波数成分は、例えば、約4~約8Hzのθ波帯、約8~約14Hzのα波帯、約15~約30Hzのβ波帯、約35~約50Hzのγ波帯、約80~約150Hzのhigh-γ波帯、および、約150~約200Hzを含む。波形画像は、例えば、図5Aに示されるように複数の周波数成分に分解される。分解は、例えば、各周波数成分に対応するバンドパスフィルタを用いて行われる。
図5Aは、複数の周波数成分に分解された波形画像の一例を概略的に示す。図5Aに示されるグラフは、電位波形画像であり、縦軸が電位を示し、横軸が時間を示す。
図5Aに示される例では、1つのバーストを含む周期の波形が抽出されて、約4~約8Hzのθ波帯、約8~約14Hzのα波帯、約15~約30Hzのβ波帯、約35~約50Hzのγ波帯、約80~約150Hzのhigh-γ波帯、および、約150~約200Hzの周波数成分に分解されている。
図5Bは、図5Aの各周波数成分において強度を算出した結果の一例を示すグラフである。縦軸が化合物投与前の値を100%としたときの強度の値を示す。図5Bでは、複数の濃度(約1μM、約10μM、約100μM、約1mM)における結果が示されている。図5Bのグラフから分かるように、各周波数成分において、強度の値は、化合物の濃度に応じて変化している。すなわち、強度の値は、濃度変化を反映した指標であると言える。
周波数解析パラメータは、例えば、ウェーブレット変換から算出された強度を含む。この強度は、電位データまたは波形画像をウェーブレット変換することによって形成されるスカログラムから算出される。例えば、化合物投与前のデータをウェーブレット変換することによって形成されたスカログラムと、化合物投与後のデータをウェーブレット変換することによって形成されたスカログラムとの差分をとることによって強度を算出することができる。
ウェーブレット変換によって形成されたスカログラムでは、X軸のピクセル数がバースト長によって変動し、Y軸のピクセル数が例えば170ピクセルである。各周波数帯を占めるY軸のピクセル数は、各周波数帯で異なっており、例えば、約5~約8Hzの周波数帯のY軸のピクセル数は21ピクセルであり、約8~約14Hzの周波数帯のY軸のピクセル数は15ピクセルであり、約15~約25Hzの24ピクセルであり、約30~約50Hzの周波数帯のY軸のピクセルは31ピクセルであり、約70~約150Hzの周波数帯のY軸のピクセルは34ピクセルであり、約150~約200Hzの周波数帯のY軸のピクセルは13ピクセルである。従って、各周波数帯の強度を単純に比較することはできない。しかしながら、以下の式を用いて規格化を行うことにより、各周波数の強度を比較することが可能になる。
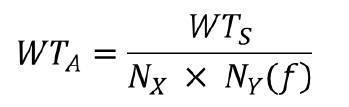
ここで、WTAは、各周波数帯の1ピクセルあたりのウェーブレット変換係数であり、WTAは、各周波数帯の1ピクセルあたりのウェーブレット変換係数であり、WTBは、各周波数帯域のウェーブレット変換係数の合計値であり、NXは、X軸のピクセル数であり、NY(f)は、各周波数帯のY軸のピクセル数である。化合物投与前のデータをウェーブレット変換することによって形成されたスカログラムにおいてWTAを導出し、化合物投与後のデータをウェーブレット変換することによって形成されたスカログラムにおいてWTAを導出し、化合物投与前のWTAと化合物投与後のWTAとの差分をとることによって強度を算出することができる。
ここで、WTAは、各周波数帯の1ピクセルあたりのウェーブレット変換係数であり、WTAは、各周波数帯の1ピクセルあたりのウェーブレット変換係数であり、WTBは、各周波数帯域のウェーブレット変換係数の合計値であり、NXは、X軸のピクセル数であり、NY(f)は、各周波数帯のY軸のピクセル数である。化合物投与前のデータをウェーブレット変換することによって形成されたスカログラムにおいてWTAを導出し、化合物投与後のデータをウェーブレット変換することによって形成されたスカログラムにおいてWTAを導出し、化合物投与前のWTAと化合物投与後のWTAとの差分をとることによって強度を算出することができる。
周波数解析パラメータは、例えば、FFTによって算出されたスペクトル強度を含む。このスペクトル強度は、電位データを波形に変換し、所定の時間間隔(例えば、1秒間隔)で区切った波形を高速フーリエ変換(FFT)することによって形成されるスペクトル強度マップから算出される。例えば、波形をFFTすることによって形成されたスペクトル強度マップから、1~250Hzの1Hz毎の各周波数のスペクトル強度を算出することができる。これらのスペクトル強度は、250個のパラメータとして利用することができる。さらに、複数の時間間隔内の波形を利用して時系列のスペクトル強度を利用することにより、多変量解析結果の時系列変化を分析することができるようになる。これにより、時系列変化に基づいた既知化合物の分離および対象化合物の予測を行うことができる。
(非線形時系列解析パラメータ)
候補パラメータは、例えば、非線形時系列解析パラメータを含む。非線形時系列解析パラメータは、例えば、Detrended fluctuation analysis(DFA)によって算出されるスケーリング指数αである。DFAは、非定常な変動成分(トレンド)を除き、ゆらぎの長期相関をスケーリング指数αによって特徴づける手法である。DFAによって算出される変動F(n)は、

の関係を有し、ここで、スケーリング指数αが、0.5である場合、長期相関が無いことを示し、α>0.5である場合、正の相関があることを示し、α<0.5である場合、負の相関があることを示し、α=1である場合、1/fノイズであることを示す。
候補パラメータは、例えば、非線形時系列解析パラメータを含む。非線形時系列解析パラメータは、例えば、Detrended fluctuation analysis(DFA)によって算出されるスケーリング指数αである。DFAは、非定常な変動成分(トレンド)を除き、ゆらぎの長期相関をスケーリング指数αによって特徴づける手法である。DFAによって算出される変動F(n)は、
の関係を有し、ここで、スケーリング指数αが、0.5である場合、長期相関が無いことを示し、α>0.5である場合、正の相関があることを示し、α<0.5である場合、負の相関があることを示し、α=1である場合、1/fノイズであることを示す。
例えば、発火タイミングの規則性に着目し、時系列のISIに対してDFAを行うことにより、時系列のISIをスケーリング指数αで定量化することができる。
候補パラメータは、例えば、電極間の発火間隔のZscoreを含んでもよい。Zscoreは、細胞のシナプス結合強度の指標となる。Zscoreは、例えば、以下の式によって算出される。

ここで、Nrealは、2つの電極のスパイク間隔(ISI)が100ms以内のもの(Synchronized spikes)をカウントした値である。具体的には、第1の電極でスパイクが検出された時間と、第2の電極でスパイクが検出された時間との差が100ms以内であったものの総数である。Avesurrogateは、検出されたスパイクをランダムに並べ替え、並べ替えられたデータにおいて、2つの電極のISIが100ms以内のもの(Synchronized spikes)をカウントし、これを複数回(例えば、100回)繰り返して得られたSynchronized spikesの数の平均値である。SDsurrogateは、検出されたスパイクをランダムに並べ替え、並べ替えられたデータにおいて、2つの電極のISIが100ms以内のもの(Synchronized spikes)をカウントし、これを複数回(例えば、100回)繰り返して得られたSynchronized spikesの数の標準偏差である。Zscoreはシナプス結合強度の指標となることから、Zscoreを含めた多変量分析を行うことで、シナプスの結合強度への影響を考慮した対象化合物の特性予測が可能となる。
Zscoreのより具体的な算出手法は、例えば、Sasaki T, Suzuki I, Yokoi R, Sato K, Ikegaya Y. "Synchronous spike patterns in differently mixed cultures of human iPSC-derived glutamatergic and GABAergic neurons." Biochem Biophys Res Commun. 2019 May 28;513(2):300-305. doi: 10.1016/j.bbrc.2019.03.161. Epub 2019 Apr 4に説明されており、この文献は、参照によって本明細書に援用される。
ここで、Nrealは、2つの電極のスパイク間隔(ISI)が100ms以内のもの(Synchronized spikes)をカウントした値である。具体的には、第1の電極でスパイクが検出された時間と、第2の電極でスパイクが検出された時間との差が100ms以内であったものの総数である。Avesurrogateは、検出されたスパイクをランダムに並べ替え、並べ替えられたデータにおいて、2つの電極のISIが100ms以内のもの(Synchronized spikes)をカウントし、これを複数回(例えば、100回)繰り返して得られたSynchronized spikesの数の平均値である。SDsurrogateは、検出されたスパイクをランダムに並べ替え、並べ替えられたデータにおいて、2つの電極のISIが100ms以内のもの(Synchronized spikes)をカウントし、これを複数回(例えば、100回)繰り返して得られたSynchronized spikesの数の標準偏差である。Zscoreはシナプス結合強度の指標となることから、Zscoreを含めた多変量分析を行うことで、シナプスの結合強度への影響を考慮した対象化合物の特性予測が可能となる。
Zscoreのより具体的な算出手法は、例えば、Sasaki T, Suzuki I, Yokoi R, Sato K, Ikegaya Y. "Synchronous spike patterns in differently mixed cultures of human iPSC-derived glutamatergic and GABAergic neurons." Biochem Biophys Res Commun. 2019 May 28;513(2):300-305. doi: 10.1016/j.bbrc.2019.03.161. Epub 2019 Apr 4に説明されており、この文献は、参照によって本明細書に援用される。
候補パラメータは、例えば、以下のパラメータを含んでもよい。
・Normalized Duration IQR(中央値で正規化したバースト長の四分位範囲)
・Full Width at Half Height of Normalized
Cross Correlation(Cross-Correlogramの半値幅)
・Normalized Duration IQR(中央値で正規化したバースト長の四分位範囲)
・Full Width at Half Height of Normalized
Cross Correlation(Cross-Correlogramの半値幅)
候補パラメータセットは、上述したパラメータの全てを含んでもよいし、上述したパラメータの一部を含んでもよい。候補パラメータセットは、基本活動パラメータのうちの少なくとも1つと、バースト構造パラメータのうちの少なくとも1つと、周期性に関するパラメータのうちの少なくとも1つと、周波数解析パラメータのうちの少なくとも1つと、非線形時系列解析パラメータのうちの少なくとも1つとを含むことが好ましくあり得る。これにより、スパイク情報、周波数解析によるシナプス電流成分の情報、非線形時系列解析によるスパイク発生の時間列情報を含んだ解析が可能となるからである。候補パラメータセットは、上述した候補パラメータセットの全てを含むことがさらに好ましくあり得る。これにより、対象化合物の特性を高い精度で予測することが可能になるからである。
再び図2を参照すると、予測パラメータ特定手段122は、多変量解析手段121による多変量解析の結果に基づいて予測パラメータセットを特定するように構成されている。予測パラメータ特定手段122は、例えば、多変量解析の結果に基づいて、第1の既知化合物と第2の既知化合物とを分離可能な候補パラメータの組み合わせを予測パラメータセットとして特定する。予測パラメータ特定手段122は、例えば、多変量解析の結果に基づいて、3以上の化合物を分離可能な候補パラメータの組み合わせを予測パラメータセットとして特定するようにしてもよい。
例えば、多変量解析が主成分解析である場合、或る候補パラメータの組み合わせについての主成分解析の結果から、第1の既知化合物に対する神経細胞の活動データの第1主成分得点および第2の既知化合物に対する神経細胞の活動データの第1主成分得点に対して有意差検定を行い、有意差が認められれば、その候補パラメータの組み合わせを予測パラメータセットとして特定することができる。例えば、或る候補パラメータの組み合わせについての主成分解析の結果から、第1の既知化合物に対する神経細胞の活動データの第1主成分得点、第2の既知化合物に対する神経細胞の活動データの第1主成分得点、・・・第nの既知化合物に対する神経細胞の活動データの第1主成分得点に対して有意差検定を行い、有意差が認められれば、その候補パラメータの組み合わせを予測パラメータセットとして特定することができる。このような有意差検定を、多変量解析を行った候補パラメータの全ての組み合わせについて行い、有意差が認められた1つまたは複数の候補パラメータの組み合わせを予測パラメータセットとして特定する。
予測パラメータ特定手段122は、任意の有意差検定手法を用いて有意差検定を行うことができる。有意差検定は、例えば、ANOVA(分散分析)を用いて行うことができ、多変量の場合は、MANOVA(多変量分散分析)を用いて行うことができる。例えば、ANOVA(分散分析)またはMANOVA(多変量分散分析)を行い、得られたp値が0.05以下の場合に有意差が認められ得る。有意差が認められるp値の閾値は、0.05に限られず、任意の値とすることができる。
例えば、多変量解析がクラスター分析である場合、或る候補パラメータの組み合わせについてのクラスター分析の結果、第1の既知化合物に対する神経細胞の活動データおよび第2の既知化合物に対する神経細胞の活動データがそれぞれ別のクラスターに分類された場合に、その候補パラメータの組み合わせを予測パラメータセットとして特定することができる。例えば、或る候補パラメータの組み合わせについてのクラスター分析の結果、第1の既知化合物に対する神経細胞の活動データ、第2の既知化合物に対する神経細胞の活動データ、・・・第nの既知化合物に対する神経細胞の活動データが全て別のクラスターに分類された場合に、その候補パラメータの組み合わせを予測パラメータセットとして特定することができる。このように、クラスター分析を候補パラメータの全ての組み合わせについて行い、全データがそれぞれ別のクラスターに分類された1つまたは複数の候補パラメータの組み合わせを予測パラメータセットとして特定する。
予測パラメータ特定手段122は、複数の組の化合物をそれぞれ分離可能な複数の予測パラメータセットを特定することが好ましくあり得る。これにより、複数の特性を予測することが可能になるからである。予測パラメータ特定手段122は、関連する複数の組の化合物をそれぞれ分離可能な複数の予測パラメータセットを特定することがさらに好ましくあり得る。関連する複数の組の化合物を段階的に分離することにより、段階的な特性の予測が可能になり、高い精度の特性予測が可能になるからである。
予測手段123は、入力されたデータから、予測パラメータ特定手段122によって特定された予測パラメータセットに基づいて特性を予測するように構成されている。予測手段123は、予測パラメータセット122から予測パラメータセットを受け取り、かつ、受信手段110によって受信された対象化合物に対するデータも受け取る。対象化合物に対するデータは、例えば、対象化合物に対する神経細胞の活動データまたはそれを変換した画像データ(例えば、ラスタープロット画像、ヒストグラム、波形画像等)であり得る。
予測手段123は、例えば、対象化合物に対するデータが、第1の既知化合物に対するデータまたは第2の既知化合物に対するデータのいずれと類似するかを決定し、決定された第1の既知化合物または第2の既知化合物の特性を、対象化合物の特性として予測する。
予測手段123は、例えば、予測パラメータセットについて対象化合物に対するデータに対して多変量解析を行い、その結果に基づいていずれと類似するかを決定するようにしてもよい。例えば、多変量解析が主成分解析である場合には、予測手段123は、予測パラメータセットについて対象化合物に対するデータの主成分得点を算出し、主成分得点をプロットした主成分プロットに基づいて類似するかを決定する。例えば、主成分プロット間のユークリッド距離、コサイン類似度、またはその組み合わせによって類似するかを決定する。例えば、多変量解析がクラスター分析である場合には、予測手段123は、予測パラメータセットについて、第1の既知化合物に対するデータ、第2の既知化合物に対するデータ、および、対象化合物に対するデータをクラスター分析し、第1の既知化合物に対するデータ、第2の既知化合物に対するデータ、および、対象化合物に対するデータそれぞれをクラスターに分類する。対象化合物に対するデータが第1の既知化合物に対するデータまたは第2の既知化合物に対するデータと同じクラスターに分類されるか否かに基づいて類似するかを決定する。このとき、対象化合物に対するデータが、第1の既知化合物に対するデータが分類されたクラスターまたは第2の既知化合物に対するデータが分類されたクラスターのいずれにも分類されなかった場合には、対象化合物に対するデータは、第1の既知化合物に対するデータまたは第2の既知化合物に対するデータのいずれにも類似していないことになる。
予測手段123は、例えば、サポートベクターマシン(SVM)を利用して、対象化合物に対するデータが、第1の既知化合物に対するデータまたは第2の既知化合物に対するデータのいずれと類似するかを決定することができる。例えば、予測手段123は、予測パラメータセットについて、SVMを利用して、第1の既知化合物に対するデータと第2の既知化合物に対するデータとを分割する超平面を導出し、対象化合物に対するデータが、第1の既知化合物に対するデータ側に属するか、第2の既知化合物に対するデータ側に属するかを判定することによって、第1の既知化合物に対するデータまたは第2の既知化合物に対するデータのいずれと類似するかを決定することができる。
上述した例では、プロセッサが、多変量解析手段121および予測パラメータ特定手段122を備えることを説明したが、予測パラメータセットが予め決定されている場合には、プロセッサは、多変量解析手段121および予測パラメータ特定手段122を備えなくてもよい。この場合、プロセッサは、予め決定された予測パラメータセットを受信し、受信した予測パラメータセットに基づいて特性を予測する。
例えば、プロセッサは、予め決定された予測パラメータセットについて、対象化合物に対するデータ、第1の既知化合物に対するデータおよび第2の既知化合物に対するデータに対して多変量解析を行い、その結果に基づいて対象化合物に対するデータが、第1の既知化合物に対するデータまたは第2の既知化合物に対するデータのいずれと類似するかを決定し、決定された第1の既知化合物または第2の既知化合物の特性を、対象化合物の特性として予測する。例えば、予め決定された予測パラメータセットについて、対象化合物に対するデータ、第1の既知化合物に対するデータおよび第2の既知化合物に対するデータに対して主成分解析を行い、主成分プロットに基づいて(例えば、類似度Sに基づいて)、第1の既知化合物に対するデータまたは第2の既知化合物に対するデータのいずれと類似するかを決定し、決定された第1の既知化合物または第2の既知化合物の特性を、対象化合物の特性として予測する。例えば、予め決定された予測パラメータセットについて、対象化合物に対するデータ、第1の既知化合物に対するデータおよび第2の既知化合物に対するデータに対してクラスター分析を行い、対象化合物に対するデータが第1の既知化合物に対するデータまたは第2の既知化合物に対するデータと同じクラスターに分類されるか否かに基づいて、第1の既知化合物に対するデータまたは第2の既知化合物に対するデータのいずれと類似するかを決定し、決定された第1の既知化合物または第2の既知化合物の特性を、対象化合物の特性として予測する。例えば、SVMを利用して、予め決定された予測パラメータセットについて第1の既知化合物に対するデータと第2の既知化合物に対するデータとを分割する超平面を導出し、対象化合物に対するデータが、第1の既知化合物に対するデータ側に属するか、第2の既知化合物に対するデータ側に属するかを判定することによって、第1の既知化合物に対するデータまたは第2の既知化合物に対するデータのいずれと類似するかを決定することができる。
図1に示される例では、コンピュータシステム100の各構成要素がコンピュータシステム100内に設けられているが、本発明はこれに限定されない。コンピュータシステム100の各構成要素のいずれかがコンピュータシステム100の外部に設けられることも可能である。例えば、プロセッサ120、メモリ130のそれぞれが別々のハードウェア部品で構成されている場合には、各ハードウェア部品が任意のネットワークを介して接続されてもよい。このとき、ネットワークの種類は問わない。各ハードウェア部品は、例えば、LANを介して接続されてもよいし、無線接続されてもよいし、有線接続されてもよい。コンピュータシステム100は、特定のハードウェア構成には限定されない。例えば、プロセッサ120をデジタル回路ではなくアナログ回路によって構成することも本発明の範囲内である。コンピュータシステム100の構成は、その機能を実現できる限りにおいて上述したものに限定されない。
図2に示される例では、プロセッサ120の各構成要素が同一のプロセッサ120内に設けられているが、本発明はこれに限定されない。プロセッサ120の各構成要素が、複数のプロセッサ部に分散される構成も本発明の範囲内である。
3.対象化合物の特性を予測するためのコンピュータシステムにおける処理
図7は、対象化合物の特性を予測するためのコンピュータシステム100における処理の一例を示す。図7に示される例では、対象化合物の特性を予測するための処理700を説明する。
図7は、対象化合物の特性を予測するためのコンピュータシステム100における処理の一例を示す。図7に示される例では、対象化合物の特性を予測するための処理700を説明する。
ステップS701では、コンピュータシステム100が受信手段110を介して、第1の既知化合物に対する神経細胞の第1の活動データを受信する。第1の活動データは、例えば、第1の既知化合物を異なる細胞種に投与した場合の複数のデータ、第1の既知化合物を異なるベンダーから供給された同一の細胞種サンプルに投与した場合の複数のデータ、第1の既知化合物を同一のベンダーから供給された異なるロットのサンプルに投与した場合の複数のデータ、第1の既知化合物を同一のベンダーから異なる日に供給されたサンプルに投与した場合の複数のデータ、第1の既知化合物を異なる施設で試験した場合の複数のデータを含み得る。受信された活動データは、プロセッサ120に渡される。
ステップS702では、コンピュータシステム100が受信手段110を介して、第2の既知化合物に対する神経細胞の第2の活動データを受信する。第2の活動データは、例えば、第2の既知化合物を異なる細胞種に投与した場合の複数のデータ、第2の既知化合物を異なるベンダーから供給された同一の細胞種サンプルに投与した場合の複数のデータ、第2の既知化合物を同一のベンダーから供給された異なるロットのサンプルに投与した場合の複数のデータ、第2の既知化合物を同一のベンダーから異なる日に供給されたサンプルに投与した場合の複数のデータ、第2の既知化合物を異なる施設で試験した場合の複数のデータを含み得る。受信された活動データは、プロセッサ120に渡される。
ステップS703では、プロセッサ120が、候補パラメータセット中の各候補パラメータの全ての組み合わせに対して、第1の活動データおよび第2の活動データの多変量解析を行い、予測パラメータセットを特定する。例えば、プロセッサ120の多変量解析手段121が、候補パラメータセット中の各候補パラメータの全ての組み合わせに対して、第1の活動データおよび第2の活動データの多変量解析を行い、プロセッサ120の予測パラメータ特定手段122が、多変量解析の結果に基づいて予測パラメータセットを特定する。
予測パラメータセットが特定され、コンピュータシステム100が受信手段110を介して、対象化合物に対する神経細胞の標的活動データを受信すると、ステップS704では、プロセッサ120が、対象化合物に対する神経細胞の標的活動データから、ステップS703で特定された予測パラメータセットに基づいて特性を予測する。例えば、プロセッサ120の予測手段123が特性を予測する。このようにして、対象化合物の特性を予測することができる。
例えば、上述したステップS701では、複数の第1の活動データが受信された場合、複数の第1の活動データのそれぞれについて、第1の既知化合物の既知の特性を分離可能なパラメータを用いて多変量解析を行い、第1の既知化合物の既知の特性と同様の特性を有する第1の活動データのみを後続処理のためにプロセッサ120に渡すようにしてもよい。これは、例えば、第1の活動データが、第1の既知化合物の既知の特性と同様の特性を有するか否かを判断することと、同様の特性を有しない場合に、外れ値として、プロセッサ120に渡されるデータから除外することとによって行われる。外れ値を検出して、外れ値を含むデータをプロセッサ120に渡されるデータから除外することにより、プロセッサ120による予測の精度がさらに向上する。上述したステップS702でも同様に、第2の活動データの外れ値を検出して、外れ値を含むデータをプロセッサ120に渡されるデータから除外することができる。上述したステップS704でも同様に、対象化合物に対する神経細胞の標的活動データの外れ値を検出して、外れ値を含むデータをプロセッサ120に渡されるデータから除外することができる。
上述した、多変量解析によって外れ値を検出する工程は、他の用途においても利用され得る。例えば、細胞製造におけるロット差チェック、品質チェック、異なる細胞種から細胞を選択する際などに有効である。例えば、細胞製造において、複数のロットのそれぞれの細胞に対して、所与の特性を分離可能なパラメータを用いて多変量解析を行い、所与の特性と同様の特性を有するか否かを判断することによって外れ値を検出することができる。これにより、ロット間差の大きなロットを除外することが可能になる。例えば、細胞製造において、複数の細胞のそれぞれに対して、所望の品質を分離可能なパラメータを用いて多変量解析を行い、所望の品質と同様の品質を有するか否かを判断することによって外れ値を検出することができる。これにより、所望の品質を有しない細胞を除外することが可能になる。例えば、異なる細胞種から細胞を選択する際に、複数の細胞種のそれぞれの細胞に対して、所望の特性を分離可能なパラメータを用いて多変量解析を行い、所望の特性と同様の特性を有するか否かを判断することによって外れ値を検出することができる。これにより、所望の特性を有しない細胞種を除外することが可能になる。
図8は、ステップS704でプロセッサ120が対象化合物の特性を予測する処理の一例を示す。
ステップS801では、プロセッサ120の予測手段123が、ステップS703で特定された予測パラメータセットについて対象化合物の標的活動データの多変量解析を行う。これにより、標的活動データが、第1の活動データおよび第2の活動データに対して既に行われた予測パラメータセットについての多変量解析の結果と比較できるようになる。多変量解析は、例えば、主成分解析である。例えば、予測手段123は、主成分解析により、標的活動データの主成分得点を算出する。多変量解析は、例えば、クラスター分析である。例えば、予測手段123は、クラスター分析により、標的活動データをクラスターに分類する。
ステップS801で行われる多変量解析は、ステップS703で行われた多変量解析と同じ手法であってもよいし、異なる手法であってもよい。例えば、ステップS703で主成分解析を行うことにより、予測パラメータセットを特定した場合、ステップS801では、同じく主成分解析を行ってもよいし、異なる多変量解析(例えば、クラスター分析)を行ってもよい。例えば、ステップS703でクラスター分析を行うことにより、予測パラメータセットを特定した場合、ステップS801では、同じくクラスター分析を行ってもよいし、異なる多変量解析(例えば、主成分解析)を行ってもよい。
例えば、プロセッサ120の予測手段123は、ステップS801において、予測パラメータセットについて、SVMを利用して、第1の活動データと第2の活動データとを分割する超平面を導出し、対象化合物の標的活動データが、超平面の第1の活動データ側に属するか、または超平面の第2の活動データ側に属するかを判定するようにしてもよい。
ステップS802では、プロセッサ120の予測手段123が、標的活動データが第2の活動データよりも第1の活動データと類似するか否かを決定する。
予測手段123は、例えば、ステップS801で算出された主成分得点に基づいて、類似するか否かを決定することができる。例えば、主成分得点に基づいて作成された主成分プロットに基づいて標的活動データと第1の活動データとの類似度および標的活動データと第2の活動データとの類似度を算出することができる。
例えば、予測パラメータセットについて、第1の活動データの第1主成分得点および第2主成分得点をプロットし、第2の活動データの第1主成分得点および第2主成分得点をプロットし、標的活動データの第1主成分得点および第2主成分得点をプロットした後、標的活動データのプロットと第1の活動データのプロットとのユークリッド距離と、標的活動データのプロットと第2の活動データのプロットとのユークリッド距離とを比較することにより、標的活動データが第2の活動データよりも第1の活動データと類似するか否かを決定することができる。例えば、標的活動データのプロットと第1の活動データのプロットとのコサイン類似度と、標的活動データのプロットと第2の活動データのプロットとのコサイン類似度とを比較することにより、標的活動データが第2の活動データよりも第1の活動データと類似するか否かを決定することができる。例えば、標的活動データのプロットと第1の活動データのプロットとのユークリッド距離およびコサイン類似度と、標的活動データのプロットと第2の活動データのプロットとのユークリッド距離およびコサイン類似度とを比較することにより、標的活動データが第2の活動データよりも第1の活動データと類似するか否かを決定することができる。なお、複数の第1の活動データまたは複数の第2の活動データによって複数の点がプロットされる場合には、全プロットの平均値を算出し、その点を代表点として標的活動データとのユークリッド距離またはコサイン類似度を求めるようにしてもよい。
好ましくは、主成分プロットのユークリッド距離およびコサイン類似度の組み合わせによって類似度を決定する。例えば、図6Aに示されるように、対象化合物(標的活動データ)のプロットと第1の既知化合物(第1の活動データ)のプロットとの間のユークリッド距離d1と、対象化合物(標的活動データ)のプロットと第2の既知化合物(第2の活動データ)のプロットとの間のユークリッド距離d2とが等しい場合でも、コサイン類似度によって類似度を判別可能だからである。主成分プロットのユークリッド距離およびコサイン類似度の組み合わせを用いる場合、類似度Sは、

で表される。
で表される。
予測手段123は、例えば、ステップS801で標的活動データがどのクラスターに分類されたかに基づいて、標的活動データが第2の活動データよりも第1の活動データと類似するか否かを決定することができる。
予測手段123は、例えば、ステップS801で対象化合物の標的活動データが、SVMで導出された超平面の第1の活動データ側または第2の活動データ側のどちらに属すると判定されたかに基づいて、標的活動データが第2の活動データよりも第1の活動データと類似するか否かを決定することができる。標的活動データが、超平面の第1の活動データ側に属する場合には、標的活動データが第2の活動データよりも第1の活動データと類似すると決定され、超平面の第2の活動データ側に属する場合には、標的活動データが第1の活動データよりも第2の活動データと類似すると決定される。
ステップS802で標的活動データが第2の活動データよりも第1の活動データに類似すると決定された場合、ステップS803に進み、第1の既知化合物の特性を対象化合物の特性として特定する。例えば、第1の既知化合物が「毒性有り」との特性を有している場合には、対象化合物の特性が「毒性有り」と特定される。例えば、第1の既知化合物が「GABAに効く」という特性(作用機序)を有している場合には、対象化合物の作用機序が「GABAに効く」と特定される。
ステップS802で標的活動データが第2の活動データよりも第1の活動データに類似しない、すなわち、標的活動データが第1の活動データよりも第2の活動データに類似していると決定された場合、ステップS804に進み、第2の既知化合物の特性を対象化合物の特性として特定する。例えば、第2の既知化合物が「毒性無し」との特性を有している場合には、対象化合物の特性が「毒性無し」と特定される。例えば、第1の既知化合物が「Kチャンネルに効く」という特性(作用機序)を有している場合には、対象化合物の作用機序が「Kチャンネルに効く」と特定される。
上述した例では、第1の既知化合物に対する第1の活動データおよび第2の既知化合物に対する第2の活動データを用いて処理700を行ったが、これに加えて、第3の既知化合物に対する第3の活動データ、第4の既知化合物に対する第4の活動データ、・・・第nの化合物に対する第nの活動データ(ここで、nは3以上の整数)を用いて処理700を行うようにしてもよい。このとき、ステップS802では、標的活動データと、第1の活動データ、第2の活動データ、・・・第nの活動データそれぞれとの類似度を比較することになる。
例えば、第1の既知化合物に対する第1の活動データ、第2の既知化合物に対する第2の活動データ、・・・第11の既知化合物に対する第11の活動データを用いて処理700を行うことができる。この場合に、ステップS801で多変量解析としてクラスター分析を行ったときの結果の一例を図6Bに示す。
図6Bは、第1~第11の既知化合物と対象化合物Aおよび対象化合物Bとについてクラスター分析を行った場合の結果の一例を示す。縦軸がユークリッド距離を示している。図6Bでは、ユークリッド距離が近い化合物(例えば、ユークリッド距離が約150(図6Bにおいて二点鎖線で示される)以下の化合物)が同一のクラスターに分類されており、同一のクラスター内の化合物は同一の特性を有する。例えば、第1~第5の既知化合物は、それぞれ同じ特性1を有し、第6の既知化合物は、特性2を有し、第7の既知化合物は、特性3を有し、第8の既知化合物は、特性4を有し、第9の既知化合物および第10の既知化合物は、それぞれ同じ特性5を有し、第11の既知化合物は、特性6を有する。ここで、対象化合物Aは、第6の既知化合物と同じクラスターに分類されるため、特性2を有すると予測される。対象化合物Bは、第9の既知化合物および第10の既知化合物と同じクラスターに分類されるため、特性5を有すると予測される。
ステップS803またはステップS804で対象化合物の特性が特定された後、第2の予測パラメータセットを用いてステップS704を繰り返すようにしてもよい。このとき、第2の予測パラメータセットは、例えば、第3の既知化合物および第4の既知化合物を用いてステップS701~ステップS703の処理を行うことによって特定された予測パラメータセットであってもよい。あるいは、第2の予測パラメータセットは、ステップS803で第1の既知化合物の特性を対象化合物の特性として特定した場合には、第1の既知化合物および第3の既知化合物を用いてステップS701~ステップS703の処理を行うことによって特定された予測パラメータセットであってもよいし、ステップS804で第2の既知化合物の特性を対象化合物の特性として特定した場合には、第2の既知化合物および第3の既知化合物を用いてステップS701~ステップS703の処理を行うことによって特定された予測パラメータセットであってもよい。これにより、第2の予測パラメータセットがステップS803またはステップS804で特定された対象化合物の特性に対応するようになる。これは、特性を段階的に特定できるようになるという点で好ましくあり得る。
例えば、ステップS803またはステップS804で対象化合物の特性が「GABAに効く」と特定された場合、「GABA-Aに効く」という特性(作用機序)を有する第3の既知化合物と「GABA-Bに効く」という特性(作用機序)を有する第1の既知化合物または第4の既知化合物とを用いてステップS701~ステップS703の処理を行うことによって特定された第2の予測パラメータセットを用いてステップS704を繰り返すことができる。これにより、「GABAに効く」という対象化合物の特性が、「GABA-Aに効く」のか、「GABA-Bに効く」のかという具体的な特性まで特定できる。
図9は、対象化合物の特性を予測するためのコンピュータシステム100における処理の一例を示す。図7に示される例では、予測パラメータセットが予め決定されている場合の、対象化合物の特性を予測するための処理900を説明する。予め決定されている予測パラメータセットは、上述した候補パラメータのうちの少なくとも1つを含む。
ステップS901では、コンピュータシステム100が受信手段110を介して、第1の既知化合物に対する神経細胞の第1の活動データ、第2の既知化合物に対する神経細胞の第2の活動データ、対象化合物に対する神経細胞の標的活動データを受信する。第1の活動データは、例えば、第1の既知化合物を異なる細胞種に投与した場合の複数のデータ、第1の既知化合物を異なるベンダーから供給された同一の細胞種サンプルに投与した場合の複数のデータ、第1の既知化合物を同一のベンダーから供給された異なるロットのサンプルに投与した場合の複数のデータ、第1の既知化合物を同一のベンダーから異なる日に供給されたサンプルに投与した場合の複数のデータ、第1の既知化合物を異なる施設で試験した場合の複数のデータを含み得る。第2の活動データは、例えば、第2の既知化合物を異なる細胞種に投与した場合の複数のデータ、第2の既知化合物を異なるベンダーから供給された同一の細胞種サンプルに投与した場合の複数のデータ、第2の既知化合物を同一のベンダーから供給された異なるロットのサンプルに投与した場合の複数のデータ、第2の既知化合物を同一のベンダーから異なる日に供給されたサンプルに投与した場合の複数のデータ、第2の既知化合物を異なる施設で試験した場合の複数のデータを含み得る。受信された活動データは、プロセッサ120に渡される。
例えば、上述したステップS901では、複数の第1の活動データが受信された場合、複数の第1の活動データのそれぞれについて、第1の既知化合物の既知の特性を分離可能なパラメータを用いて多変量解析を行い、第1の既知化合物の既知の特性と同様の特性を有する第1の活動データのみを後続処理のためにプロセッサ120に渡すようにしてもよい。これは、例えば、第1の活動データが、第1の既知化合物の既知の特性と同様の特性を有するか否かを判断することと、同様の特性を有しない場合に、外れ値として、プロセッサ120に渡されるデータから除外することとによって行われる。外れ値を検出して、外れ値を含むデータをプロセッサ120に渡されるデータから除外することにより、プロセッサ120による予測の精度がさらに向上する。第2の活動データ、対象化合物に対する神経細胞の標的活動データについても同様に、外れ値を検出して、外れ値を含むデータをプロセッサ120に渡されるデータから除外することができる。
ステップS902では、プロセッサ120の予測手段123が、それぞれのデータに対して、予測パラメータセットについて多変量解析を行う。多変量解析は、例えば、主成分解析である。例えば、予測手段123は、主成分解析により、第1の活動データの主成分得点、第2の活動データの主成分得点、および、標的活動データの主成分得点を算出する。多変量解析は、例えば、クラスター分析である。例えば、予測手段123は、クラスター分析により、標的活動データをクラスターに分類する。
例えば、プロセッサ120の予測手段123は、ステップS902において、予測パラメータセットについて、SVMを利用して、第1の活動データと第2の活動データとを分割する超平面を導出し、対象化合物の標的活動データが、超平面の第1の活動データ側に属するか、または超平面の第2の活動データ側に属するかを判定するようにしてもよい。
ステップS903では、プロセッサ120の予測手段123が、標的活動データが第2の活動データよりも第1の活動データと類似するか否かを決定する。予測手段123は、例えば、ステップS902で算出された主成分得点に基づいて、類似するか否かを決定することができる。例えば、主成分得点に基づいて作成された主成分プロットに基づいて標的活動データと第1の活動データとの類似度および標的活動データと第2の活動データとの類似度を算出することができる。
例えば、予測パラメータセットについて、第1の活動データの第1主成分得点および第2主成分得点をプロットし、第2の活動データの第1主成分得点および第2主成分得点をプロットし、標的活動データの第1主成分得点および第2主成分得点をプロットした後、標的活動データのプロットと第1の活動データのプロットとのユークリッド距離と、標的活動データのプロットと第2の活動データのプロットとのユークリッド距離とを比較することにより、標的活動データが第2の活動データよりも第1の活動データと類似するか否かを決定することができる。例えば、標的活動データのプロットと第1の活動データのプロットとのコサイン類似度と、標的活動データのプロットと第2の活動データのプロットとのコサイン類似度とを比較することにより、標的活動データが第2の活動データよりも第1の活動データと類似するか否かを決定することができる。例えば、標的活動データのプロットと第1の活動データのプロットとのユークリッド距離およびコサイン類似度と、標的活動データのプロットと第2の活動データのプロットとのユークリッド距離およびコサイン類似度とを比較することにより、標的活動データが第2の活動データよりも第1の活動データと類似するか否かを決定することができる。なお、複数の第1の活動データまたは複数の第2の活動データによって複数の点がプロットされる場合には、全プロットの平均値を算出し、その点を代表点として標的活動データとのユークリッド距離またはコサイン類似度を求めるようにしてもよい。
予測手段123は、例えば、ステップS902で標的活動データがどのクラスターに分類されたかに基づいて、標的活動データが第2の活動データよりも第1の活動データと類似するか否かを決定することができる。
予測手段123は、例えば、ステップS902で対象化合物の標的活動データが、SVMで導出された超平面の第1の活動データ側または第2の活動データ側のどちらに属すると判定されたかに基づいて、標的活動データが第2の活動データよりも第1の活動データと類似するか否かを決定することができる。標的活動データが、超平面の第1の活動データ側に属する場合には、標的活動データが第2の活動データよりも第1の活動データと類似すると決定され、超平面の第2の活動データ側に属する場合には、標的活動データが第1の活動データよりも第2の活動データと類似すると決定される。
ステップS903で標的活動データが第2の活動データよりも第1の活動データに類似すると決定された場合、ステップS904に進み、第1の既知化合物の特性を対象化合物の特性として特定する。例えば、第1の既知化合物が「毒性有り」との特性を有している場合には、対象化合物の特性が「毒性有り」と特定される。例えば、第1の既知化合物が「GABAに効く」という特性(作用機序)を有している場合には、対象化合物の作用機序が「GABAに効く」と特定される。
ステップS903で標的活動データが第2の活動データよりも第1の活動データに類似しない、すなわち、標的活動データが第1の活動データよりも第2の活動データに類似していると決定された場合、ステップS905に進み、第2の既知化合物の特性を対象化合物の特性として特定する。例えば、第1の既知化合物が「毒性無し」との特性を有している場合には、対象化合物の特性が「毒性無し」と特定される。例えば、第2の既知化合物が「Kチャンネルに効く」という特性(作用機序)を有している場合には、対象化合物の作用機序が「Kチャンネルに効く」と特定される。
上述した例では、第1の既知化合物に対する第1の活動データおよび第2の既知化合物に対する第2の活動データを用いて処理900を行ったが、これに加えて、第3の既知化合物に対する第3の活動データ、第4の既知化合物に対する第4の活動データ、・・・第nの化合物に対する第nの活動データ(ここで、nは3以上の整数)を用いて処理700を行うようにしてもよい。このとき、ステップS903では、第1の活動データと、第2の活動データと、・・・第nの活動データとの類似度を比較することになる。
上述した例では、特定の順序で処理が行われることを説明したが、各処理の順序は説明されたものに限定されず、論理的に可能な任意の順序で行われることに留意されたい。
上述した例では、コンピュータシステム100を用いて対象化合物の特性を予測することを説明したが、予測することができる対象は、化合物の特性に限定されない。特性を分離可能な予測パラメータセットが存在する限り、任意の標的の特性を予測することができるコンピュータシステムも本発明の範囲内である。
例えば、本発明は、標的として、神経ネットワークを対象とすることができ、本発明のコンピュータシステムによって、未知の神経ネットワークの特性を予測することができる。神経ネットワークは、例えば、iPS細胞から作製され神経ネットワークであり得る。
例えば、候補パラメータセット(化合物の特性を予測する場合に用いた候補パラメータセットと同じ候補パラメータセットであり得る)中の各候補パラメータの全ての組み合わせに対して、既知の疾患ニューロンの電気活動データの多変量解析を行うことにより、異なる疾患ニューロンの電気活動データを分離可能な予測パラメータセットを特定し、特定された予測パラメータセットに基づいて、未知の神経ネットワークがどの疾患ニューロンに近い機能を有するかを予測することができる。これにより、例えば、健常人から作製された未知の神経ネットワークが、どの疾患ニューロンに類似する電気活動を示すかを特定し、その健常者の将来の疾患を予測することが可能となり得る。
例えば、候補パラメータセット(化合物の特性を予測する場合に用いた候補パラメータセットと同じ候補パラメータセットであり得る中の各候補パラメータの全ての組み合わせに対して、脳の各部位の既知の神経ネットワークの電気活動データの多変量解析を行うことにより、脳の各部位の神経ネットワークの電気活動データを分離可能な予測パラメータセットを特定し、特定された予測パラメータセットに基づいて、未知の神経ネットワークがどの脳の部位に近い挙動を有するかを予測することができる。
上述した例では、電気活動データに加えて、遺伝子発現のデータ、シナプス機能データ、代謝機能のデータ等のデータを用いることにより、予測の精度の向上させることができる。また、分離可能な特性を増加させることもできる。
例えば、本発明は、標的として、細胞を対象とすることができ、本発明のコンピュータシステムによって、未知の細胞の特性を予測することができる。
例えば、候補パラメータセット(各種細胞性状解析の定量データ(例えば、遺伝子発現、オートファジー、ミトコンドリア、老化細胞の定量データ)のためのパラメータを含む候補パラメータセットであり得る)中の各候補パラメータの全ての組み合わせに対して、疾患既知患者の細胞から得られた種々のデータ(例えば、遺伝子発現のデータ、オートファジーのデータ、ミトコンドリア解析のデータ、老化細胞解析のデータ等)の多変量解析を行うことにより、異なる疾患既知患者の細胞データを分離可能な予測パラメータセットを特定し、特定された予測パラメータセットに基づいて、疾患未知患者の細胞がどの疾患既知患者の細胞に近い特性を有するかを予測することができる。これにより、例えば、疾患未知患者の疾患の診断や病気の予測が可能となり得る。
このような任意の標的の特性を予測することができるコンピュータシステムは、コンピュータシステム100と同様の構成を有することができ、コンピュータシステム100と同様の処理によって、任意の標的の特性を予測することができる。例えば、上述した処理700と同様の処理によって、任意の標的の特性を予測することができる。
ステップS701では、コンピュータシステム100が受信手段110を介して、第1の対象に対する第1のデータを受信する。第1の対象は、例えば、第1の既知の疾患ニューロン、脳の第1の部位の神経ネットワーク、第1の疾患既知患者の細胞等であり得、第1のデータはそれぞれ、第1の既知の疾患ニューロンの電気活動データ、脳の第1の部位の神経ネットワークの電気活動データ、第1の疾患既知患者の細胞の種々のデータ(例えば、遺伝子発現のデータ、オートファジーのデータ、ミトコンドリア解析のデータ、老化細胞解析のデータ等)であり得る。受信されたデータは、プロセッサ120に渡される。
ステップS702では、コンピュータシステム100が受信手段110を介して、第2の対象に対する第2のデータを受信する。第2の対象は、例えば、第2の既知の疾患ニューロン、脳の第2の部位の神経ネットワーク、第2の疾患既知患者の細胞等であり得、第2のデータはそれぞれ、第2の既知の疾患ニューロンの電気活動データ、脳の第2の部位の神経ネットワークの電気活動データ、第2の疾患既知患者の細胞の種々のデータ(例えば、遺伝子発現のデータ、オートファジーのデータ、ミトコンドリア解析のデータ、老化細胞解析のデータ等)であり得る。受信されたデータは、受信された活動データは、プロセッサ120に渡される。
ステップS703では、プロセッサ120が、候補パラメータセット中の各候補パラメータの全ての組み合わせに対して、第1のデータおよび第2のデータの多変量解析を行い、予測パラメータセットを特定する。例えば、プロセッサ120の多変量解析手段121が、候補パラメータセット中の各候補パラメータの全ての組み合わせに対して、第1のデータおよび第2のデータの多変量解析を行い、プロセッサ120の予測パラメータ特定手段122が、多変量解析の結果に基づいて予測パラメータセットを特定する。
予測パラメータセットが特定され、コンピュータシステム100が受信手段110を介して、標的に対する標的データを受信すると、ステップS704では、プロセッサ120が、標的に対する標的データから、ステップS703で特定された予測パラメータセットに基づいて特性を予測する。例えば、プロセッサ120の予測手段123が特性を予測する。標的は、例えば、未知の神経ネットワーク、疾患未知患者の細胞等であり得、標的データはそれぞれ、未知の神経ネットワークの電気活動データ、疾患未知患者の細胞の種々のデータ(例えば、遺伝子発現のデータ、オートファジーのデータ、ミトコンドリア解析のデータ、老化細胞解析のデータ等)であり得る。このようにして、任意の標的の特性を予測することができる。
図7、図8、図9を参照して上述した例では、図7、図8、図9に示される各ステップの処理は、プロセッサ120およびメモリ130に格納されたプログラムによって実現することが説明されたが、本発明はこれに限定されない。図7、図8、図9に示される各ステップの処理のうちの少なくとも1つは、制御回路などのハードウェア構成によって実現されてもよい。
上述した例では、コンピュータシステム100を用いて対象の特性を予測することを説明したが、本発明はこれに限定されない。コンピュータシステム100を用いることなく、人が手計算で対象の特性を予測することも本発明の範囲である。この場合、例えば、処理700および処理900は、データを受信するステップ(ステップS701、ステップS702、ステップS901)の代わりに、対象からデータを得るステップを含み得る。得られたデータをもとに、後続ステップを手計算で行うことができる。
一実施例において、5つの既知化合物(4AP、Phenytoin、PTX(Picrotoxin)、Strychnine、Amoxiciline)のそれぞれを、神経細胞に投与した際の活動データをMEAを用いて取得した。ここで、神経細胞として、AxolBioscience社のHuman iPSC-derived neural stem cells(ax0019)を用い、MEAとして、アルファメッドサイエンティフィック社のMEA 24well Plate-comfortを用い、その計測装置として、アルファメッドサイエンティフィック社のMED64-Presto(MED-A384iN)を用いた。4APは、約30μMの濃度で投与され、Phenytoinは、約100μMの濃度で投与され、PTX(Picrotoxin)は、約3μMの濃度で投与され、Strychnineは、約30μMの濃度で投与され、Amoxicilineは、約100μMの濃度で投与された。取得されたデータを本発明のコンピュータシステムに投入し、候補パラメータセット中の各候補パラメータの全ての組み合わせに対して、それらのデータの主成分解析を行った。候補パラメータセットは、10個のパラメータ((1)TS、(2)NoB、(3)IBI、(4)バースト長、(5)バースト中スパイク数、(6)PS、(7)PSの変動係数、(8)IPI、(9)IPIの変動係数、(10)Periodicity)から成り、10個のパラメータのうちの3個以上を組み合わせて構成される968個のパラメータ組のそれぞれに対して主成分解析を行った。主成分解析および有意差検定の結果、5つの既知化合物の作用機序を分離することができる予測パラメータセットとして、IBI、バースト中スパイク数、PS、Periodicityから成るパラメータ組が特定された。
PTX(Picrotoxin)と同様の作用機序を有する化合物を対象化合物Aとして、対象化合物Aから得られた活動データについて特定されたパラメータ組を用いて主成分解析を行った。対象化合物Aおよび各既知化合物に対して10回試行した。
図10Aおよび図10Bは、本実施例における対象化合物Aの作用機序の予測結果を示す図である。
図10Aは、対象化合物Aおよび5つの既知化合物の主成分プロットを示すグラフである。図10Aにおいて、横軸が第1主成分を表し、縦軸が第2主成分を表す。
図10B(a)は、対象化合物Aの主成分プロットの平均値と、5つの既知化合物のそれぞれの主成分プロットの平均値とユークリッド距離を示すグラフであり、図10B(b)は、各ユークリッド距離を棒グラフで示している。一番左の棒グラフが、対象化合物Aの主成分プロットの平均値と、4APの主成分プロットの平均値とのユークリッド距離を示し、左から2番目の棒グラフが、対象化合物Aの主成分プロットの平均値と、Phenytoinの主成分プロットの平均値とのユークリッド距離を示し、左から3番目の棒グラフが、対象化合物Aの主成分プロットの平均値と、PTX(Picrotoxin)の主成分プロットの平均値とのユークリッド距離を示し、左から4番目の棒グラフが、対象化合物Aの主成分プロットの平均値と、Strychnineの主成分プロットの平均値とのユークリッド距離を示し、左から5番目の棒グラフが、対象化合物Aの主成分プロットの平均値と、Amoxicilineの主成分プロットの平均値とのユークリッド距離を示している。
図10Bから分かるように、対象化合物Aの主成分プロットの平均値とユークリッド距離が最も近い既知化合物は、PTX(Picrotoxin)であり、対象化合物Aの作用機序は、PTX(Picrotoxin)と同じであると予測される。このように、対象化合物Aの作用機序を正しく予測することができた。
本発明は、上述した実施形態に限定されるものではない。本発明は、特許請求の範囲によってのみその範囲が解釈されるべきであることが理解される。当業者は、本発明の具体的な好ましい実施形態の記載から、本発明の記載および技術常識に基づいて等価な範囲を実施することができることが理解される。
本発明は、対象化合物等の標的の未知の特性(例えば、神経系への毒性や薬効)を予測する方法等を提供するものとして有用である。
100 コンピュータシステム
110 受信手段
120 プロセッサ
130 メモリ
140 出力手段
200 データベース部
110 受信手段
120 プロセッサ
130 メモリ
140 出力手段
200 データベース部
Claims (30)
- 標的の特性の予測方法であって、
(1)第1の対象に対する第1のデータを得る工程と、
(2)第2の対象に対する第2のデータを得る工程と、
(3)候補パラメータセット中の各候補パラメータの全ての組み合わせについて、前記第1のデータおよび前記第2のデータの多変量解析を行い、予測パラメータセットを特定する工程と、
(4)前記標的に対する標的データから、前記予測パラメータセットに基づいて前記特性を予測する工程
を包含する、方法。 - 前記予測パラメータセットを特定する工程(3)が、前記多変量解析によって前記第1の対象と前記第2の対象とを分離可能な前記候補パラメータの組み合わせを、前記予測パラメータセットと特定することを含む、請求項1に記載の方法。
- 前記予測する工程(4)が、前記標的データと、前記第1のデータおよび前記第2のデータとを比較し、前記標的データに類似するデータを与えた対象の特性を、前記標的の特性と特定することを含む、請求項1または2に記載の方法。
- 前記標的データ、前記第1のデータおよび前記第2のデータの、前記予測パラメータセットについての多変量解析によって、前記標的データが、前記第1のデータまたは前記第2のデータのいずれと類似するかを決定することを含む、請求項3に記載の方法。
- 前記類似が、ユークリッド距離、コサイン類似度、またはその組み合わせによって決定される、請求項4に記載の方法。
- (5)前記工程(4)で予測された特性に対応する第2の予測パラメータセットに基づいて、前記標的に対する第2の標的データから、第2の特性を予測する工程
をさらに包含する、請求項1~5のいずれか1項に記載の方法。 - 前記多変量解析が主成分解析またはクラスター分析である、請求項1~6のいずれか1項に記載の方法。
- 前記標的が化合物である、請求項1~7のいずれか1項に記載の方法。
- 前記特性が、前記化合物の薬効、毒性、作用機序の1つまたは複数を含む、請求項8に記載の方法。
- 前記データが、神経細胞の活動データである、請求項9に記載の方法。
- 前記活動データが、微小電極アレイ、Ca2+イメージング法、膜電位イメージング法のうちの1つを用いて得られたものである、請求項10に記載の方法。
- 前記神経細胞は神経幹細胞である、請求項10または11に記載の方法。
- 前記神経幹細胞はiPS細胞である、請求項12に記載の方法。
- 前記候補パラメータセットが、基本活動パラメータを含む、請求項10~13のいずれか1項に記載の方法。
- 前記基本活動パラメータが、TS、NoB、バースト周波数、バーストパーセンテージ、およびバースト長の四分位範囲を含む、請求項14に記載の方法。
- 前記候補パラメータセットが、バースト構造パラメータの平均値を含む、請求項10~15のいずれか1項に記載の方法。
- 前記候補パラメータセットが、バースト構造パラメータの標準偏差または中央絶対偏差を含む、請求項10~15のいずれか1項に記載の方法。
- 前記バースト構造パラメータが、バースト長、バースト中スパイク数、IBI、IPI、PS、ピーク時間パーセンテージ、バースト内平均ISI、バースト内中央ISI、バースト内中央ISI/平均ISIを含む、請求項16または17に記載の方法。
- 前記候補パラメータセットが、周期性に関するパラメータをさらに含む、請求項10~18のいずれか1項に記載の方法。
- 前記周期性に関するパラメータが、周期性パラメータを含む、請求項19に記載の方法。
- 前記周期性に関するパラメータが、バースト長、バースト中スパイク数、IBI、IPI、PS、ピーク時間パーセンテージ、バースト内平均ISI、バースト内中央ISI、バースト内中央ISI/平均ISIのそれぞれの変動係数と、バースト内CV ISIの平均値、バースト内CV ISIの標準偏差、バースト内CV ISIの中央絶対偏差、およびバースト内CV ISIの変動係数とをさらに含む、請求項19または20に記載の方法。
- 前記候補パラメータセットが、周波数解析パラメータを含む、請求項10~21のいずれか1項に記載の方法。
- 前記周波数解析パラメータが、約250Hz以下の周波数解析パラメータを含む、請求項22に記載の方法。
- 前記候補パラメータセットが、非線形時系列解析パラメータを含む、請求項10~23のいずれか1項に記載の方法。
- 標的の特性の予測方法であって、
第1の対象、第2の対象および前記標的それぞれに対する、データを得る工程、
それぞれのデータに対して、予測パラメータセットについて多変量解析を行う工程と、
前記標的のデータが前記第1の対象のデータまたは前記第2の対象のデータいずれに類似しているかを決定する工程と、
前記標的のデータが前記第2の対象のデータよりも前記第1の対象のデータに類似していると決定された場合に、前記第1の対象の特性を前記標的の前記特性であると特定する工程と
を包含する、方法。 - 前記予測パラメータセットが、周期性パラメータ、約250Hz以下の周波数解析パラメータ、または非線形時系列解析パラメータの1または複数を含む、請求項25に記載の方法。
- 標的の特性を予測するためのコンピュータシステムであって、
第1の対象に対する第1のデータおよび第2の対象に対する第2のデータを受信する手段と、
候補パラメータセット中の各候補パラメータの全ての組み合わせについて、前記第1のデータおよび前記第2のデータの多変量解析を行う手段と、
前記多変量解析の結果に基づいて予測パラメータセットを特定する手段と、
前記標的に対する標的データから、前記予測パラメータセットに基づいて前記特性を予測する手段と
を備えているコンピュータシステム。 - 標的の特性を予測するためのプログラムであって、前記プログラムは、プロセッサを備えるコンピュータシステムにおいて実行され、前記プログラムは、
(1)第1の対象に対する第1のデータを受信する工程と、
(2)第2の対象に対する第2のデータを受信する工程と、
(3)候補パラメータセット中の各候補パラメータの全ての組み合わせに対して、前記第1のデータおよび前記第2のデータの多変量解析を行い、予測パラメータセットを特定する工程と、
(4)前記標的に対する標的データから、前記予測パラメータセットに基づいて前記特性を予測する工程と
を包含する処理を前記プロセッサに実行させる、方法。 - 標的の特性を予測するためのコンピュータシステムであって、
第1の対象、第2の対象および前記標的それぞれに対する、データを受信する手段と、
それぞれのデータに対して、予測パラメータセットについて多変量解析を行う手段と、
前記標的のデータが前記第1の対象のデータまたは前記第2の対象のデータいずれに類似しているかを決定する手段と、
前記標的のデータが前記第2の対象のデータよりも前記第1の対象のデータに類似していると決定された場合に、前記第1の対象の特性を前記標的の前記特性であると特定する手段と
を備えている、コンピュータシステム。 - 標的の特性を予測するためのプログラムであって、前記プログラムは、プロセッサを備えるコンピュータシステムにおいて実行され、前記プログラムは、
第1の対象、第2の対象および前記標的それぞれに対する、データを受信する工程と、
それぞれのデータに対して、予測パラメータセットについて多変量解析を行う工程と、
前記標的のデータが前記第1の対象のデータまたは前記第2の対象のデータいずれに類似しているかを決定する工程と、
前記標的のデータが前記第2の対象のデータよりも前記第1の対象のデータに類似していると決定された場合に、前記第1の対象の特性を前記標的の前記特性であると特定する工程と
を包含する処理を前記プロセッサに実行させる、プログラム。
Priority Applications (3)
| Application Number | Priority Date | Filing Date | Title |
|---|---|---|---|
| EP19864717.4A EP3859329A4 (en) | 2018-09-28 | 2019-09-27 | Method, computer system, and program for predicting characteristic of target |
| US17/269,707 US20210199639A1 (en) | 2018-09-28 | 2019-09-27 | Method, computer system, and program for predicting characteristic of target |
| US19/177,515 US20250258156A1 (en) | 2018-09-28 | 2025-04-12 | Method, computer system, and program for predicting characteristic of target |
Applications Claiming Priority (2)
| Application Number | Priority Date | Filing Date | Title |
|---|---|---|---|
| JP2018183381A JP6558786B1 (ja) | 2018-09-28 | 2018-09-28 | 標的の特性の予測を行うための方法、コンピュータシステム、プログラム |
| JP2018-183381 | 2018-09-28 |
Related Child Applications (2)
| Application Number | Title | Priority Date | Filing Date |
|---|---|---|---|
| US17/269,707 A-371-Of-International US20210199639A1 (en) | 2018-09-28 | 2019-09-27 | Method, computer system, and program for predicting characteristic of target |
| US19/177,515 Division US20250258156A1 (en) | 2018-09-28 | 2025-04-12 | Method, computer system, and program for predicting characteristic of target |
Publications (1)
| Publication Number | Publication Date |
|---|---|
| WO2020067464A1 true WO2020067464A1 (ja) | 2020-04-02 |
Family
ID=67614840
Family Applications (1)
| Application Number | Title | Priority Date | Filing Date |
|---|---|---|---|
| PCT/JP2019/038242 Ceased WO2020067464A1 (ja) | 2018-09-28 | 2019-09-27 | 標的の特性の予測を行うための方法、コンピュータシステム、プログラム |
Country Status (4)
| Country | Link |
|---|---|
| US (2) | US20210199639A1 (ja) |
| EP (1) | EP3859329A4 (ja) |
| JP (1) | JP6558786B1 (ja) |
| WO (1) | WO2020067464A1 (ja) |
Cited By (2)
| Publication number | Priority date | Publication date | Assignee | Title |
|---|---|---|---|---|
| WO2026004594A1 (ja) * | 2024-06-26 | 2026-01-02 | 富士フイルム株式会社 | 創薬支援装置、創薬支援装置の作動方法、創薬支援装置の作動プログラム、並びに評価方法 |
| WO2026004593A1 (ja) * | 2024-06-26 | 2026-01-02 | 富士フイルム株式会社 | 創薬支援装置、創薬支援装置の作動方法、創薬支援装置の作動プログラム、並びに評価方法 |
Families Citing this family (7)
| Publication number | Priority date | Publication date | Assignee | Title |
|---|---|---|---|---|
| CN112667692A (zh) * | 2019-10-16 | 2021-04-16 | 北京一起教育信息咨询有限责任公司 | 一种数据处理方法、装置及电子设备 |
| US20210342645A1 (en) * | 2020-05-04 | 2021-11-04 | International Business Machines Corporation | Combining ensemble techniques and re-dimensioning data to increase machine classification accuracy |
| JP7138995B2 (ja) * | 2020-08-13 | 2022-09-20 | 学校法人東北工業大学 | 脳から取得される波形データに対してバースト解析を行う方法、コンピュータシステム、プログラム、ならびに、バースト解析を用いて標的の状態を予測する方法、コンピュータシステム、プログラム |
| JP7099777B1 (ja) * | 2020-08-13 | 2022-07-12 | 学校法人東北工業大学 | ヒストグラム画像を作成する方法、コンピュータシステム、プログラム、ならびに、ヒストグラム画像を用いて対象の状態を予測する方法、コンピュータシステム、プログラム |
| US20220357313A1 (en) * | 2021-05-04 | 2022-11-10 | Q-State Biosciences, Inc. | Drug fingerprinting |
| WO2023181936A1 (ja) * | 2022-03-24 | 2023-09-28 | コニカミノルタ株式会社 | 予測装置、予測システムおよび予測プログラム |
| CN115236006B (zh) * | 2022-08-04 | 2023-05-23 | 浙江嘉园智能科技有限公司 | 一种电子河长光谱检测数据的处理方法及系统 |
Citations (6)
| Publication number | Priority date | Publication date | Assignee | Title |
|---|---|---|---|---|
| JP2005502937A (ja) * | 2001-05-15 | 2005-01-27 | サイコジェニックス・インコーポレーテッド | 行動情報工学を監視するシステムおよび方法 |
| US20080118576A1 (en) * | 2006-08-28 | 2008-05-22 | Dan Theodorescu | Prediction of an agent's or agents' activity across different cells and tissue types |
| JP2008518598A (ja) * | 2004-10-29 | 2008-06-05 | ノバルティス アクチエンゲゼルシャフト | 薬剤の毒性評価 |
| JP2013013384A (ja) * | 2011-07-06 | 2013-01-24 | Medichrome:Kk | 化学物質の生体に対する影響の評価方法 |
| JP2015507470A (ja) * | 2011-11-11 | 2015-03-12 | コールド スプリング ハーバー ラボラトリー,アン エデュケーションコーポレーション オブ ザ ステイト オブ ニュー ヨーク | 薬物スクリーニング法およびその使用 |
| WO2017091147A1 (en) * | 2015-11-20 | 2017-06-01 | Agency For Science, Technology And Research | High-throughput imaging-based methods for predicting cell-type-specific toxicity of xenobiotics with diverse chemical structures |
Family Cites Families (2)
| Publication number | Priority date | Publication date | Assignee | Title |
|---|---|---|---|---|
| US7991557B2 (en) * | 2004-06-19 | 2011-08-02 | Genenews Corporation | Computer system and methods for constructing biological classifiers and uses thereof |
| US20160244839A1 (en) * | 2013-10-08 | 2016-08-25 | University Of Maryland, Baltimore | Methods for distinguishing inflammatory bowel diseases using microbial community signatures |
-
2018
- 2018-09-28 JP JP2018183381A patent/JP6558786B1/ja active Active
-
2019
- 2019-09-27 WO PCT/JP2019/038242 patent/WO2020067464A1/ja not_active Ceased
- 2019-09-27 US US17/269,707 patent/US20210199639A1/en not_active Abandoned
- 2019-09-27 EP EP19864717.4A patent/EP3859329A4/en active Pending
-
2025
- 2025-04-12 US US19/177,515 patent/US20250258156A1/en active Pending
Patent Citations (6)
| Publication number | Priority date | Publication date | Assignee | Title |
|---|---|---|---|---|
| JP2005502937A (ja) * | 2001-05-15 | 2005-01-27 | サイコジェニックス・インコーポレーテッド | 行動情報工学を監視するシステムおよび方法 |
| JP2008518598A (ja) * | 2004-10-29 | 2008-06-05 | ノバルティス アクチエンゲゼルシャフト | 薬剤の毒性評価 |
| US20080118576A1 (en) * | 2006-08-28 | 2008-05-22 | Dan Theodorescu | Prediction of an agent's or agents' activity across different cells and tissue types |
| JP2013013384A (ja) * | 2011-07-06 | 2013-01-24 | Medichrome:Kk | 化学物質の生体に対する影響の評価方法 |
| JP2015507470A (ja) * | 2011-11-11 | 2015-03-12 | コールド スプリング ハーバー ラボラトリー,アン エデュケーションコーポレーション オブ ザ ステイト オブ ニュー ヨーク | 薬物スクリーニング法およびその使用 |
| WO2017091147A1 (en) * | 2015-11-20 | 2017-06-01 | Agency For Science, Technology And Research | High-throughput imaging-based methods for predicting cell-type-specific toxicity of xenobiotics with diverse chemical structures |
Non-Patent Citations (3)
| Title |
|---|
| A. ODAWARAH. KATOHN. MATSUDAI. SUZUKI: "Physiological maturation and drug responses of human induced pluripotent stem cell-derived cortical neuronal networks in long-term culture", SCIENTIFIC REPORTS, vol. 6, 2016, XP055675742, DOI: 10.1038/srep26181 |
| SASAKI TSUZUKI IYOKOI RSATO KIKEGAYA Y: "Synchronous spike patterns in differently mixed cultures of human iPSC-derived glutamatergic and GABAergic neurons", BIOCHEM BIOPHYS RES COMMUN, vol. 513, no. 2, 28 May 2019 (2019-05-28), pages 300 - 305, XP085666996, DOI: 10.1016/j.bbrc.2019.03.161 |
| See also references of EP3859329A4 |
Cited By (2)
| Publication number | Priority date | Publication date | Assignee | Title |
|---|---|---|---|---|
| WO2026004594A1 (ja) * | 2024-06-26 | 2026-01-02 | 富士フイルム株式会社 | 創薬支援装置、創薬支援装置の作動方法、創薬支援装置の作動プログラム、並びに評価方法 |
| WO2026004593A1 (ja) * | 2024-06-26 | 2026-01-02 | 富士フイルム株式会社 | 創薬支援装置、創薬支援装置の作動方法、創薬支援装置の作動プログラム、並びに評価方法 |
Also Published As
| Publication number | Publication date |
|---|---|
| JP6558786B1 (ja) | 2019-08-14 |
| US20250258156A1 (en) | 2025-08-14 |
| EP3859329A1 (en) | 2021-08-04 |
| EP3859329A4 (en) | 2022-07-13 |
| JP2020051968A (ja) | 2020-04-02 |
| US20210199639A1 (en) | 2021-07-01 |
Similar Documents
| Publication | Publication Date | Title |
|---|---|---|
| JP6558786B1 (ja) | 標的の特性の予測を行うための方法、コンピュータシステム、プログラム | |
| Zheng et al. | Multiplexing of theta and alpha rhythms in the amygdala-hippocampal circuit supports pattern separation of emotional information | |
| Zhang et al. | Patient-specific seizure prediction from scalp EEG using vision transformer | |
| Li et al. | Classification of 5-S epileptic EEG recordings using distribution entropy and sample entropy | |
| Ouyang et al. | Dynamic characteristics of absence EEG recordings with multiscale permutation entropy analysis | |
| Kang et al. | An efficient detection of epileptic seizure by differentiation and spectral analysis of electroencephalograms | |
| Direito et al. | Modeling epileptic brain states using EEG spectral analysis and topographic mapping | |
| CN107095669B (zh) | 一种癫痫患者脑电信号的处理方法及系统 | |
| Nodera et al. | Deep learning for waveform identification of resting needle electromyography signals | |
| Hamm et al. | Aberrant cortical ensembles and schizophrenia-like sensory phenotypes in Setd1a+/− mice | |
| Nagaraj et al. | The revised Cerebral Recovery Index improves predictions of neurological outcome after cardiac arrest | |
| Duque-Muñoz et al. | Identification and monitoring of brain activity based on stochastic relevance analysis of short–time EEG rhythms | |
| EP3772066A3 (en) | Biological status classification | |
| Iotchev et al. | The “Twin Peaks” method of automated Spike-Wave detection: A two-step, two-criteria Matlab application | |
| Behar et al. | An echo state neural network for foetal ECG extraction optimised by random search | |
| Marin-Llobet et al. | Neural models for detection and classification of brain states and transitions | |
| CN114711790B (zh) | 新生儿电惊厥类型确定方法、装置、设备和存储介质 | |
| RU2332160C1 (ru) | Способ исследования электроэнцефалограммы человека и животных | |
| CN115153562A (zh) | 一种基于脑电图的预测方法、装置、电子设备及存储介质 | |
| JP7138995B2 (ja) | 脳から取得される波形データに対してバースト解析を行う方法、コンピュータシステム、プログラム、ならびに、バースト解析を用いて標的の状態を予測する方法、コンピュータシステム、プログラム | |
| JP2020056781A (ja) | 標的の特性の予測を行うための方法、コンピュータシステム、プログラム | |
| Obukhov et al. | Metric classification of traumatic brain injury epileptiform activity from electroencephalography data | |
| Huang et al. | Machine learning identification of tinnitus-related features in auditory peripheral spontaneous activity in a guinea pig noise-induced tinnitus model | |
| McPartland | Feature importance in MEG-based brain age prediction using random forest regression | |
| JP2021026004A (ja) | 線虫を用いた個体レベルの健康寿命の評価系 |
Legal Events
| Date | Code | Title | Description |
|---|---|---|---|
| 121 | Ep: the epo has been informed by wipo that ep was designated in this application |
Ref document number: 19864717 Country of ref document: EP Kind code of ref document: A1 |
|
| NENP | Non-entry into the national phase |
Ref country code: DE |
|
| ENP | Entry into the national phase |
Ref document number: 2019864717 Country of ref document: EP Effective date: 20210428 |