WO2021029435A1 - 光学定数測定装置および光学定数の測定方法、光学定数の計算方法 - Google Patents
光学定数測定装置および光学定数の測定方法、光学定数の計算方法 Download PDFInfo
- Publication number
- WO2021029435A1 WO2021029435A1 PCT/JP2020/030878 JP2020030878W WO2021029435A1 WO 2021029435 A1 WO2021029435 A1 WO 2021029435A1 JP 2020030878 W JP2020030878 W JP 2020030878W WO 2021029435 A1 WO2021029435 A1 WO 2021029435A1
- Authority
- WO
- WIPO (PCT)
- Prior art keywords
- double slit
- state
- coherent light
- interference image
- optical constant
- Prior art date
- Legal status (The legal status is an assumption and is not a legal conclusion. Google has not performed a legal analysis and makes no representation as to the accuracy of the status listed.)
- Ceased
Links
Images



Classifications
-
- G—PHYSICS
- G01—MEASURING; TESTING
- G01N—INVESTIGATING OR ANALYSING MATERIALS BY DETERMINING THEIR CHEMICAL OR PHYSICAL PROPERTIES
- G01N21/00—Investigating or analysing materials by the use of optical means, i.e. using sub-millimetre waves, infrared, visible or ultraviolet light
- G01N21/17—Systems in which incident light is modified in accordance with the properties of the material investigated
- G01N21/41—Refractivity; Phase-affecting properties, e.g. optical path length
- G01N21/45—Refractivity; Phase-affecting properties, e.g. optical path length using interferometric methods; using Schlieren methods
-
- G—PHYSICS
- G01—MEASURING; TESTING
- G01J—MEASUREMENT OF INTENSITY, VELOCITY, SPECTRAL CONTENT, POLARISATION, PHASE OR PULSE CHARACTERISTICS OF INFRARED, VISIBLE OR ULTRAVIOLET LIGHT; COLORIMETRY; RADIATION PYROMETRY
- G01J3/00—Spectrometry; Spectrophotometry; Monochromators; Measuring colours
- G01J3/02—Details
- G01J3/0205—Optical elements not provided otherwise, e.g. optical manifolds, diffusers, windows
- G01J3/0229—Optical elements not provided otherwise, e.g. optical manifolds, diffusers, windows using masks, aperture plates, spatial light modulators or spatial filters, e.g. reflective filters
-
- G—PHYSICS
- G01—MEASURING; TESTING
- G01J—MEASUREMENT OF INTENSITY, VELOCITY, SPECTRAL CONTENT, POLARISATION, PHASE OR PULSE CHARACTERISTICS OF INFRARED, VISIBLE OR ULTRAVIOLET LIGHT; COLORIMETRY; RADIATION PYROMETRY
- G01J3/00—Spectrometry; Spectrophotometry; Monochromators; Measuring colours
- G01J3/02—Details
- G01J3/10—Arrangements of light sources specially adapted for spectrometry or colorimetry
-
- G—PHYSICS
- G01—MEASURING; TESTING
- G01J—MEASUREMENT OF INTENSITY, VELOCITY, SPECTRAL CONTENT, POLARISATION, PHASE OR PULSE CHARACTERISTICS OF INFRARED, VISIBLE OR ULTRAVIOLET LIGHT; COLORIMETRY; RADIATION PYROMETRY
- G01J3/00—Spectrometry; Spectrophotometry; Monochromators; Measuring colours
- G01J3/12—Generating the spectrum; Monochromators
- G01J3/18—Generating the spectrum; Monochromators using diffraction elements, e.g. grating
-
- G—PHYSICS
- G01—MEASURING; TESTING
- G01J—MEASUREMENT OF INTENSITY, VELOCITY, SPECTRAL CONTENT, POLARISATION, PHASE OR PULSE CHARACTERISTICS OF INFRARED, VISIBLE OR ULTRAVIOLET LIGHT; COLORIMETRY; RADIATION PYROMETRY
- G01J3/00—Spectrometry; Spectrophotometry; Monochromators; Measuring colours
- G01J3/28—Investigating the spectrum
- G01J3/2823—Imaging spectrometer
-
- G—PHYSICS
- G01—MEASURING; TESTING
- G01J—MEASUREMENT OF INTENSITY, VELOCITY, SPECTRAL CONTENT, POLARISATION, PHASE OR PULSE CHARACTERISTICS OF INFRARED, VISIBLE OR ULTRAVIOLET LIGHT; COLORIMETRY; RADIATION PYROMETRY
- G01J3/00—Spectrometry; Spectrophotometry; Monochromators; Measuring colours
- G01J3/28—Investigating the spectrum
- G01J3/45—Interferometric spectrometry
-
- G—PHYSICS
- G01—MEASURING; TESTING
- G01J—MEASUREMENT OF INTENSITY, VELOCITY, SPECTRAL CONTENT, POLARISATION, PHASE OR PULSE CHARACTERISTICS OF INFRARED, VISIBLE OR ULTRAVIOLET LIGHT; COLORIMETRY; RADIATION PYROMETRY
- G01J3/00—Spectrometry; Spectrophotometry; Monochromators; Measuring colours
- G01J3/02—Details
- G01J3/0264—Electrical interface; User interface
Definitions
- the present invention relates to a technique for measuring optical constants such as a complex refractive index.
- Non-Patent Documents 2 and 3 the optical constants in the EUV region are not sufficiently known and it is indispensable to create a database thereof. ..
- a measurement method using double slit interference has been proposed as a new measurement method.
- the complex refractive index can be directly derived by obtaining the relative intensity of the two optical paths and the phase difference caused by the optical path difference from the double slit interference image obtained by coherent light.
- Non-Patent Document 8 When incoherent synchrotron radiation is used as the light source, the photon flux density after coherence is taken out is significantly reduced. An optical system is required to make the best use of the reduced photon flux density, but since the optical system requires a different arrangement for each wavelength, systematic uncertainty due to mechanical drive is likely to occur during dispersion measurement.
- this light source has high coherence and a wide band, it can be said to be an ideal light source for measuring the refractive index and its dispersion.
- This disclosure was made in such a situation, and one of its exemplary purposes is to improve the measurement accuracy of optical constants.
- the optical constant measuring device includes a coherent light source, a spectroscope, a first double slit, a second double slit, and an arithmetic processing unit.
- the coherent light source outputs coherent light including high-order harmonics obtained by irradiating a non-linear medium with short pulse laser light.
- the spectroscope includes a diffraction grating that diffracts coherent light and an image sensor that captures the light diffracted by the diffraction grating.
- the first double slit has a pair of openings separated in the first direction and is located in a predetermined position between the coherent light source and the incident slit of the spectroscope in the first state.
- the second double slit has an opening pair that is a replica of the first double slit, and in the second state, the sample is held in one opening of the opening pair and replaced with the first double slit at a predetermined position. Is placed.
- the arithmetic processing device is based on the first interference image formed by the harmonics of the coherent light on the image sensor in the first state and the second interference image formed by the harmonics on the image sensor in the second state. Calculate the optical constants of the sample.
- the accuracy of the harmonic-based interferometer can be improved as compared with the conventional case, and the accuracy equal to or higher than that of the synchrotron radiation-based interferometer can be realized.
- the optical constant measuring apparatus uses a coherent light source that outputs coherent light including high-order harmonics obtained by irradiating a nonlinear medium with short pulse laser light, and a diffraction grating and a diffraction grating that diffract the coherent light.
- a second device that has a spectroscope containing an image sensor that captures the diffracted light and an aperture pair that is spaced apart in the first direction and is located in a predetermined position between the coherent light source and the grating slit of the grating in the first state.
- the second double slit to be arranged, the first interference image formed by the harmonics of the coherent light on the image sensor in the first state, and the second interference image formed by the harmonics on the image sensor in the second state. It is provided with an arithmetic processing device for calculating the optical constant of the sample based on the above.
- the optical constant of the sample is quantitatively determined. Can be obtained.
- the "optical constant" is typically a refractive index, more specifically a complex refractive index, but is not limited to this, and the thickness of a material whose refractive index is known or the transmission of a non-transparent material. It shall also include the rate.
- the optical constant measuring device may be modeled using parameters.
- the double slit interference image can be modeled based on the model of the optical constant measuring device, and by optimizing the parameters of the model so as to match the measured interference image, the optical constant of the sample and The parameters including the error of the optical constant measuring device can be quantitatively acquired.
- the arithmetic processing device calculates the intensity distribution formed on the image sensor in the first state and the second state based on the model of the optical constant measuring device by the one-dimensional Fresnel diffraction formula, and the calculated intensity distribution is calculated.
- the parameters of the model and the optical constants of the sample may be obtained so as to approach the first interference image and the second interference image.
- the optical constant can be quantitatively evaluated as a parameter of the model function. It is also possible to quantify the statistical uncertainties of observed values by actual measurement and optimize the design of the double slit so that the uncertainties of optical constants are the smallest.
- the openings of the first double slit and the second double slit may be modeled using an error function. This makes it possible to remove high-frequency components above the Nyquist frequency as compared to the case where the aperture is modeled by a step function.
- the first interference image and the second interference image are obtained as the integration of multiple irradiations of coherent light, and the function of the wave surface of the incident wave to the first double slit and the second double slit has its center position. , May be treated as having a normal distribution and variation.
- the first double slit and the second double slit are continuously formed in the second direction perpendicular to the first direction, and the optical constant measuring device sets the first double slit and the second double slit. Further, a stage for shifting in two directions may be provided.
- the coherent light source includes an optical parametric amplifier, and the wavelength of the short pulse laser light may be variable. According to this configuration, it is possible to obtain an interference image at an arbitrary wavelength in the EUV region by optimizing the wavelength of the fundamental wave and combining the order of the higher harmonics.
- the coherent light source includes a main light source that generates short pulse laser light, a gas nozzle that injects gas that is a non-linear medium, a condensing optical system that condenses the short pulse laser light into gas, and condensing optics. It may include a stabilizer that monitors the position of the short pulse laser light at two points, the parallel light of the short pulse laser light in the system and the focusing point, and controls the mechanical state of the optical element of the focusing optical system. .. As a result, the beam pointing can be stabilized and the uncertainty of the measurement system can be reduced.
- One embodiment of the present disclosure is a method for measuring the refractive index.
- a short pulse laser beam is applied to a non-linear medium to generate coherent light including higher harmonics, and the coherent light is passed through a first double slit having an aperture pair separated in a first direction.
- the step of measuring the first interference image, and the coherent light is passed through a second double slit having an aperture pair that is a replica of the first double slit and holding a sample in one of the openings of the aperture pair. 2. It includes a step of measuring the interference image and a step of calculating the optical constant of the sample based on the first interference image and the second interference image.
- One embodiment of the present disclosure is a method of calculating optical constants.
- This method is a method of calculating the optical constant of a sample based on the first interference image and the second interference image obtained by the measurement system, and the measurement system is obtained by irradiating a nonlinear medium with short pulse laser light.
- a coherent light source that outputs coherent light including higher-order harmonics, a diffraction grating that diffracts the coherent light, and a spectroscope that includes an image sensor that captures the light diffracted by the diffraction grating, and an aperture pair that is separated in the first direction.
- the first state it has a first double slit located at a predetermined position between the coherent light source and the grating slit of the grating, and an opening pair that is a replica of the first double slit.
- a second double slit which is arranged in place of the first double slit at a predetermined position while holding the sample in one of the openings of the opening pair, is provided.
- the harmonics of the coherent light are formed in the image sensor in the first state
- the harmonics are formed in the image sensor in the second state.
- the calculation method calculates the first diffraction pattern formed by the step of defining the model of the measurement system in the first state and the second state and the model of the measurement system in the first state based on the one-dimensional Fresnel diffraction formula.
- the step, the step of calculating the second diffraction pattern formed by the model of the measurement system in the second state based on the one-dimensional Fresnel diffraction formula, and the step that the first diffraction pattern approaches the first interference image and the second diffraction pattern It comprises a step of calculating the model parameters of the measurement system and the optical constants of the sample so as to approach the second interference image.
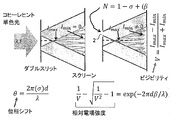
- FIG. 1 is a diagram for explaining the principle of measuring the refractive index by the double slit.
- the optical path difference and the intensity ratio of the electric field passing through the two slits can be estimated (Non-Patent Document 8).
- the sample Sample 2
- the optical path difference and intensity ratio of the electric field are determined by the refractive index and thickness of the sample. Therefore, the complex refractive index of the sample can be directly obtained from the following equation (1) from the two estimated parameters, that is, the phase ⁇ and the electric field intensity ratio L.
- d is the film thickness of sample 2
- ⁇ is the wavelength
- the refractive index N 1- ⁇ + i ⁇ .
- the method of estimating the phase ⁇ and the electric field intensity ratio L and calculating the complex refractive index cannot be said to be sufficient in terms of accuracy, and there is room for improvement. Therefore, in the present embodiment, the complex refractive index is calculated based on another analysis method as described later.
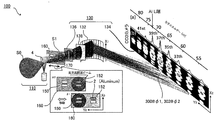
- FIG. 2 is a diagram showing an optical constant measuring device 100 according to an embodiment.
- the measurement by the optical constant measuring device 100 is performed in two states, the first state ⁇ 1 and the second state ⁇ 2.
- the optical constant measuring device 100 mainly includes a coherent light source 110, a spectroscope 130, a first double slit 150, a second double slit 152, and an arithmetic processing device 200.
- the light source is a laser-based high-order harmonic to be a light source with high spatial coherence.
- the coherent light source 110 irradiates the non-linear medium with the short pulse laser light S0, and outputs the coherent light S1 including the high-order harmonics obtained as a result.
- the non-linear medium 4 it is sufficient to select an element that can obtain high-order harmonics with high brightness at the wavelength for which the complex refractive index is to be measured.
- it can be selected from rare gases (He, Ne, Ar, Kr, Xe). it can.
- FIG. 3 is a diagram showing a spectrum of high-order harmonic generation (HHG: High-order Harmonic Generation). Higher harmonics have a peak at an odd multiple of the energy of the fundamental wave, and the intensity is constant over a wide band regardless of the order (called the plateau region).
- the interference light was diffracted by a diffraction grating and imaged on an image sensor (for example, a two-dimensional CCD camera) to disperse the interference image.
- the wavelength of the fundamental wave variable the refractive index can be measured at any wavelength in the EUV region.
- the spectroscope 130 includes a diffraction grating 132, an image sensor 134, an incident slit 136, a filter 138, and the like.
- the diffraction grating 132 diffracts the coherent light S1.
- the image sensor 134 captures the light diffracted by the diffraction grating 132.
- the filter 138 removes the fundamental wave component from the light that has passed through the incident slit 136 and allows the harmonic component to pass through.
- a thin film of aluminum (aluminum filter) can be used as the filter 138.
- the first double slit 150 has a pair of slits (opening pairs) separated in the first direction (vertical direction Y in the figure).
- the first double slit 150 is arranged at a predetermined position between the coherent light source 110 and the incident slit 136 of the spectroscope 130 in the first state ⁇ 1.
- the first double slit 150 acts on the harmonics of the coherent light S1 to form the first interference image 300 on the image sensor 134. Interference images are formed for each order of harmonics.
- the second double slit 152 has an opening pair. This opening pair is a replica having the same shape and dimensions as the opening pair of the first double slit 150.
- the second double slit 152 is arranged at a predetermined position by replacing the first double slit 150 with the sample 2 held in one opening of the opening pair in the second state ⁇ 2.
- the second double slit 152 holding the sample 2 acts on the harmonics of the coherent light S1 to form the second interference image 302 on the image sensor 134.
- the first double slit 150 and the second double slit 152 are continuously and integrally formed in the second direction X perpendicular to the first direction Y.
- This is referred to as a sample holder 160.
- the sample holder 160 can be positioned in the second direction X by the movable stage 170.
- the arithmetic processing unit 200 calculates the complex refractive index of sample 2 based on the first interference image 300 measured in the first state and the second interference image 302 measured in the second state.
- the optical constant measuring device 100 is modeled using parameters.
- Parameters may include variables (unknown values) and constants (known values). Parameters with a large error factor may be treated as variables, and parameters with negligible errors may be treated as constants.
- the arithmetic processing device 200 calculates the intensity distribution of the interference image formed on the image sensor 134 in the first state and the second state by the one-dimensional Fresnel diffraction formula based on the model of the optical constant measuring device 100.
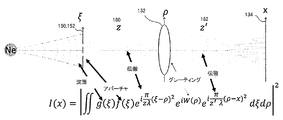
- FIG. 4 is a diagram illustrating the formation of an interference image based on the one-dimensional Fresnel diffraction model.
- I (x) is the intensity distribution of the sensor surface of the image sensor 134, which is a screen.
- the optical constant measuring device 100 has (i) a wave surface of coherent light incident on the double slit, (ii) double slits 150 and 152, and (iii) free space 180 between the double slits 150 and 152 and the diffraction grating 132.
- (Iv) diffraction grating 132, (v) free space 182 between the diffraction grating 132 and the image sensor 134 are modeled as elements.
- the function g ( ⁇ ) is a model representing the wave surface.
- the function f ( ⁇ ) is a model representing the opening of the double slit.
- the function W ( ⁇ ) is a model representing the diffraction grating 132. Free spaces 180 and 182 can be treated as general free space propagation.
- ⁇ is an independent variable representing the vertical position in the double slit.
- ⁇ is an independent variable representing the vertical position on the diffraction grating.
- x is an independent variable representing the vertical position of the image sensor on the sensor surface.
- the complex refractive index of sample 2 can be expressed in the form of being included in the double slit model f ( ⁇ ). Specifically, the model f ( ⁇ ) of the first state ⁇ 1 does not depend on the sample 2, and the model f ( ⁇ ) of the second state ⁇ 2 includes the complex refractive index of the sample 2.
- the arithmetic processing device 200 has an interference calculated so that the intensity distribution of the interference image calculated based on the model of the first state ⁇ 1 approaches the first interference image 300 and is calculated based on the model of the second state ⁇ 2.
- the model parameters and the complex index of refraction of sample 2 are acquired so that the intensity distribution of the image approaches the second interference image 302.
- the above is the configuration of the optical constant measuring device 100.
- FIG. 5 is a diagram showing an optical constant measuring device 100 used in the experiment.
- the coherent light source 110 was composed of a main light source 112 and an optical parametric amplifier 114.
- the main light source 112 a Legend Elite Duo (5 kHz, 2.2 mJ) manufactured by Coherent, which regenerated and amplified a mode lock titanium sapphire laser, was used.
- the optical parametric amplifier 114 Topas prime and NirUVis manufactured by Light conversion were used, and the second harmonic of the signal light extracted from the optical parametric amplifier 114 was used as the short pulse laser light S0 which is the fundamental wave for generating high-order harmonics.
- the wavelength is 13 wavelengths of 640 to 670 nm.
- the pulse width was 25 fs as measured by FC spider. According to this configuration, it is possible to obtain an interference image at an arbitrary wavelength in the EUV region by optimizing the wavelength of the fundamental wave (short pulse laser light S0) and combining the order of the higher harmonics.
- Neon gas was used as the non-linear medium 4 for generating harmonics.
- a condensing optical system 116 is configured between the coherent light source 110 and the nonlinear medium 4.
- a fundamental wave having a diameter of 25 mm was focused by a focusing optical system 116 on Neon gas blown out from a gas nozzle 104 having a diameter of 200 ⁇ m in the vacuum chamber 102.
- the focused size of the fundamental wave is estimated to be about 8 ⁇ m.
- the higher harmonics generated from the Neon gas propagate coaxially with the fundamental wave and reach the double slits 150 and 152.
- a toroidal grating was used as the diffraction grating 132.
- the harmonics that have passed through the incident slit 136 of the spectroscope 130 reach the toroidal grating and are diffracted in the X-axis direction of the CCD camera of FIG.
- the interference image in the incident slit 136 of the spectroscope 130 is arranged so as to be imaged on the CCD camera while being separated by order by toroidal grating.
- the CCD camera used was Andor DO940PBN, and the toroidal grating was HORIBA JOBIN YVON 541 00200.
- McPHERSON's Model 629 was used for wavelength calibration.
- sample holder 160 including the double slits 150 and 152 can be moved by the movable stage 170, both empty double slits (first double slit 150) and a double with sample 2 attached to one side while generating harmonics. It is possible to switch to the slit (second double slit 152).
- interference measurement was performed once for the first double slit 150, which is both empty for one fundamental wave wavelength, and for the second double slit 152, in which the sample 2 was installed.
- a 200-second integration was performed, which corresponds to the integration of 1 ⁇ 10 6 pulses per measurement.
- the drift of the optical path of the fundamental wave becomes a factor of the systematic error of the estimated phase shift, so the drift of the optical path is suppressed to the minimum by active control.
- sample 2 The sample was an aluminum thin film and was purchased from Luxel. The film thickness is 156 ⁇ 5 nm. In the presence of an oxide film, the index of refraction of the sample appears as the effective index of refraction. When evaluated with an ellipsometer, it was found that an oxide film having a diameter of 10 nm on one side was present. Therefore, the oxide films on the front and back sides were removed by Ar sputtering. After the removal, it was handled in an environment where oxygen did not exist (partial pressure of 100 Pa or less), and an experiment was conducted. The film thickness of the oxide film after the experiment was 6.5 nm on both sides. From the above, it is considered that the sample has an aluminum film thickness of 134.5 ⁇ 5 nm and an oxide film thickness of 6.5 nm.
- the condensing optical system 116, the gas nozzle 104, and the sample holder 160 are arranged in the vacuum chamber 102 connected to the spectroscope 130.
- the inside of the spectroscope 130 and the vacuum chamber 102 is kept in a vacuum by a pump.
- the interference image of the harmonics imaged on this two-dimensional CCD lattice was converted into a one-dimensional interference image of each order by the following operation.
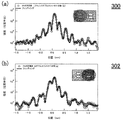
- FIGS. 6 (a) and 6 (b) show the signal intensities of the interference image of the 39th harmonic obtained from the fundamental wave having a wavelength of 650 nm.
- the horizontal axis represents the position on the Y axis of the two-dimensional CCD camera.
- FIG. 6A is an interference image 300 of the first double slit 150 obtained in the first state ⁇ 1
- FIG. 6B is an interference image 302 of the second double slit 152 obtained in the second state ⁇ 2. is there.
- the fringe positions and brightness of the two interference images 300 and 302 change between FIGS. 6A and 6B.
- the circle plot shows the measured interference image
- the solid line plot shows the interference image obtained from the calculation.
- the Fourier transform method is not a suitable method for obtaining parameters other than phase.
- Equation (2) shows an equation expressing the shape of the interference image using one-dimensional Fresnel diffraction which is paraxial approximation.
- x 0 An independent variable representing the position in the x direction on the double slit plane.
- x 1 Independent variable representing the position in the x direction on the grating plane.
- x 2 Independent variable representing the position in the x direction on the CCD array.
- ⁇ Wavelength I (x 2 ): CCD A / D signal strength at each x 2 position on the CCD array.
- g (x 0 ) Wave surface of harmonics (incident wave) on the double slit surface.
- f (x 0 ) Double slit opening function.
- W (x 1 ) Phase added by toroidal grating.
- Z 01 is 0.72 m in distance between the double slit surface and the grating surface.
- Z 12 has a distance of 0.3 m between the grating surface and the imaging surface (screen surface) of the CCD array, and these are treated as constants.
- the aperture function f (x 0 ) is ideally represented by a step function having a discontinuity of 0 and 1 at the boundary of the aperture.
- the double slit used in the experiment has an opening with a width of 20 ⁇ m. Since there is a machining error in the focused ion beam (FIB) machining, the exact values of the slit width and spacing are treated as variables, not as constants, and the interference obtained from equation (2). The value calculated for the image most closely matches the observed value (300, 302) obtained by the measurement was adopted. Further, in order to remove high frequency components above the Nyquist frequency, the aperture function f (x 0 ) was replaced with an error function having a width of 1 ⁇ m.
- FIB focused ion beam
- Non-Patent Document 32 Since the size of the harmonic light source is considered to be 10 ⁇ m or less, the electric field intensities at the openings of the double slits 150 and 152 separated from the light source by 44 cm are uniformly distributed. According to Fansitter Zernike's theorem, the spatial coherence of harmonics in a double slit opening can be regarded as 100% (Non-Patent Document 32).
- a stabilizer 120 is provided to stabilize the beam pointing.
- the stabilizer 120 monitors the positions of the short pulse laser light in the focused optical system 116 at two points, the parallel light and the focused point, and determines the mechanical state of the optical element of the focused optical system 116. Control.
- the position detection elements PSD1 and PSD2 are used to monitor the position of the fundamental wave S0 at two points including the parallel light and the focusing point. Then, by controlling the two mirror holders 124 and 126 constituting the condensing optical system 116 together with the mirror 118 by the piezo actuator, the two position detection elements were stabilized. At the focusing position, the focusing position was stabilized to 0.1 ⁇ m or less on average for 1 ⁇ 10 6 pulses. By stabilization, the systematic error of the phase derived from the drift of the focused position of the fundamental wave could be suppressed to 0.08 mrad or less.
- this stabilization method cannot control the fluctuation between adjacent pulses that arrive at intervals of 200 microseconds ( ⁇ s). Therefore, it is assumed that 1 ⁇ 10 6 condensing positions, that is, the center of the wave surface g, are normally distributed with a certain standard deviation P ⁇ .
- the statistical uncertainty of the CCD A / D signal was clarified in order to perform the chi-square test of the formula (3).
- HHG light (72.8 eV) was measured with a CCD camera at a sampling rate sufficiently shorter than the time constant of the disturbance.
- the dispersion of the A / D signal of the CCD has a linear component with a slope of about 2 with respect to the average signal strength. That is, this is photon shot noise, and its standard deviation is given by Eq. (4), where I is the A / D signal strength.
- the noise derived from dark current of the CCD camera is about 0.0000175 A / D counts / pixel / sec.
- the noise derived from the dark current in the 200-second integration is considered to be sufficiently smaller than the photon shot noise and is ignored here.
- the read noise per pixel is 1.21 A / D counts / pixel. As described above, it is considered that the integration per point is performed for 15 pixels centered on the position corresponding to the peak intensity, and the signal is obtained by subtracting the background.
- the incident wave surface g is assumed to be the simplest plane wave, and the phase applied on the toroidal surface is assumed by Eq. (6).
- f is the focal length of the toroidal surface along the optical axis of the zero-order diffracted light, which is 0.3 m.
- the phase term W due to the incident wave surface g and the toroidal grating was reexamined. It has been reported that the wave surface of harmonics generated by a Gaussian beam is well represented by a Gaussian beam (TEM00 mode) (Non-Patent Documents 33 and 34).
- TEM00 mode Gaussian beam
- Non-Patent Documents 33 and 34 Non-Patent Documents 33 and 34.
- the terms representing the wave plane in the TEM00 mode the component that changes with respect to the change x 0 in the plane orthogonal to the propagation direction has the form of a quadratic function.
- the wave plane is not a plane wave, but shows the dependence of Eq. (7) on the change x 0 in the plane. Since it is known that the waist position of harmonics has a degree dependence, R is treated as a variable depending on the order (Non-Patent Document 33).
- the first term is the slope of the wave surface added by the toroidal grating
- the second term is the curvature of the wave surface added by the toroidal grating.
- ⁇ (slope) and F (curvature) are treated as variables that depend on the wavelength ⁇ . Since the details of how to draw the grating are black-boxed, no consideration is given to higher-order phase terms in this disclosure.
- the above variables are optimized so as to reproduce the interference image 300 obtained in the first state ⁇ 1 well, and the shape of the interference image of the double slits with both emptiness calculated by the least squares method is shown in FIG. 6A. Shown by a solid line. It can be seen that the calculation result and the measurement result show a match of two digits or more in the dynamic range.
- the fitting parameters are (A, ⁇ , F, R) and the fluctuation P ⁇ of the light source. With the above improvements, ⁇ r 2 is now distributed between 1.6 and 6.4.
- the interference image 302 obtained in the second state ⁇ 2 in which the sample 2 was placed in the slit on one side was evaluated using the equation (2).
- the term of Lesp (i ⁇ ) is multiplied by using the electric field transmittance L and the phase difference ⁇ . It can be seen that this also shows a match of two digits or more in the dynamic range.
- the values obtained by the measurement and analysis of the first state ⁇ 1 were used.
- the fitting parameters are (A, L, ⁇ ) and the fluctuation P ⁇ of the light source.
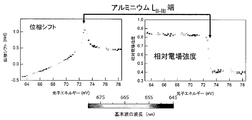
- FIG. 7 is a diagram showing ⁇ and L obtained by the experiment. A clear structure with a peak near 72.8 eV has been observed, which indicates the L end of aluminum. Next, the refractive index can be obtained from the following equation (9).
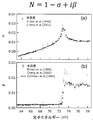
- FIG. 8 is a diagram showing the refractive index obtained by the experiment.
- the uncertainty of the film thickness contributes to the uncertainty of ⁇ and L in the error bar.
- FIG. 8 shows the previously reported refractive index in addition to the error bar plots obtained by the optical constant measuring device 100.
- Both the real part and the imaginary part agreed with Birkenstock (Non-Patent Document 7) in terms of energy around the L end, but the database of CXRO (The Center for X-ray Optics) and the result of Chang (Non-Patent Document 8) agreed. There wasn't. In the energy below the L end, the result of the imaginary part by Gullikson (Non-Patent Document 9) was in agreement with the range of the error bar. The difference in Chang's results is due to the indefiniteness of the variance measurement.
- FIG. 9 is a diagram showing the calculation result of the reflectance of the Al / Zr multilayer mirror.
- Zr the value of CXRO is used
- Al the optical constant of Al obtained by the optical constant measuring device 100 and the value of CXRO are used.
- the multilayer mirror was designed with the optical constants obtained this time, it was confirmed that the difference was significantly about 5 ⁇ 1%.
- optical constant measuring device 100 has been described above.
- the complex refractive index was quantitatively evaluated as a parameter of the model function by modeling the double slit interference image of the higher harmonics.
- the statistical uncertainty of the observed values was quantified by actual measurement, and the design of the double slit was optimized so that the uncertainty of the complex refractive index was the smallest.
- the error was quantitatively evaluated for the first time as an evaluation of the refractive index of EUV.
- the phase shift detection error estimated from the shape analysis of the interference image was about 9 mrad below the L end and about 13 mrad at higher energy than the L end. Double-digit accuracy has been improved for a high-order harmonic-based double slit interferometer.
- the reflectance of the multilayer mirror can be evaluated within ⁇ 1%.
- the fitting with the second interference image 302 (A, A two-step process of calculating L, ⁇ , P ⁇ ) was performed, but the calculation procedure is not limited to this. All parameters (A, ⁇ ,) that describe the model so that the interference image calculated based on equation (2) fits accurately to both of the two interference images 300, 302 obtained in the measurement. F, R, P ⁇ , L, ⁇ ) may be optimized all at once.
- the measurement of the first interference image 300 may be omitted in the second and subsequent measurements, only the second interference image 302 may be measured, and the optical constant of the sample may be calculated.
- the method of determining the model (function) of the optical constant measuring device 100 is not limited to that described in the embodiment, but the functions g ( ⁇ ), f ( ⁇ ), W ( ⁇ ) that describe the wave surface, the opening of the double slit, and the diffraction grating. ) May be defined so that the actual measuring device can be described with the highest accuracy.
- the present invention relates to a technique for measuring optical constants such as a complex refractive index.
- Non-linear medium 100 ...
- Optical constant measuring device 104 ... Gas nozzle, 110 ... Coherent light source, 112 ... Main light source, 116 ... Condensing optical system, 120 ... Stabilizer, 130 ... Spectrometer, 132 ... Diffraction grating, 134 ... image sensor, 136 ... incident slit, 138 ... filter, 150 ... first double slit, 152 ... second double slit, 160 ... sample holder, 200 ... arithmetic processing device.
Landscapes
- Physics & Mathematics (AREA)
- Spectroscopy & Molecular Physics (AREA)
- General Physics & Mathematics (AREA)
- Health & Medical Sciences (AREA)
- Life Sciences & Earth Sciences (AREA)
- Chemical & Material Sciences (AREA)
- Analytical Chemistry (AREA)
- Biochemistry (AREA)
- General Health & Medical Sciences (AREA)
- Immunology (AREA)
- Pathology (AREA)
- Investigating Or Analysing Materials By Optical Means (AREA)
Abstract
Description
本開示のいくつかの例示的な実施形態の概要を説明する。この概要は、後述する詳細な説明の前置きとして、実施形態の基本的な理解を目的として、1つまたは複数の実施形態のいくつかの概念を簡略化して説明するものであり、発明あるいは開示の広さを限定するものではない。またこの概要は、考えられるすべての実施形態の包括的な概要ではなく、実施形態の欠くべからざる構成要素を限定するものではない。便宜上、「一実施形態」は、本明細書に開示するひとつの実施形態(実施例や変形例)または複数の実施形態(実施例や変形例)を指すものとして用いる場合がある。
以下、本発明を好適な実施の形態をもとに図面を参照しながら説明する。各図面に示される同一または同等の構成要素、部材、処理には、同一の符号を付するものとし、適宜重複した説明は省略する。また、実施の形態は、発明を限定するものではなく例示であって、実施の形態に記述されるすべての特徴やその組み合わせは、必ずしも発明の本質的なものであるとは限らない。
図1は、ダブルスリットによる屈折率の測定原理を説明する図である。ダブルスリット干渉像の形状を解析することによって2つのスリット(ダブルスリット)を透過する電場の光路差と強度比を推定できる(非特許文献8)。片方のスリットに試料(サンプル2)を設置した場合の電場の光路差と強度比は試料の屈折率と厚さによって決まる。そのため推定した2つのパラメータすなわち位相θと電場強度比Lから以下の式(1)より試料の複素屈折率を直接求めることができる。

図2は、実施形態に係る光学定数測定装置100を示す図である。光学定数測定装置100による測定は、第1状態φ1と第2状態φ2の二状態で行われる。光学定数測定装置100は、主として、コヒーレント光源110、分光器130、第1ダブルスリット150、第2ダブルスリット152、演算処理装置200を備える。
(ii)関数f(ξ)は、ダブルスリットの開口を表すモデルである。
(iv)関数W(ρ)は、回折格子132を表すモデルである。
自由空間180,182は、一般的な自由空間の伝搬として扱うことができる。
ξは、ダブルスリットにおける縦方向の位置を表す独立変数である。
ρは、回折格子における縦方向の位置を表す独立変数である。
xは、イメージセンサのセンサ面における縦方向の位置を表す独立変数である。
サンプル2の複素屈折率は、ダブルスリットのモデルf(ξ)に内包した形で表すことができる。具体的には、第1状態φ1のモデルf(ξ)は、サンプル2に依存せず、第2状態φ2のモデルf(ξ)は、サンプル2の複素屈折率を含む。
光学定数測定装置100の実験結果を説明する。
コヒーレント光源110は、主光源112と、光パラメトリック増幅器114で構成した。主光源112として、モードロックチタンサファイアレーザーを再生増幅したコヒレント社のLegend Elite Duo(5kHz,2.2mJ)を用いた。光パラメトリック増幅器114としては、Light conversion社 Topas prime 及び NirUVis を用い、それから取り出したシグナル光の第二高調波を、高次高調波発生の基本波である短パルスレーザ光S0として用いた。波長は640~670nmの13波長である。FC spiderで測定したところ、パルス幅は25fsであった。この構成によれば、基本波(短パルスレーザ光S0)の波長の最適化と、高次高調波の次数の組み合わせによって、EUV領域の任意の波長で干渉像を得ることが可能となる。
サンプルはアルミニウム薄膜であり、Luxelから購入した。膜厚は156±5nmである。酸化膜が存在する場合、サンプルの屈折率は有効屈折率として現れる。エリプソメーターで評価したところ片面10nmの酸化膜が存在することがわかった。そこでArスパッタリングにより表裏それぞれ酸化膜を除去した。除去後は酸素が存在しない環境(分圧100Pa以下)に保って取り扱い、実験を行った。実験後の酸化膜の膜厚は表裏合わせて6.5nmであった。以上によりアルミニウム膜厚134.5±5nm、酸化膜厚6.5nmのサンプルと考えられる。
CCDカメラは横(Y)縦(X)=2048x512ピクセルの画素数を持つ。この二次元CCD格子に結像した高調波の干渉像を以下の操作で各次数ごとの一次元干渉像に変換した。各次数の高調波のCCD面上のY2方向の幅は波長幅及び分光器の装置関数のため有限の値(FWHM=9pixel)を持っている。そこで着目する次数の強度を得るためピーク強度にあたる位置を中心に15ピクセル分の信号強度を積分し、その値を各次数の信号強度とした。
干渉像の形状からサンプル2を透過した際の光路長の変化に伴う位相変化と電場の減衰率を評価するための解析を検討した。干渉像のフリンジパターンを解析する際はその簡便さからフーリエ変換法が用いられることが多い(非特許文献31)。この解析は着目する周波数成分の各点における位相を抽出する手法である。だが位相項はサンプルを透過することによる光路差だけではなく、スリット開口の幾何学的な形状や配置が寄与する。よって光路差を評価するためには各成分の位相への寄与を明らかにする必要がある。だが開口とスクリーンの間にレンズなどの光学系が挿入されている場合や光源の波面が平面波とみなせない場合はフーリエ変換法だけで詳細を明らかにすることは難しい。またフーリエ変換法は位相以外のパラメータ求める場合は適した方法ではない。

x1: グレーティング平面におけるx方向の位置を表す独立変数。
x2:CCDアレイ上のx方向の位置を表す独立変数。
λ: 波長
I(x2):CCDアレイ上の各x2位置におけるCCD A/D信号強度。
g(x0): ダブルスリット面における高調波(入射波)の波面。
f(x0): ダブルスリットの開口関数。
W(x1): トロイダルグレーティングによって加えられる位相。


CCDカメラの暗電流由来のノイズは0.0000175 A/D counts/pixel/sec程度である。200秒積算での暗電流由来のノイズは光子ショットノイズより十分小さいと考えここでは無視する。
CCDカメラの各素子は読み出しノイズが存在する。50kHzの読み出し速度で一ピクセルあたりの読み出しノイズは1.21 A/D counts/pixelである。上述のように、一点あたりの積算は、ピーク強度にあたる位置を中心とする15ピクセルに対して行われ、かつ信号はバックグラウンドを差し引くことで得られることを考慮した。



高調波のウエスト位置は次数依存性を持つことが知られているため、Rを次数に依存した変数として扱った(非特許文献33)。

フィッティングモデルの改善によりχr 2は1.6~6.4程度に収まったが、残差の分布を調べたところ系統的な特徴が存在すること分かった。このようなランダムではない系統的な残差は系統誤差としてパラメータの不確定性に寄与する。そこで系統的な残差の二乗平均平方根=Ormsを測定量とモデルの間の系統誤差として扱った(非特許文献35)。またその分布を標準偏差Ormsを持つ正規分布と近似した(非特許文献36)。系統誤差から推定される位相θの不確定性は、
Δθsyst=8mrad
となった。ただし本開示では求めた不確定性は全て68%信頼区間に相当する。統計的な不確定性Δθstatの信頼区間は68%である。全不確定性を、ΔθsystとΔθstatの二乗和の平方根とした。



Claims (9)
- 短パルスレーザ光を非線形媒質に照射して得られる高次高調波を含むコヒーレント光を出力するコヒーレント光源と、
前記コヒーレント光を回折する回折格子および前記回折格子により回折された光を撮像するイメージセンサを含む分光器と、
第1方向に離間する開口ペアを有し、第1状態において、前記コヒーレント光源と前記分光器の入射スリットの間の所定位置に配置される第1ダブルスリットと、
前記第1ダブルスリットのレプリカである開口ペアを有し、第2状態において、当該開口ペアの一方の開口にサンプルを保持した状態で、前記所定位置に前記第1ダブルスリットと置換して配置される第2ダブルスリットと、
前記第1状態において、前記コヒーレント光の前記高調波が前記イメージセンサに形成する第1干渉像と、前記第2状態において、前記高調波が前記イメージセンサに形成する第2干渉像と、にもとづいて、前記サンプルの光学定数を計算する演算処理装置と、
を備えることを特徴とする光学定数測定装置。 - 前記光学定数測定装置がパラメータを用いてモデル化されており、
前記演算処理装置は、前記光学定数測定装置のモデルにもとづき、前記第1状態および前記第2状態において前記イメージセンサ上に形成される強度分布を、一次元フレネル回折の式により計算し、
計算された前記強度分布が、前記第1干渉像および前記第2干渉像に近づくように、前記モデルのパラメータおよび前記サンプルの光学定数を取得することを特徴とする請求項1に記載の光学定数測定装置。 - 前記第1ダブルスリットおよび前記第2ダブルスリットの開口は、誤差関数を用いてモデリングされることを特徴とする請求項2に記載の光学定数測定装置。
- 前記第1干渉像および前記第2干渉像は、前記コヒーレント光の複数回の照射の積算として得られるものであり、
前記第1ダブルスリットおよび前記第2ダブルスリットへの入射波の波面の関数は、その中心位置が、正規分布でばらついているものとして扱われることを特徴とする請求項2または3に記載の光学定数測定装置。 - 前記第1ダブルスリットと前記第2ダブルスリットは、前記第1方向と垂直な第2方向に連続して形成され、
前記光学定数測定装置は、
前記第1ダブルスリットおよび前記第2ダブルスリットを、前記第2方向にシフトさせるステージをさらに備えることを特徴とする請求項1から4のいずれかに記載の光学定数測定装置。 - 前記コヒーレント光源は、光パラメトリック増幅器を含み、前記短パルスレーザ光の波長が可変であることを特徴とする請求項1から5のいずれかに記載の光学定数測定装置。
- 前記コヒーレント光源は、
前記短パルスレーザ光を発生する主光源と、
前記非線形媒質であるガスを噴射するガスノズルと、
前記短パルスレーザ光を前記ガスに集光する集光光学系と、
前記集光光学系における前記短パルスレーザ光の平行光と集光点の二箇所における前記短パルスレーザ光の位置をモニタし、前記集光光学系の光学素子の機械的状態を制御する安定化装置と、
を含むことを特徴とする請求項1から6のいずれかに記載の屈折測定装置。 - 短パルスレーザ光を非線形媒質に照射し、高次高調波を含むコヒーレント光を生成するステップと、
前記コヒーレント光を、第1方向に離間する開口ペアを有する第1ダブルスリットに通過させ、第1干渉像を測定するステップと、
前記コヒーレント光を、前記第1ダブルスリットのレプリカである開口ペアを有し、当該開口ペアの一方の開口にサンプルを保持した第2ダブルスリットを通過させ、第2干渉像を測定するステップと、
前記第1干渉像と前記第2干渉像にもとづいて、前記サンプルの光学定数を計算するステップと、
を備えることを特徴とする屈折率の測定方法。 - 測定系により得られる第1干渉像および第2干渉像にもとづいてサンプルの光学定数を計算する方法であって、
前記測定系は、
短パルスレーザ光を非線形媒質に照射して得られる高次高調波を含むコヒーレント光を出力するコヒーレント光源と、
前記コヒーレント光を回折する回折格子および前記回折格子により回折された光を撮像するイメージセンサを含む分光器と、
第1方向に離間する開口ペアを有し、第1状態において、前記コヒーレント光源と前記分光器の入射スリットの間の所定位置に配置される第1ダブルスリットと、
前記第1ダブルスリットのレプリカである開口ペアを有し、第2状態において、当該開口ペアの一方の開口にサンプルを保持した状態で、前記所定位置に前記第1ダブルスリットと置換して配置される第2ダブルスリットと、
を備え、
前記第1干渉像は、前記第1状態において、前記コヒーレント光の前記高調波が前記イメージセンサに形成されるものであり、
前記第2干渉像は、前記第2状態において、前記高調波が前記イメージセンサに形成されるものであり、
前記計算方法は、
前記第1状態および前記第2状態における前記測定系のモデルを規定するステップと、
前記第1状態の前記測定系のモデルが形成する第1回折パターンを一次元フレネル回折の式にもとづいて計算するステップと、
前記第2状態の前記測定系のモデルが形成する第2回折パターンを一次元フレネル回折の式にもとづいて計算するステップと、
前記第1回折パターンが前記第1干渉像に近づき、前記第2回折パターンが前記第2干渉像に近づくように、前記測定系のモデルのパラメータおよび前記サンプルの光学定数を計算するステップと、
を備えることを特徴とする方法。
Priority Applications (3)
| Application Number | Priority Date | Filing Date | Title |
|---|---|---|---|
| JP2021539316A JP7646210B2 (ja) | 2019-08-15 | 2020-08-14 | 光学定数測定装置および光学定数の計算方法 |
| EP20851707.8A EP4016060B1 (en) | 2019-08-15 | 2020-08-14 | Optical constant measuring device and method for calculating an optical constant |
| US17/672,114 US12241781B2 (en) | 2019-08-15 | 2022-02-15 | Device and method for measuring optical constant |
Applications Claiming Priority (2)
| Application Number | Priority Date | Filing Date | Title |
|---|---|---|---|
| US201962887077P | 2019-08-15 | 2019-08-15 | |
| US62/887,077 | 2019-08-15 |
Related Child Applications (1)
| Application Number | Title | Priority Date | Filing Date |
|---|---|---|---|
| US17/672,114 Continuation US12241781B2 (en) | 2019-08-15 | 2022-02-15 | Device and method for measuring optical constant |
Publications (1)
| Publication Number | Publication Date |
|---|---|
| WO2021029435A1 true WO2021029435A1 (ja) | 2021-02-18 |
Family
ID=74569361
Family Applications (1)
| Application Number | Title | Priority Date | Filing Date |
|---|---|---|---|
| PCT/JP2020/030878 Ceased WO2021029435A1 (ja) | 2019-08-15 | 2020-08-14 | 光学定数測定装置および光学定数の測定方法、光学定数の計算方法 |
Country Status (5)
| Country | Link |
|---|---|
| US (1) | US12241781B2 (ja) |
| EP (1) | EP4016060B1 (ja) |
| JP (1) | JP7646210B2 (ja) |
| TW (1) | TWI864070B (ja) |
| WO (1) | WO2021029435A1 (ja) |
Families Citing this family (3)
| Publication number | Priority date | Publication date | Assignee | Title |
|---|---|---|---|---|
| TWI782822B (zh) * | 2021-12-16 | 2022-11-01 | 國立清華大學 | 利用掃描式同調光繞射的三維顯影方法及系統 |
| US12578652B2 (en) * | 2022-09-01 | 2026-03-17 | Taiwan Semiconductor Manufacturing Company, Ltd. | Photomask and methods for measuring and manufacturing the photomask |
| JP2024063855A (ja) * | 2022-10-27 | 2024-05-14 | 株式会社Screenホールディングス | 位相差測定装置および位相差測定方法 |
Citations (1)
| Publication number | Priority date | Publication date | Assignee | Title |
|---|---|---|---|---|
| US20170281102A1 (en) * | 2016-03-31 | 2017-10-05 | Weng-Dah Ken | Non-contact angle measuring apparatus, mission critical inspection apparatus, non-invasive diagnosis/treatment apparatus, method for filtering matter wave from a composite particle beam, non-invasive measuring apparatus, apparatus for generating a virtual space-time lattice, and fine atomic clock |
Family Cites Families (3)
| Publication number | Priority date | Publication date | Assignee | Title |
|---|---|---|---|---|
| TW201600901A (zh) * | 2014-06-19 | 2016-01-01 | 勝華科技股份有限公司 | 裝飾板以及觸控面板 |
| CN105115940B (zh) * | 2015-09-08 | 2017-10-20 | 福州大学 | 光学材料折射率曲线测量方法及装置 |
| CN108132230A (zh) * | 2018-03-05 | 2018-06-08 | 长春理工大学 | 一种液体折射率自动测量的装置及方法 |
-
2020
- 2020-08-14 EP EP20851707.8A patent/EP4016060B1/en active Active
- 2020-08-14 JP JP2021539316A patent/JP7646210B2/ja active Active
- 2020-08-14 WO PCT/JP2020/030878 patent/WO2021029435A1/ja not_active Ceased
- 2020-08-14 TW TW109127790A patent/TWI864070B/zh active
-
2022
- 2022-02-15 US US17/672,114 patent/US12241781B2/en active Active
Patent Citations (1)
| Publication number | Priority date | Publication date | Assignee | Title |
|---|---|---|---|---|
| US20170281102A1 (en) * | 2016-03-31 | 2017-10-05 | Weng-Dah Ken | Non-contact angle measuring apparatus, mission critical inspection apparatus, non-invasive diagnosis/treatment apparatus, method for filtering matter wave from a composite particle beam, non-invasive measuring apparatus, apparatus for generating a virtual space-time lattice, and fine atomic clock |
Non-Patent Citations (39)
| Title |
|---|
| A. DASR. K. GUPTAM. H. MODIC. MUKHERJEES. K. RAIA. BOSET. GANGULIS. C. JOSHIG. S. LODHAS. K. DEB, APPLIED OPTICS, vol. 51, 2012, pages 7402 |
| A. K. RAY-CHAUDHURIS. E. GIANOULAKISP. A. SPENCEM. P. KANOUFFC. D. MOEN: "Emerging Lithographic Technologies II", INTERNATIONAL SOCIETY FOR OPTICS AND PHOTONICS, 1998, pages 124 - 133 |
| A. R. THOMPSONJ. M. MORANG. W. SWENSON: "Interferometry and Synthesis in Radio Astronomy", 2017, SPRINGER INTERNATIONAL PUBLISHING, article "Van Cittert-Zernike Theorem, Spatial Coherence, and Scattering", pages: 767 - 786 |
| B. L. HENKEE. M. GULLIKSONJ. C. DAVIS, ATOMIC DATA AND NUCLEAR DATA TABLES, vol. 54, 1993, pages 181 |
| B.-T. CHOUY.-H. CHOUY.-M. WUY.-C. CHUNGW.-J. HSUEHS.-W. LINT.-C. LUT.-R. LINS.-D. LIN, SCIENTIFIC REPORTS, vol. 6, 2016, pages 19887 |
| C. CHANGE. ANDERSONP. NAULLEAUE. GULLIKSONK. GOLDBERGD. ATTWOOD, OPT. LETT., vol. 27, 2002, pages 1028 |
| C. KAPTEYN, NATURE PHOTONICS, vol. 4, 2010, pages 822 |
| CHANG, CHANG: "Direct measurement of index of refraction in the extreme- ultraviolet wavelength region with a novel interferometer", OPTICS LETTERS, vol. 27, no. 12, 15 June 2002 (2002-06-15), pages 1028 - 1030, XP001115231 * |
| D. DESCAMPSC. LYNGAJ. NORINA. L'HUILLIERC.-G. WAHLSTROMJ.-F. HERGOTTH. MERDJIP. SALIERESM. BELLINIT. W. HANSCH, OPT. LETT., vol. 25, 2000, pages 135 |
| D. G. STEARNSR. S. ROSENS. P. VERNON, APPL. OPT., vol. 32, 1993, pages 6952 |
| D. HEMMERSM. BENZIDG. PRETZLER, APPL. PHYS., vol. 108, 2012, pages 167 |
| D. L. WINDT: "Solar Physics and Space Weather Instrumentation VI", INTERNATIONAL SOCIETY FOR OPTICS AND PHOTONICS, 2015, pages 96040P |
| D. S. GIANOLAS. VAN PETEGEMM. LEGROSS. BRANDSTETTERH. VAN SWYGENHOVENK. J. HEMKER, ACTA MATERIALIA, vol. 54, 2006, pages 2253 |
| D. T. LLOYDK. O'KEEFFES. M. HOOKER: "Complete spatial characterization of an optical wavefront using a variable-separation pinhole pair", OPT. LETT., vol. 38, no. 7, 2013, pages 1173 - 1175 |
| DEVELOPMENT OF TIME-RESOLVED PHASE-SENSITIVE INDEX MEASUREMENT METHOD USING HIGH-ORDER HARMONICS: "NAGAKUBO, Yuki", DISSERTATION DEPARTMENT OF PHYSICS, GRADUATE SCHOOL OF SCIENCE, UNIVERSITY OF TOKYO, UTOKYO REPOSITORY, 23 March 2017 (2017-03-23), JP, pages 1 - 131,169-176, XP009534712, DOI: 10.15083/00075554 * |
| E. FRUMKERG. G. PAULUSH. NIIKURAD. M. VILLENEP. B. CORKUM: "Frequency-resolved high-harmonic wavefront characterization", OPT. LETT., vol. 34, no. 19, 2009, pages 3026 - 3028, XP001548619, DOI: 10.1364/ol.34.003026 |
| E. M. GULLIKSONP. DENHAMS. MROWKAJ. H. UNDERWOOD, PHYS. REV. B, vol. 49, 1994, pages 16283 |
| EIKYUHO, YUKI: "Development of a method for time-resolved phase-sensitive detection of refractive indices using high-order harmonics", THESIS, 23 March 2017 (2017-03-23), pages 1 - 3, XP055902284 * |
| G. W. FRASERA. F. ABBEYA. HOLLANDK. MCCARTHYA. OWENSA. WELLS, NUCLEAR INSTRUMENTS AND METHODS IN PHYSICS RESEARCH SECTION A: ACCELERATORS, SPECTROMETERS, DETECTORS AND ASSOCIATED EQUIPMENT, vol. 350, 1994, pages 368 |
| H. YANC. WANGA. R. MCCARNH. ADE, PHYS. REV. LETT., vol. 110, 2013, pages 177401 |
| H.-G. BIRKENW. JARKC. KUNZR. WOLF, NUCLEAR INSTRUMENTS AND METHODS IN PHYSICS RESEARCH SECTION A: ACCELERATORS, SPECTROMETERS, DETECTORS AND ASSOCIATED EQUIPMENT, vol. 253, 1986, pages 166 |
| J. DOBACZEWSKIW. NAZAREWICZP.-G. REINHARD: "Error estimates of theoretical models: a guide", J. PHYS. G NUCL. PART. PHYS., vol. 41, no. 7, 2014, pages 074001 |
| J. J. MACKLINJ. D. KMETECC. L. GORDON, PHYS. REV. LETT., vol. 70, 1993, pages 1994 |
| K. A. GOLDBERGR. BEGUIRISTAINJ. BOKORH. MEDECKID. T. ATTWOODK. JACKSONE. TEJNILG. E. SOMMARGREN, JOURNAL OF VACUUM SCIENCE TECHNOLOGY B: MICROELECTRONICS AND NANOMETER STRUCTURES PROCESSING, MEASUREMENT, AND PHENOMENA, vol. 13, 1995, pages 2923 |
| L. A. WILSONA. K. ROSSALLE. WAGENAARSC. M. CACHOE. SPRINGATEI. C. E. TURCUG. J. TALLENTS, APPL. OPT., vol. 51, 2012, pages 2057 |
| M. GOLDSTEINR. HUDYMAP. NAULLEAUS. WURM, OPT. LETT., vol. 33, 2008, pages 2995 |
| M. M. BARYSHEVAA. E. PESTOVN. N. SALASHCHENKOM. N. TOROPOVN. I. CHKHALO, PHYS.-USP., vol. 55, 2012, pages 681 |
| M. R. ALEXANDERG. E. THOMPSONX. ZHOUG. BEAMSONN. FAIRLEY, SURF. INTERFACE ANAL, vol. 34, 2002, pages 485 |
| M. TAKEDAH. INAS. KOBAYASHI: "Fourier-transform method of fringe-pattern analysis for computer-based topography and interferometry", J. OPT. SOC. AM., vol. 72, no. 1, 1982, pages 156 - 160 |
| P. M. PAULE. S. TOMAP. BREGERG. MULLOTF. AUGEP. BALCOUH. G. MULLERP. AGOSTINI, SCIENCE, vol. 292, 2001, pages 1689 |
| P. MERCEREP. ZEITOUNM. IDIRS. L. PAPED. DOUILLETX. LEVECQG. DOVILLAIRES. BUCOURTK. A. GOLDBERGP. P. NAULLEAU, OPT. LETT., vol. 28, 2003, pages 1534 |
| P. SINERVO, DEFINITION AND TREATMENT OF SYSTEMATIC UNCERTAINTIES IN HIGH ENERGY PHYSICS AND ASTROPHYSICS, 2003 |
| R. A. BARTELSA. PAULH. GREENH. C. KAPTEYNM. M. MURNANES. BACKUSI. P. CHRISTOVY. LIUD. ATTWOODC. JACOBSEN, SCIENCE, vol. 297, 2002, pages 376 |
| R. KEENANC. L. S. LEWISJ. S. WARKE. WOLFRUM, J. PHYS. B: AT. MOL. OPT. PHYS., vol. 35, 2002, pages L447 |
| S. BAJTJ. B. ALAMEDAT. W. BARBEEW. M. CLIFTJ. A. FOLTAB. B. KAUFMANNE. A. SPILLER, OPT. ENG., vol. 41, 2002, pages 1797 |
| See also references of EP4016060A4 |
| W. CHAOJ. KIMS. REKAWAP. FISCHERE. H. ANDERSON, OPT. EXP., vol. 17, 2009, pages 17669 |
| WILSON, LUCY A.: "Double slit interferometry to measure the EUV refractive indices of solids using high harmonics", APPLIED OPTICS, vol. 51, no. 12, 20 April 2012 (2012-04-20), pages 2057 - 2061, XP001574791, DOI: 10.1364/AO.51.002057 * |
| Y. LIK. OTAK. MURAKAMI, JOURNAL OF VACUUM SCIENCE & TECHNOLOGY B: MICROELECTRONICS AND NANOMETER STRUCTURES PROCESSING, MEASUREMENT, AND PHENOMENA, vol. 21, 2002, pages 127 |
Also Published As
| Publication number | Publication date |
|---|---|
| TWI864070B (zh) | 2024-12-01 |
| JP7646210B2 (ja) | 2025-03-17 |
| EP4016060A1 (en) | 2022-06-22 |
| EP4016060A4 (en) | 2023-07-26 |
| US20220252453A1 (en) | 2022-08-11 |
| TW202120911A (zh) | 2021-06-01 |
| JPWO2021029435A1 (ja) | 2021-02-18 |
| US12241781B2 (en) | 2025-03-04 |
| EP4016060B1 (en) | 2025-07-23 |
Similar Documents
| Publication | Publication Date | Title |
|---|---|---|
| JP6921243B2 (ja) | 測定方法の性能を予測する方法及び装置、測定方法及び装置 | |
| Liu et al. | High-accuracy wavefront sensing for x-ray free electron lasers | |
| US12241781B2 (en) | Device and method for measuring optical constant | |
| Rothhardt et al. | Table-top nanoscale coherent imaging with XUV light | |
| JP7104828B2 (ja) | エキシマ光源におけるスペックルの低減 | |
| TWI652456B (zh) | 用以評估脈衝光束之光譜特徵的方法及光系統 | |
| US11002688B2 (en) | System for actinic inspection of semiconductor masks | |
| Chang et al. | Spatial coherence characterization of undulator radiation | |
| Masaki et al. | Two-dimensional visible synchrotron light interferometry for transverse beam-profile measurement at the SPring-8 storage ring | |
| Kolesnikov et al. | Fabrication and application of plane and concave varied line-space gratings for the vacuum spectral domain by interference lithography | |
| Goldberg et al. | Collaborative development of diffraction-limited beamline optical systems at US DOE light sources | |
| Shurvinton et al. | Development of multilayer monochromators for stripe-free X-ray imaging | |
| Goldberg et al. | Ultra-high-accuracy optical testing: creating diffraction-limited short-wavelength optical systems | |
| Cauchon et al. | Imaging of laser produced plasma at 1.43 keV using Fresnel zone plate and Bragg–Fresnel lens | |
| Yuan et al. | Cross-check of ex-situ and in-situ metrology of a bendable temperature stabilized KB mirror | |
| Merthe et al. | An experimental apparatus for diffraction-limited soft x-ray nano-focusing | |
| Schäfer et al. | Wavefront and Coherence Characteristics of Extreme UV and Soft X-ray Sources | |
| Tadesse | Nanoscale coherent diffractive imaging using high-harmonic XUV sources | |
| Polo et al. | Wavefront measurement for EUV lithography system through Hartmann sensor | |
| Goldberg et al. | Collaborative development of diffraction-limited beamline optical systems at US DOE light | |
| Zürch | High-Resolution Extreme Ultraviolet Microscopy: Imaging of Artificial and Biological Specimens with Laser-Driven Ultrafast XUV Sources | |
| Glabisch et al. | Investigation of stochastic roughness effects for nanoscale grating characterization with a stand-alone EUV spectrometer | |
| Sanz | CHARACTERISATION OF X-RAY NANO-FOCUSING OPTICS WITH A GRATING INTERFEROMETER | |
| Wojdyla et al. | Design and demonstration of tunable soft x-ray lateral shearing and Hartmann wavefront | |
| Chkhalo et al. | Manufacturing and investigation of objective lens for ultrahigh resolution lithography facilities |
Legal Events
| Date | Code | Title | Description |
|---|---|---|---|
| 121 | Ep: the epo has been informed by wipo that ep was designated in this application |
Ref document number: 20851707 Country of ref document: EP Kind code of ref document: A1 |
|
| ENP | Entry into the national phase |
Ref document number: 2021539316 Country of ref document: JP Kind code of ref document: A |
|
| NENP | Non-entry into the national phase |
Ref country code: DE |
|
| ENP | Entry into the national phase |
Ref document number: 2020851707 Country of ref document: EP Effective date: 20220315 |
|
| WWG | Wipo information: grant in national office |
Ref document number: 2020851707 Country of ref document: EP |