WO2021074990A1 - 検索装置、検索方法、検索プログラム及び学習モデル検索システム - Google Patents
検索装置、検索方法、検索プログラム及び学習モデル検索システム Download PDFInfo
- Publication number
- WO2021074990A1 WO2021074990A1 PCT/JP2019/040614 JP2019040614W WO2021074990A1 WO 2021074990 A1 WO2021074990 A1 WO 2021074990A1 JP 2019040614 W JP2019040614 W JP 2019040614W WO 2021074990 A1 WO2021074990 A1 WO 2021074990A1
- Authority
- WO
- WIPO (PCT)
- Prior art keywords
- data
- search
- transfer source
- feature
- vector
- Prior art date
- Legal status (The legal status is an assumption and is not a legal conclusion. Google has not performed a legal analysis and makes no representation as to the accuracy of the status listed.)
- Ceased
Links
Images








Classifications
-
- G—PHYSICS
- G06—COMPUTING OR CALCULATING; COUNTING
- G06F—ELECTRIC DIGITAL DATA PROCESSING
- G06F16/00—Information retrieval; Database structures therefor; File system structures therefor
- G06F16/90—Details of database functions independent of the retrieved data types
- G06F16/903—Querying
- G06F16/90335—Query processing
-
- G—PHYSICS
- G06—COMPUTING OR CALCULATING; COUNTING
- G06N—COMPUTING ARRANGEMENTS BASED ON SPECIFIC COMPUTATIONAL MODELS
- G06N20/00—Machine learning
Definitions
- the present invention relates to a transfer source search technique in transfer learning.
- transfer learning which transfers training data and a learning model in an environment different from the environment in which the training data is collected.
- transfer learning in order to identify the transfer source, it is evaluated one by one whether or not it can be a transfer source for all the data of the transfer source. As a result of the evaluation, if it can be confirmed that the transfer is a "positive transfer" indicating that the transfer is effective, it is determined as the transfer source data. This evaluation should be done automatically, but it may involve some form of human intervention.
- Patent Document 1 describes a technique for evaluating whether or not it can be a transfer source. Specifically, in Patent Document 1, learning is tried using the training data of the transfer source, and the difference between the inference result in which the data of the transfer destination is input and the inference result in which the data of the transfer source is input is used. It is described that the effectiveness of metastasis is determined.
- An object of the present invention is to make it possible to identify an appropriate transfer source in a short processing time.
- the search device is The first acquisition unit that acquires the first data obtained by base-converting the feature amount vector in the transfer source device based on the amount of information for each feature axis, and A second acquisition unit that acquires the second data obtained by base-converting the feature amount vector in the transfer destination device based on the amount of information for each feature axis, and A similarity determination unit for determining whether or not the first data acquired by the first acquisition unit and the second data acquired by the second acquisition unit are similar is provided.
- the present invention it is determined whether or not the data obtained by base-converting the feature amount vector based on the amount of information for each feature axis are similar. It is possible to evaluate whether or not the data can be a metastatic source depending on whether or not the data are similar. The process of determining whether or not the data are similar takes less time than the process of trying learning using the training data of the transfer source. Therefore, an appropriate transfer source can be identified in a short processing time.
- FIG. 1 The block diagram of the learning model search system 100 which concerns on Embodiment 1.
- FIG. The block diagram of the search apparatus 10 which concerns on Embodiment 1.
- FIG. The block diagram of the transfer source apparatus 20 which concerns on Embodiment 1.
- FIG. The block diagram of the transfer destination apparatus 30 which concerns on Embodiment 1.
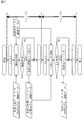
- FIG. The explanatory view of the whole process of the learning model search system 100 which concerns on Embodiment 1.
- FIG. The flowchart of the first data transmission processing of the transfer source apparatus 20 which concerns on Embodiment 1.
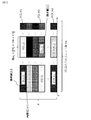
- FIG. The explanatory view of the base conversion process which concerns on Embodiment 1.
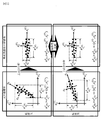
- FIG. The explanatory view of the normalization process which concerns on Embodiment 1.
- FIG. 1 Explanatory drawing of the 2D image which concerns on Embodiment 1.
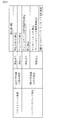
- FIG. 1 The explanatory view of the correspondence relation of the axis which concerns on Embodiment 1.
- FIG. The flowchart of the second data transmission processing of the transfer destination apparatus 30 which concerns on Embodiment 1.
- FIG. The flowchart of the search process of the search apparatus 10 which concerns on Embodiment 1.
- FIG. The flowchart of the similarity calculation process in the case where it is determined that it is not uncorrelated according to Embodiment 1.
- FIG. The flowchart of the analysis process of the transfer destination apparatus 30 which concerns on Embodiment 1.
- FIG. 1 The explanatory view of the transfer source identification process using the learning model search system 100 which concerns on Embodiment 1.
- FIG. The flowchart of the analysis process of the transfer destination device 30 when there are two or more transfer source devices 20 which are candidates for a transfer source.
- FIG. The flowchart of the similarity determination process which concerns on Embodiment 2.
- the flowchart of the similarity determination process which concerns on Embodiment 3.
- the explanatory view of the test method selection which concerns on Embodiment 3.
- the configuration of the learning model search system 100 according to the first embodiment will be described with reference to FIG.
- the learning model search system 100 includes a search device 10, one or more transfer source devices 20, and a transfer destination device 30.
- the search device 10, the transfer source device 20, and the transfer destination device 30 are connected via a transmission line 40 such as the Internet.
- One or more sensors 50 are connected to each transfer source device 20.
- One or more sensors 60 are connected to the transfer destination device 30.
- the search device 10 is a computer such as a server in cloud computing.
- the search device 10 is a computer.
- the search device 10 includes hardware for a processor 11, a memory 12, a storage 13, and a communication interface 14.
- the processor 11 is connected to other hardware via a signal line and controls these other hardware.
- the search device 10 includes a first acquisition unit 111, a second acquisition unit 112, a similarity determination unit 113, a mapping generation unit 114, and a data transmission unit 115 as functional components.
- the functions of each functional component of the search device 10 are realized by software.
- the storage 13 stores a program that realizes the functions of each functional component of the search device 10. This program is read into the memory 12 by the processor 11 and executed by the processor 11. As a result, the functions of each functional component of the search device 10 are realized.
- the storage 13 realizes the learning model storage unit 131 and the statistic storage unit 132.
- the transfer source device 20 is a computer such as an IoT device.
- the transfer source device 20 includes hardware for a processor 21, a memory 22, a storage 23, and a communication interface 24.
- the processor 21 is connected to other hardware via a signal line and controls these other hardware.
- the transfer source device 20 includes a basis conversion unit 211, a normalization unit 212, a statistic calculation unit 213, and a data transmission unit 214 as functional components.
- the functions of each functional component of the transfer source device 20 are realized by software.
- the storage 23 stores a program that realizes the functions of each functional component of the transfer source device 20. This program is read into the memory 22 by the processor 21 and executed by the processor 21. As a result, the functions of each functional component of the transfer source device 20 are realized.
- the storage 23 realizes the learning model storage unit 231 and the training data storage unit 232.
- the transfer destination device 30 is a computer such as an IoT device.
- the transfer destination device 30 includes hardware of a processor 31, a memory 32, a storage 33, and a communication interface 34.
- the processor 31 is connected to other hardware via a signal line and controls these other hardware.
- the transfer destination device 30 inputs the base conversion unit 311, the normalization unit 312, the statistic calculation unit 313, the data transmission unit 314, the data acquisition unit 315, and the learning model generation unit 316 as functional components. It includes a data conversion unit 317 and an output label conversion unit 318.
- the functions of each functional component of the transfer destination device 30 are realized by software.
- the storage 33 stores a program that realizes the functions of each functional component of the transfer destination device 30. This program is read into the memory 32 by the processor 31 and executed by the processor 31. As a result, the functions of each functional component of the transfer destination device 30 are realized.
- the storage 33 realizes the learning model storage unit 331 and the observation data storage unit 332.
- Processors 11, 21, and 31 are ICs (Integrated Circuits) that perform processing. Specific examples of the processors 11, 21, and 31 are a CPU (Central Processing Unit), a DSP (Digital Signal Processor), and a GPU (Graphics Processing Unit).
- CPU Central Processing Unit
- DSP Digital Signal Processor
- GPU Graphics Processing Unit
- the memories 12, 22, and 32 are storage devices that temporarily store data. Specific examples of the memories 12, 22, and 32 are SRAM (Static Random Access Memory) and DRAM (Dynamic Random Access Memory).
- Storages 13, 23, 33 are storage devices for storing data. Specific examples of the storages 13, 23, and 33 are HDDs (Hard Disk Drives).
- the storages 13, 23, and 33 are SD (registered trademark, Secure Digital) memory card, CF (CompactFlash, registered trademark), NAND flash, flexible disk, optical disk, compact disk, Blu-ray (registered trademark) disk, and DVD (Digital). It may be a portable recording medium such as Versail Disc).
- Communication interfaces 14, 24, and 34 are interfaces for communicating with an external device. Specific examples of the communication interfaces 14, 24, and 34 are Ethernet (registered trademark), USB (Universal Serial Bus), and HDMI (registered trademark, High-Definition Multimedia Interface) ports.
- the operation of the learning model search system 100 according to the first embodiment will be described with reference to FIGS. 5 to 16.
- the operation procedure of the search device 10 of the learning model search system 100 according to the first embodiment corresponds to the search method according to the first embodiment.
- the program that realizes the operation of the search device 10 of the learning model search system 100 according to the first embodiment corresponds to the search program according to the first embodiment.
- Each transfer source device 20 generates statistics necessary for comparison of similarity from training data.
- the training data is data generated by adding teacher data (labels) to the data acquired from the sensor 50 by each transfer source device 20.
- Each transfer source device 20 transmits the learning model and the statistic to the search device 10.
- the transfer destination device 30 generates statistics necessary for comparison of similarity from the observed data and transmits the statistics to the search device 10.
- the observation data is data generated by adding teacher data (label) to the data acquired from the sensor 60 by the transfer destination device 30.
- the search device 10 determines whether or not the statistic generated by each transfer source device 20 and the statistic generated by the transfer destination device 30 are similar.
- the search device 10 identifies the transfer source device 20 that is a candidate for the transfer source.
- the search device 10 generates a data map f and a label map g for the transfer source device 20 which is a candidate for the transfer source.
- the data map f is an input conversion from the transfer destination to the transfer source.
- the label map g is an output conversion from the transfer source to the transfer destination.
- the transfer destination device 30 receives the learning model of the transfer source device 20 that is a candidate for the transfer source as an input, and generates a learner of the transfer destination device 30.
- the transfer destination device 30 converts the observation data with the data map f and then inputs it to the generated learner.
- the transfer destination device 30 converts the label output from the learner with the label mapping g. (9)
- the transfer destination device 30 outputs the converted label.
- the first data transmission process (corresponding to the processes of (1) and (2) of FIG. 5) of the transfer source device 20 according to the first embodiment will be described with reference to FIG. (Step S11: Base conversion process)
- the base conversion unit 211 converts the coordinate system of the feature amount vector of the training data stored in the training data storage unit 232.
- the feature vector of the training data is the data obtained by removing the label from the training data.
- This process is a process of aligning the coordinate system in order to compare the distribution of the feature amount vector of the training data of the transfer source device 20 with the distribution of the feature amount vector of the observation data of the transfer destination device 30.
- the basis conversion unit 211 performs a basis conversion of the feature amount vector based on the amount of information for each feature axis.
- the basis conversion unit 211 using principal component analysis, in order from the amount of information is large feature axis of each element of the feature vector by assigning the vector z ⁇ elements z i, Obtain an orthonormal basis.
- the amount of information can be rephrased as a variance value or an eigenvalue.
- the base element z 1 is assigned to the feature axis having the largest amount of information
- the element z 2 is assigned to the feature axis having the next largest amount of information. That is, the base conversion unit 211 converts the feature vector x ⁇ on the p-dimensional Euclidean space R p into the vector z ⁇ on the m-dimensional principal component space Z m.
- vector z ⁇ i-th principal component elements z i of the contribution of elements z i PV i the cumulative contribution rate as CPV m.
- the principal components are uncorrelated with each other. Assuming that the number of dimensions of the vector z ⁇ is m, 1 ⁇ m ⁇ p and 0 ⁇ CPV m ⁇ 1 are satisfied. In particular, when m ⁇ p, it is called dimension reduction.
- the axes of the feature vector space of the transfer source device 20 and the transfer destination device 30 are sorted in descending order of contribution rate.
- Step S12 Normalization process
- the normalization unit 212 converts the vector z ⁇ after the coordinate system is converted in step S11 so that the domain falls within a certain range.
- the feature vector is normalized in order to compare the distribution of the feature vector of the training data of the transfer source device 20 and the distribution of the feature vector of the observation data of the transfer destination device 30 regardless of the scale. It is a process to be converted.
- the normalization unit 212 normalizes the scale of the element z i of the vector z ⁇ by the equation 1 so that z min ⁇ z i ⁇ z max.
- a vector that the vector z ⁇ normalized referred to as z ⁇ ⁇ .
- Step S13 Statistic calculation process
- the statistic calculation unit 213 calculates the statistic for the data converted in step S12. This process is a process of calculating the statistic used when comparing the distribution of the feature amount vector of the training data of the transfer source device 20 with the distribution of the feature amount vector of the observation data of the transfer destination device 30.
- the statistic calculation unit 213 creates a two-dimensional image of the normalized vector z ⁇ ⁇ . As shown in FIG. 9, the statistic calculation unit 213 executes this process on the normalized vector z ⁇ ⁇ for each label y k.
- data visualization (dimension reduction) techniques such as MDS (multidimensional scaling), SOM (self-organizing mapping), and t-SNE (t-distributed Stochastic Neighbor Embedding).
- MDS multidimensional scaling
- SOM self-organizing mapping
- t-SNE t-distributed Stochastic Neighbor Embedding
- the statistic calculation unit 213 creates a two-dimensional image of the normalized vector z ⁇ ⁇ by the following procedure.
- the statistic calculation unit 213 calculates the ceiling function of the normalized vector z ⁇ ⁇ y_k and quantizes it into 8 bits, as shown in Equation 2.
- y_k means y k.
- i_j means i j with j as a subscript of i.
- the statistic calculation unit 213 converts the quantized data into a grayscale image weighted by the contribution rate PV.
- a grayscale image consists of a set of small regions called units U. The unit in row i and column j is referred to as U (i, j). Then, as shown in FIG.
- the pixel value of the unit U (i, j) becomes the calculated value of the ceiling function of the element z ⁇ j of the normalized vector z ⁇ ⁇ as shown in Equation 3, and is high.
- the value is 1, and the width w j is the value shown in Equation 4.
- N is the number of feature vector for each label. 9, for example, N y_1 is adapted to feature vector number since 10 labels y 1.
- the statistic calculation unit 213 calculates a histogram for each label in order to facilitate determination as to whether or not the set G of pixel values of the transfer source device 20 and the transfer destination device 30 is similar.
- the histogram generated from the feature vector may not reflect the characteristics of the original population. Therefore, the statistic calculation unit 213 estimates the probability density function of the population.
- the kernel density estimate f ⁇ h (x) is defined by the equation 5 with the set G as a sample of the population. In Equation 5,
- the statistic calculation unit 213 sets the set of kernel density estimates f ⁇ h (x) calculated for each label as the first data representing the statistic used for determining whether or not they are similar.
- Step S14 Statistic transmission process
- the data transmission unit 214 has an axis correspondence relationship between the data before and after the coordinate system is converted in step S11, and the minimum value min (x i ) of each axis i before being normalized in step S12. and a maximum value max (x i), transmits the first data representative of the statistic calculated at step S13 in the search apparatus 10.
- the first obtaining section 111 of the retrieval device 10 includes a correspondence between the axes sent, the minimum value min (x i) and a maximum value max (x i), to obtain the first data, statistics Write to the storage unit 132.
- the correspondence relationship between the axes is specified from the magnitude relationship of the axes. In the case of FIG. 11, the correspondence between the axes is represented as shown in Equation 6.
- Step S15 Learning model transmission process
- the data transmission unit 214 reads the learning model generated from the training data stored in the training data storage unit 232 from the training model storage unit 231 and transmits it to the search device 10. Then, the first acquisition unit 111 of the search device 10 associates the transmitted learning model with the first data transmitted in step S14, and writes it in the learning model storage unit 131.
- Step S21 Base conversion process
- the base conversion unit 311 converts the coordinate system of the feature vector of the observation data stored in the observation data storage unit 332.
- the method of converting the coordinate system is the same as in step S11 of FIG.
- Step S22 Normalization process
- the normalization unit 312 converts the vector z ⁇ after the coordinate system is converted in step S21 so that the domain falls within a certain range.
- the data conversion method is the same as in step S12 of FIG.
- the normalization unit 312 uses the same domain (minimum value z min and maximum value z max ) as in step S12 of FIG.
- Step S23 Statistic calculation process
- the statistic calculation unit 313 calculates the statistic for the data converted in step S22.
- the method of calculating the statistic is the same as in step S13 of FIG.
- the statistic calculation unit 313 sets a set of kernel density estimates f ⁇ h (x) calculated for each label as second data representing statistics used for determining whether or not they are similar.
- Step S24 Statistic transmission process
- Data transmission unit 314 the correspondence between the axes of the previous data and the data after the coordinate system is converted in step S21, the minimum value min of each axis i before being normalized at step S22 (x i) and a maximum value max (x i), and transmits a second data representing a statistic calculated at step S23 in the search apparatus 10.
- the second obtaining section 112 of the retrieval device 10 includes a correspondence between the axes sent, the minimum value min (x i) and a maximum value max (x i), and obtains the second data, the memory 12 Write to.
- the search process of the search device 10 according to the first embodiment (corresponding to the processes of (4) and (5) of FIG. 5) will be described with reference to FIG. (Step S31: Similarity determination process)
- the similarity determination unit 113 targets the first data acquired from one or more transfer source devices 20 by the first acquisition unit 111, and the target first data and the second data acquired by the second acquisition unit 112. Determine if the data is similar. That is, the similarity determination unit 113 is a set of the kernel density estimation amount f ⁇ h (S) (x) which is the first data and a set of the kernel density estimation amount f ⁇ h (T) (x) which is the second data. Determine if and are similar.
- (S) and (T) shown with superscripts are information for distinguishing the transfer source device 20 and the transfer destination device 30, (S) represents the transfer source device 20, and (T) is. Represents the transfer destination device 30.
- the similarity determination unit 113 has a Pearson correlation coefficient for a set of kernel density estimates f ⁇ h (S) (x) and a set of kernel density estimates f ⁇ h (T) (x). Compare the similarity with.
- the similarity determination unit 113 pays attention to the relationship of increase / decrease between the two data and uses the Pearson correlation coefficient. That is, here, the similarity determination unit 113 determines whether or not the first data and the second data are similar based on the similarity of the increase / decrease relationship between the target first data and the second data.
- f ⁇ h (T) (x) corresponding to the label y k is f ⁇ h (T) (x) y_k
- f ⁇ h (S) (x) corresponding to the label y l is f ⁇ h. (T) (x) It is written as y_l.
- Label y l corresponding to the label y k (T) (S) is, score (y k (T) , y l (S)) is the highest.
- the similarity determination unit 113 changes each label y k in the second data while changing the search start point of the label y k (T) in the second data.
- the label yl (S) in the first data having a high correlation coefficient with (T) is sequentially specified.
- the similarity determination unit 113 identifies the label y l (S) in the target first data corresponding to each label y k (T) in the second data.
- the similarity determination unit 113 sets the maximum correlation coefficient between the corresponding label y l and the label y k with respect to the target first data and the second data with respect to the target first data and the second data. Let the similarity be.
- the similarity determination unit 113 may use the average value or the total value of the correlation coefficients between the corresponding label y l and the label y k as the degree of similarity between the target first data and the second data.
- the similarity determination unit 113 sets only the transfer source device 20, which is the acquisition source of the first data having a similarity higher than the threshold value T, as a candidate for the transfer source. Alternatively, the similarity determination unit 113 sorts the first data in descending order of similarity, and sets only the transfer source device 20 from which the first data of the reference pieces having high similarity is acquired as candidates for the transfer source. As a result, the similarity determination unit 113 narrows down the transfer source device 20 that is a candidate for the transfer source.
- step S311 the similarity determination unit 113 sets the score max to 0 as an initial value.
- step S317 the similarity determination unit 113 repeatedly executes the processes from step S312 to step S317 while shifting the variable r by 1 from 0 to q (T) -1.
- q (T) is the number of types of label y (T) in the transfer destination device 30. That is, the label y (T) in the transfer destination device 30 is ⁇ y 0 (T) ,. .. .. , Y q (T) -1 (T) ⁇
- the similarity determination unit 113 uses y r (T) , y 1 + r (T) ,. .. .. , Y (q (T) -1 + r) modq (T) (T) , and the processes from step S312 to step S314 are repeatedly executed.
- the subscripted q (T) means q (T) . That is, in loop 1 and loop 2, the search order is y r (T) , y 1 + r (T) ,. .. ..
- step S312 the similarity determination unit 113 sets an empty set as an initial value in the set of used labels used.
- the similarity determination unit 113 repeatedly executes the process of step S313 while shifting the variable l by 1 from 0 to q (S).
- the similarity determination unit 113 calculates the Pearson correlation coefficient between the label y k (T) of the second data and the label y l (S) of the target first data, and scores (y). Set to k (T) , y l (S)).
- the similarity determination unit 113 among the label y l (S) to which the label y l (S) is not included in the set used, score (y k (T ), y l (S)) is the largest
- the label y l (S) is set to the target label y l (S) .
- the similarity determination unit 113 adds the target label yl (S) to the set used. Further, the similarity determination unit 113 sets a score (y k (T) , y l (S) ) between the label y k (T) to be processed and the target label y l (S). Set to score tpp.
- the similarity determination unit 113 the label y k that is a processing target (T), a set of the object of label y l (S) (y k (T), y l (S)) the set g tmp Add to.
- the label y l (S) corresponding to each label y k (T ) is specified in descending order of the correlation coefficient. .. Then, the highest correlation coefficient among the correlation coefficients between each label y k (T) and the corresponding label y l (S) is set in score tpm. Further, a set of each label y k (T) and the corresponding label y l (S) is set in the set g tmp .
- step S315 the similarity determination unit 113 determines whether or not the score mpp is higher than the score max. Similarity determination unit 113 advances the process to step S316 when score tmp is higher than score max, if score tmp is not higher than the score max, the process proceeds after step S317. In step S316, the similarity determination unit 113 sets the score mp to the score max . In step S317, the similarity determination unit 113 sets the set g tmp to the set g.
- the highest correlation coefficient score tpp among the correlation coefficient score mps specified in all the search orders is set to the correlation coefficient score max.
- this correlation coefficient score max is used as the degree of similarity between the target first data and the second data.
- a set of each label y k (T) specified in the search order in which the correlation coefficient score max is calculated and the corresponding label y l (S) is set in the set g.
- steps S32 to S34 are executed for each of the first data acquired from the transfer source device 20 which is a candidate for the transfer source narrowed down in step S31.
- Step S32 Label mapping generation process
- the mapping generation unit 114 generates a label mapping g indicating the correspondence between the label in the training data that is the source of the first data of the target and the label in the observation data that is the source of the second data. Specifically, the mapping generation unit 114 generates a set g indicating the label y l (S) corresponding to each label y k (T) specified in step S31 as the label mapping g.
- Step S33 Data mapping generation process
- the mapping generation unit 114 generates a data mapping f showing the correspondence between the feature amount vector of the training data that is the source of the first data of the target and the feature amount vector of the observation data that is the source of the second data. .. Specifically, first, the mapping generation unit 114 is the source of the first data of the target based on the correspondence of the axes acquired together with the first data of the target and the correspondence of the axes acquired together with the second data. The correspondence between the feature amount vector of the training data and the feature amount vector of the observation data which is the basis of the second data is specified.
- the correspondence between the feature amount vector of the training data that is the source of the first data of the target and the feature amount vector of the observation data that is the source of the second data is the original coordinate system of the transfer destination device 30 ⁇ the transfer destination. It is specified by specifying the correspondence in the order of the coordinate system after the base conversion of the device 30 ⁇ the coordinate system after the base conversion of the transfer source device 20 ⁇ the original coordinate system of the transfer source device 20.
- the correspondence relationship of the axes acquired together with the first data of the target is the relationship shown in Equation 8
- the correspondence relationship of the axes acquired together with the second data is shown in Equation 9.
- Equation 8 the correspondence relationship of the axes acquired together with the second data
- the mapping generator 114 the minimum value min of the identified and relationship R, each axis i obtained with the first data of the target (x i (S)) and a maximum value max (x i (S)) If, on the basis of the minimum value min (x i (T)) for each axis i acquired together with the second data and a maximum value max (x i (T)) , as shown in Expression 12, generates the data mapping f To do.
- p (T) is the number of dimensions of the feature vector x ⁇ of the observation data that is the source of the second data.
- C is as defined in Equation 1.
- Step S34 Data transmission process
- the data transmission unit 115 is an acquisition source of the label mapping g generated in step S32 for the target first data, the data mapping f generated in step S33 for the target first data, and the target first data.
- the learning model acquired from the transfer source device 20 is transmitted to the transfer destination device 30.
- the data acquisition unit 315 acquires the label map g, the data map f, and the learning model.
- the data acquisition unit 315 sets the label mapping g in the output label conversion unit 318, sets the data mapping f in the input data conversion unit 317, and writes the learning model in the learning model storage unit 331.
- the analysis process of the transfer destination device 30 according to the first embodiment (corresponding to the processes of (6) to (9) of FIG. 5) will be described with reference to FIG.
- the case where there is only one transfer source device 20 that is a candidate for the transfer source narrowed down in step S31 will be described.
- Step S41 Learning model generation process
- the learning model generation unit 316 generates a learning model for the transfer destination device 30.
- the learning model generation unit 316 sets the learning model acquired in step S34 as it is as the learning model for the transfer destination device 30.
- Step S42 Data conversion process
- the input data conversion unit 317 converts the observation data acquired from the sensor 60 by the data mapping f set in step S34.
- the input data conversion unit 317 matches the format of the observed data with the data format of the transfer source device 20 which is a candidate for the transfer source. That is, the format of the observation data is converted into the input format of the learning model acquired from the transfer source device 20.
- the relationship between the observation data of the transfer destination device 30 and each axis is the relationship shown in FIG.
- the input data converting unit 317 in accordance with the correspondence relationship R shown in Equation 11, Equation 13 as shown in, interchanging x 1 (T) is axis x 2 (T) axis, x 2 (T) axis Is replaced with the x 1 (T) axis, and then the scale is converted.
- Step S43 Data input process
- the input data conversion unit 317 inputs the observation data converted in step S42 into the learning model generated in step S41. Then, the output label is output as a result of inference by the learning model.
- Step S44 Output label conversion process
- the output label conversion unit 318 converts the output label output in step S43 by the label mapping g set in step S34. As a result, the output label conversion unit 318 converts the output label into the label of the transfer destination device 30. Then, the output label conversion unit 318 outputs the converted output label as a result inferred from the observation data.
- the training data used when the transfer source device 20 generated the learning model and a small number obtained by the transfer destination device 30 By determining the similarity with the observed data, the transfer source device 20 that is a candidate for the transfer source is narrowed down (Phase 1). After that, the transfer source device 20 to be adopted as the transfer source is automatically or manually extracted from the transfer source device 20 which is a candidate for the transfer source (Phase 2).
- the learning model search system 100 is based on the statistics generated from the training data of the transfer source device 20 and the statistics generated from the observation data of the transfer destination device 30.
- the transfer source device 20 that is a candidate for the transfer source is narrowed down. This makes it possible to identify an appropriate transfer source in a short processing time. As a result, the learning model of the transfer destination device 30 can be generated in a short processing time.
- the learning model search system 100 is obtained by performing a basis conversion of each of the feature quantity vector with the training data and the feature quantity vector of the observation data with reference to the information quantity for each feature axis.
- the transfer source device 20 that is a candidate for the transfer source is narrowed down. The process of determining whether or not the data are similar takes less time than the process of trying learning using the training data of the transfer source. Therefore, an appropriate transfer source can be identified in a short processing time.
- the learning model search system 100 determines whether or not the data obtained by normalizing the scale of the feature amount vector after the feature amount vector is base-transformed is similar. , The transfer source device 20 that is a candidate for the transfer source is narrowed down. As a result, the comparison is made after removing the influence of the scale of the data, and an appropriate judgment can be made.
- the learning model search system 100 determines whether or not the data are similar based on the similarity of the relationship of increase / decrease of the data. As a result, even if the number of data at the transfer destination is smaller than the number of data at the transfer source, an appropriate determination can be made.
- the learning model search system 100 according to the first embodiment, only the first data and the second data, which are statistics, and the learning model of the transfer source device 20 are given to the search device 10. Therefore, for example, even in the case where the search device 10 is realized by a cloud computing server, the training data of the transfer source device 20 is not inferred by the search device 10, and the safety is high.
- step S31 the analysis process of the transfer destination device 30 when there are two or more transfer source devices 20 that are candidates for the transfer source narrowed down in step S31 will be described.
- processing based on the concept of a one-versus-the-rest classifier will be described.
- Step S51 Learning model generation process
- the learning model generation unit 316 generates a learning model acquired from each transfer source device 20 that is a candidate for the transfer source as a weak learning model. Then, the learning model generation unit 316 generates a set of weak learning models as a learning model for the transfer destination device 30. That is, it is considered that the learning model acquired from each transfer source device 20 can identify a part of the label of the transfer destination device 30. Therefore, the learning model generation unit 316 sets the learning model acquired from each transfer source device 20 as a weak learning model, and sets the set of weak learning models as the learning model for the transfer destination device 30.
- Step S52 Learning model selection process
- the input data conversion unit 317 selects one unselected weak learning model among the weak learning models constituting the learning model of the transfer destination device 30 set in step S51 as the target weak learning model.
- the input data conversion unit 317 determines that the observed data cannot be classified when there is no unselected weak learning model.
- Step S53 Input data conversion process
- the input data conversion unit 317 converts the observation data acquired from the sensor 60 by the data mapping f of the transfer source device 20 from which the weak learning model is acquired selected in step S52.
- Step S54 Data input process
- the input data conversion unit 317 inputs the observation data converted in step S53 into the weak learning model selected in step S52. Then, as a result inferred by the learning model, an output label or a result that cannot be inferred is output.
- Step S55 Output determination process
- the input data conversion unit 317 determines whether or not the output label has been output in step S54. When the output label is output, the input data conversion unit 317 proceeds to the process in step S56. On the other hand, when the result that the inference is impossible is output, the input data conversion unit 317 returns the process to step S52 and selects another weak learning model.
- Step S56 Output label conversion process
- the output label conversion unit 318 converts the output label output in step S54 by the label mapping g of the transfer source device 20 from which the weak learning model is acquired selected in step S52.
- the above process is based on the concept of a pair-to-other classifier.
- the present invention is not limited to this, and the processing may be based on the concept of a one-to-one classifier (one-versus-one classifier) or an error correction output code (error selecting output code).
- the transfer source devices 20 that are candidates for the transfer source are narrowed down by a method such as whether or not the similarity is higher than the threshold value.
- a person may finally decide whether or not to make it a candidate for metastasis.
- the search device 10 may display the image data in which the training data is two-dimensionally imaged in step S13 and the image data in which the observation data is two-dimensionally imaged in step S23. Then, by visually comparing the two-dimensional imaged image data with each other, a person may determine whether or not the data are similar. Since it is a comparison between two-dimensional imaged image data, it can be easily performed by a person. For example, two-dimensional imaged image data as shown in FIG. 19 can be obtained. In FIG. 19, the label 9.0 of the transfer destination device 30 and the label 6.0 of the transfer source device 20 are similar, and the label 10.0 of the transfer destination device 30 and the label 9. It can be seen that 0 is similar.
- the Pearson correlation coefficient was used when comparing the statistics.
- image identification techniques may be used when comparing statistics.
- the similarity determination unit 113 extracts feature points from each of the image data in which the training data is two-dimensionally imaged and the image data in which the observation data is two-dimensionally imaged. Then, the similarity determination unit 113 can compare the distance between the feature points in the image data in which the training data is two-dimensionally imaged and the distance between the feature points in the image data in which the observation data is two-dimensionally imaged. Conceivable.
- the transfer source device 20 generates the first data, and then transmits the first data to the search device 10. However, the transfer source device 20 may transmit the training data to the search device 10, and the search device 10 may generate the first data.
- the search device 10 may be provided with functional components of the base conversion unit 211, the normalization unit 212, and the statistic calculation unit 213 included in the transfer source device 20.
- the transfer destination device 30 generates the second data, and then transmits the second data to the search device 10. However, the transfer destination device 30 may transmit the observation data to the search device 10, and the search device 10 may generate the second data.
- the search device 10 may be provided with functional components of the base conversion unit 311, the normalization unit 312, and the statistic calculation unit 313 included in the transfer destination device 30.
- the training data When the training data is transmitted to the search device 10, the training data is leaked to the search device 10.
- the observation data when the training data is transmitted to the search device 10, the observation data is leaked to the search device 10. Therefore, when it is not desired to leak the training data or the observation data to the outside, it is desirable to use the configuration of the first embodiment.
- each functional component is realized by software.
- each functional component may be realized by hardware. The difference between the modified example 5 and the first embodiment will be described.
- the search device 10 When each functional component is realized by hardware, the search device 10 includes an electronic circuit 15 instead of the processor 11, the memory 12, and the storage 13.
- the electronic circuit 15 is a dedicated circuit that realizes the functions of each functional component, the memory 12, and the storage 13.
- the transfer source device 20 includes an electronic circuit 25 instead of the processor 21, the memory 22, and the storage 23.
- the electronic circuit 25 is a dedicated circuit that realizes the functions of each functional component, the memory 22, and the storage 23.
- the transfer destination device 30 includes an electronic circuit 35 instead of the processor 31, the memory 32, and the storage 33.
- the electronic circuit 35 is a dedicated circuit that realizes the functions of each functional component, the memory 32, and the storage 33.
- the electronic circuits 15, 25, and 35 include a single circuit, a composite circuit, a programmed processor, a parallel programmed processor, a logic IC, a GA (Gate Array), an ASIC (Application Specific Integrated Circuit), and an FPGA (Field-Programmable). Gate Array) is assumed.
- each functional component may be realized by one electronic circuit 15, 25, 35, or each functional component may be realized by a plurality of electronic circuits. It may be realized by dispersing it in 15.
- the processors 11,21,31, the memories 12, 22, 32, the storages 13, 23, 33, and the electronic circuits 15, 25, 35 are called processing circuits. That is, the function of each functional component is realized by the processing circuit.
- Embodiment 2 instead of the two-dimensional imaged image data, the probability density estimator for each element z ⁇ i of the vector z ⁇ ⁇ in the m-dimensional principal component space is used as a statistic. Different from. In the second embodiment, these different points will be described, and the same points will be omitted.
- step S13 the statistic calculation unit 213 estimates the probability density function using the kernel density estimation amount f ⁇ h (x) for each element z ⁇ i of the vector z ⁇ ⁇ , as shown in Equation 14.
- z ⁇ i is the total number of data of the i-th principal component axis of the vector z ⁇ ⁇ .
- step S23 similarly to step S13 of FIG. 6, the statistic calculation unit 313 estimates the probability density function using the kernel density estimation amount f ⁇ h (x) for each element z ⁇ i of the vector z ⁇ ⁇ . To do.
- step S31 the similarity determination unit 113 sets the Pearson correlation coefficient weighted by the contribution rate PV i of the element z ⁇ i as the similarity, as shown in Equation 15.
- the similarity determination unit 113 targets each feature axis with respect to the similarity (Pearson correlation coefficient) of the increase / decrease relationship between the first data and the second data for the target feature axis.
- the results obtained by weighting (weighting with the contribution rate PV i ) according to the amount of information on the axes are linearly combined to determine whether or not the first data and the second data are similar.
- the similarity determination process according to the second embodiment will be described with reference to FIG.
- the process of loop 3 is different from the process shown in FIG.
- the processing of loop 4 is executed.
- the similarity determination unit 113 repeatedly executes the process of step S313 while shifting the variable i from 1 to min (m (T) , m (S)) by one.
- the similarity determination unit 113 sets the label y k (T) of the second data and y l (S) of the target first data weighted by the contribution rate PV i (T) of the element z ⁇ i .
- the Pearson correlation coefficient between them is calculated and added to score (y k (T) , y l (S)).
- the learning model search system 100 weights the similarity of each element of the vector by the contribution rate. As a result, the more similar the elements that have an important influence on the output in machine learning are, the higher the similarity is determined, and the more appropriate the determination becomes possible.
- the learning model search system 100 enables appropriate determination by extrapolating (probability density estimation) for each vector element.
- the kernel density estimate is used to estimate the probability density function.
- algorithms using linear interpolation techniques such as linear or linear extrapolation with less computational complexity may be used. If it is not necessary to consider covariate shifts and class balance changes, such as when data within the assumed definition range can be collected evenly, linear interpolation or polynomial interpolation may be used instead of extrapolation.
- Embodiment 3 is different from the second embodiment in that a statistical hypothesis test is used for each element z ⁇ i of the vector z ⁇ ⁇ in the m-dimensional principal component space. In the third embodiment, these different points will be described, and the same points will be omitted.
- step S13 the statistic calculation unit 213 does not calculate the statistic.
- the statistic calculation unit 213 performs outliers or noise removal and data interpolation or extrapolation in order to suppress a decrease in test accuracy in the statistical hypothesis test.
- step S23 as in step S13 of FIG. 6, the statistic calculation unit 313 performs outlier or noise removal and data interpolation or extrapolation in order to suppress a decrease in test accuracy in the statistical hypothesis test. I do.
- the similarity determination unit 113 calculates the degree of similarity by statistical hypothesis testing.
- the null hypothesis H 0 and the alternative hypothesis H 1 are defined, and H 1 is adopted by rejecting H 0.
- the similarity determination unit 113 defines the case where H 0 is rejected as 0 and the case where it cannot be rejected as 1, and binarizes the test result.
- H 0 is not adopted even if the test result is 1.
- (z ⁇ i (T) ) y_k , (z ⁇ i (S) ) y_l are used.
- the similarity determination unit 113 calculates the degree of similarity by weighting the test result with the contribution rate PV i, as in the second embodiment.
- Test is a binarized value of the test result.
- the similarity determination unit 113 specifies the similarity between the first data and the second data for each feature axis by statistical hypothesis testing. Then, the similarity determination unit 113 linearly combines the results obtained by weighting the specified similarity according to the amount of information of the target feature axis, and the first data and the second data are similar. Determine whether or not to do so.
- step S313 The similarity determination process according to the third embodiment will be described with reference to FIG.
- the process in step S313 is different from that in FIG.
- step S313 the similarity determination unit 113, statistical hypothesis between the label y k (T) corresponding to the element z ⁇ i (T) with the label y l elements corresponding to (S) z ⁇ i (S )
- the test result of the test is weighted by the contribution rate PV i (T) of the element z ⁇ i and added to the score (y k (T) , y l (S)).
- the data may correspond to each other or that a certain distribution such as a normal distribution is followed. In such a case, a parametric test may be used.
- the learning model search system 100 determines whether or not they are similar by statistical hypothesis testing. As a result, the similarity of the population of the input sample, not the input sample, can be strictly determined, so that an appropriate determination can be made.
- the learning model search system 100 performs a statistical hypothesis test using the vector z ⁇ ⁇ obtained by performing the basis conversion and normalization. As a result, the test can be performed for each element of the input vector, so that the existing low-dimensional statistical hypothesis test method can be used even for the high-dimensional input vector.
- Embodiment 4 is different from the first embodiment in that the cosine similarity of the average vector of the vector z ⁇ ⁇ in the m-dimensional principal component space is used as a statistic instead of the two-dimensional imaged image data.
- these different points will be described, and the same points will be omitted.
- step S13 statistic calculation unit 213, as shown in Equation 17, the arithmetic mean vector z ⁇ ⁇ as the representative value of the vector z ⁇ ⁇ - calculated.
- is the total number (N y_x ) of the feature vector z ⁇ .
- step S23 similarly to step S13 in FIG. 6, statistic calculation unit 313, the arithmetic mean vector z ⁇ ⁇ as the representative value of the vector z ⁇ ⁇ - calculated.
- the similarity determination unit 113 calculates the cosine similarity between the arithmetic mean vector z ⁇ ⁇ ⁇ (T) and the arithmetic mean vector z ⁇ ⁇ ⁇ (S), as shown in Equation 18.
- the similarity determination unit 113 calculates representative values for the first data and the second data, and determines whether or not the first data and the second data are similar based on the representative values.
- the similarity determination unit 113 calculates whether or not the first data and the second data are similar by calculating the cosine similarity between the representative value of the first data and the representative value of the second data. judge.
- step S313 the process in step S313 is different from the process shown in FIG.
- the similarity determination unit 113 calculates the cosine similarity between the arithmetic mean vector z ⁇ ⁇ ⁇ (T) and the arithmetic mean vector z ⁇ ⁇ ⁇ (S), and score (y k (T)). , Y l (S) ).
- the learning model search system 100 determines whether or not they are similar based on the cosine similarity of the average vector of the vector z ⁇ ⁇ . As a result, it is possible to determine whether or not they are similar by one comparison regardless of the number of input samples, so that the search speed can be maintained constant.
- Equation 19 the vector shown in Equation 19 is referred to as z ⁇ in the text.
- the normalized vector shown in Equation 20 is expressed as z ⁇ ⁇ in the text.
- the arithmetic mean vector shown in Equation 21 is expressed as z ⁇ ⁇ -.
- x_y when it is described as x_y in the text, it means xy.
- 100 learning model search system 10 search device, 11 processor, 12 memory, 13 storage, 14 communication interface, 15 electronic circuit, 111 1st acquisition unit, 112 2nd acquisition unit, 113 similarity judgment unit, 114 mapping generation unit, 115 Data transmission unit, 131 learning model storage unit, 132 statistics storage unit, 20 transfer source device, 21 processor, 22 memory, 23 storage, 24 communication interface, 25 electronic circuit, 211 base conversion unit, 212 normalization unit, 213 statistics Quantity calculation unit, 214 data transmission unit, 231 learning model storage unit, 232 training data storage unit, 30 transfer destination device, 31 processor, 32 memory, 33 storage, 34 communication interface, 35 electronic circuit, 311 base conversion unit, 312 regular Chemical unit, 313 Statistics calculation unit, 314 data transmission unit, 315 data acquisition unit, 316 learning model generation unit, 317 input data conversion unit, 318 output label conversion unit, 40 transmission lines, 50 sensors, 60 sensors.
Landscapes
- Engineering & Computer Science (AREA)
- Theoretical Computer Science (AREA)
- Software Systems (AREA)
- General Engineering & Computer Science (AREA)
- Data Mining & Analysis (AREA)
- General Physics & Mathematics (AREA)
- Physics & Mathematics (AREA)
- Databases & Information Systems (AREA)
- Evolutionary Computation (AREA)
- Computing Systems (AREA)
- Medical Informatics (AREA)
- Mathematical Physics (AREA)
- Computer Vision & Pattern Recognition (AREA)
- Artificial Intelligence (AREA)
- Computational Linguistics (AREA)
- Information Retrieval, Db Structures And Fs Structures Therefor (AREA)
- Image Analysis (AREA)
Abstract
検索装置(10)は、転移元装置(20)における特徴量ベクトルを、特徴軸毎の情報量を基準として基底変換して得られた第1データを取得する。また、検索装置(10)は、転移先装置(30)における特徴量ベクトルを、特徴軸毎の情報量を基準として基底変換して得られた第2データを取得する。検索装置(10)は、第1データと第2データとが類似するか否かを判定することにより、転移元装置(20)が転送元として相応しいか否かを判定する。
Description
この発明は、転移学習における転移元の検索技術に関する。
IoT(Internet of Things)機器上でAI(Artificial Intelligence)を利用するソリューションが増加している。例えば、以下のようなアプリケーションが挙げられる。(1)空調及び照明といったIoT家電の制御、(2)製造装置の故障診断、(3)製造ラインにおける製品の画像による検品、(4)ビル等の入門時の動画による不審者侵入検知、(4)EMS(エネルギーマネジメントシステム)におけるエネルギー需要予測、(5)プラントの故障診断。
IoT機器毎にAIを利用する場合、学習処理に用いる十分な数の訓練データを確保することが困難になる。そこで、少ない訓練データで効率的に学習を行う必要がある。少ない訓練データで学習する方法として、訓練データが収集された環境とは異なる環境の訓練データ及び学習モデルを転移させる、転移学習と呼ばれる方法がある。
転移学習では、転移元を特定するために、転移元の全データに対して転移元になり得るかを1つずつ評価する。評価の結果、転移が有効であることを示す「正の転移」であることを確認できた場合、転移元データとして決定する。この評価は、自動で行うことが望ましいが、何らかの形で人手が関わることがある。
転移学習では、転移元を特定するために、転移元の全データに対して転移元になり得るかを1つずつ評価する。評価の結果、転移が有効であることを示す「正の転移」であることを確認できた場合、転移元データとして決定する。この評価は、自動で行うことが望ましいが、何らかの形で人手が関わることがある。
特許文献1には、転移元になり得るかを評価する技術について記載されている。具体的には、特許文献1には、転移元の訓練データを用いて学習を試行し、転移先のデータを入力とした推論結果と転移元のデータを入力とした推論結果との違いを利用して転移の有効性を判定することが記載されている。
特許文献1に記載された技術では、転移元になり得るかを評価する際、転移元の訓練データを用いて学習を試行せねばならず、転移元の探索空間が大きい場合は、処理時間を要してしまう。
この発明は、短い処理時間で適切な転移元を特定可能にすることを目的とする。
この発明は、短い処理時間で適切な転移元を特定可能にすることを目的とする。
この発明に係る検索装置は、
転移元装置における特徴量ベクトルを、特徴軸毎の情報量を基準として基底変換して得られた第1データを取得する第1取得部と、
転移先装置における特徴量ベクトルを、特徴軸毎の情報量を基準として基底変換して得られた第2データを取得する第2取得部と、
前記第1取得部によって取得された前記第1データと、前記第2取得部によって取得された前記第2データとが類似するか否かを判定する類似判定部と
を備える。
転移元装置における特徴量ベクトルを、特徴軸毎の情報量を基準として基底変換して得られた第1データを取得する第1取得部と、
転移先装置における特徴量ベクトルを、特徴軸毎の情報量を基準として基底変換して得られた第2データを取得する第2取得部と、
前記第1取得部によって取得された前記第1データと、前記第2取得部によって取得された前記第2データとが類似するか否かを判定する類似判定部と
を備える。
この発明では、特徴量ベクトルを特徴軸毎の情報量を基準として基底変換して得られたデータが類似するか否かを判定する。データが類似するか否かにより、転移元になり得るかを評価することが可能である。データが類似するか否かを判定する処理は、転移元の訓練データを用いて学習を試行する処理に比べ処理時間がかからない。したがって、短い処理時間で適切な転移元を特定可能になる。
実施の形態1.
***構成の説明***
図1を参照して、実施の形態1に係る学習モデル検索システム100の構成を説明する。
学習モデル検索システム100は、検索装置10と、1つ以上の転移元装置20と、転移先装置30とを備える。検索装置10と転移元装置20と転移先装置30とは、インターネットといった伝送路40を介して接続されている。
各転移元装置20には、1つ以上のセンサ50が接続されている。転移先装置30には、1つ以上のセンサ60が接続されている。
***構成の説明***
図1を参照して、実施の形態1に係る学習モデル検索システム100の構成を説明する。
学習モデル検索システム100は、検索装置10と、1つ以上の転移元装置20と、転移先装置30とを備える。検索装置10と転移元装置20と転移先装置30とは、インターネットといった伝送路40を介して接続されている。
各転移元装置20には、1つ以上のセンサ50が接続されている。転移先装置30には、1つ以上のセンサ60が接続されている。
図2を参照して、実施の形態1に係る検索装置10の構成を説明する。
検索装置10は、クラウドコンピューティングにおけるサーバといったコンピュータである。
検索装置10は、コンピュータである。
検索装置10は、プロセッサ11と、メモリ12と、ストレージ13と、通信インタフェース14とのハードウェアを備える。プロセッサ11は、信号線を介して他のハードウェアと接続され、これら他のハードウェアを制御する。
検索装置10は、クラウドコンピューティングにおけるサーバといったコンピュータである。
検索装置10は、コンピュータである。
検索装置10は、プロセッサ11と、メモリ12と、ストレージ13と、通信インタフェース14とのハードウェアを備える。プロセッサ11は、信号線を介して他のハードウェアと接続され、これら他のハードウェアを制御する。
検索装置10は、機能構成要素として、第1取得部111と、第2取得部112と、類似判定部113と、写像生成部114と、データ送信部115とを備える。検索装置10の各機能構成要素の機能はソフトウェアにより実現される。
ストレージ13には、検索装置10の各機能構成要素の機能を実現するプログラムが格納されている。このプログラムは、プロセッサ11によりメモリ12に読み込まれ、プロセッサ11によって実行される。これにより、検索装置10の各機能構成要素の機能が実現される。
ストレージ13には、検索装置10の各機能構成要素の機能を実現するプログラムが格納されている。このプログラムは、プロセッサ11によりメモリ12に読み込まれ、プロセッサ11によって実行される。これにより、検索装置10の各機能構成要素の機能が実現される。
また、ストレージ13は、学習モデル記憶部131と、統計量記憶部132とを実現する。
図3を参照して、実施の形態1に係る転移元装置20の構成を説明する。
転移元装置20は、IoT機器といったコンピュータである。
転移元装置20は、プロセッサ21と、メモリ22と、ストレージ23と、通信インタフェース24とのハードウェアを備える。プロセッサ21は、信号線を介して他のハードウェアと接続され、これら他のハードウェアを制御する。
転移元装置20は、IoT機器といったコンピュータである。
転移元装置20は、プロセッサ21と、メモリ22と、ストレージ23と、通信インタフェース24とのハードウェアを備える。プロセッサ21は、信号線を介して他のハードウェアと接続され、これら他のハードウェアを制御する。
転移元装置20は、機能構成要素として、基底変換部211と、正規化部212と、統計量計算部213と、データ送信部214とを備える。転移元装置20の各機能構成要素の機能はソフトウェアにより実現される。
ストレージ23には、転移元装置20の各機能構成要素の機能を実現するプログラムが格納されている。このプログラムは、プロセッサ21によりメモリ22に読み込まれ、プロセッサ21によって実行される。これにより、転移元装置20の各機能構成要素の機能が実現される。
ストレージ23には、転移元装置20の各機能構成要素の機能を実現するプログラムが格納されている。このプログラムは、プロセッサ21によりメモリ22に読み込まれ、プロセッサ21によって実行される。これにより、転移元装置20の各機能構成要素の機能が実現される。
また、ストレージ23は、学習モデル記憶部231と、訓練データ記憶部232とを実現する。
図4を参照して、実施の形態1に係る転移先装置30の構成を説明する。
転移先装置30は、IoT機器といったコンピュータである。
転移先装置30は、プロセッサ31と、メモリ32と、ストレージ33と、通信インタフェース34とのハードウェアを備える。プロセッサ31は、信号線を介して他のハードウェアと接続され、これら他のハードウェアを制御する。
転移先装置30は、IoT機器といったコンピュータである。
転移先装置30は、プロセッサ31と、メモリ32と、ストレージ33と、通信インタフェース34とのハードウェアを備える。プロセッサ31は、信号線を介して他のハードウェアと接続され、これら他のハードウェアを制御する。
転移先装置30は、機能構成要素として、基底変換部311と、正規化部312と、統計量計算部313と、データ送信部314と、データ取得部315と、学習モデル生成部316と、入力データ変換部317と、出力ラベル変換部318とを備える。転移先装置30の各機能構成要素の機能はソフトウェアにより実現される。
ストレージ33には、転移先装置30の各機能構成要素の機能を実現するプログラムが格納されている。このプログラムは、プロセッサ31によりメモリ32に読み込まれ、プロセッサ31によって実行される。これにより、転移先装置30の各機能構成要素の機能が実現される。
ストレージ33には、転移先装置30の各機能構成要素の機能を実現するプログラムが格納されている。このプログラムは、プロセッサ31によりメモリ32に読み込まれ、プロセッサ31によって実行される。これにより、転移先装置30の各機能構成要素の機能が実現される。
また、ストレージ33は、学習モデル記憶部331と、観測データ記憶部332とを実現する。
プロセッサ11,21,31は、プロセッシングを行うIC(Integrated Circuit)である。プロセッサ11,21,31は、具体例としては、CPU(Central Processing Unit)、DSP(Digital Signal Processor)、GPU(Graphics Processing Unit)である。
メモリ12,22,32は、データを一時的に記憶する記憶装置である。メモリ12,22,32は、具体例としては、SRAM(Static Random Access Memory)、DRAM(Dynamic Random Access Memory)である。
ストレージ13,23,33は、データを保管する記憶装置である。ストレージ13,23,33は、具体例としては、HDD(Hard Disk Drive)である。また、ストレージ13,23,33は、SD(登録商標,Secure Digital)メモリカード、CF(CompactFlash,登録商標)、NANDフラッシュ、フレキシブルディスク、光ディスク、コンパクトディスク、ブルーレイ(登録商標)ディスク、DVD(Digital Versatile Disk)といった可搬記録媒体であってもよい。
通信インタフェース14,24,34は、外部の装置と通信するためのインタフェースである。通信インタフェース14,24,34は、具体例としては、Ethernet(登録商標)、USB(Universal Serial Bus)、HDMI(登録商標,High-Definition Multimedia Interface)のポートである。
***動作の説明***
図5から図16を参照して、実施の形態1に係る学習モデル検索システム100の動作を説明する。
実施の形態1に係る学習モデル検索システム100の検索装置10の動作手順は、実施の形態1に係る検索方法に相当する。また、実施の形態1に係る学習モデル検索システム100の検索装置10の動作を実現するプログラムは、実施の形態1に係る検索プログラムに相当する。
図5から図16を参照して、実施の形態1に係る学習モデル検索システム100の動作を説明する。
実施の形態1に係る学習モデル検索システム100の検索装置10の動作手順は、実施の形態1に係る検索方法に相当する。また、実施の形態1に係る学習モデル検索システム100の検索装置10の動作を実現するプログラムは、実施の形態1に係る検索プログラムに相当する。
図5を参照して、実施の形態1に係る学習モデル検索システム100の全体的な処理について説明する。
(1)各転移元装置20は、訓練データから類似性の比較に必要な統計量とを生成する。訓練データは、各転移元装置20がセンサ50から取得したデータに対して教師データ(ラベル)の付与を行い生成されたデータである。(2)各転移元装置20は、学習モデルと統計量とを検索装置10に送信する。(3)転移先装置30は、観測データから類似性の比較に必要な統計量を生成し、検索装置10に送信する。観測データは、転移先装置30がセンサ60から取得したデータに対して教師データ(ラベル)の付与を行い生成されたデータである。
(4)検索装置10は、各転移元装置20によって生成された統計量と、転移先装置30によって生成された統計量とが類似するか否か判定する。これにより、検索装置10は、転送元の候補になる転移元装置20を特定する。(5)検索装置10は、転移元の候補になる転移元装置20について、データ写像f及びラベル写像gを生成する。データ写像fは、転移先から転移元への入力変換である。ラベル写像gは、転移元から転移先への出力変換である。
(6)転移先装置30は、転移元の候補になった転移元装置20の学習モデルを入力とし、転移先装置30の学習器を生成する。(7)転移先装置30は、観測データをデータ写像fで変換した後、生成された学習器に入力する。(8)転移先装置30は、学習器から出力されたラベルをラベル写像gで変換する。(9)転移先装置30は、変換されたラベルを出力する。
(1)各転移元装置20は、訓練データから類似性の比較に必要な統計量とを生成する。訓練データは、各転移元装置20がセンサ50から取得したデータに対して教師データ(ラベル)の付与を行い生成されたデータである。(2)各転移元装置20は、学習モデルと統計量とを検索装置10に送信する。(3)転移先装置30は、観測データから類似性の比較に必要な統計量を生成し、検索装置10に送信する。観測データは、転移先装置30がセンサ60から取得したデータに対して教師データ(ラベル)の付与を行い生成されたデータである。
(4)検索装置10は、各転移元装置20によって生成された統計量と、転移先装置30によって生成された統計量とが類似するか否か判定する。これにより、検索装置10は、転送元の候補になる転移元装置20を特定する。(5)検索装置10は、転移元の候補になる転移元装置20について、データ写像f及びラベル写像gを生成する。データ写像fは、転移先から転移元への入力変換である。ラベル写像gは、転移元から転移先への出力変換である。
(6)転移先装置30は、転移元の候補になった転移元装置20の学習モデルを入力とし、転移先装置30の学習器を生成する。(7)転移先装置30は、観測データをデータ写像fで変換した後、生成された学習器に入力する。(8)転移先装置30は、学習器から出力されたラベルをラベル写像gで変換する。(9)転移先装置30は、変換されたラベルを出力する。
図6を参照して、実施の形態1に係る転移元装置20の第1データ送信処理(図5の(1)(2)の処理に相当)を説明する。
(ステップS11:基底変換処理)
基底変換部211は、訓練データ記憶部232に記憶された訓練データの特徴量ベクトルの座標系を変換する。訓練データの特徴量ベクトルは、訓練データからラベルを除いたデータである。この処理は、転移元装置20の訓練データの特徴量ベクトルの分布と、転移先装置30の観測データの特徴量ベクトルの分布とを比較するために、座標系を揃える処理である。
具体的には、基底変換部211は、特徴量ベクトルを、特徴軸毎の情報量を基準として基底変換する。ここでは、図7に示すように、基底変換部211は、主成分分析を用いて、特徴量ベクトルの各要素の情報量が大きい特徴軸から順にベクトルz→の要素ziを割り当てることにより、正規直交基底を得る。ここで、情報量は、分散値又は固有値と言い換えることができる。図7では、最も情報量が大きい特徴軸に基底要素z1が割り当てられ、次に情報量が大きい特徴軸に要素z2が割り当てられている。つまり、基底変換部211は、p次元ユークリッド空間Rp上の特徴量ベクトルx→を、m次元主成分空間Zm上のベクトルz→に変換する。
ここで、ベクトルz→の第i主成分を要素zi、要素ziの寄与率をPVi、累積寄与率をCPVmと表記する。この変換により、主成分同士が無相関化される。ベクトルz→の次元数をmとすると、1≦m≦p,0<CPVm≦1を満たす。特に、m<pの場合、次元削減と呼ばれる。主成分分析により、転移元装置20及び転移先装置30の特徴量ベクトル空間の軸が寄与率の降順にソートされる。
(ステップS11:基底変換処理)
基底変換部211は、訓練データ記憶部232に記憶された訓練データの特徴量ベクトルの座標系を変換する。訓練データの特徴量ベクトルは、訓練データからラベルを除いたデータである。この処理は、転移元装置20の訓練データの特徴量ベクトルの分布と、転移先装置30の観測データの特徴量ベクトルの分布とを比較するために、座標系を揃える処理である。
具体的には、基底変換部211は、特徴量ベクトルを、特徴軸毎の情報量を基準として基底変換する。ここでは、図7に示すように、基底変換部211は、主成分分析を用いて、特徴量ベクトルの各要素の情報量が大きい特徴軸から順にベクトルz→の要素ziを割り当てることにより、正規直交基底を得る。ここで、情報量は、分散値又は固有値と言い換えることができる。図7では、最も情報量が大きい特徴軸に基底要素z1が割り当てられ、次に情報量が大きい特徴軸に要素z2が割り当てられている。つまり、基底変換部211は、p次元ユークリッド空間Rp上の特徴量ベクトルx→を、m次元主成分空間Zm上のベクトルz→に変換する。
ここで、ベクトルz→の第i主成分を要素zi、要素ziの寄与率をPVi、累積寄与率をCPVmと表記する。この変換により、主成分同士が無相関化される。ベクトルz→の次元数をmとすると、1≦m≦p,0<CPVm≦1を満たす。特に、m<pの場合、次元削減と呼ばれる。主成分分析により、転移元装置20及び転移先装置30の特徴量ベクトル空間の軸が寄与率の降順にソートされる。
(ステップS12:正規化処理)
正規化部212は、ステップS11で座標系が変換された後のベクトルz→を、定義域が一定の範囲に収まるように変換する。この処理は、転移元装置20の訓練データの特徴量ベクトルの分布と、転移先装置30の観測データの特徴量ベクトルの分布とをスケールにとらわれずに比較をするために、特徴量ベクトルを正規化する処理である。
具体的には、図8に示すように、正規化部212は、ベクトルz→の要素ziのスケールをzmin≦zi≦zmaxとなるよう、数1により正規化する。ベクトルz→を正規化したベクトルをz^→と表記する。

正規化部212は、ステップS11で座標系が変換された後のベクトルz→を、定義域が一定の範囲に収まるように変換する。この処理は、転移元装置20の訓練データの特徴量ベクトルの分布と、転移先装置30の観測データの特徴量ベクトルの分布とをスケールにとらわれずに比較をするために、特徴量ベクトルを正規化する処理である。
具体的には、図8に示すように、正規化部212は、ベクトルz→の要素ziのスケールをzmin≦zi≦zmaxとなるよう、数1により正規化する。ベクトルz→を正規化したベクトルをz^→と表記する。
(ステップS13:統計量計算処理)
統計量計算部213は、ステップS12で変換されたデータに対して統計量を計算する。この処理は、転移元装置20の訓練データの特徴量ベクトルの分布と、転移先装置30の観測データの特徴量ベクトルの分布とを比較する際に使用する統計量を計算する処理である。
統計量計算部213は、ステップS12で変換されたデータに対して統計量を計算する。この処理は、転移元装置20の訓練データの特徴量ベクトルの分布と、転移先装置30の観測データの特徴量ベクトルの分布とを比較する際に使用する統計量を計算する処理である。
具体的には、まず、統計量計算部213は、正規化されたベクトルz^→を2次元画像化する。図9に示すように、統計量計算部213は、この処理を、ラベルyk毎の正規化されたベクトルz^→に対して実行する。なお、MDS(多次元尺度構成法)と、SOM(自己組織化写像)と、t-SNE(t-distributed Stochastic Neighbor Embedding)といったデータ可視化(次元削減)の技術が存在する。しかし、データ数を変化させると、出力画像の様相が大きく異なる場合がある。この場合、正常に類似性を判定することができない恐れがある。
そこで、統計量計算部213は、正規化されたベクトルz^→を以下の手順で2次元画像化する。ここでは、正規化されたベクトルz^→は、zmin=0,zmax=255で正規化されているとする。
まず、統計量計算部213は、数2に示すように、正規化されたベクトルz^→ y_kの天井関数を計算して8ビットに量子化する。ここで、y_kは、ykを意味する。以下同様に、i_jは、iの下付きとしてjが付されたijを意味する。

次に、統計量計算部213は、量子化されたデータに対して寄与率PVで重み付けしたグレースケール画像に変換する。グレースケール画像は,ユニットUと呼ぶ小さな領域の集合からなる。i行j列のユニットをU(i,j)と表記する。すると、図10に示すように、ユニットU(i,j)の画素値は数3に示すように正規化されたベクトルz^→の要素z^jの天井関数を計算した値になり、高さは1になり、幅wjは数4に示す値になる。


以降、グレースケール画像のi行j列の画素値をgi,j∈G(1≦i≦N,1≦j≦Σj=1
mwj)と表記する。ここで、図9に示すように、Nは、ラベル毎の特徴量ベクトル数である。図9では、例えば、Ny_1は、ラベルy1の特徴量ベクトル数なので10になっている。
そこで、統計量計算部213は、正規化されたベクトルz^→を以下の手順で2次元画像化する。ここでは、正規化されたベクトルz^→は、zmin=0,zmax=255で正規化されているとする。
まず、統計量計算部213は、数2に示すように、正規化されたベクトルz^→ y_kの天井関数を計算して8ビットに量子化する。ここで、y_kは、ykを意味する。以下同様に、i_jは、iの下付きとしてjが付されたijを意味する。
次に、統計量計算部213は、転移元装置20と転移先装置30との画素値の集合Gが類似しているか否かの判定を容易にするために、各ラベルについてヒストグラムを計算する。但し、特徴量ベクトルから生成されたヒストグラムは、本来の母集団の特徴を反映していない可能性がある。そこで、統計量計算部213は、母集団の確率密度関数の推定を行う。ここでは、集合Gを母集団の標本としてカーネル密度推定量f^h(x)を数5により定義する。

数5において、|G|は画素数であり、hは平滑化パラメータであるバンド幅であり、Kはカーネル関数である。
統計量計算部213は、各ラベルについて計算されたカーネル密度推定量f^h(x)の集合を、類似しているか否かの判定に用いられる統計量を表す第1データに設定する。
統計量計算部213は、各ラベルについて計算されたカーネル密度推定量f^h(x)の集合を、類似しているか否かの判定に用いられる統計量を表す第1データに設定する。
(ステップS14:統計量送信処理)
データ送信部214は、ステップS11で座標系が変換された前のデータと後のデータとの軸の対応関係と、ステップS12で正規化される前の各軸iの最小値min(xi)及び最大値max(xi)と、ステップS13で計算された統計量を表す第1データとを検索装置10に送信する。すると、検索装置10の第1取得部111は、送信された軸の対応関係と、最小値min(xi)及び最大値max(xi)と、第1データとを取得して、統計量記憶部132に書き込む。
図11に示すように、軸の対応関係は、軸の大小関係から特定される。図11の場合には、軸の対応関係は、数6に示すように表される。

データ送信部214は、ステップS11で座標系が変換された前のデータと後のデータとの軸の対応関係と、ステップS12で正規化される前の各軸iの最小値min(xi)及び最大値max(xi)と、ステップS13で計算された統計量を表す第1データとを検索装置10に送信する。すると、検索装置10の第1取得部111は、送信された軸の対応関係と、最小値min(xi)及び最大値max(xi)と、第1データとを取得して、統計量記憶部132に書き込む。
図11に示すように、軸の対応関係は、軸の大小関係から特定される。図11の場合には、軸の対応関係は、数6に示すように表される。
(ステップS15:学習モデル送信処理)
データ送信部214は、訓練データ記憶部232に記憶された訓練データから生成された学習モデルを学習モデル記憶部231から読み出して、検索装置10に送信する。すると、検索装置10の第1取得部111は、送信された学習モデルを、ステップS14で送信された第1データと関連付けて、学習モデル記憶部131に書き込む。
データ送信部214は、訓練データ記憶部232に記憶された訓練データから生成された学習モデルを学習モデル記憶部231から読み出して、検索装置10に送信する。すると、検索装置10の第1取得部111は、送信された学習モデルを、ステップS14で送信された第1データと関連付けて、学習モデル記憶部131に書き込む。
図12を参照して、実施の形態1に係る転移先装置30の第2データ送信処理(図5の(3)の処理に相当)を説明する。
(ステップS21:基底変換処理)
基底変換部311は、観測データ記憶部332に記憶された観測データの特徴量ベクトルの座標系を変換する。座標系の変換方法は、図6のステップS11と同じである。
(ステップS21:基底変換処理)
基底変換部311は、観測データ記憶部332に記憶された観測データの特徴量ベクトルの座標系を変換する。座標系の変換方法は、図6のステップS11と同じである。
(ステップS22:正規化処理)
正規化部312は、ステップS21で座標系が変換された後のベクトルz→を、定義域が一定の範囲に収まるように変換する。データの変換方法は、図6のステップS12と同じである。なお、正規化部312は、図6のステップS12と同じ定義域(最小値zmin及び最大値zmax)を用いる。
正規化部312は、ステップS21で座標系が変換された後のベクトルz→を、定義域が一定の範囲に収まるように変換する。データの変換方法は、図6のステップS12と同じである。なお、正規化部312は、図6のステップS12と同じ定義域(最小値zmin及び最大値zmax)を用いる。
(ステップS23:統計量計算処理)
統計量計算部313は、ステップS22で変換されたデータに対して統計量を計算する。統計量の計算方法は、図6のステップS13と同じである。統計量計算部313は、各ラベルについて計算されたカーネル密度推定量f^h(x)の集合を、類似しているか否かの判定に用いられる統計量を表す第2データに設定する。
統計量計算部313は、ステップS22で変換されたデータに対して統計量を計算する。統計量の計算方法は、図6のステップS13と同じである。統計量計算部313は、各ラベルについて計算されたカーネル密度推定量f^h(x)の集合を、類似しているか否かの判定に用いられる統計量を表す第2データに設定する。
(ステップS24:統計量送信処理)
データ送信部314は、ステップS21で座標系が変換された前のデータと後のデータとの軸の対応関係と、ステップS22で正規化される前の各軸iの最小値min(xi)及び最大値max(xi)と、ステップS23で計算された統計量を表す第2データとを検索装置10に送信する。すると、検索装置10の第2取得部112は、送信された軸の対応関係と、最小値min(xi)及び最大値max(xi)と、第2データとを取得して、メモリ12に書き込む。
データ送信部314は、ステップS21で座標系が変換された前のデータと後のデータとの軸の対応関係と、ステップS22で正規化される前の各軸iの最小値min(xi)及び最大値max(xi)と、ステップS23で計算された統計量を表す第2データとを検索装置10に送信する。すると、検索装置10の第2取得部112は、送信された軸の対応関係と、最小値min(xi)及び最大値max(xi)と、第2データとを取得して、メモリ12に書き込む。
図13を参照して、実施の形態1に係る検索装置10の検索処理(図5の(4)(5)の処理に相当)を説明する。
(ステップS31:類似判定処理)
類似判定部113は、第1取得部111によって1つ以上の転移元装置20から取得された第1データそれぞれを対象として、対象の第1データと、第2取得部112によって取得された第2データとが類似するか否かを判定する。つまり、類似判定部113は、第1データであるカーネル密度推定量f^h (S)(x)の集合と、第2データであるカーネル密度推定量f^h (T)(x)の集合とが類似するか否かを判定する。ここで、上付きで示された(S)(T)は転移元装置20と転移先装置30とを区別するための情報であり、(S)は転移元装置20を表し、(T)は転移先装置30を表す。
具体的には、類似判定部113は、カーネル密度推定量f^h (S)(x)の集合と、カーネル密度推定量f^h (T)(x)の集合とについて、ピアソン相関係数による類似度比較を行う。なお、非特許文献「杉山 将, 山田 誠, ドゥ・プレシ マーティヌス・クリストフェル, リウ ソン:非定常環境下での学習:共変量シフト適応,クラスバランス変化適応,変化検知, 日本統計学会誌, vol.44, no.1, pp.113-136(2014).」には、類似度の評価にカルバック・ライブラー距離、ピアソン距離、又はL2距離を用いる方法が記載されている。しかし、IoTでの転移を考える場合、転移先のデータ数が転移元のデータ数に比べ少ない状況(Ny_i (T)<Ny_j (S))が多いと考えられる。そのため、各画素値に対する出現頻度分布に差異が生じ、前述の距離では、類似性を正しく判断できない。そこで、ここでは、類似判定部113は、2データ間の増減の関係に着目し、ピアソン相関係数を使用する。つまり、ここでは、類似判定部113は、対象の第1データと第2データとの増減の関係の類似性に基づき、第1データと第2データとが類似するか否かを判定する。
(ステップS31:類似判定処理)
類似判定部113は、第1取得部111によって1つ以上の転移元装置20から取得された第1データそれぞれを対象として、対象の第1データと、第2取得部112によって取得された第2データとが類似するか否かを判定する。つまり、類似判定部113は、第1データであるカーネル密度推定量f^h (S)(x)の集合と、第2データであるカーネル密度推定量f^h (T)(x)の集合とが類似するか否かを判定する。ここで、上付きで示された(S)(T)は転移元装置20と転移先装置30とを区別するための情報であり、(S)は転移元装置20を表し、(T)は転移先装置30を表す。
具体的には、類似判定部113は、カーネル密度推定量f^h (S)(x)の集合と、カーネル密度推定量f^h (T)(x)の集合とについて、ピアソン相関係数による類似度比較を行う。なお、非特許文献「杉山 将, 山田 誠, ドゥ・プレシ マーティヌス・クリストフェル, リウ ソン:非定常環境下での学習:共変量シフト適応,クラスバランス変化適応,変化検知, 日本統計学会誌, vol.44, no.1, pp.113-136(2014).」には、類似度の評価にカルバック・ライブラー距離、ピアソン距離、又はL2距離を用いる方法が記載されている。しかし、IoTでの転移を考える場合、転移先のデータ数が転移元のデータ数に比べ少ない状況(Ny_i (T)<Ny_j (S))が多いと考えられる。そのため、各画素値に対する出現頻度分布に差異が生じ、前述の距離では、類似性を正しく判断できない。そこで、ここでは、類似判定部113は、2データ間の増減の関係に着目し、ピアソン相関係数を使用する。つまり、ここでは、類似判定部113は、対象の第1データと第2データとの増減の関係の類似性に基づき、第1データと第2データとが類似するか否かを判定する。
まず、類似判定部113は、ピアソン無相関検定で対象の第1データと第2データとの間に相関があるかを検定する。そして、類似判定部113は、検定の結果、無相関ではないと判定した場合、数7に示すように、ピアソン相関係数を類似度とする。一方、類似判定部113は、検定の結果、無相関であるとは言えない(帰無仮説を棄却できない)場合、類似度を0と定義する。ピアソン無相関検定及び相関係数の計算に用いる標本は、ヒストグラムのbin幅で十分であるので、x=1,…,255を代入したときのカーネル密度推定量f^h(T)(x)及びカーネル密度推定量f^h(S)(x)の値を使用する。

数7では、ラベルykに対応するf^h
(T)(x)がf^h
(T)(x)y_k、ラベルylに対応するf^h
(S)(x)がf^h
(T)(x)y_lと表記されている。ラベルyk
(T)に対応するラベルyl
(S)は、score(yk
(T),yl
(S))が最も高いものとする。
具体的には、検定の結果、無相関ではないと判定した場合、類似判定部113は、第2データにおけるラベルyk (T)の探索始点を変更しながら、第2データにおける各ラベルyk (T)と相関係数が高い第1データにおけるラベルyl (S)を順次特定する。これにより、類似判定部113は、第2データにおける各ラベルyk (T)に対応する対象の第1データにおけるラベルyl (S)を特定する。そして、類似判定部113は、対象の第1データと第2データとについて、対応するラベルylとラベルykとの間の最大の相関係数を、対象の第1データと第2データとの類似度とする。なお、類似判定部113は、対応するラベルylとラベルykとの間の相関係数の平均値又は合計値を、対象の第1データと第2データとの類似度としてもよい。
具体的には、検定の結果、無相関ではないと判定した場合、類似判定部113は、第2データにおけるラベルyk (T)の探索始点を変更しながら、第2データにおける各ラベルyk (T)と相関係数が高い第1データにおけるラベルyl (S)を順次特定する。これにより、類似判定部113は、第2データにおける各ラベルyk (T)に対応する対象の第1データにおけるラベルyl (S)を特定する。そして、類似判定部113は、対象の第1データと第2データとについて、対応するラベルylとラベルykとの間の最大の相関係数を、対象の第1データと第2データとの類似度とする。なお、類似判定部113は、対応するラベルylとラベルykとの間の相関係数の平均値又は合計値を、対象の第1データと第2データとの類似度としてもよい。
類似判定部113は、類似度が閾値Tよりも高い第1データの取得元である転移元装置20のみを転移元の候補とする。あるいは、類似判定部113は、第1データを類似度の高い順にソートして、類似度の高い基準個の第1データの取得元の転移元装置20のみを転移元の候補とする。これにより、類似判定部113は、転移元の候補となる転移元装置20を絞り込む。
図14を参照して、実施の形態1に係る無相関ではないと判定された場合における類似度計算処理を説明する。
ステップS311では、類似判定部113は、scoremaxに初期値として0を設定する。
ループ1では、類似判定部113は、変数rを0からq(T)-1まで1づつずらしながらステップS312からステップS317までの処理を繰り返し実行する。ここで、q(T)は、転移先装置30におけるラベルy(T)の種類の数である。つまり、転移先装置30におけるラベルy(T)には、{y0 (T),...,yq(T)-1 (T)}のq(T)種類のラベルが存在する。また、ループ2では、類似判定部113は、yr (T),y1+r (T),...,y(q(T)-1+r)modq(T) (T)の順に、ステップS312からステップS314までの処理を繰り返し実行する。ここで、下付きで表記されたq(T)はq(T)を意味する。つまり、ループ1及びループ2では、探索順序をyr (T),y1+r (T),...,y(q(T)-1+r)modq(T) (T)の順とし、探索の始点を表す変数rを0からq(T)-1まで1づつずらしながら探索を行うことを意味する。
ステップS312では、類似判定部113は、使用済のラベルの集合usedに初期値として空集合を設定する。
ステップS311では、類似判定部113は、scoremaxに初期値として0を設定する。
ループ1では、類似判定部113は、変数rを0からq(T)-1まで1づつずらしながらステップS312からステップS317までの処理を繰り返し実行する。ここで、q(T)は、転移先装置30におけるラベルy(T)の種類の数である。つまり、転移先装置30におけるラベルy(T)には、{y0 (T),...,yq(T)-1 (T)}のq(T)種類のラベルが存在する。また、ループ2では、類似判定部113は、yr (T),y1+r (T),...,y(q(T)-1+r)modq(T) (T)の順に、ステップS312からステップS314までの処理を繰り返し実行する。ここで、下付きで表記されたq(T)はq(T)を意味する。つまり、ループ1及びループ2では、探索順序をyr (T),y1+r (T),...,y(q(T)-1+r)modq(T) (T)の順とし、探索の始点を表す変数rを0からq(T)-1まで1づつずらしながら探索を行うことを意味する。
ステップS312では、類似判定部113は、使用済のラベルの集合usedに初期値として空集合を設定する。
ループ3では、類似判定部113は、変数lを0からq(S)まで1づつずらしながらステップS313の処理を繰り返し実行する。ステップS313では、類似判定部113は、第2データのラベルyk
(T)と、対象の第1データのラベルyl
(S)との間のピアソン相関係数を計算して、score(yk
(T),yl
(S))に設定する。
ステップS314では、類似判定部113は、ラベルyl
(S)が集合usedに含まれていないラベルyl
(S)のうち、score(yk
(T),yl
(S))が最大のラベルyl
(S)を、対象のラベルyl
(S)に設定する。類似判定部113は、対象のラベルyl
(S)を集合usedに加える。また、類似判定部113は、処理対象になっているラベルyk
(T)と、対象のラベルyl
(S)との間のscore(yk
(T),yl
(S))を、scoretmpに設定する。また、類似判定部113は、処理対象になっているラベルyk
(T)と、対象のラベルyl
(S)との組(yk
(T),yl
(S))を集合gtmpに加える。
ループ2及びループ3の処理を実行することにより、ループ1で設定された探索順序において、相関係数の高い順に、各ラベルyk
(T)に対応するラベルyl
(S)が特定される。そして、各ラベルyk
(T)と対応するラベルyl
(S)との間の相関係数のうち最も高い相関係数がscoretmpに設定される。また、各ラベルyk
(T)と対応するラベルyl
(S)との組が集合gtmpに設定される。
ステップS315では、類似判定部113は、scoremaxよりもscoretmpが高いか否かを判定する。類似判定部113は、scoremaxよりもscoretmpが高い場合には処理をステップS316に進め、scoremaxよりもscoretmpが高くない場合には処理をステップS317の後に進める。
ステップS316では、類似判定部113は、scoretmpをscoremaxに設定する。ステップS317では、類似判定部113は、集合gtmpを集合gに設定する。
ステップS316では、類似判定部113は、scoretmpをscoremaxに設定する。ステップS317では、類似判定部113は、集合gtmpを集合gに設定する。
ループ1からループ3の処理を実行することにより、全ての探索順序で特定された相関係数scoretmpのうち最も高い相関係数scoretmpが相関係数scoremaxに設定される。ここでは、この相関係数scoremaxを対象の第1データと第2データとの類似度とする。また、相関係数scoremaxが計算された探索順序で特定された各ラベルyk
(T)と対応するラベルyl
(S)との組が集合gに設定される。
ステップS31で絞り込まれた転移元の候補となる転移元装置20から取得された第1データそれぞれを対象として、ステップS32からステップS34の処理が実行される。
(ステップS32:ラベル写像生成処理)
写像生成部114は、対象の第1データの元になった訓練データにおけるラベルと、第2データの元になった観測データにおけるラベルとの対応関係を示すラベル写像gを生成する。
具体的には、写像生成部114は、ステップS31で特定された各ラベルyk (T)に対応するラベルyl (S)を示す集合gをラベル写像gとして生成する。
写像生成部114は、対象の第1データの元になった訓練データにおけるラベルと、第2データの元になった観測データにおけるラベルとの対応関係を示すラベル写像gを生成する。
具体的には、写像生成部114は、ステップS31で特定された各ラベルyk (T)に対応するラベルyl (S)を示す集合gをラベル写像gとして生成する。
(ステップS33:データ写像生成処理)
写像生成部114は、対象の第1データの元になった訓練データの特徴量ベクトルと、第2データの元になった観測データの特徴量ベクトルとの対応関係を示すデータ写像fを生成する。
具体的には、まず、写像生成部114は、対象の第1データとともに取得された軸の対応関係と、第2データとともに取得された軸の対応関係とに基づき、対象の第1データの元になった訓練データの特徴量ベクトルと、第2データの元になった観測データの特徴量ベクトルとの対応関係を特定する。対象の第1データの元になった訓練データの特徴量ベクトルと、第2データの元になった観測データの特徴量ベクトルとの対応関係は、転移先装置30の元の座標系→転移先装置30の基底変換後の座標系→転移元装置20の基底変換後の座標系→転移元装置20の元の座標系の順に対応関係を特定することで特定される。
具体例としては、図15に示すように、対象の第1データとともに取得された軸の対応関係が数8に示す関係であり、第2データとともに取得された軸の対応関係が数9に示す関係であるとする。また、図15に示すように、対象の第1データの元になった訓練データの特徴量ベクトルの基底変換後のデータと、第2データの元になった観測データの特徴量ベクトル基底変換後のデータとの対応関係が数10に示す関係であったとする。


すると、対象の第1データの元になった訓練データの特徴量ベクトルと、第2データの元になった観測データの特徴量ベクトルとの対応関係Rは、数11に示すようになる。

この対応関係をR(i)=jと表すと、図15の場合には、R(2)=1,R(1)=2になる。ここで、変数iは転移先装置30の軸の添え字(x1
(T)であれば1)であり、変数jは転移元装置20の軸の添え字(x2
(S)であれば2)である。
写像生成部114は、対象の第1データの元になった訓練データの特徴量ベクトルと、第2データの元になった観測データの特徴量ベクトルとの対応関係を示すデータ写像fを生成する。
具体的には、まず、写像生成部114は、対象の第1データとともに取得された軸の対応関係と、第2データとともに取得された軸の対応関係とに基づき、対象の第1データの元になった訓練データの特徴量ベクトルと、第2データの元になった観測データの特徴量ベクトルとの対応関係を特定する。対象の第1データの元になった訓練データの特徴量ベクトルと、第2データの元になった観測データの特徴量ベクトルとの対応関係は、転移先装置30の元の座標系→転移先装置30の基底変換後の座標系→転移元装置20の基底変換後の座標系→転移元装置20の元の座標系の順に対応関係を特定することで特定される。
具体例としては、図15に示すように、対象の第1データとともに取得された軸の対応関係が数8に示す関係であり、第2データとともに取得された軸の対応関係が数9に示す関係であるとする。また、図15に示すように、対象の第1データの元になった訓練データの特徴量ベクトルの基底変換後のデータと、第2データの元になった観測データの特徴量ベクトル基底変換後のデータとの対応関係が数10に示す関係であったとする。
そして、写像生成部114は、特定された対応関係Rと、対象の第1データとともに取得された各軸iの最小値min(xi
(S))及び最大値max(xi
(S))と、第2データとともに取得された各軸iの最小値min(xi
(T))及び最大値max(xi
(T))とに基づき、数12に示すように、データ写像fを生成する。

数12において、p(T)は、第2データの元になった観測データの特徴量ベクトルx→の次元数である。Cは、数1に定義された通りである。
(ステップS34:データ送信処理)
データ送信部115は、対象の第1データについてステップS32で生成されたラベル写像gと、対象の第1データについてステップS33で生成されたデータ写像fと、対象の第1データの取得元である転移元装置20から取得された学習モデルとを、転移先装置30に送信する。
すると、データ取得部315は、ラベル写像gとデータ写像fと学習モデルとを取得する。データ取得部315は、ラベル写像gを出力ラベル変換部318に設定し、データ写像fを入力データ変換部317に設定し、学習モデルを学習モデル記憶部331に書き込む。
データ送信部115は、対象の第1データについてステップS32で生成されたラベル写像gと、対象の第1データについてステップS33で生成されたデータ写像fと、対象の第1データの取得元である転移元装置20から取得された学習モデルとを、転移先装置30に送信する。
すると、データ取得部315は、ラベル写像gとデータ写像fと学習モデルとを取得する。データ取得部315は、ラベル写像gを出力ラベル変換部318に設定し、データ写像fを入力データ変換部317に設定し、学習モデルを学習モデル記憶部331に書き込む。
図16を参照して、実施の形態1に係る転移先装置30の分析処理(図5の(6)~(9)の処理に相当)を説明する。
ここでは、ステップS31で絞り込まれた転移元の候補となる転移元装置20が1つである場合を説明する。
ここでは、ステップS31で絞り込まれた転移元の候補となる転移元装置20が1つである場合を説明する。
(ステップS41:学習モデル生成処理)
学習モデル生成部316は、転移先装置30用の学習モデルを生成する。ここでは、転移元の候補となる転移元装置20が1つであるため、学習モデル生成部316は、ステップS34で取得された学習モデルをそのまま転移先装置30用の学習モデルに設定する。
学習モデル生成部316は、転移先装置30用の学習モデルを生成する。ここでは、転移元の候補となる転移元装置20が1つであるため、学習モデル生成部316は、ステップS34で取得された学習モデルをそのまま転移先装置30用の学習モデルに設定する。
(ステップS42:データ変換処理)
入力データ変換部317は、センサ60から取得された観測データを、ステップS34で設定されたデータ写像fによって変換する。これにより、入力データ変換部317は、転移元の候補である転移元装置20のデータの形式に観測データの形式を合わせる。つまり、観測データの形式は、転移元装置20から取得された学習モデルの入力形式に変換される。
具体例としては、転移先装置30の観測データと、各軸の関係が図15に示す関係であったとする。この場合には、入力データ変換部317は、数11に示す対応関係Rに従い、数13に示すように、x1 (T)軸をx2 (T)軸に入れ替え、x2 (T)軸をx1 (T)軸に入れ替えた上で、スケールの変換を行う。

入力データ変換部317は、センサ60から取得された観測データを、ステップS34で設定されたデータ写像fによって変換する。これにより、入力データ変換部317は、転移元の候補である転移元装置20のデータの形式に観測データの形式を合わせる。つまり、観測データの形式は、転移元装置20から取得された学習モデルの入力形式に変換される。
具体例としては、転移先装置30の観測データと、各軸の関係が図15に示す関係であったとする。この場合には、入力データ変換部317は、数11に示す対応関係Rに従い、数13に示すように、x1 (T)軸をx2 (T)軸に入れ替え、x2 (T)軸をx1 (T)軸に入れ替えた上で、スケールの変換を行う。
(ステップS43:データ入力処理)
入力データ変換部317は、ステップS42で変換された観測データを、ステップS41で生成された学習モデルに入力する。すると、学習モデルで推論された結果として出力ラベルが出力される。
入力データ変換部317は、ステップS42で変換された観測データを、ステップS41で生成された学習モデルに入力する。すると、学習モデルで推論された結果として出力ラベルが出力される。
(ステップS44:出力ラベル変換処理)
出力ラベル変換部318は、ステップS43で出力された出力ラベルを、ステップS34で設定されたラベル写像gによって変換する。これにより、出力ラベル変換部318は、転移先装置30のラベルに出力ラベルを変換する。そして、出力ラベル変換部318は、変換された出力ラベルを、観測データから推論された結果として出力する。
具体例としては、ラベル写像gは{(yk (T),yl (S))}で表され、ラベル写像g={(りんご,自動車)、(みかん,バイク)、(ばなな,自転車)}であったとする。このとき、ステップS43で出力された出力ラベルがバイクであった場合には、バイクがみかんに変換される。
出力ラベル変換部318は、ステップS43で出力された出力ラベルを、ステップS34で設定されたラベル写像gによって変換する。これにより、出力ラベル変換部318は、転移先装置30のラベルに出力ラベルを変換する。そして、出力ラベル変換部318は、変換された出力ラベルを、観測データから推論された結果として出力する。
具体例としては、ラベル写像gは{(yk (T),yl (S))}で表され、ラベル写像g={(りんご,自動車)、(みかん,バイク)、(ばなな,自転車)}であったとする。このとき、ステップS43で出力された出力ラベルがバイクであった場合には、バイクがみかんに変換される。
つまり、図17に示すように、実施の形態1に係る学習モデル検索システム100は、転移元装置20が学習モデルを生成した際に使用した訓練データと、転移先装置30によって得られた少数の観測データとの類似性を判定して、転移元の候補となる転移元装置20を絞り込む(フェーズ1)。その後、転移元の候補となる転移元装置20から、転移元として採用する転移元装置20が、自動的あるいは人手により抽出される(フェーズ2)。
***実施の形態1の効果***
以上のように、実施の形態1に係る学習モデル検索システム100は、転移元装置20の訓練データから生成された統計量と、転移先装置30の観測データから生成された統計量とに基づき、転送元の候補となる転移元装置20を絞り込む。これにより、短い処理時間で適切な転移元を特定可能である。その結果、短い処理時間で転移先装置30の学習モデルを生成可能である。
以上のように、実施の形態1に係る学習モデル検索システム100は、転移元装置20の訓練データから生成された統計量と、転移先装置30の観測データから生成された統計量とに基づき、転送元の候補となる転移元装置20を絞り込む。これにより、短い処理時間で適切な転移元を特定可能である。その結果、短い処理時間で転移先装置30の学習モデルを生成可能である。
特に、実施の形態1に係る学習モデル検索システム100は、訓練データとの特徴量ベクトルと観測データの特徴量ベクトルとのそれぞれを、特徴軸毎の情報量を基準として基底変換して得られたデータが類似するか否かを判定することにより、転送元の候補となる転移元装置20を絞り込む。データが類似するか否かを判定する処理は、転移元の訓練データを用いて学習を試行する処理に比べ処理時間がかからない。したがって、短い処理時間で適切な転移元を特定可能になる。
また、実施の形態1に係る学習モデル検索システム100は、特徴量ベクトルが基底変換された後に、特徴量ベクトルのスケールが正規化されて得られたデータが類似するか否かを判定することにより、転送元の候補となる転移元装置20を絞り込む。これにより、データのスケールの影響を除いた上で比較され、適切な判定が可能になる。
また、実施の形態1に係る学習モデル検索システム100は、データの増減の関係の類似性に基づき、データが類似するか否かを判定する。これにより、転移先のデータ数が転移元のデータ数に比べ少ない状況であっても、適切な判定が可能になる。
また、実施の形態1に係る学習モデル検索システム100は、データが類似するか否かの判定に用いる統計量はカーネル密度推定量f^h(x)であり、ピアソン相関係数の計算時には、x=1,...,255を固定的に用いる。そのため、転移元装置20の訓練データの数に依存せず、計算量を一定にすることが可能である。
また、実施の形態1に係る学習モデル検索システム100は、統計量である第1データ及び第2データと、転移元装置20の学習モデルとだけが検索装置10に与えられる。そのため、例えば、検索装置10をクラウドコンピューティングのサーバによって実現するような場合であっても、検索装置10によって転移元装置20の訓練データが推測されるといったことがなく、安全性が高い。
***他の構成***
<変形例1>
実施の形態1では、転移先装置30の分析処理について、ステップS31で絞り込まれた転移元の候補となる転移元装置20が1つである場合を説明した。しかし、ステップS31で絞り込まれた転移元の候補となる転移元装置20が2つ以上である場合もある。
<変形例1>
実施の形態1では、転移先装置30の分析処理について、ステップS31で絞り込まれた転移元の候補となる転移元装置20が1つである場合を説明した。しかし、ステップS31で絞り込まれた転移元の候補となる転移元装置20が2つ以上である場合もある。
図18を参照して、ステップS31で絞り込まれた転移元の候補となる転移元装置20が2つ以上である場合における転移先装置30の分析処理を説明する。
ここでは、一対他分類器(one-versus-the-rest classifier)の考え方に基づいた処理を説明する。
ここでは、一対他分類器(one-versus-the-rest classifier)の考え方に基づいた処理を説明する。
(ステップS51:学習モデル生成処理)
学習モデル生成部316は、転移元の候補となる各転移元装置20から取得された学習モデルを、弱学習モデルとして生成する。そして、学習モデル生成部316は、弱学習モデルの組を転移先装置30用の学習モデルとして生成する。
つまり、各転移元装置20から取得された学習モデルは、転移先装置30の一部のラベル識別が可能であると考えられる。そこで、学習モデル生成部316は、各転移元装置20から取得された学習モデルを弱学習モデルとし、弱学習モデルの組を転移先装置30用の学習モデルに設定する。
学習モデル生成部316は、転移元の候補となる各転移元装置20から取得された学習モデルを、弱学習モデルとして生成する。そして、学習モデル生成部316は、弱学習モデルの組を転移先装置30用の学習モデルとして生成する。
つまり、各転移元装置20から取得された学習モデルは、転移先装置30の一部のラベル識別が可能であると考えられる。そこで、学習モデル生成部316は、各転移元装置20から取得された学習モデルを弱学習モデルとし、弱学習モデルの組を転移先装置30用の学習モデルに設定する。
(ステップS52:学習モデル選択処理)
入力データ変換部317は、ステップS51で設定された転移先装置30の学習モデルを構成する弱学習モデルのうち、未選択の1つの弱学習モデルを対象の弱学習モデルとして選択する。
なお、入力データ変換部317は、未選択の弱学習モデルが存在しない場合には、観測データを分類不可と判定する。
入力データ変換部317は、ステップS51で設定された転移先装置30の学習モデルを構成する弱学習モデルのうち、未選択の1つの弱学習モデルを対象の弱学習モデルとして選択する。
なお、入力データ変換部317は、未選択の弱学習モデルが存在しない場合には、観測データを分類不可と判定する。
(ステップS53:入力データ変換処理)
入力データ変換部317は、センサ60から取得された観測データを、ステップS52で選択された弱学習モデルの取得元の転移元装置20についてのデータ写像fによって変換する。
入力データ変換部317は、センサ60から取得された観測データを、ステップS52で選択された弱学習モデルの取得元の転移元装置20についてのデータ写像fによって変換する。
(ステップS54:データ入力処理)
入力データ変換部317は、ステップS53で変換された観測データを、ステップS52で選択された弱学習モデルに入力する。すると、学習モデルで推論された結果として出力ラベル又は推論不可との結果が出力される。
入力データ変換部317は、ステップS53で変換された観測データを、ステップS52で選択された弱学習モデルに入力する。すると、学習モデルで推論された結果として出力ラベル又は推論不可との結果が出力される。
(ステップS55:出力判定処理)
入力データ変換部317は、ステップS54で出力ラベルが出力されたか否かを判定する。
入力データ変換部317は、出力ラベルが出力された場合には、処理をステップS56に進める。一方、入力データ変換部317は、推論不可との結果が出力された場合には、処理をステップS52に戻して、他の弱学習モデルを選択する。
入力データ変換部317は、ステップS54で出力ラベルが出力されたか否かを判定する。
入力データ変換部317は、出力ラベルが出力された場合には、処理をステップS56に進める。一方、入力データ変換部317は、推論不可との結果が出力された場合には、処理をステップS52に戻して、他の弱学習モデルを選択する。
(ステップS56:出力ラベル変換処理)
出力ラベル変換部318は、ステップS54で出力された出力ラベルを、ステップS52で選択された弱学習モデルの取得元の転移元装置20についてのラベル写像gによって変換する。
出力ラベル変換部318は、ステップS54で出力された出力ラベルを、ステップS52で選択された弱学習モデルの取得元の転移元装置20についてのラベル写像gによって変換する。
上記処理は、一対他分類器の考え方に基づいた処理である。しかし、これに限らず、一対一分類器(one-versus-one classifier)、又は、誤り訂正出力符号(error correcting output code)の考え方に基づく処理としてもよい。
<変形例2>
実施の形態1では、類似度が閾値よりも高いか否かといった方法により転移元の候補となる転移元装置20を絞り込んだ。しかし、転移元の候補とするか否かを最終的に人が判断してもよい。この場合には、検索装置10は、ステップS13で訓練データが2次元画像化された画像データと、ステップS23で観測データが2次元画像化された画像データとを表示すればよい。そして、2次元画像化された画像データ同士を目視により比較することで、データが類似しているか否かを人が判定すればよい。
2次元画像化された画像データ同士の比較であるため、人が容易に行うことが可能である。例えば、図19に示すような2次元画像化された画像データが得られる。図19では、転移先装置30のラベル9.0と、転移元装置20のラベル6.0とが類似しており、転移先装置30のラベル10.0と、転移元装置20のラベル9.0とが類似していることが分かる。
実施の形態1では、類似度が閾値よりも高いか否かといった方法により転移元の候補となる転移元装置20を絞り込んだ。しかし、転移元の候補とするか否かを最終的に人が判断してもよい。この場合には、検索装置10は、ステップS13で訓練データが2次元画像化された画像データと、ステップS23で観測データが2次元画像化された画像データとを表示すればよい。そして、2次元画像化された画像データ同士を目視により比較することで、データが類似しているか否かを人が判定すればよい。
2次元画像化された画像データ同士の比較であるため、人が容易に行うことが可能である。例えば、図19に示すような2次元画像化された画像データが得られる。図19では、転移先装置30のラベル9.0と、転移元装置20のラベル6.0とが類似しており、転移先装置30のラベル10.0と、転移元装置20のラベル9.0とが類似していることが分かる。
<変形例3>
実施の形態1では、統計量の比較をする際、ピアソン相関係数を用いた。しかし、統計量の比較をする際、画像識別の技術を使用してもよい。具体例としては、類似判定部113は、訓練データが2次元画像化された画像データと、観測データが2次元画像化された画像データとのそれぞれから特徴点を抽出する。そして、類似判定部113は、訓練データが2次元画像化された画像データにおける特徴点同士の距離と、観測データが2次元画像化された画像データにおける特徴点同士の距離とを比較することが考えられる。
実施の形態1では、統計量の比較をする際、ピアソン相関係数を用いた。しかし、統計量の比較をする際、画像識別の技術を使用してもよい。具体例としては、類似判定部113は、訓練データが2次元画像化された画像データと、観測データが2次元画像化された画像データとのそれぞれから特徴点を抽出する。そして、類似判定部113は、訓練データが2次元画像化された画像データにおける特徴点同士の距離と、観測データが2次元画像化された画像データにおける特徴点同士の距離とを比較することが考えられる。
<変形例4>
実施の形態1では、転移元装置20が第1データを生成した上で、第1データを検索装置10に送信した。しかし、転移元装置20は訓練データを検索装置10に送信して、検索装置10が第1データを生成してもよい。この場合には、転移元装置20が備える基底変換部211と正規化部212と統計量計算部213との機能構成要素を検索装置10が備えるようにすればよい。
同様に、実施の形態1では、転移先装置30が第2データを生成した上で、第2データを検索装置10に送信した。しかし、転移先装置30は観測データを検索装置10に送信して、検索装置10が第2データを生成してもよい。この場合には、転移先装置30が備える基底変換部311と正規化部312と統計量計算部313との機能構成要素を検索装置10が備えるようにすればよい
実施の形態1では、転移元装置20が第1データを生成した上で、第1データを検索装置10に送信した。しかし、転移元装置20は訓練データを検索装置10に送信して、検索装置10が第1データを生成してもよい。この場合には、転移元装置20が備える基底変換部211と正規化部212と統計量計算部213との機能構成要素を検索装置10が備えるようにすればよい。
同様に、実施の形態1では、転移先装置30が第2データを生成した上で、第2データを検索装置10に送信した。しかし、転移先装置30は観測データを検索装置10に送信して、検索装置10が第2データを生成してもよい。この場合には、転移先装置30が備える基底変換部311と正規化部312と統計量計算部313との機能構成要素を検索装置10が備えるようにすればよい
なお、検索装置10に訓練データを送信する場合には、検索装置10に訓練データが漏洩することになる。同様に、検索装置10に観測データを送信する場合には、検索装置10に観測データが漏洩することになる。したがって、訓練データ又は観測データを外部に漏らしたくない場合には、実施の形態1の構成とすることが望ましい。
<変形例5>
実施の形態1では、各機能構成要素がソフトウェアで実現された。しかし、変形例5として、各機能構成要素はハードウェアで実現されてもよい。この変形例5について、実施の形態1と異なる点を説明する。
実施の形態1では、各機能構成要素がソフトウェアで実現された。しかし、変形例5として、各機能構成要素はハードウェアで実現されてもよい。この変形例5について、実施の形態1と異なる点を説明する。
各機能構成要素がハードウェアで実現される場合には、検索装置10は、プロセッサ11とメモリ12とストレージ13とに代えて、電子回路15を備える。電子回路15は、各機能構成要素と、メモリ12と、ストレージ13との機能とを実現する専用の回路である。
同様に、各機能構成要素がハードウェアで実現される場合には、転移元装置20は、プロセッサ21とメモリ22とストレージ23とに代えて、電子回路25を備える。電子回路25は、各機能構成要素と、メモリ22と、ストレージ23との機能とを実現する専用の回路である。
同様に、各機能構成要素がハードウェアで実現される場合には、転移先装置30は、プロセッサ31とメモリ32とストレージ33とに代えて、電子回路35を備える。電子回路35は、各機能構成要素と、メモリ32と、ストレージ33との機能とを実現する専用の回路である。
電子回路15,25,35としては、単一回路、複合回路、プログラム化したプロセッサ、並列プログラム化したプロセッサ、ロジックIC、GA(Gate Array)、ASIC(Application Specific Integrated Circuit)、FPGA(Field-Programmable Gate Array)が想定される。
検索装置10と転移元装置20と転移先装置30との各装置は、各機能構成要素を1つの電子回路15,25,35で実現してもよいし、各機能構成要素を複数の電子回路15に分散させて実現してもよい。
検索装置10と転移元装置20と転移先装置30との各装置は、各機能構成要素を1つの電子回路15,25,35で実現してもよいし、各機能構成要素を複数の電子回路15に分散させて実現してもよい。
<変形例6>
変形例6として、検索装置10と転移元装置20と転移先装置30との各装置は、一部の各機能構成要素がハードウェアで実現され、他の各機能構成要素がソフトウェアで実現されてもよい。
変形例6として、検索装置10と転移元装置20と転移先装置30との各装置は、一部の各機能構成要素がハードウェアで実現され、他の各機能構成要素がソフトウェアで実現されてもよい。
プロセッサ11,21,31とメモリ12,22,32とストレージ13,23,33と電子回路15,25,35とを処理回路という。つまり、各機能構成要素の機能は、処理回路により実現される。
実施の形態2.
実施の形態2は、2次元画像化された画像データに代えて、m次元主成分空間のベクトルz^→の要素z^i毎の確率密度推定量を統計量として用いる点が実施の形態1と異なる。実施の形態2では、この異なる点を説明して、同一の点については説明を省略する。
実施の形態2は、2次元画像化された画像データに代えて、m次元主成分空間のベクトルz^→の要素z^i毎の確率密度推定量を統計量として用いる点が実施の形態1と異なる。実施の形態2では、この異なる点を説明して、同一の点については説明を省略する。
***動作の説明***
図6を参照して、実施の形態2に係る転移元装置20の第1データ送信処理を説明する。
ステップS12では、正規化部212は、zmin=0,zmax=1として、ベクトルz→を正規化してベクトルz^→を生成する。
ステップS13では、統計量計算部213は、数14に示すように、ベクトルz^→の要素z^i毎のカーネル密度推定量f^h(x)を用いて、確率密度関数を推定する。

数14において、|z^i|は、ベクトルz^→の第i主成分軸のデータ総数である。
図6を参照して、実施の形態2に係る転移元装置20の第1データ送信処理を説明する。
ステップS12では、正規化部212は、zmin=0,zmax=1として、ベクトルz→を正規化してベクトルz^→を生成する。
ステップS13では、統計量計算部213は、数14に示すように、ベクトルz^→の要素z^i毎のカーネル密度推定量f^h(x)を用いて、確率密度関数を推定する。
図12を参照して、実施の形態2に係る転移先装置30の第2データ送信処理を説明する。
ステップS22では、図6のステップS12と同様に、正規化部312は、zmin=0,zmax=1として、ベクトルz→を正規化してベクトルz^→を生成する。
ステップS23では、図6のステップS13と同様に、統計量計算部313は、ベクトルz^→の要素z^i毎のカーネル密度推定量f^h(x)を用いて、確率密度関数を推定する。
ステップS22では、図6のステップS12と同様に、正規化部312は、zmin=0,zmax=1として、ベクトルz→を正規化してベクトルz^→を生成する。
ステップS23では、図6のステップS13と同様に、統計量計算部313は、ベクトルz^→の要素z^i毎のカーネル密度推定量f^h(x)を用いて、確率密度関数を推定する。
図13を参照して、実施の形態2に係る検索装置10の検索処理を説明する。
ステップS31では、類似判定部113は、数15に示すように、要素z^iの寄与率PViで重み付けしたピアソン相関係数を類似度とする。ここで、ピアソン無相関検定及び相関係数の計算に用いる標本は、x=0,0.001,...,1を代入したときのカーネル密度推定量f^h(T)(x)及びカーネル密度推定量f^h(S)(x)の値を使用する。

言い換えると、類似判定部113は、各特徴軸を対象として、対象の特徴軸についての第1データと第2データとの増減の関係の類似性(ピアソン相関係数)に対して、対象の特徴軸の情報量に応じて重み付け(寄与率PViで重み付け)して得られた結果を線形結合して、第1データと第2データとが類似するか否かを判定する。
ステップS31では、類似判定部113は、数15に示すように、要素z^iの寄与率PViで重み付けしたピアソン相関係数を類似度とする。ここで、ピアソン無相関検定及び相関係数の計算に用いる標本は、x=0,0.001,...,1を代入したときのカーネル密度推定量f^h(T)(x)及びカーネル密度推定量f^h(S)(x)の値を使用する。
図20を参照して実施の形態2に係る類似判定処理を説明する。
類似度判定処理は、ループ3の処理が図14に示す処理と異なる。ループ3では、ループ4の処理が実行される。ループ4では、類似判定部113は、変数iが1からmin(m(T),m(S))まで1づつずらしながらステップS313の処理を繰り返し実行する。ステップS313では、類似判定部113は、要素z^iの寄与率PVi (T)で重み付けした、第2データのラベルyk (T)と対象の第1データのyl (S)との間のピアソン相関係数を計算して、score(yk (T),yl (S))に加算する。
類似度判定処理は、ループ3の処理が図14に示す処理と異なる。ループ3では、ループ4の処理が実行される。ループ4では、類似判定部113は、変数iが1からmin(m(T),m(S))まで1づつずらしながらステップS313の処理を繰り返し実行する。ステップS313では、類似判定部113は、要素z^iの寄与率PVi (T)で重み付けした、第2データのラベルyk (T)と対象の第1データのyl (S)との間のピアソン相関係数を計算して、score(yk (T),yl (S))に加算する。
***実施の形態2の効果***
以上のように、実施の形態2に係る学習モデル検索システム100は、特徴量ベクトルを基底変換して無相関化させた上で、ベクトルの要素毎の類似性を線形結合して類似するか否かを判定する。これにより、実施の形態1に比べて計算量を減らすことが可能になる。
以上のように、実施の形態2に係る学習モデル検索システム100は、特徴量ベクトルを基底変換して無相関化させた上で、ベクトルの要素毎の類似性を線形結合して類似するか否かを判定する。これにより、実施の形態1に比べて計算量を減らすことが可能になる。
また、実施の形態2に係る学習モデル検索システム100は、ベクトルの要素毎の類似性に対して、寄与率で重み付けする。これにより、機械学習における出力に重要な影響を与える要素が似ているほど、類似性が高いと判定されるようになり、適切な判定が可能になる。
また、実施の形態2に係る学習モデル検索システム100は、ベクトルの要素毎に外挿(確率密度推定)を行うことにより、適切な判定が可能になる。
***他の構成***
<変形例7>
実施の形態2では、確率密度関数の推定にカーネル密度推定量を用いた。しかし、より計算量の少ない線形外挿又は直線外挿のような線形補間の技術を使用したアルゴリズムを用いてもよい。想定される定義域内のデータを万遍なく採取可能な場合のように、共変量シフトやクラスバランス変化を考慮しなくてよい場合、外挿ではなく線形補間又は多項式補間を用いてもよい。
<変形例7>
実施の形態2では、確率密度関数の推定にカーネル密度推定量を用いた。しかし、より計算量の少ない線形外挿又は直線外挿のような線形補間の技術を使用したアルゴリズムを用いてもよい。想定される定義域内のデータを万遍なく採取可能な場合のように、共変量シフトやクラスバランス変化を考慮しなくてよい場合、外挿ではなく線形補間又は多項式補間を用いてもよい。
実施の形態3.
実施の形態3は、m次元主成分空間のベクトルz^→の要素z^i毎に統計的仮説検定を用いる点が実施の形態2と異なる。実施の形態3では、この異なる点を説明して、同一の点については説明を省略する。
実施の形態3は、m次元主成分空間のベクトルz^→の要素z^i毎に統計的仮説検定を用いる点が実施の形態2と異なる。実施の形態3では、この異なる点を説明して、同一の点については説明を省略する。
***動作の説明***
図6を参照して、実施の形態3に係る転移元装置20の第1データ送信処理を説明する。
ステップS12では、正規化部212は、実施の形態2と同様に、zmin=0,zmax=1として、ベクトルz→を正規化してベクトルz^→を生成する。
ステップS13では、統計量計算部213は、統計量を計算しない。統計量計算部213は、統計的仮説検定における検定精度の低下を抑制するために、外れ値又はノイズの除去と、データの補間又は外挿とを行う。
図6を参照して、実施の形態3に係る転移元装置20の第1データ送信処理を説明する。
ステップS12では、正規化部212は、実施の形態2と同様に、zmin=0,zmax=1として、ベクトルz→を正規化してベクトルz^→を生成する。
ステップS13では、統計量計算部213は、統計量を計算しない。統計量計算部213は、統計的仮説検定における検定精度の低下を抑制するために、外れ値又はノイズの除去と、データの補間又は外挿とを行う。
図12を参照して、実施の形態3に係る転移先装置30の第2データ送信処理を説明する。
ステップS22では、図6のステップS12と同様に、正規化部312は、zmin=0,zmax=1として、ベクトルz→を正規化してベクトルz^→を生成する。
ステップS23では、図6のステップS13と同様に、統計量計算部313は、統計的仮説検定における検定精度の低下を抑制するために、外れ値又はノイズの除去と、データの補間又は外挿とを行う。
ステップS22では、図6のステップS12と同様に、正規化部312は、zmin=0,zmax=1として、ベクトルz→を正規化してベクトルz^→を生成する。
ステップS23では、図6のステップS13と同様に、統計量計算部313は、統計的仮説検定における検定精度の低下を抑制するために、外れ値又はノイズの除去と、データの補間又は外挿とを行う。
図13を参照して、実施の形態3に係る検索装置10の検索処理を説明する。
ステップS31では、類似判定部113は、統計的仮説検定により類似度を計算する。統計的仮説検定では、帰無仮説H0及び対立仮説H1が定められ、H0を棄却することによりH1が採択される。ここでは、類似判定部113は、検定結果から類似度を計算するため、H0が棄却された場合を0、棄却できない場合を1と定義し、検定結果を2値化する。但し、検定結果が1であってもH0を採択しないことに注意する。検定の標本は、(z^i (T))y_k,(z^i (S))y_lを用いる。下付きのyk及びylは、ラベルyk及びラベルylに対応する特徴量ベクトルz^→の要素z^iであることを示す。
類似判定部113は、数16に示すように、実施の形態2と同様に、検定結果に寄与率PViで重み付けすることにより類似度を算出する。
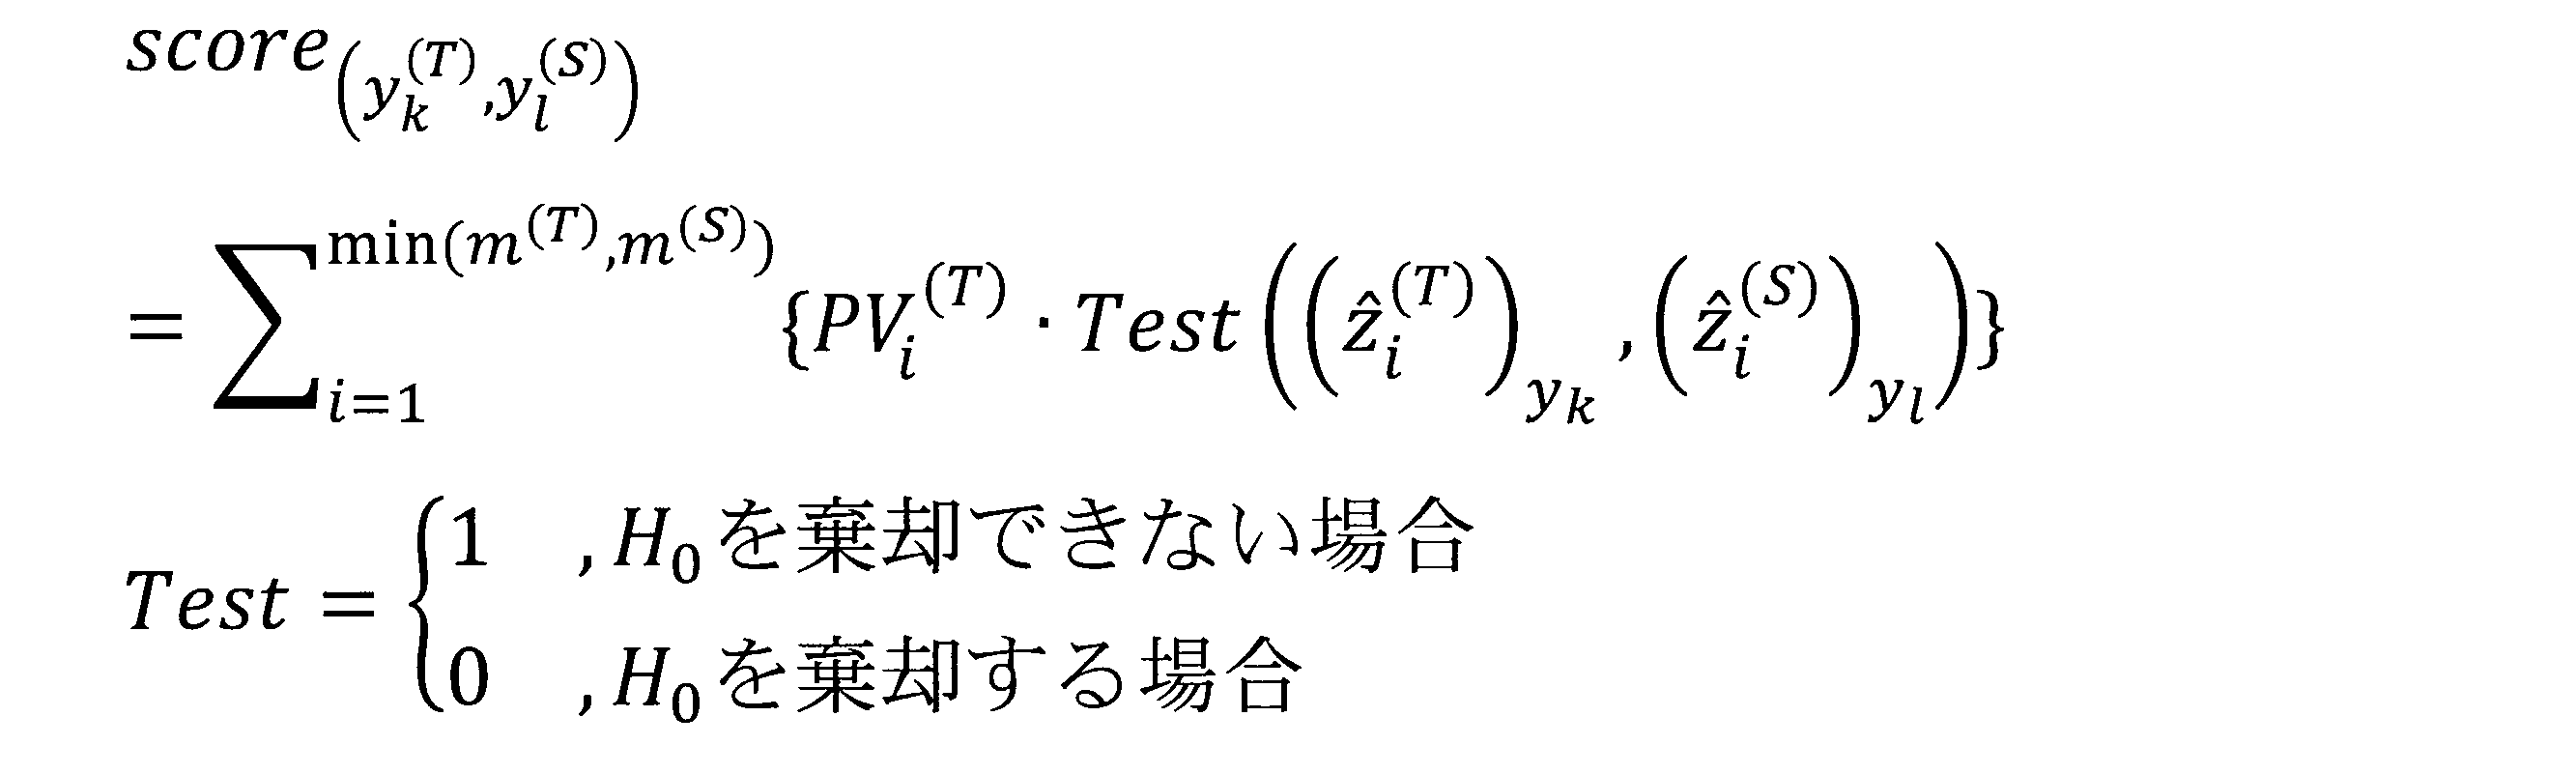
数16において、Testは検定結果を2値化した値である。
言い換えると、類似判定部113は、各特徴軸を対象として、対象の特徴軸についての第1データと第2データとの類似性を統計的仮説検定により特定する。そして、類似判定部113は、特定された類似性に対して、対象の特徴軸の情報量に応じて重み付けして得られた結果を線形結合して、第1データと第2データとが類似するか否かを判定する。
ステップS31では、類似判定部113は、統計的仮説検定により類似度を計算する。統計的仮説検定では、帰無仮説H0及び対立仮説H1が定められ、H0を棄却することによりH1が採択される。ここでは、類似判定部113は、検定結果から類似度を計算するため、H0が棄却された場合を0、棄却できない場合を1と定義し、検定結果を2値化する。但し、検定結果が1であってもH0を採択しないことに注意する。検定の標本は、(z^i (T))y_k,(z^i (S))y_lを用いる。下付きのyk及びylは、ラベルyk及びラベルylに対応する特徴量ベクトルz^→の要素z^iであることを示す。
類似判定部113は、数16に示すように、実施の形態2と同様に、検定結果に寄与率PViで重み付けすることにより類似度を算出する。
言い換えると、類似判定部113は、各特徴軸を対象として、対象の特徴軸についての第1データと第2データとの類似性を統計的仮説検定により特定する。そして、類似判定部113は、特定された類似性に対して、対象の特徴軸の情報量に応じて重み付けして得られた結果を線形結合して、第1データと第2データとが類似するか否かを判定する。
図21を参照して実施の形態3に係る類似判定処理を説明する。
類似度判定処理は、ステップS313の処理が図20と異なる。ステップS313では、類似判定部113は、ラベルyk (T)に対応する要素z^i (T)とラベルyl (S)に対応する要素z^i (S)との間の統計的仮説検定の検定結果に、要素z^iの寄与率PVi (T)で重み付けして、score(yk (T),yl (S))に加算する。
類似度判定処理は、ステップS313の処理が図20と異なる。ステップS313では、類似判定部113は、ラベルyk (T)に対応する要素z^i (T)とラベルyl (S)に対応する要素z^i (S)との間の統計的仮説検定の検定結果に、要素z^iの寄与率PVi (T)で重み付けして、score(yk (T),yl (S))に加算する。
なお、検定方法を選定する場合には、転移元装置20及び転移先装置30の特定によって、以下のような条件を考慮する必要がある。
(1)正規性を仮定できない
(2)サンプル数が異なる(独立2標本,対応のない標本)
(1)(2)の条件が成立する場合は、図22に示す対応のないノンパラメトリック検定を使用する。対応のないノンパラメトリック検定には、マンホイットニのU検定と2標本コルモゴロフ-スミルノフ検定とがある。マンホイットニのU検定では、帰無仮説H0を「両標本が同じ母集団から抽出された」とし、対立仮説H1を「両標本が異なる母集団から抽出された」とする。2標本コルモゴロフ-スミルノフ検定では、帰無仮説H0を「両標本の母集団の確率分布が等しい」とし、対立仮説H1を「両標本の母集団の確率分布が等しくない」とする。
(1)正規性を仮定できない
(2)サンプル数が異なる(独立2標本,対応のない標本)
(1)(2)の条件が成立する場合は、図22に示す対応のないノンパラメトリック検定を使用する。対応のないノンパラメトリック検定には、マンホイットニのU検定と2標本コルモゴロフ-スミルノフ検定とがある。マンホイットニのU検定では、帰無仮説H0を「両標本が同じ母集団から抽出された」とし、対立仮説H1を「両標本が異なる母集団から抽出された」とする。2標本コルモゴロフ-スミルノフ検定では、帰無仮説H0を「両標本の母集団の確率分布が等しい」とし、対立仮説H1を「両標本の母集団の確率分布が等しくない」とする。
転移元装置20及び転移先装置30の特性によっては、データに対応があること、又は、正規分布のようなある分布に従うことが想定できる場合がある。このような場合は、パラメトリック検定を利用してもよい。
***実施の形態3の効果***
以上のように、実施の形態3に係る学習モデル検索システム100は、統計的仮説検定により、類似するか否かを判定する。これにより、入力サンプルではなく、入力サンプルの母集団の類似性を厳密に判定することができるため、適切な判定が可能になる。
以上のように、実施の形態3に係る学習モデル検索システム100は、統計的仮説検定により、類似するか否かを判定する。これにより、入力サンプルではなく、入力サンプルの母集団の類似性を厳密に判定することができるため、適切な判定が可能になる。
また、実施の形態3に係る学習モデル検索システム100は、基底変換及び正規化を行って得られたベクトルz^→を用いて統計的仮説検定を行う。これにより、入力ベクトルの要素毎に検定を行うことができるため、高次元の入力ベクトルに対しても、既存の低次元の統計的仮説検定の手法を用いることが可能である。
実施の形態4.
実施の形態4は、2次元画像化された画像データに代えて、m次元主成分空間のベクトルz^→の平均ベクトルのコサイン類似度を統計量として用いる点が実施の形態1と異なる。実施の形態4では、この異なる点を説明して、同一の点については説明を省略する。
実施の形態4は、2次元画像化された画像データに代えて、m次元主成分空間のベクトルz^→の平均ベクトルのコサイン類似度を統計量として用いる点が実施の形態1と異なる。実施の形態4では、この異なる点を説明して、同一の点については説明を省略する。
***動作の説明***
図6を参照して、実施の形態4に係る転移元装置20の第1データ送信処理を説明する。
ステップS12では、正規化部212は、zmin=0,zmax=1として、ベクトルz→を正規化してベクトルz^→を生成する。
ステップS13では、統計量計算部213は、数17に示すように、ベクトルz^→の代表値として相加平均ベクトルz^→-を計算する。

数17において、|z→|は、特徴量ベクトルz→の総数(Ny_x)である。
図6を参照して、実施の形態4に係る転移元装置20の第1データ送信処理を説明する。
ステップS12では、正規化部212は、zmin=0,zmax=1として、ベクトルz→を正規化してベクトルz^→を生成する。
ステップS13では、統計量計算部213は、数17に示すように、ベクトルz^→の代表値として相加平均ベクトルz^→-を計算する。
図12を参照して、実施の形態4に係る転移先装置30の第2データ送信処理を説明する。
ステップS22では、図6のステップS12と同様に、正規化部312は、zmin=0,zmax=1として、ベクトルz→を正規化してベクトルz^→を生成する。
ステップS23では、図6のステップS13と同様に、統計量計算部313は、ベクトルz^→の代表値として相加平均ベクトルz^→-を計算する。
ステップS22では、図6のステップS12と同様に、正規化部312は、zmin=0,zmax=1として、ベクトルz→を正規化してベクトルz^→を生成する。
ステップS23では、図6のステップS13と同様に、統計量計算部313は、ベクトルz^→の代表値として相加平均ベクトルz^→-を計算する。
図13を参照して、実施の形態2に係る検索装置10の検索処理を説明する。
ステップS31では、類似判定部113は、数18に示すように、相加平均ベクトルz^→-(T)と相加平均ベクトルz^→-(S)とのコサイン類似度を計算する。

言い換えると、類似判定部113は、第1データ及び第2データについて代表値を計算して、代表値により第1データと第2データとが類似するか否かを判定する。特に、類似判定部113は、第1データについての代表値と、第2データについての代表値とのコサイン類似度を計算することにより、第1データと第2データとが類似するか否かを判定する。
ステップS31では、類似判定部113は、数18に示すように、相加平均ベクトルz^→-(T)と相加平均ベクトルz^→-(S)とのコサイン類似度を計算する。
図23を参照して実施の形態4に係る類似判定処理を説明する。
類似度判定処理は、ステップS313の処理が図14に示す処理と異なる。ステップS313では、類似判定部113は、相加平均ベクトルz^→-(T)と相加平均ベクトルz^→-(S)とのコサイン類似度を計算して、score(yk (T),yl (S))に設定する。
類似度判定処理は、ステップS313の処理が図14に示す処理と異なる。ステップS313では、類似判定部113は、相加平均ベクトルz^→-(T)と相加平均ベクトルz^→-(S)とのコサイン類似度を計算して、score(yk (T),yl (S))に設定する。
***実施の形態4の効果***
以上のように、実施の形態4に係る学習モデル検索システム100は、ベクトルz^→の平均ベクトルのコサイン類似度により、類似するか否かを判定する。これにより、入力サンプル数によらず一度の比較で類似するか否かを判定することができるため、検索速度を一定に維持することが可能になる。
以上のように、実施の形態4に係る学習モデル検索システム100は、ベクトルz^→の平均ベクトルのコサイン類似度により、類似するか否かを判定する。これにより、入力サンプル数によらず一度の比較で類似するか否かを判定することができるため、検索速度を一定に維持することが可能になる。
***他の構成***
<変形例8>
実施の形態4では、代表値として相加平均ベクトルを用いた。しかし、代表値として、刈込平均と、中央値と、四分位点と、重心と、最頻値と、k近傍といった値を用いてもよい。
<変形例8>
実施の形態4では、代表値として相加平均ベクトルを用いた。しかし、代表値として、刈込平均と、中央値と、四分位点と、重心と、最頻値と、k近傍といった値を用いてもよい。
なお、上記説明において、数19に示すベクトルを本文中でz→と表記する。また、数20に示す正規化されたベクトルを本文中でz^→と表記する。また、数21に示す相加平均ベクトルをz^→-と表記する。また、本文中でx_yと表記した場合には、xyを意味する。



以上、この発明の実施の形態及び変形例について説明した。これらの実施の形態及び変形例のうち、いくつかを組み合わせて実施してもよい。また、いずれか1つ又はいくつかを部分的に実施してもよい。なお、この発明は、以上の実施の形態及び変形例に限定されるものではなく、必要に応じて種々の変更が可能である。
100 学習モデル検索システム、10 検索装置、11 プロセッサ、12 メモリ、13 ストレージ、14 通信インタフェース、15 電子回路、111 第1取得部、112 第2取得部、113 類似判定部、114 写像生成部、115 データ送信部、131 学習モデル記憶部、132 統計量記憶部、20 転移元装置、21 プロセッサ、22 メモリ、23 ストレージ、24 通信インタフェース、25 電子回路、211 基底変換部、212 正規化部、213 統計量計算部、214 データ送信部、231 学習モデル記憶部、232 訓練データ記憶部、30 転移先装置、31 プロセッサ、32 メモリ、33 ストレージ、34 通信インタフェース、35 電子回路、311 基底変換部、312 正規化部、313 統計量計算部、314 データ送信部、315 データ取得部、316 学習モデル生成部、317 入力データ変換部、318 出力ラベル変換部、40 伝送路、50 センサ、60 センサ。
Claims (15)
- 転移元装置における特徴量ベクトルを、特徴軸毎の情報量を基準として基底変換して得られた第1データを取得する第1取得部と、
転移先装置における特徴量ベクトルを、特徴軸毎の情報量を基準として基底変換して得られた第2データを取得する第2取得部と、
前記第1取得部によって取得された前記第1データと、前記第2取得部によって取得された前記第2データとが類似するか否かを判定する類似判定部と
を備える検索装置。 - 前記第1データ及び前記第2データは、前記特徴量ベクトルが基底変換された後に、前記特徴量ベクトルのスケールが正規化されて得られた
請求項1に記載の検索装置。 - 前記第1データ及び前記第2データは、前記特徴量ベクトルが正規化された後に、2次元画像化された画像データの画素値の分布の統計量が計算されて得られた
請求項2に記載の検索装置。 - 前記類似判定部は、前記第1データと前記第2データとの増減の関係の類似性に基づき、前記第1データと前記第2データとが類似するか否かを判定する
請求項3に記載の検索装置。 - 前記第1データ及び前記第2データは、前記特徴量ベクトルが正規化された後に、前記特徴軸毎の値の分布の統計量が計算されて得られた
請求項2に記載の検索装置。 - 前記類似判定部は、各特徴軸を対象として、対象の特徴軸についての前記第1データと前記第2データとの増減の関係の類似性に対して、前記対象の特徴軸の情報量に応じて重み付けして得られた結果を線形結合して、前記第1データと前記第2データとが類似するか否かを判定する
請求項5に記載の検索装置。 - 前記類似判定部は、各特徴軸を対象として、対象の特徴軸についての前記第1データと前記第2データとの類似性を統計的仮説検定により特定して、前記類似性に対して、前記対象の特徴軸の情報量に応じて重み付けして得られた結果を線形結合して、前記第1データと前記第2データとが類似するか否かを判定する
請求項2に記載の検索装置。 - 前記類似判定部は、前記第1データ及び前記第2データについて代表値を計算して、前記代表値により前記第1データと前記第2データとが類似するか否かを判定する
請求項2に記載の検索装置。 - 前記類似判定部は、前記第1データについての前記代表値と、前記第2データについての前記代表値とのコサイン類似度を計算することにより、前記第1データと前記第2データとが類似するか否かを判定する
請求項8に記載の検索装置。 - 前記検索装置は、さらに、
前記第1データと前記第2データとが類似すると前記類似判定部によって判定された場合に、前記第1データを生成した際の基底変換と、前記第2データが生成された際の基底変換とに基づき、前記転移先装置における特徴量ベクトルを前記転移元装置における特徴量ベクトルに合わせるためのデータ写像を生成する写像生成部
を備える請求項1から9までのいずれか1項に記載の検索装置。 - 前記転移元装置における特徴量ベクトルと、前記転移先装置における特徴量ベクトルとには、要素毎にラベルが付されており、
前記写像生成部は、前記第1データと前記第2データとの類似度に基づき、前記第1データのラベルと前記第2データのラベルとの間の対応関係を示すラベル写像を生成する
請求項10に記載の検索装置。 - 第1取得部が、転移元装置における特徴量ベクトルを、特徴軸毎の情報量を基準として基底変換して得られた第1データを取得し、
第2取得部が、転移先装置における特徴量ベクトルを、特徴軸毎の情報量を基準として基底変換して得られた第2データを取得し、
類似判定部が、前記第1データと前記第2データとが類似するか否かを判定する検索方法。 - 転移元装置における特徴量ベクトルを、特徴軸毎の情報量を基準として基底変換して得られた第1データを取得する第1取得処理と、
転移先装置における特徴量ベクトルを、特徴軸毎の情報量を基準として基底変換して得られた第2データを取得する第2取得処理と、
前記第1取得処理によって取得された前記第1データと、前記第2取得処理によって取得された前記第2データとが類似するか否かを判定する類似判定処理と
を行う検索装置としてコンピュータを機能させる検索プログラム。 - 検索装置と転移先装置とを備える学習モデル検索システムであり、
前記検索装置は、
転移元装置における特徴量ベクトルを、特徴軸毎の情報量を基準として基底変換して得られた第1データを取得する第1取得部と、
前記転移先装置における特徴量ベクトルを、特徴軸毎の情報量を基準として基底変換して得られた第2データを取得する第2取得部と、
前記第1取得部によって取得された前記第1データと、前記第2取得部によって取得された前記第2データとが類似するか否かを判定する類似判定部と
を備え、
前記転移先装置は、前記類似判定部によって前記第1データと前記第2データとが類似すると判定された場合に、前記転移元装置の学習モデルに基づき学習モデルを生成する学習モデル生成部
を備える学習モデル検索システム。 - 前記第1取得部は、複数の転移元装置それぞれを対象として、対象の転移元装置についての前記第1データを取得し、
前記類似判定部は、前記複数の転移元装置それぞれを対象として、対象の転移元装置についての前記第1データと、前記第2データとが類似するか否かを判定し、
前記学習モデル生成部は、2つ以上の転移元装置についての前記第1データと前記第2データとが類似すると判定された場合には、前記2つ以上の転移元装置の学習モデルに基づき学習モデルを生成する
請求項14に記載の学習モデル検索システム。
Priority Applications (5)
| Application Number | Priority Date | Filing Date | Title |
|---|---|---|---|
| CN201980101139.6A CN114503131A (zh) | 2019-10-16 | 2019-10-16 | 检索装置、检索方法、检索程序和学习模型检索系统 |
| PCT/JP2019/040614 WO2021074990A1 (ja) | 2019-10-16 | 2019-10-16 | 検索装置、検索方法、検索プログラム及び学習モデル検索システム |
| JP2021552029A JP6991412B2 (ja) | 2019-10-16 | 2019-10-16 | 検索装置、検索方法、検索プログラム及び学習モデル検索システム |
| EP19948895.8A EP4033417A4 (en) | 2019-10-16 | 2019-10-16 | Search device, search method, search program, and learning model search system |
| US17/677,451 US20220179912A1 (en) | 2019-10-16 | 2022-02-22 | Search device, search method and learning model search system |
Applications Claiming Priority (1)
| Application Number | Priority Date | Filing Date | Title |
|---|---|---|---|
| PCT/JP2019/040614 WO2021074990A1 (ja) | 2019-10-16 | 2019-10-16 | 検索装置、検索方法、検索プログラム及び学習モデル検索システム |
Related Child Applications (1)
| Application Number | Title | Priority Date | Filing Date |
|---|---|---|---|
| US17/677,451 Continuation US20220179912A1 (en) | 2019-10-16 | 2022-02-22 | Search device, search method and learning model search system |
Publications (1)
| Publication Number | Publication Date |
|---|---|
| WO2021074990A1 true WO2021074990A1 (ja) | 2021-04-22 |
Family
ID=75538723
Family Applications (1)
| Application Number | Title | Priority Date | Filing Date |
|---|---|---|---|
| PCT/JP2019/040614 Ceased WO2021074990A1 (ja) | 2019-10-16 | 2019-10-16 | 検索装置、検索方法、検索プログラム及び学習モデル検索システム |
Country Status (5)
| Country | Link |
|---|---|
| US (1) | US20220179912A1 (ja) |
| EP (1) | EP4033417A4 (ja) |
| JP (1) | JP6991412B2 (ja) |
| CN (1) | CN114503131A (ja) |
| WO (1) | WO2021074990A1 (ja) |
Cited By (4)
| Publication number | Priority date | Publication date | Assignee | Title |
|---|---|---|---|---|
| WO2022259393A1 (ja) * | 2021-06-08 | 2022-12-15 | 日本電信電話株式会社 | 学習方法、推定方法、学習装置、推定装置、及びプログラム |
| JP2023089644A (ja) * | 2021-12-16 | 2023-06-28 | 日本電信電話株式会社 | 移行先api推定装置、移行先api推定方法及びプログラム |
| CN116701693A (zh) * | 2022-02-25 | 2023-09-05 | 中移(上海)信息通信科技有限公司 | 一种互联网服务信息确定方法、装置和电子设备 |
| WO2023181222A1 (ja) * | 2022-03-23 | 2023-09-28 | 日本電信電話株式会社 | 学習装置、学習方法、および、学習プログラム |
Families Citing this family (2)
| Publication number | Priority date | Publication date | Assignee | Title |
|---|---|---|---|---|
| JP7353940B2 (ja) * | 2019-11-26 | 2023-10-02 | 株式会社日立製作所 | 転移可能性判定装置、転移可能性判定方法、及び転移可能性判定プログラム |
| CN116226297B (zh) * | 2023-05-05 | 2023-07-25 | 深圳市唯特视科技有限公司 | 数据模型的可视化搜索方法、系统、设备及存储介质 |
Citations (3)
| Publication number | Priority date | Publication date | Assignee | Title |
|---|---|---|---|---|
| US20160253597A1 (en) * | 2015-02-27 | 2016-09-01 | Xerox Corporation | Content-aware domain adaptation for cross-domain classification |
| JP2016191975A (ja) | 2015-03-30 | 2016-11-10 | 株式会社メガチップス | 機械学習装置 |
| JP2017224156A (ja) * | 2016-06-15 | 2017-12-21 | キヤノン株式会社 | 情報処理装置、情報処理方法及びプログラム |
Family Cites Families (8)
| Publication number | Priority date | Publication date | Assignee | Title |
|---|---|---|---|---|
| EP2186040B1 (en) * | 2007-09-11 | 2018-11-07 | GenKey Netherlands B.V. | Method for transforming a feature vector |
| US9064491B2 (en) * | 2012-05-29 | 2015-06-23 | Nuance Communications, Inc. | Methods and apparatus for performing transformation techniques for data clustering and/or classification |
| US11137462B2 (en) * | 2016-06-10 | 2021-10-05 | Board Of Trustees Of Michigan State University | System and method for quantifying cell numbers in magnetic resonance imaging (MRI) |
| CN108959522B (zh) * | 2018-04-26 | 2022-06-17 | 浙江工业大学 | 基于半监督对抗生成网络的迁移检索方法 |
| US20190354850A1 (en) * | 2018-05-17 | 2019-11-21 | International Business Machines Corporation | Identifying transfer models for machine learning tasks |
| US11093714B1 (en) * | 2019-03-05 | 2021-08-17 | Amazon Technologies, Inc. | Dynamic transfer learning for neural network modeling |
| US11475128B2 (en) * | 2019-08-16 | 2022-10-18 | Mandiant, Inc. | System and method for heterogeneous transferred learning for enhanced cybersecurity threat detection |
| US11544796B1 (en) * | 2019-10-11 | 2023-01-03 | Amazon Technologies, Inc. | Cross-domain machine learning for imbalanced domains |
-
2019
- 2019-10-16 CN CN201980101139.6A patent/CN114503131A/zh active Pending
- 2019-10-16 WO PCT/JP2019/040614 patent/WO2021074990A1/ja not_active Ceased
- 2019-10-16 JP JP2021552029A patent/JP6991412B2/ja active Active
- 2019-10-16 EP EP19948895.8A patent/EP4033417A4/en not_active Ceased
-
2022
- 2022-02-22 US US17/677,451 patent/US20220179912A1/en not_active Abandoned
Patent Citations (3)
| Publication number | Priority date | Publication date | Assignee | Title |
|---|---|---|---|---|
| US20160253597A1 (en) * | 2015-02-27 | 2016-09-01 | Xerox Corporation | Content-aware domain adaptation for cross-domain classification |
| JP2016191975A (ja) | 2015-03-30 | 2016-11-10 | 株式会社メガチップス | 機械学習装置 |
| JP2017224156A (ja) * | 2016-06-15 | 2017-12-21 | キヤノン株式会社 | 情報処理装置、情報処理方法及びプログラム |
Non-Patent Citations (3)
| Title |
|---|
| MASASHI SUGIYAMAMAKOTO YAMADAMARTHINUS CHRISTOFFEL DU PLESSISSONG LIU, LEARNING UNDER NON-STATIONARITY: COVARIATE SHIFT ADAPTATION, CLASS-BALANCE CHANGE ADAPTATION, AND CHANGE DETECTION, NIHON TOKEI GAKKAI SHI, vol. 44, 2014, pages 113 - 136 |
| MORI IKUMI, SAITO SHIHO: "A Study on Optimisation of Machine Learning Realization In Edge Computing ~A Study on Optimisation by Deciding Edge executable Algorithm and Ontology and Applying Transfer Learning~", IPSJ SIG TECHNICAL REPORT, no. 2, 24 January 2019 (2019-01-24), pages 1 - 8, XP055819440, ISSN: 2188-8906, Retrieved from the Internet <URL:https://ipsj.ixsq.nii.ac.jp/ej/?action=repository_uri&item_id=194230&file_id=1&file_no=1> [retrieved on 20190128] * |
| See also references of EP4033417A4 |
Cited By (9)
| Publication number | Priority date | Publication date | Assignee | Title |
|---|---|---|---|---|
| WO2022259393A1 (ja) * | 2021-06-08 | 2022-12-15 | 日本電信電話株式会社 | 学習方法、推定方法、学習装置、推定装置、及びプログラム |
| JPWO2022259393A1 (ja) * | 2021-06-08 | 2022-12-15 | ||
| JP7548431B2 (ja) | 2021-06-08 | 2024-09-10 | 日本電信電話株式会社 | 学習方法、推定方法、学習装置、推定装置、及びプログラム |
| JP2023089644A (ja) * | 2021-12-16 | 2023-06-28 | 日本電信電話株式会社 | 移行先api推定装置、移行先api推定方法及びプログラム |
| JP7571719B2 (ja) | 2021-12-16 | 2024-10-23 | 日本電信電話株式会社 | 移行先api推定装置、移行先api推定方法及びプログラム |
| CN116701693A (zh) * | 2022-02-25 | 2023-09-05 | 中移(上海)信息通信科技有限公司 | 一种互联网服务信息确定方法、装置和电子设备 |
| WO2023181222A1 (ja) * | 2022-03-23 | 2023-09-28 | 日本電信電話株式会社 | 学習装置、学習方法、および、学習プログラム |
| JPWO2023181222A1 (ja) * | 2022-03-23 | 2023-09-28 | ||
| JP7670230B2 (ja) | 2022-03-23 | 2025-04-30 | 日本電信電話株式会社 | 学習装置、学習方法、および、学習プログラム |
Also Published As
| Publication number | Publication date |
|---|---|
| EP4033417A1 (en) | 2022-07-27 |
| CN114503131A (zh) | 2022-05-13 |
| EP4033417A4 (en) | 2022-10-12 |
| JPWO2021074990A1 (ja) | 2021-04-22 |
| US20220179912A1 (en) | 2022-06-09 |
| JP6991412B2 (ja) | 2022-02-03 |
Similar Documents
| Publication | Publication Date | Title |
|---|---|---|
| JP6991412B2 (ja) | 検索装置、検索方法、検索プログラム及び学習モデル検索システム | |
| Xiao et al. | Domain adaptive motor fault diagnosis using deep transfer learning | |
| CN113435546B (zh) | 基于区分置信度水平的可迁移图像识别方法及系统 | |
| Gao et al. | SAR image change detection based on multiscale capsule network | |
| CN112955837B (zh) | 异常诊断装置、异常诊断方法、及程序 | |
| CN110940523B (zh) | 一种无监督域适应故障诊断方法 | |
| CN112836753B (zh) | 用于域自适应学习的方法、装置、设备、介质和产品 | |
| CN116894186A (zh) | 一种工业过程时序数据生成方法及系统 | |
| CN119477288A (zh) | 基于人工智能的设备预测性维护方法及装置 | |
| CN116561641B (zh) | 一种基于多视图生成算法的工业设备故障诊断方法及系统 | |
| CN115049852B (zh) | 一种轴承故障诊断方法、装置、存储介质及电子设备 | |
| CN117237930A (zh) | 基于ResNet与迁移学习的腐蚀金具SEM图像识别方法 | |
| CN113033817B (zh) | 基于隐空间的ood检测方法、装置、服务器及存储介质 | |
| CN119004044B (zh) | 一种基于加权对抗的轴承故障诊断方法、装置及设备 | |
| CN119027741B (zh) | 基于数字孪生与特征迁移的结构损伤识别方法 | |
| CN115017812A (zh) | 基于多源数据的找矿预测方法、装置以及电子设备 | |
| US12430880B2 (en) | Method and system performing pattern clustering | |
| CN118260540A (zh) | 一种基于条件生成对抗网络的重力波仪数据补全模型及方法 | |
| Song et al. | Exploring information-theoretic metrics associated with neural collapse in supervised training | |
| CN117951554A (zh) | 基于多维数据预测用户的违约概率的方法及设备 | |
| CN117152490A (zh) | 一种海冰海水分类方法、系统、存储介质及电子设备 | |
| Zhang et al. | Underwater target recognition method based on domain adaptation | |
| CN114359809B (zh) | 分类及分类模型的训练方法、装置、设备及介质 | |
| CN119649109B (zh) | 基于多样性困难负样本挖掘的模型训练方法、装置和设备 | |
| WO2021171384A1 (ja) | クラスタリング装置、クラスタリング方法、および、クラスタリングプログラム |
Legal Events
| Date | Code | Title | Description |
|---|---|---|---|
| 121 | Ep: the epo has been informed by wipo that ep was designated in this application |
Ref document number: 19948895 Country of ref document: EP Kind code of ref document: A1 |
|
| ENP | Entry into the national phase |
Ref document number: 2021552029 Country of ref document: JP Kind code of ref document: A |
|
| NENP | Non-entry into the national phase |
Ref country code: DE |
|
| ENP | Entry into the national phase |
Ref document number: 2019948895 Country of ref document: EP Effective date: 20220419 |