WO2021090842A1 - 工作機械および表示装置 - Google Patents
工作機械および表示装置 Download PDFInfo
- Publication number
- WO2021090842A1 WO2021090842A1 PCT/JP2020/041229 JP2020041229W WO2021090842A1 WO 2021090842 A1 WO2021090842 A1 WO 2021090842A1 JP 2020041229 W JP2020041229 W JP 2020041229W WO 2021090842 A1 WO2021090842 A1 WO 2021090842A1
- Authority
- WO
- WIPO (PCT)
- Prior art keywords
- feature amount
- ball screw
- unit
- machine tool
- detected
- Prior art date
- Legal status (The legal status is an assumption and is not a legal conclusion. Google has not performed a legal analysis and makes no representation as to the accuracy of the status listed.)
- Ceased
Links
Images


Classifications
-
- B—PERFORMING OPERATIONS; TRANSPORTING
- B23—MACHINE TOOLS; METAL-WORKING NOT OTHERWISE PROVIDED FOR
- B23Q—DETAILS, COMPONENTS, OR ACCESSORIES FOR MACHINE TOOLS, e.g. ARRANGEMENTS FOR COPYING OR CONTROLLING; MACHINE TOOLS IN GENERAL CHARACTERISED BY THE CONSTRUCTION OF PARTICULAR DETAILS OR COMPONENTS; COMBINATIONS OR ASSOCIATIONS OF METAL-WORKING MACHINES, NOT DIRECTED TO A PARTICULAR RESULT
- B23Q5/00—Driving or feeding mechanisms; Control arrangements therefor
- B23Q5/22—Feeding members carrying tools or work
- B23Q5/34—Feeding other members supporting tools or work, e.g. saddles, tool-slides, through mechanical transmission
- B23Q5/38—Feeding other members supporting tools or work, e.g. saddles, tool-slides, through mechanical transmission feeding continuously
- B23Q5/40—Feeding other members supporting tools or work, e.g. saddles, tool-slides, through mechanical transmission feeding continuously by feed shaft, e.g. lead screw
-
- B—PERFORMING OPERATIONS; TRANSPORTING
- B23—MACHINE TOOLS; METAL-WORKING NOT OTHERWISE PROVIDED FOR
- B23Q—DETAILS, COMPONENTS, OR ACCESSORIES FOR MACHINE TOOLS, e.g. ARRANGEMENTS FOR COPYING OR CONTROLLING; MACHINE TOOLS IN GENERAL CHARACTERISED BY THE CONSTRUCTION OF PARTICULAR DETAILS OR COMPONENTS; COMBINATIONS OR ASSOCIATIONS OF METAL-WORKING MACHINES, NOT DIRECTED TO A PARTICULAR RESULT
- B23Q17/00—Arrangements for observing, indicating or measuring on machine tools
- B23Q17/12—Arrangements for observing, indicating or measuring on machine tools for indicating or measuring vibration
-
- B—PERFORMING OPERATIONS; TRANSPORTING
- B23—MACHINE TOOLS; METAL-WORKING NOT OTHERWISE PROVIDED FOR
- B23Q—DETAILS, COMPONENTS, OR ACCESSORIES FOR MACHINE TOOLS, e.g. ARRANGEMENTS FOR COPYING OR CONTROLLING; MACHINE TOOLS IN GENERAL CHARACTERISED BY THE CONSTRUCTION OF PARTICULAR DETAILS OR COMPONENTS; COMBINATIONS OR ASSOCIATIONS OF METAL-WORKING MACHINES, NOT DIRECTED TO A PARTICULAR RESULT
- B23Q17/00—Arrangements for observing, indicating or measuring on machine tools
-
- G—PHYSICS
- G01—MEASURING; TESTING
- G01M—TESTING STATIC OR DYNAMIC BALANCE OF MACHINES OR STRUCTURES; TESTING OF STRUCTURES OR APPARATUS, NOT OTHERWISE PROVIDED FOR
- G01M13/00—Testing of machine parts
- G01M13/02—Gearings; Transmission mechanisms
-
- G—PHYSICS
- G01—MEASURING; TESTING
- G01M—TESTING STATIC OR DYNAMIC BALANCE OF MACHINES OR STRUCTURES; TESTING OF STRUCTURES OR APPARATUS, NOT OTHERWISE PROVIDED FOR
- G01M13/00—Testing of machine parts
- G01M13/02—Gearings; Transmission mechanisms
- G01M13/028—Acoustic or vibration analysis
-
- G—PHYSICS
- G05—CONTROLLING; REGULATING
- G05B—CONTROL OR REGULATING SYSTEMS IN GENERAL; FUNCTIONAL ELEMENTS OF SUCH SYSTEMS; MONITORING OR TESTING ARRANGEMENTS FOR SUCH SYSTEMS OR ELEMENTS
- G05B23/00—Testing or monitoring of control systems or parts thereof
- G05B23/02—Electric testing or monitoring
- G05B23/0205—Electric testing or monitoring by means of a monitoring system capable of detecting and responding to faults
- G05B23/0218—Electric testing or monitoring by means of a monitoring system capable of detecting and responding to faults characterised by the fault detection method dealing with either existing or incipient faults
- G05B23/0224—Process history based detection method, e.g. whereby history implies the availability of large amounts of data
- G05B23/024—Quantitative history assessment, e.g. mathematical relationships between available data; Functions therefor; Principal component analysis [PCA]; Partial least square [PLS]; Statistical classifiers, e.g. Bayesian networks, linear regression or correlation analysis; Neural networks
-
- G—PHYSICS
- G06—COMPUTING OR CALCULATING; COUNTING
- G06T—IMAGE DATA PROCESSING OR GENERATION, IN GENERAL
- G06T11/00—Two-dimensional [2D] image generation
- G06T11/20—Drawing from basic elements
- G06T11/23—Drawing from basic elements using straight lines or curves
-
- G—PHYSICS
- G05—CONTROLLING; REGULATING
- G05B—CONTROL OR REGULATING SYSTEMS IN GENERAL; FUNCTIONAL ELEMENTS OF SUCH SYSTEMS; MONITORING OR TESTING ARRANGEMENTS FOR SUCH SYSTEMS OR ELEMENTS
- G05B19/00—Program-control systems
- G05B19/02—Program-control systems electric
- G05B19/18—Numerical control [NC], i.e. automatically operating machines, in particular machine tools, e.g. in a manufacturing environment, so as to execute positioning, movement or co-ordinated operations by means of program data in numerical form
- G05B19/406—Numerical control [NC], i.e. automatically operating machines, in particular machine tools, e.g. in a manufacturing environment, so as to execute positioning, movement or co-ordinated operations by means of program data in numerical form characterised by monitoring or safety
Definitions
- the present invention relates to a machine tool and a display device.
- Patent Document 1 discloses a technique for determining the limit of the life of a ball screw when the total energy value A applied to the ball screw exceeds the life energy value B (A ⁇ B). There is.
- An object of the present invention is to provide a technique for solving the above-mentioned problems.
- the machine tool includes a detector that detects at least one of the current, heat, light, and power values applied to drive the vibration, sound, and ball screw during warm-up operation.
- a feature amount extraction unit that extracts a first feature amount and a second feature amount from the detected value detected by the detection unit, and a feature amount extraction unit. The point where the detected value is plotted on a plane with the numerical value related to the first feature amount as the first axis and the numerical value related to the second feature amount as the second axis, and the possibility that an abnormality occurs in the ball screw. It is provided with at least two boundary lines arranged in a contour line to represent, and a display unit for displaying.
- the display device is Detected value detected from a machine tool having a detector that detects at least one of the detected values of vibration, sound, and current, heat, light, and power applied to drive the ball screw during warm-up operation. It is a display device that extracts the first feature amount and the second feature amount from the ball screw and displays the possibility that an abnormality occurs in the ball screw.
- the point where the detected value is plotted on a plane with the numerical value related to the first feature amount as the first axis and the numerical value related to the second feature amount as the second axis, and the possibility that an abnormality occurs in the ball screw. At least two borders arranged in contour lines to represent.
- the state of the ball screw can be visualized in an easy-to-understand manner.
- FIG. 1 is a diagram for explaining the configuration of the machine tool 100 according to the present embodiment.
- the machine tool 100 includes a detection unit 101, a feature amount extraction unit 102, and a display unit 103.
- the detection unit 101 detects at least one of vibration, sound, current, heat, light, and power value applied to drive the ball screw 110 during warm-up operation.
- the feature amount extraction unit 102 extracts the first feature amount and the second feature amount from the detection value detected by the detection unit 101.
- the display unit 103 plots the detected values on a plane having the numerical value related to the first feature amount as the first axis 134 and the numerical value related to the second feature amount as the second axis 135 (T1 to T16 in the figure). And at least two boundary lines 132 and 133 arranged in a contour line to indicate the possibility that an abnormality occurs in the ball screw 110.
- the points (T1 to T10 in the figure) displayed inside the first boundary line 132 displayed on the display unit 103 indicate that the ball screw 110 is operating normally.
- the points (T11 to T14) displayed between the boundary line 132 and the boundary line 133 are considered to be a sign of a slight abnormality (a sign of a decrease in accuracy due to a ball screw breakage) that does not affect the machining although it is operating normally. (Abnormality) may occur.
- the points (T15 to T16) displayed on the outside of the boundary line 133 indicate that an abnormality that affects the machining accuracy may occur.
- the boundaries shown here can be set arbitrarily. Therefore, it is possible to set a boundary so that the area indicating normal operation is separated by a plurality of boundary lines and displayed, and the outermost area is displayed to indicate that an abnormality occurs.
- the machine tool 100 in the present invention is not limited to the form shown in FIG. 1, and includes an additive manufacturing machine that processes by adhering a material, a subtractive manufacturing machine that removes the material, a laser, and the like. It may be a machine that irradiates light to process. Specifically, lathes, drilling machines, boring machines, milling machines, gear cutting machines, grinding machines, multi-axis machines, laser machines, laminating machines and the like are included. These perform various processes such as turning, cutting, drilling, grinding, polishing, rolling, forging, bending, molding, microfabrication, and lathe processing on workpieces such as metal, wood, stone, and resin. .. A multifunction device that combines these processes is also included.
- the possibility that an abnormality occurs in the ball screw is displayed as a two-dimensional map, the state of the ball screw can be visualized in an easy-to-understand manner. Further, since the possibility of an abnormality occurring in the ball screw can be accurately determined, damage to the ball screw can be prevented, and for example, a decrease in productivity due to replacement of the ball screw can be prevented.
- FIG. 2 is a diagram for explaining the appearance of the machine tool and the ball screw according to the present embodiment.
- the machine tool 200 of the second embodiment will be described using a multifunction device.
- the machine tool 200 has a ball screw 210, a stage 211 and a motor 212.
- the rotation of the motor 212 is transmitted to the ball screw 210, and the stage 211 reciprocates due to the rotational driving force of the ball screw 210.
- the ball screw 210 is one of the machine element parts composed of a screw shaft, a nut, a ball, and the like, and is for converting a linear motion into a rotary motion or converting a rotary motion into a linear motion.
- FIG. 3A is a diagram showing an example of a one-dimensional graph as a prerequisite technique of the present embodiment.
- a graph 351 in which the current value applied to the motor 212 is set on the vertical axis 356 and the times T1 to T16 are set on the horizontal axis 357 is displayed.
- the timing of T15 is actually the appropriate alert timing.
- FIG. 3B is a diagram showing an internal configuration of the machine tool 200 according to the present embodiment.
- the machine tool 200 includes a detection unit 301, a feature amount extraction unit 302, a display unit 303, a correction unit 304, an operation unit 305, a boundary data holding unit 306, an abnormality determination unit 308, and a boundary data generation unit 309.
- the machine tool 200 displays a two-dimensional map 331 for determining the possibility that an abnormality occurs in the ball screw on the display unit 303 based on the detection value detected by the detection unit 301.
- the detection unit 301 detects the current value applied to rotate the motor 212 in the warm-up operation of the machine tool 200, and outputs it as a detected value.
- the detection unit 301 includes a current sensor provided in the UVW phase of three-phase alternating current and an AD converter that converts the measured current value into digital data.
- the sampling frequency of the AD converter is set to 2 kHz, and the signal is converted into a 16-bit signal.
- 256 points of time-series data can be acquired and can be used as input data every 128 msec.
- warm-up operation means to perform operation with a low load for a certain period of time immediately after starting the machine.
- the warm-up operation is performed in order to promote the familiarity between the component parts of the machine by operating at a low load and to ensure the smooth and reliable operation of each part.
- lubricating oil can be distributed to each part, and the gap (clearance) between parts can be guided to an appropriate state so that the machine can exhibit its original performance.
- the detection unit 301 calculates the Q-axis current i q and the D-axis current i d with respect to the digital current value output from the AD converter using the conversion formula of the equation (1).
- the Q-axis current i q is the effective current
- the D-axis current i d is the reactive current.
- the detection unit 301 sends the Q-axis current i q as a detection value to the feature amount extraction unit 302.
- the feature amount extraction unit 302 has a frequency decomposition unit 321 and a normalization unit 322 and a dimension compression unit 323.
- the frequency decomposition unit 321 extracts a frequency component from the detected value received from the detection unit 301 by using, for example, a Fourier transform.
- the normalization unit 322 normalizes the data after frequency decomposition.
- the dimension compression unit 323 compresses the dimension of the normalized data to generate a two-dimensional feature amount (data having a first feature amount component and a second feature amount component).
- the feature amount extraction unit 302 is a processor for executing a predetermined program.
- the display unit 303 displays a two-dimensional map 331 showing the possibility that an abnormality occurs in the ball screw 210 based on the two-dimensional feature amount data extracted by the dimensional compression unit 323.
- the two-dimensional map 331 includes a plane in which the first feature amount generated by the dimensional compression unit 323 is the first axis 332 and the second feature amount is the second axis 333.
- the features of the detected values are plotted on the plane (T1 to T16).
- the display unit 303 displays on the screen the boundary lines (three boundary lines 334 to 336 in this example) arranged in a contour line in order to indicate the possibility that an abnormality occurs in the ball screw 210.
- "abnormality" means damage to the ball screw 210.
- the two-dimensional map 331 shows that the farther the feature amount of the plotted detection values is from the center of the innermost boundary line 334 to the outside, the higher the possibility that an abnormality will occur.
- the feature quantities (T1, T8, T9 %) of the detected values plotted inside the boundary line 334 can be judged to be in a normal operating state because the possibility of an abnormality occurring is extremely low. That is, the user who sees the two-dimensional map 331 can operate the machine tool 200 with peace of mind if a point representing the feature amount of the detected value is displayed only inside the boundary line 334.
- the user judges that the operating state is less than a predetermined value although the possibility of abnormality is low, and carefully operates the machine tool 200. Just let me do it. For example, it is possible to clean chips inside the machine tool, check and inject lubricating oil, and set the rotation speed of the motor 212 to a rotation speed at which the ball screw 210 is unlikely to be damaged. Further, if there is a feature amount of the detected value between the boundary line 334 and the boundary line 335, the user should start considering replacement of the ball screw 210 or the like.
- the ball screw 210 is likely to be damaged immediately, so that the ball screw 210 can be replaced quickly. Should be done.
- the display unit 303 Each time the detection unit 301 detects a detected value, the display unit 303 additionally displays a point on which the characteristics of the detected value are plotted, and at the same time displays a boundary line that serves as a criterion for determining normality or abnormality.
- the display unit 303 may be, for example, a display provided as a part of the machine tool 200, or a display outside the machine tool 200. Alternatively, a projector may be used to project the two-dimensional map 331 onto the screen.
- the display device includes vibration (vibration frequency and amplitude) generated on the spindle detected as a detection value during warm-up operation, internal sound of the machine tool 200 (volume and frequency of sound detected by the microphone), and so on.
- Information about the two-dimensional map 331 may be held by the display device side.
- the power value is generally a value obtained by dividing the amount of work (specific cutting resistance x depth of cut x feed x cutting speed) by 60 x 1,000 x mechanical efficiency, and is called the main spindle power (Pc).
- the electric power value of the motor consumed in cutting or turning is included.
- the cutting torque or the rotation speed of the tool may be used as the detection value.
- the correction unit 304 corrects the two-dimensional map 331 displayed by the display unit 303 according to an instruction from the user. Specifically, as shown in FIG. 3C, the correction unit 304 corrects the shape of the boundary line 334 of the two-dimensional map 331 in the direction of expanding to the lower left side. The user can widen the range of normal detection values by widening the boundary line 334. By correcting the shape of the boundary line 334 by a veteran user who can determine normality or abnormality, other users who use the machine can follow the judgment of the veteran user. In the example of FIG. 3C, an example is shown in which the boundary line 334 is corrected so as to be within the boundary line 334 so that the points T12 to T14 fit inside the boundary line 334.
- the two-dimensional map 331 can be displayed according to the user's usage environment by configuring the shape of the boundary lines 334 to 336 of the drawn two-dimensional map 331 to be corrected.
- the user may change the shape of the boundary lines 334 to 336 by dragging a part of the boundary lines 334 to 336 using the operation unit 305 such as a mouse. Further, the shape of the boundary lines 334 to 336 may be changed by inputting a numerical value using an operation unit 305 such as a keyboard. In addition, data on the corrected boundary line may be saved in the cloud and shared with other machine tools.
- the abnormality determination unit 308 determines whether or not there is an abnormality based on the characteristics of the detection value extracted by the feature amount extraction unit 302. The abnormality determination unit 308 passes the determination result to the boundary data generation unit 309.
- the boundary data generation unit 309 generates a boundary line between the points determined to be normal and the points determined to be abnormal in the abnormality determination unit 308.
- the boundary data holding unit 306 holds the data of the boundary lines 334 to 336 of the two-dimensional map 331 displayed on the display unit 303.
- the correction unit 304 corrects the shape of the boundary lines 334 to 336 by changing the data of the boundary lines 334 to 336 held by the boundary data holding unit 306.
- the frequency decomposition unit (FFT in the figure) 321 extracts the frequency component of the current value detected by the detection unit 301 during the warm-up operation by the machine tool 200, and generates a frequency spectrum.
- the frequency decomposition is performed by, for example, FFT (Fast Fourier Transform), but is not limited thereto.
- any periodic time series data y t can be thought of as the sum of trigonometric functions of various periods. This is called a Fourier series expansion, and the Fourier series of the observed value y t whose basic period is T 0 [s] can be expressed by Eq. (2) using a complex number.
- ⁇ 0 2 ⁇ f 0 [rad / s] is the fundamental angular frequency
- f 0 1 / T 0 [Hz] is the fundamental frequency.
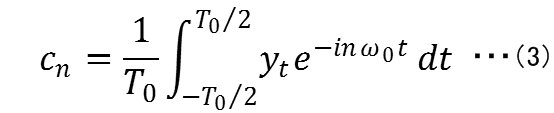
- the complex Fourier coefficient c n can be obtained by the following equation (3).
- the sampling frequency is 2 kHz and the window length is 256 points
- the maximum frequency f max after FFT is 1 kHz
- the frequency resolution ⁇ f is 7.8125 Hz. That is, 256 points of time series data can be represented by a vector of 128 points when FFT is performed, and this vector becomes an input to the next autoencoder.
- the 128-point vector is normalized by the normalization unit 322 and sent to the dimension compression unit 323.
- the dimensional compression unit 323 performs dimensional compression using an autoencoder 361 and a PCA (Principal Component Analysis) 362.
- the autoencoder 361 is an algorithm for dimension compression using a neural network in machine learning, and is an algorithm capable of extracting features having an overwhelmingly smaller number of dimensions than the number of dimensions of an input sample.
- the applied current value is frequency-decomposed by the frequency decomposition unit 321 into data represented by a multidimensional vector (here, 128 dimensions). Then, the frequency-decomposed multidimensional vector (128 dimensions) is used as the input of the dimensional compression unit 323.
- the intermediate layer of the autoencoder 361 of the dimensional compression unit 323 By setting the intermediate layer of the autoencoder 361 of the dimensional compression unit 323 to a low dimension, the vector input of a plurality of dimensions is dimensionally compressed to a low dimension.
- an autoencoder 361 uses the same data for an input layer and an output layer in a three-layer neural network, compresses the input layer to an intermediate layer, and then repeatedly restores the output layer, and has a high recall rate. It derives the middle layer.
- the intermediate layer is set to 64 dimensions. That is, the 128-dimensional vector input to the dimensional compression unit 323 is compressed to 64 dimensions while maintaining the features as much as possible. For example, when the vector after FFT is 128 dimensions, it can be made 64 dimensions or 10 dimensions by the autoencoder 361. The learning of the autoencoder 361 and the processing using the trained model will be described below.
- the encoder unit is represented by the following equation (7).
- the decoder unit is represented by the following equation (8).
- W' is a transposed matrix of W
- the parameters to be obtained are W, b, and b'.
- ⁇ 1 and ⁇ 2 ⁇ [0, 1) are hyperparameters.
- the following values, which are recommended values of Adam, may be used, or may be adjusted based on the recommended values.
- the learned autoencoder encoder is used for dimensional compression. For example, when the vector after FFT is 128 dimensions and the intermediate layer is set to 64 dimensions and the autoencoder is trained, the input is 128 dimensions. 64 dimensional compressed from Is output.
- PCA Principal Component Analysis
- Processing Dimension compression is performed using the principal component V obtained by learning.
- the vector dimension after the autoencoder processing is 64 dimensions
- the 64-dimensional input X 64 can be set to be dimensionally compressed into the two-dimensional vector Z 2.
- SVM (Support Vector Machine) 363 is a pattern recognition method originally intended for two-class classification, and SVM363 seeks an optimum separation hyperplane that maximizes the margin.
- the margin is the distance between the sample closest to the separation hyperplane and the separation hyperplane.
- the maximized margin (distance) is represented by f (x).
- the SVM363 is a One Class SVM (One Class SVM), which is an extension of a normal SVM, and constructs a model that maps normal data to a non-negative value and abnormal data to a negative value. That is, One Class SVM is a method of performing learning based on a set of data in which the majority is normal, and determining whether the unknown data is normal or abnormal. In general, although a lot of data on normally made products and normal conditions can be obtained, data on abnormal products and abnormal conditions cannot be obtained very much. One for such cases It is possible to apply Class SVM.
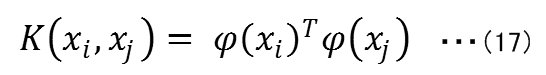
- SVM uses a nonlinear function to map the model construction data to a high-dimensional space and obtain a separation hyperplane in the high-dimensional space. This is equivalent to finding a non-linear separation boundary in the original low-dimensional space. It is mapped to a higher dimensional space using the kernel function K.
- x i is the first feature quantity
- x j is the second feature quantity.
- ⁇ is a non-linear function.
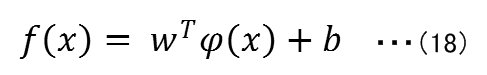
- the distance f (x) determined by the SVM model is expressed by the following equation (18).
- w is a weight vector and b is a bias.
- the new sample x can be identified by the sign of f (x).
- Model construction in One Class SVM is formulated as SVM when normal data for model construction is regarded as the same class and the origin is regarded as the other class. That is, the margin in One Class SVM is defined as the distance between the origin and the sample closest to the origin, and the margin maximization problem is formulated as in the following equation (19).
- ⁇ ⁇ (0, 1) is the error rate when the model construction data is identified by the constructed One Class SVM model. ..
- this optimization problem is rewritten as the following equation (20).
- Equation (21) can be derived by Lagrange's undetermined multiplier method.
- both normal data and abnormal data are required to build an identification model such as an anomaly detection model.
- an identification model such as an anomaly detection model.
- the discriminative model can be constructed only from normal data.
- One Class SVM outputs the distance f (x) from the hyperplane. Normal or abnormal can be determined based on the distance f (x).
- the distance f (x) has a negatively large value for abnormal data and a positively large value for normal data.
- the boundary data generation unit 309 generates a boundary line by using data having a small distance f (x), that is, abnormal data as an outlier.
- the abnormality determination unit 308 creates a normal range by setting the upper 0.2% as outliers in ascending order of the distance f (x). can do.
- the boundary data generation unit 309 generates a boundary line between the points determined to be normal by the abnormality score g (x) and the points determined to be abnormal, and stores the boundary data as boundary data in the boundary data holding unit 306. To do.
- the dimension of the detected detected value is once compressed (128 dimensions ⁇ 64 dimensions ⁇ 2 dimensions) to make it easier to judge whether it is normal or abnormal, and a line between normal and abnormal is drawn. doing.
- One Class SVM is used to judge whether it is normal or abnormal based on 128-dimensional data, and separately, dimension compression (128-dimensional ⁇ 64-dimensional ⁇ 2-dimensional). And plot on a two-dimensional plane. In this case, although it takes a long time to process, the determination of whether it is normal or abnormal is more accurate than using two-dimensional data.
- PCA362 was used as the dimensional compression method
- VAE Variational AutoEncoder
- the compression may be performed up to two dimensions using only the autoencoder 361 without using the PCA 362.
- the dimensional compression method is not limited to the method shown here, and various methods may be used in combination.
- the example shown here is an example of creating a two-dimensional map 331 for the breakage of the ball screw 210, but for the breakage of the bearing, only the detection value to be acquired at the beginning is different, and thereafter.
- the process can be performed in the same manner, and a similar two-dimensional map 331 can be created. For example, when it is desired to catch a sign of bearing damage, data of sound generated inside the machine tool and vibration generated in the spindle during warm-up operation may be acquired as detection values.
- FIG. 4 is a diagram for explaining the locus of points in the two-dimensional map 331.
- the locus 431 gradually moves away from the center of the boundary line as compared with the loci 411 and 421. Therefore, caution is required. That is, according to the two-dimensional map 331, it is possible to more accurately grasp the change in the operating state of the ball screw as compared with the conventional one-dimensional display.
- FIG. 5 is a diagram showing an example of a table 501 included in the machine tool 200 according to the present embodiment.
- Table 501 stores the detection value 512 in association with the mapping target 511 to be mapped as the two-dimensional map 331.
- the current, sound, vibration, torque, and the like applied to the motor 212 are stored as the detection values 512 to be acquired and analyzed for each of the ball screw breakage and the bearing breakage.
- the machine tool 200 refers to the table 501 to determine the data to be acquired in order to display the two-dimensional map 331.
- the machine tool 200 as described above has a CPU (Central Processing Unit), a ROM (Read Only Memory), a RAM (Random Access Memory), and a storage as hardware.
- the machine tool 200 reads the data necessary for realizing the present embodiment into the RAM and executes it by the CPU.
- the storage stores databases, various parameters, data, programs, and modules.
- FIG. 6 is a flowchart illustrating a processing procedure of the machine tool 200 according to the present embodiment.
- the CPU executes the program according to this flowchart, each functional configuration shown in FIG. 3B is realized.
- step S601 the detection unit 301 detects at least one of vibration, sound, current, heat, light, and power value applied to the motor 212 or the spindle as detection values during warm-up operation.
- step S603 the feature amount extraction unit 302 reduces the dimension of the feature amount of the detected detected value, and extracts the first feature amount and the second feature amount.
- step S605 the display unit 303 generates a screen of the two-dimensional map 331 in which the detected values are plotted on a plane having the first feature amount as the first axis 332 and the second feature amount as the second axis 333. Further, the display unit 303 generates three boundary lines 334 to 336 arranged in a contour line to indicate the possibility that an abnormality occurs in the ball screw.
- step S607 the display unit 303 displays the created two-dimensional map 331 on the display.
- step S609 the correction unit 304 determines whether or not to correct the boundary line shape.
- the boundary line shape is not corrected (NO in step S609), the machine tool 200 ends the process.
- step S611 the display unit 303 displays the two-dimensional map 331 corrected for the boundary line shape.
- the detection unit 301 has been described as an example of detecting the current value, but the detection unit 301 is not limited to the current value, and for example, vibration, sound, heat, and the like. It may be the respective values of light and power generated during processing.
- the current state of the machine tool can be easily grasped visually. Further, if the detected value of the state of the machine tool at the time of shipment from the factory is detected, it is possible to visually grasp from the state at the time of shipment to what stage the state of the machine tool is currently progressing. For example, a serviceman of a machine tool can propose a timing for replacing a ball screw to a user while showing a two-dimensional map at a timing such as a periodic inspection. In addition, the serviceman can show the user the state of deterioration of the ball screw. Then, since it is possible to know whether the cause of the deterioration of the ball screw is a clogging of chips or a scratch, the serviceman can make a more appropriate proposal to the user.
- the state of the ball screw may deteriorate and the machining accuracy may decrease.
- the machining accuracy decreases.
- the cause can be clarified. In other words, it is possible to clarify whether the cause is due to the initial failure of the machine tool or the subsequent failure, and it is possible to clarify whether it is the responsibility of the machine tool manufacturer or the user. .. Further, if the detected value during the warm-up operation is detected and the detected detected value is accumulated, the serviceman or the user can see the two-dimensional map when necessary.
- the display unit 303 may display a plurality of two-dimensional maps in parallel on one screen. For example, the display unit 303 may simultaneously display a two-dimensional map for the breakage of the ball screw 210 and a two-dimensional map for the breakage of the bearing on one screen. By displaying a plurality of two-dimensional maps at the same time in this way, the possibility of occurrence of various abnormalities can be confirmed on one screen.
- the display unit 703 is provided with a touch screen, and when the point “T10” of the displayed two-dimensional map 331 is touched (or clicked with a mouse or the like), information regarding the point T10 (date and time, Detected value, tool type, usable time, machining conditions, etc.) are displayed.
- information regarding the point T10 date and time, Detected value, tool type, usable time, machining conditions, etc.
- the points on which the detected values are plotted in this way, information related to the detected values can be displayed on the screen, and a more detailed operating state can be known. This makes it possible to grasp the operating state several seconds ago or several minutes ago.
- the machining conditions for the next machining can be selected with reference to the positions of the points indicating the past operating states on the two-dimensional map, the detection values of the points, the machining conditions, and the like.
- the present invention may be applied to a system composed of a plurality of devices, or may be applied to a single device. Further, the present invention is also applicable when an information processing program that realizes the functions of the embodiment is supplied to a system or an apparatus and executed by a built-in processor. Therefore, in order to realize the functions of the present invention on a computer, the program installed on the computer, the medium in which the program is stored, the WWW (World Wide Web) server that downloads the program, and the processor that executes the program are also included in the book. Included in the technical scope of the invention. In particular, at least a non-transitory computer readable medium containing a program for causing a computer to execute the processing steps included in the above-described embodiment is included in the technical scope of the present invention.
Landscapes
- Physics & Mathematics (AREA)
- Engineering & Computer Science (AREA)
- General Physics & Mathematics (AREA)
- Mechanical Engineering (AREA)
- Acoustics & Sound (AREA)
- Artificial Intelligence (AREA)
- Theoretical Computer Science (AREA)
- Evolutionary Computation (AREA)
- Mathematical Physics (AREA)
- Automation & Control Theory (AREA)
- Numerical Control (AREA)
- Injection Moulding Of Plastics Or The Like (AREA)
- Testing Of Devices, Machine Parts, Or Other Structures Thereof (AREA)
- Machine Tool Sensing Apparatuses (AREA)
Abstract
ボールねじの状態を分かり易く視覚化する工作機械であって、暖機運転中の振動、音、ボールねじを駆動するために印加される電流、熱、光および動力値の少なくともいずれか一つの検知値を検知する検知部と、検知部で検知した検知値から第1特徴量と第2特徴量とを抽出する特徴量抽出部と、第1特徴量に係る数値を第1軸とし第2特徴量に係る数値を第2軸とした平面上に、検知値をプロットした点と、前記ボールねじに異常が発生する可能性を表すために等高線状に配置された少なくとも2つの境界線と、を表示する表示部と、を備えた。
Description
本発明は、工作機械および表示装置に関する。
上記技術分野において、特許文献1には、ボールねじに加わる総エネルギー値Aが、寿命エネルギー値Bを越えた際に(A≧B)、ボールねじの寿命の限界と判定する技術が開示されている。
しかしながら、上記文献に記載の技術では、ボールねじの状態を分かり易く視覚化することが難しかった。
本発明の目的は、上述の課題を解決する技術を提供することにある。
上記目的を達成するため、本発明に係る工作機械は、
暖機運転中の振動、音、ボールねじを駆動するために印加される電流、熱、光および動力値の少なくともいずれか一つの検知値を検知する検知部と、
前記検知部で検知した前記検知値から第1特徴量と第2特徴量とを抽出する特徴量抽出部と、
前記第1特徴量に係る数値を第1軸とし前記第2特徴量に係る数値を第2軸とした平面上に、前記検知値をプロットした点と、前記ボールねじに異常が発生する可能性を表すために等高線状に配置された少なくとも2つの境界線と、を表示する表示部と、を備えた。
暖機運転中の振動、音、ボールねじを駆動するために印加される電流、熱、光および動力値の少なくともいずれか一つの検知値を検知する検知部と、
前記検知部で検知した前記検知値から第1特徴量と第2特徴量とを抽出する特徴量抽出部と、
前記第1特徴量に係る数値を第1軸とし前記第2特徴量に係る数値を第2軸とした平面上に、前記検知値をプロットした点と、前記ボールねじに異常が発生する可能性を表すために等高線状に配置された少なくとも2つの境界線と、を表示する表示部と、を備えた。
上記目的を達成するため、本発明に係る表示装置は、
暖機運転中の振動、音、ボールねじを駆動するために印加される電流、熱、光および動力値の少なくともいずれか一つの検知値を検知する検知部を有する工作機械から検出された検知値から第1特徴量と第2特徴量とを抽出し、前記ボールねじに異常が発生する可能性を表示する表示装置であって、
前記第1特徴量に係る数値を第1軸とし前記第2特徴量に係る数値を第2軸とした平面上に、前記検知値をプロットした点と、前記ボールねじに異常が発生する可能性を表すために等高線状に配置された少なくとも2つの境界線と、を表示する。
暖機運転中の振動、音、ボールねじを駆動するために印加される電流、熱、光および動力値の少なくともいずれか一つの検知値を検知する検知部を有する工作機械から検出された検知値から第1特徴量と第2特徴量とを抽出し、前記ボールねじに異常が発生する可能性を表示する表示装置であって、
前記第1特徴量に係る数値を第1軸とし前記第2特徴量に係る数値を第2軸とした平面上に、前記検知値をプロットした点と、前記ボールねじに異常が発生する可能性を表すために等高線状に配置された少なくとも2つの境界線と、を表示する。
本発明によれば、ボールねじの状態を分かり易く視覚化することができる。
以下に、本発明を実施するための形態について、図面を参照して、例示的に詳しく説明記載する。ただし、以下の実施の形態に記載されている、構成、数値、処理の流れ、機能要素などは一例に過ぎず、その変形や変更は自由であって、本発明の技術範囲を以下の記載に限定する趣旨のものではない。
[第1実施形態]
本発明の第1実施形態としての工作機械100について、図1を用いて説明する。図1は、本実施形態に係る工作機械100の構成を説明するための図である。
本発明の第1実施形態としての工作機械100について、図1を用いて説明する。図1は、本実施形態に係る工作機械100の構成を説明するための図である。
図1に示すように、工作機械100は、検知部101、特徴量抽出部102および表示部103を含む。検知部101は、暖機運転中の振動、音、ボールねじ110を駆動するために印加される電流、熱、光および動力値の少なくともいずれか一つの検知値を検知する。特徴量抽出部102は、検知部101で検知した検知値から第1特徴量と第2特徴量とを抽出する。表示部103は、第1特徴量に係る数値を第1軸134とし第2特徴量に係る数値を第2軸135とした平面上に、検知値をプロットした点(図中、T1~T16)と、ボールねじ110に異常が発生する可能性を表すために等高線状に配置された少なくとも2つの境界線132,133と、を表示する。
表示部103に表示された第1境界線132の内側に表示された点(図中、T1~T10)は、ボールねじ110が正常に動作していることを示している。また、境界線132および境界線133の間に表示された点(T11~T14)は、正常に稼働しているが、加工に影響のない軽微な異常(ボールねじ破損による精度低下の予兆と考えられる異常)が発生する可能性があることを示している。さらに、境界線133の外側に表示された点(T15~T16)は、加工精度に影響がある異常が発生する可能性があることを示している。ここで示した境界は、任意に設定できる。そのため、正常に稼働していることを示している領域を複数の境界線で区切って表示し、一番外側に位置する領域を異常が発生することを示すような境界の設定でもよい。
本発明における工作機械100は、図1に示す形態に限らず、材料を付着することで加工する付加加工(Additive Manufacturing)の機械、材料を除去する除去加工(Subtractive Manufacturing)の機械、レーザなどの光を照射して加工する機械でもよい。具体的には、旋盤、ボール盤、中ぐり盤、フライス盤、歯切り盤、研削盤、多軸加工機、レーザ加工機、積層加工機等が含まれる。これらは、金属、木材、石材、樹脂等のワークに対して、旋削、切断、穿孔、研削、研磨、圧延、鍛造、折り曲げ、成形、微細加工、積層加工等の各種の加工を施すものである。これらの加工を組み合わせた複合機も含まれる。
本実施形態によれば、ボールねじに異常が発生する可能性を2次元マップとして表示するので、ボールねじの状態を分かり易く視覚化することができる。また、ボールねじに異常が発生する可能性を的確に判断することができるので、ボールねじの破損等を未然に防ぐことができ、例えば、ボールねじの交換による生産性の低下を防止できる。
[第2実施形態]
次に本発明の第2実施形態に係る工作機械について、図2乃至図5を用いて説明する。図2は、本実施形態に係る工作機械の外観およびボールねじを説明するための図である。第2実施形態の工作機械200について、複合機を用いて説明する。工作機械200は、ボールねじ210、ステージ211およびモータ212を有する。モータ212の回転がボールねじ210に伝わり、ボールねじ210の回転駆動力によりステージ211が往復移動する。ステージ211を往復移動させることにより、ステージ211に載置された工作対象物を所望の位置へと移動させることができる。ボールねじ210とは、ねじ軸、ナット、ボールなどから構成される機械要素部品のひとつであり、直線運動を回転運動に変換、または回転運動を直線運動に変換するためのものである。
次に本発明の第2実施形態に係る工作機械について、図2乃至図5を用いて説明する。図2は、本実施形態に係る工作機械の外観およびボールねじを説明するための図である。第2実施形態の工作機械200について、複合機を用いて説明する。工作機械200は、ボールねじ210、ステージ211およびモータ212を有する。モータ212の回転がボールねじ210に伝わり、ボールねじ210の回転駆動力によりステージ211が往復移動する。ステージ211を往復移動させることにより、ステージ211に載置された工作対象物を所望の位置へと移動させることができる。ボールねじ210とは、ねじ軸、ナット、ボールなどから構成される機械要素部品のひとつであり、直線運動を回転運動に変換、または回転運動を直線運動に変換するためのものである。
図3Aは、本実施形態の前提技術としての1次元グラフの一例を示す図である。図3Aには、縦軸356にモータ212に印加された電流値、横軸357に時間T1~T16を設定したグラフ351が表示されている。このようなグラフを用いる場合、破損のタイミングをT16とすると、実際にはT15のタイミングが、適正なアラートのタイミングである。しかし、T15のタイミングを検出しようとすると、閾値358をあらかじめ定める必要がある。そうすると、閾値358を超えたT9のタイミングで、ボールねじ210の交換を促すことになる。このため、まだボールねじ210を使用できるのにも関わらず、ボールねじ210を交換することになり、T9~T15の時間分だけ、無駄が生じてしまう。つまり、ボールねじ210の交換頻度が多くなるため、生産性が低下する。
図3Bは、本実施形態に係る工作機械200の内部構成を示す図である。工作機械200は、検知部301、特徴量抽出部302、表示部303、補正部304、操作部305、境界データ保持部306、異常判定部308および境界データ生成部309を有する。工作機械200は、検知部301が検知した検知値に基づいて、表示部303において、ボールねじに異常が発生する可能性を判断するための2次元マップ331を表示する。
検知部301は、工作機械200の暖機運転において、モータ212を回転させるために印加される電流値を検知し、検知値(sensed value)として出力する。検知部301は、具体的には、三相交流のUVW相に設けられた電流センサと計測した電流値をデジタルデータに変換するADコンバータとを含む。例えば、ADコンバータのサンプリング周波数を2kHzとして、16bitの信号に変換する。このとき、256点の時系列データを取得でき、128msecごとに入力データとすることができる。
ここで、暖機運転とは、機械を始動した直後などに低負荷での運転を一定時間行うことをいう。暖機運転は、低負荷での運転により機械の構成部品同士の馴染みを促がし、各部の働きを滑らか、かつ確実にするために行われる。低回転、低負荷の運転により、潤滑油を各部へ行き渡らせ、機械が本来の性能を発揮できる状態になるように部品同士の間隙(クリアランス)を適正な状態へ導くことができる。
検知部301は、ADコンバータから出力されたデジタル電流値に対し、式(1)の変換式を用いて、Q軸電流iqとD軸電流idとを算出する。

上の式において、Q軸電流iqは実効電流、D軸電流idは無効電流である。検知部301は、Q軸電流iqを検知値として特徴量抽出部302に送る。
特徴量抽出部302は、周波数分解部321、正規化部322および次元圧縮部323を有する。周波数分解部321は、例えば、フーリエ変換などを用いて、検知部301から受け取った検知値から周波数成分を抽出する。正規化部322は、周波数分解された後のデータを正規化する。次元圧縮部323は、正規化されたデータの次元を圧縮して2次元の特徴量(第1特徴量成分と第2特徴量成分とを有するデータ)を生成する。特徴量抽出部302は、所定のプログラムを実行するためのプロセッサである。
表示部303は、次元圧縮部323で抽出した2次元の特徴量データに基づいて、ボールねじ210に異常が発生する可能性を表す2次元マップ331を表示する。2次元マップ331は、次元圧縮部323で生成される第1特徴量を第1軸332とし、第2特徴量を第2軸333とした平面を含む。その平面上に、検知値の特徴量をプロットする(T1~T16)。さらに表示部303は、ボールねじ210に異常が発生する可能性を表すために等高線状に配置された境界線(この例では3つの境界線334~336)を画面に表示する。本実施形態で「異常」とは、ボールねじ210の破損を意味する。
2次元マップ331は、プロットされる検知値の特徴量が、最も内側の境界線334の中心から外側に遠ざかれば遠ざかるほど異常が発生する可能性が高くなることを示している。
例えば、境界線334の内側にプロットされた検知値の特徴量(T1,T8,T9・・・)は、異常が発生する可能性が極めて低いため正常な動作状態であると判断できる。つまり、2次元マップ331を見たユーザは、境界線334の内部にのみ検知値の特徴量を表す点が表示されていれば、安心して工作機械200を稼働させられる。
検知値の特徴量を表わす点が、境界線334および境界線335の間にあれば、ユーザは異常が発生する可能性は低いが所定値以上ある動作状態と判断し、注意深く工作機械200を稼働させればよい。例えば、工作機械の内部の切り屑を清掃することや、潤滑油の確認・注入を行うこと、モータ212の回転数をボールねじ210の破損の発生し難い回転数に設定することができる。また、ユーザは、境界線334および境界線335の間に検知値の特徴量があれば、ボールねじ210の交換などを検討し始めるべきである。
例えば、2次元マップ331を参照すると、T11~T14は境界線334の外側の点であるため、工作機械200の稼働中に異常が発生する予兆である可能性が高い。点T15は、境界線335の外側であるため、即座にボールねじ210の交換が必要であることが分かる。このように、2次元マップ331を表示することにより、グラフ351よりも正確に、実際に切削精度の低下が現れる前にボールねじ210の交換のタイミングを判断できる。
また、点の軌跡を見ることにより、工作機械200に長期的に発生する可能性のある異常の兆候などを容易に把握することができるので、ユーザは工作機械200の中長期的なメンテナンス計画や消耗品の調達計画を立てることができる。
さらに、例えば、検知値の特徴量が、境界線336の外側にプロットされていれば、即座にボールねじ210の破損が発生する可能性が高いと考えられるため、ボールねじ210の交換を迅速に行なうべきである。
表示部303は、検知部301が検知値を検知する度に、検知値の特徴をプロットした点を追加的に表示し、同時に正常異常の判定基準となる境界線を表示する。
表示部303は、例えば工作機械200の一部として設けられたディスプレイでもよいし、工作機械200の外部にあるディスプレイでもよい。また、プロジェクタを用いてスクリーンに2次元マップ331を投影してもよい。この場合、表示装置は、暖機運転中の検知値として検知された主軸に発生する振動(振動の周波数や振幅)、工作機械200の内部の音(マイクで検知した音の音量や周波数)、ボールねじ210または主軸に印加される電流、主軸やワークに発生する熱(熱センサで検知した温度や熱量)、ワーク周辺に発生する光(カメラで撮影された光の光量や色や周波数)および動力値の少なくとも一つから抽出された特徴量に基づいて、ボールねじ210に異常が発生する可能性を2次元マップ331として表示する。2次元マップ331に関する情報は、表示装置側が保持していてもよい。動力値とは、一般的に、仕事量(比切削抵抗×切り込み×送り×切削速度)を、60×1,000×機械効率で割った値であり主要主軸動力(Pc)と呼ばれる。例えば、切削加工や旋削加工で消費したモータの電力値などが含まれる。切削トルクや、工具の回転数を検知値としてもよい。
補正部304は、ユーザからの指示に従い表示部303により表示された2次元マップ331の補正を行う。具体的には、図3Cに示したように、補正部304は、左下側に広げる方向に、2次元マップ331の境界線334の形状の補正を行う。ユーザは、境界線334を広げることにより、正常な検知値の範囲を広くすることができる。正常、異常の判定ができるベテランユーザなどが境界線334の形状を補正することにより、その機械を使う他のユーザが、ベテランユーザの判断に準ずることができる。図3Cの例では、点T12~T14が境界線334の内部に収まるように、境界線334を広げるように補正した例を示している。
工作機械200の工場出荷時に取得した検知値と、工作機械200をユーザの工場などに配置した状態で取得した検知値とでは、描画される2次元マップ331の境界線334~336に違いが生じる場合がある。すなわち、工作機械200による動作条件が常に同じになるとは限らない。
例えば、工作対象物の重量はそれぞれ異なるため、どの工作対象物を工作するかにより、ボールねじ210の破損の可能性を示す2次元マップ331の境界線334~336の形状が異なる。そこで、描画された2次元マップ331の境界線334~336の形状に補正を加えることができる構成とすることにより、ユーザの使用環境に合わせた2次元マップ331を表示できる。
なお、補正の方法は、例えば、ユーザが、マウスなどの操作部305を用いて、境界線334~336の一部をドラッグして、境界線334~336の形状を変更させてもよい。また、キーボードなどの操作部305を用いて、数値を入力することにより境界線334~336の形状を変更させてもよい。また、補正後の境界線に関するデータをクラウド上に保存して、他の工作機械と共有してもよい。
異常判定部308は、特徴量抽出部302が抽出した検知値の特徴に基づいて、異常であるか否かを判定する。異常判定部308は、判定結果を境界データ生成部309に渡す。
境界データ生成部309は、異常判定部308において、正常と判定された点と、異常と判定された点との間に境界線を生成する。
境界データ保持部306は、表示部303に表示される2次元マップ331の境界線334~336のデータを保持している。補正部304は、境界データ保持部306が保持する境界線334~336のデータを変更することで、境界線334~336の形状の補正を行う。
(特徴量抽出処理)
ここで、図3Dを参照して、特徴量抽出部302による特徴量の抽出方法について詳細に説明する。周波数分解部(図中FFT)321は、工作機械200による暖機運転中に検知部301が検知した電流値の周波数成分を抽出して、周波数スペクトルを生成する。周波数分解は、例えば、FFT(Fast Fourier Transform;高速フーリエ変換)により行われるが、これには限定されない。
ここで、図3Dを参照して、特徴量抽出部302による特徴量の抽出方法について詳細に説明する。周波数分解部(図中FFT)321は、工作機械200による暖機運転中に検知部301が検知した電流値の周波数成分を抽出して、周波数スペクトルを生成する。周波数分解は、例えば、FFT(Fast Fourier Transform;高速フーリエ変換)により行われるが、これには限定されない。
一般に任意の周期的な時系列データytは、様々な周期の三角関数の和として考えることができる。これをフーリエ級数展開と呼び、基本周期がT0[s]の観測値ytのフーリエ級数は、複素数を用いると式(2)のように表せる。

ここで、ω0=2πf0[rad/s]は基本角周波数、f0=1/T0[Hz]は基本周波数である。複素フーリエ係数cnは、以下の式(3)で求められる。
電流データのサンプリングタイムをd、ウインドウ長さをnとしたとき、最大周波数fmaxと周波数分解能Δfは、以下の式(4)および(5)で表される。
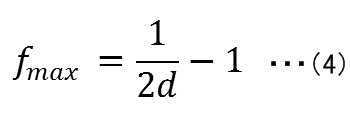
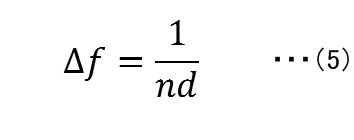
例えば、サンプリング周波数が2kHzでウインドウ長さが256点の場合、FFT後の最大周波数fmaxは、1kHzとなり、周波数分解能Δfは、7.8125Hzとなる。つまり、256点の時系列データは、FFTすると128点のベクトルで表現することができ、このベクトルが次のオートエンコーダに対する入力となる。なお、128点のベクトルは、正規化部322において、正規化され、次元圧縮部323へ送られる。
次元圧縮部323は、オートエンコーダ361、PCA(Principal Component Analysis、主成分分析)362を用いて、次元圧縮を行う。オートエンコーダ361は、機械学習におけるニューラルネットワークを使用した次元圧縮のためのアルゴリズムであり、入力サンプルの次元数よりも圧倒的に少ない次元数の特徴を抽出することができるアルゴリズムである。
本実施形態では、印加電流値を周波数分解部321により、複数次元のベクトル(ここでは、128次元)で表現したデータに周波数分解する。そして、周波数分解された複数次元のベクトル(128次元)を次元圧縮部323の入力としている。次元圧縮部323のオートエンコーダ361の中間層を低次元に設定することで、複数次元のベクトル入力を低次元に次元圧縮している。オートエンコーダ361は、一般的に、3層ニューラルネットにおいて、入力層と出力層に同じデータを用いて、入力層から中間層に圧縮した後、出力層に復元することを繰り返し、再現率の高い中間層を導き出すものである。ここでは、中間層を64次元に設定している。つまり、次元圧縮部323に入力された128次元のベクトルは、特徴をできるだけ維持したまま64次元に圧縮される。例えば、FFT後のベクトルが128次元の場合、オートエンコーダ361により64次元や10次元にすることができる。以下にオートエンコーダ361の学習と学習済みのモデルとを用いた処理について説明する。
(i)オートエンコーダの学習
実験番号βの印加電流波形のFFTデータxβは、以下の式(6)のようにR次元のベクトルの集合で表される。

ここで、
 は、実験番号βのr番目の区間、Rは区間総数である。
実験番号βの印加電流波形のFFTデータxβは、以下の式(6)のようにR次元のベクトルの集合で表される。
ここで、
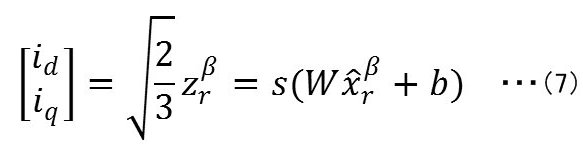
すると、エンコーダ部は、以下の式(7)で表される。
また、デコーダ部は、以下の式(8)で表される。
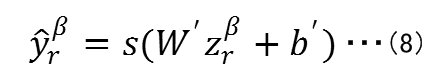
ここで、W'は、Wの転置行列であるため、求めるパラメータは、W、b、b'の3つとなる。
このように、
 は、元信号
は、元信号
 に類似したものとなる。
例えば、最適化手法にAdam(Adaptive moment estimation)を用いると、直前のステップt-1までの勾配の2乗の移動平均νt=E[g2]tと勾配の移動平均mt=E[g]tは、以下の式(9)のように表すことができる。
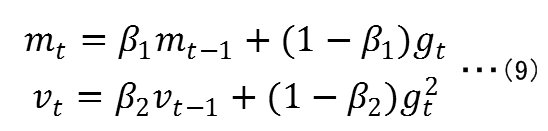
ここで、β1、β2∈[0,1)はハイパーパラメータであり、例えば、Adamの推奨値である下記の値を用いてもよいが、推奨値を基準に調整してもよい。
β1=0.9
β2=0.999
ここで、ν0=0で初期化したとすると、以下の式(10)が得られる。

β2=0.999
ここで、ν0=0で初期化したとすると、以下の式(10)が得られる。
つまり、2次モーメントνtの移動平均E[νt]と真の2次モーメントE[g2
t]の関係性は、以下の式(11)で表される。
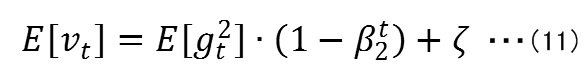
ここで、ζ=0と近似できるようにハイパーパラメータの値を設定すれば、
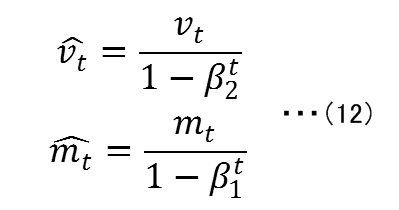
が求められる。以上より、

がパラメータ更新式となる。バイアスのb、b'においても同様の手順で導出することが可能である。
(ii)オートエンコーダの処理
学習したオートエンコーダのエンコーダを次元圧縮に用いる。
例えば、FFT後のベクトルが128次元の場合で、中間層を64次元に設定してオートエンコーダを学習させた場合、128次元の入力
 から次元圧縮された64次元の
 が出力される。
学習したオートエンコーダのエンコーダを次元圧縮に用いる。
PCA(Principal Component Analysis;主成分分析)は、主成分を用いてデータをより低い次元で表現する手法である。入力を任意の次元数のデータに次元圧縮して出力することが可能である。
(i)学習
入力のデータ行列をX、単一のデータ点を含む列ベクトルをxとする。データの分散最大化問題を定式化すると、
と表される。この式(15)を行列とベクトルとの形式で書き直すと、
となる。つまり、wのノルムが1となる拘束条件を満たした上で、出力Xwが最大になるwを求める。その答えはXの特異値分解にある。k次元の主成分をV、w、データ行列をWとすると、
W=Vkである。ここで、kは、主成分Vに含まれる相関のない変数群の個数である。よって、次元圧縮後のベクトルをZとすると、射影座標のベクトルは、
Z=XVkと表される。
入力のデータ行列をX、単一のデータ点を含む列ベクトルをxとする。データの分散最大化問題を定式化すると、
W=Vkである。ここで、kは、主成分Vに含まれる相関のない変数群の個数である。よって、次元圧縮後のベクトルをZとすると、射影座標のベクトルは、
Z=XVkと表される。
(ii)処理
学習により求めた主成分Vを用いて、次元圧縮を行う。例えば、オートエンコーダ処理後のベクトル次元が64次元の場合、64次元の入力X64を2次元のベクトルZ2に次元圧縮するように設定できる。
学習により求めた主成分Vを用いて、次元圧縮を行う。例えば、オートエンコーダ処理後のベクトル次元が64次元の場合、64次元の入力X64を2次元のベクトルZ2に次元圧縮するように設定できる。
Z2=X64V2より、64次元のX64を入力すると主成分V2により2次元ベクトルZ2が出力される。ベクトルZ2の2つのベクトル成分が第1特徴量および第2特徴量に相当する。ベクトルZ2の2つの成分を第1軸および第2軸として2次元マップへプロットする。
SVM(Support Vector Machine)363は、本来2クラス分類を目的としたパターン認識手法であり、SVM363ではマージンを最大化する最適な分離超平面を求める。ここで、マージンとは分離超平面に最も近いサンプルと分離超平面との距離である。最大化されたマージン(距離)は、f(x)で表わされる。
SVM363は、One Class SVM(One Class SVM)であり、通常のSVMを拡張したもので、正常データを非負値に、異常データを負値に写像するモデルを構築する。すなわち、One Class SVMは、大多数が正常であるようなデータの集合をもとに学習をおこない、未知のデータが正常であるのか、異常であるのかを判定する手法である。一般には正常に作られた製品や正常な状態のデータは多く入手できても、異常な製品や異常な状態のデータはあまり入手できない。そのようなケースに対してOne
Class SVMを適用することが可能である。
Class SVMを適用することが可能である。
(i)学習
モデル構築用データが線型分離不可能な場合、SVMでは非線形関数を用いてモデル構築用データを高次元空間に写像し、高次元空間内で分離超平面を求める。これは、オリジナルの低次元空間において、非線形な分離境界を求めることに等しい。高次元空間へはカーネル関数Kを用いて写像される。
ここで、xiが第1特徴量であり、xjが第2特徴量である。また、φは非線形関数である。SVMモデルによって決まる距離f(x)は以下の式(18)で表される。
モデル構築用データが線型分離不可能な場合、SVMでは非線形関数を用いてモデル構築用データを高次元空間に写像し、高次元空間内で分離超平面を求める。これは、オリジナルの低次元空間において、非線形な分離境界を求めることに等しい。高次元空間へはカーネル関数Kを用いて写像される。
ここで、xiが第1特徴量であり、xjが第2特徴量である。また、φは非線形関数である。SVMモデルによって決まる距離f(x)は以下の式(18)で表される。
ここで、wは重みベクトルであり、bはバイアスである。ここで新しいサンプルxは、f(x)の符号によって識別することができる。One Class SVMにおけるモデル構築は、モデル構築用の正常データを同一クラスに、そして原点を他方のクラスとみなした場合のSVMとして定式化される。つまり、One Class SVMにおけるマージンとは、原点と原点に最も近いサンプルとの距離として定義され、そのマージン最大化問題は以下の式(19)のように定式化される。

ここでξi(i=1,・・・,N)は、スラック変数であり、ν∈(0,1)は構築したOne Class SVMモデルでモデル構築用データを識別した場合のエラー率である。ここで、Lagrange乗数αi≧0およびηi≧0を導入すると、この最適化問題は、以下の式(20)のように書き直される。

Lagrangeの未定乗数法により、以下の式(21)を導くことができる。

整理すると、この問題は以下のような双対形式の式(22)で表現できる。
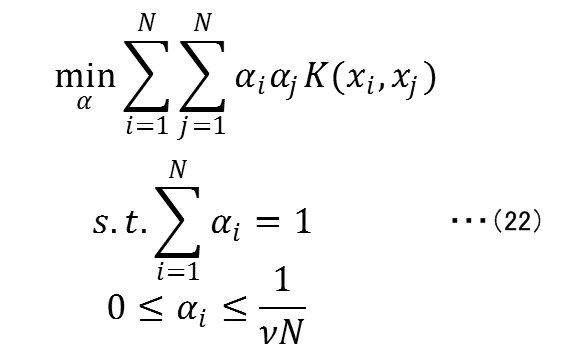
この最適化問題は標準的な2次計画問題として解くことができる。最終的にOne Class SVMモデルによって決まる距離f(x)は、以下の式(23)で表される。
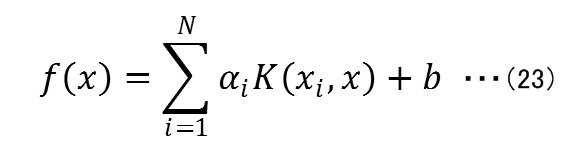
通常、異常検知モデルのような識別モデルを構築するには、正常データと異常データとの両方が必要である。しかし、One Class SVMでは、上記式(23)で分かるとおり、正常データのみから識別モデルを構築できる。
上述したようにOne Class SVMは、超平面との距離f(x)を出力する。距離f(x)に基づいて、正常、異常を判定できる。距離f(x)は異常なデータほど負に大きな値をとり、正常なデータほど正に大きな値をとる。
ここで、境界データ生成部309は、距離f(x)が小さいデータ、つまり、異常なデータを外れ値とし、境界線を生成する。
例えば、学習データの中に0.2%の異常値が含まれると仮定した場合、異常判定部308は、距離f(x)の小さい順に上位0.2%を外れ値とし、正常範囲を作成することができる。
(ii)処理
学習させたOne Class SVMにPCAで次元圧縮したデータを入力することで、上記の式(23)より、出力f(x)が得られる。
学習させたOne Class SVMにPCAで次元圧縮したデータを入力することで、上記の式(23)より、出力f(x)が得られる。
異常判定部308は、異常度スコアg(x)として、出力f(x)を正負逆転させたものを用いており、
g(x)=-f(x)と表される。つまり、異常判定部308は、異常度スコアg(x)が負の値の場合は正常、0以上の場合は異常と判定する。
g(x)=-f(x)と表される。つまり、異常判定部308は、異常度スコアg(x)が負の値の場合は正常、0以上の場合は異常と判定する。
境界データ生成部309は、異常度スコアg(x)により正常と判定された点と、異常と判定された点との間に境界線を生成し、境界データとして、境界データ保持部306に保存する。
このように、本実施形態においては、検知した検知値の次元を一旦圧縮して(128次元→64次元→2次元)、正常か異常かを判断し易くして、正常と異常との線引きをしている。もちろんこれに限定されるものではなく、128次元のデータをもとにOne Class SVMを用いて、正常か異常かの判断をさせ、それとは別に次元の圧縮(128次元→64次元→2次元)をして2次元平面にプロットしてもよい。この場合、処理時間がかかるが正常か異常かの判断は、2次元データを用いるよりも精度がよくなる。
また、次元圧縮の手法として、PCA362を用いたが、PCA362の代わりに、例えば、VAE(Variational Auto Encoder)を用いてもよい。また、PCA362を用いないでオートエンコーダ361のみを用いて2次元まで圧縮してもよい。
なお、次元圧縮の手法はここに示した手法には限定されず、様々な手法を組み合わせて用いてもよい。また、ここに示した例は、ボールねじ210の破損についての2次元マップ331の作成についての例であるが、ベアリングの破損についても、最初に取得する検知値が異なっているだけで、その後の処理は、同様に行うことができ、同様の2次元マップ331を作成できる。例えば、ベアリングの破損の予兆を捉えたい場合には、暖機運転中に、工作機械内部に発生する音や、主軸に発生する振動のデータを検知値として取得すればよい。
図4は、2次元マップ331における点の軌跡を説明するための図である。上、中、下、いずれの2次元マップ331も、正常範囲内に点が存在しているが、軌跡411、421に比べて、軌跡431は、徐々に境界線の中心から離れる方向に移動しているため注意が必要である。すなわち、2次元マップ331によれば、従来の1次元の表示に比べて、ボールねじの動作状態の変化をより正確に把握することが可能となる。
図5は、本実施形態に係る工作機械200が有するテーブル501の一例を示す図である。テーブル501は、2次元マップ331としてマッピングしたいマッピング対象511に関連付けて検知値512を記憶する。ボールねじ破損、ベアリング破損のそれぞれについて、取得分析すべき検知値512として、モータ212に印加される電流や、音や、振動や、トルクなどが記憶されている。工作機械200は、テーブル501を参照して2次元マップ331を表示するために取得すべきデータを判定する。
以上説明したような工作機械200は、ハードウェアとして、CPU(Central Processing Unit)、ROM(Read Only Memory)、RAM(Random Access Memory)およびストレージを有する。工作機械200は、RAMに本実施形態の実現に必要なデータを読み出し、CPUにより実行する。ストレージには、データベースや各種のパラメータ、データ、プログラム、モジュールが記憶される。
図6は、本実施形態に係る工作機械200の処理手順を説明するフローチャートである。このフローチャートに従ったプログラムを、CPUが実行することにより、図3Bに示した各機能構成が実現される。
ステップS601において、検知部301は、暖機運転中の検知値として、振動、音、モータ212または主軸に印加される電流、熱、光および動力値の少なくともいずれか一つの検知値を検知する。ステップS603において、特徴量抽出部302は、検知した検知値の特徴量の次元を減らし、第1特徴量と第2特徴量とを抽出する。ステップS605において、表示部303は、第1特徴量を第1軸332とし、第2特徴量を第2軸333とした平面上に、検知値をプロットした2次元マップ331の画面を生成する。さらに、表示部303は、ボールねじに異常が発生する可能性を表すために等高線状に配置された3つの境界線334~336を生成する。
ステップS607において、表示部303は、作成された2次元マップ331をディスプレイに表示する。ステップS609において、補正部304は、境界線形状の補正を行うか否かを判断する。境界線形状の補正を行わない場合(ステップS609のNO)、工作機械200は、処理を終了する。境界線形状の補正を行う場合(ステップS609のYES)、ステップS611へ進む。ステップS611において、表示部303は、境界線形状を補正した2次元マップ331を表示する。
なお、本実施形態の説明においては、検知部301が、電流値を検知する例で説明したが、検知部301が検知するのは電流値には限定されず、例えば、振動、音、熱、光および加工時に発生する動力のそれぞれの値であってもよい。
本実施形態によれば、暖機運転中の検知値を検知して、2次元マップを表示するので、工作機械の現在の状態を視覚的に容易に把握できる。また、工作機械の工場出荷時の状態の検知値を検知しておけば、出荷時の状態から、今現在どの段階まで工作機械の状態が進行しているかを視覚的に把握できる。例えば、工作機械のサービスマンは、定期点検などのタイミングで、ユーザに対して、2次元マップを見せながら、ボールねじの交換のタイミングを提案することができる。また、サービスマンは、ユーザに対して、ボールねじの劣化の状態を見せることができる。そして、ボールねじの劣化の原因が、切りくずの詰まりによるものなのか、傷によるものなのかなども分かるので、サービスマンは、ユーザに対してより適切な提案をすることができる。
また、例えば、工作機械に何かをぶつけることにより、ボールねじの状態が劣化し、加工精度が低下することがあるが、工場出荷時からの2次元マップを見ることにより、加工精度の低下の原因を明らかにできる。つまり、その原因が、工作機械の初期不良によるものなのか、後発的な不良によるものなのかを明確にでき、工作機械メーカ側の責任なのか、ユーザ側の責任なのかをはっきりさせることができる。さらに、暖機運転中の検知値を検知して、検知した検知値を蓄積しておけば、サービスマンやユーザは、必要なときに2次元マップを見ることも可能である。
なお、表示部303は、1画面に複数の2次元マップを並列に表示してもよい。例えば、表示部303は、1つの画面にボールねじ210の破損についての2次元マップおよびベアリングの破損についての2次元マップを同時に表示してもよい。そのように、複数の2次元マップを同時に表示すれば、各種の異常の発生の可能性を1つの画面上で確認することができる。
また、図7に示したように、表示部703は、タッチスクリーンを備え、表示された2次元マップ331の点「T10」をタッチ(またはマウス等でクリック)すると、点T10に関する情報(日時、検知値、工具種、使用可能時間、加工条件など)が表示される。このように、検知値をプロットした点を選択することにより、その検知値に関連する情報をスクリーン上に表示することで、より詳細な動作状態を知ることができる。これにより、数秒前や数分前の動作状態を把握することができる。また、2次元マップにおける過去の動作状態を示す点の位置と、その点の検知値や加工条件などを参考にして、次の加工の加工条件を選択することができる。
[他の実施形態]
以上、実施形態を参照して本願発明を説明したが、本願発明は上記実施形態に限定されるものではない。本願発明の構成や詳細には、本願発明の技術的範囲で当業者が理解し得る様々な変更をすることができる。また、それぞれの実施形態に含まれる別々の特徴を如何様に組み合わせたシステムまたは装置も、本発明の技術的範囲に含まれる。
以上、実施形態を参照して本願発明を説明したが、本願発明は上記実施形態に限定されるものではない。本願発明の構成や詳細には、本願発明の技術的範囲で当業者が理解し得る様々な変更をすることができる。また、それぞれの実施形態に含まれる別々の特徴を如何様に組み合わせたシステムまたは装置も、本発明の技術的範囲に含まれる。
また、本発明は、複数の機器から構成されるシステムに適用されてもよいし、単体の装置に適用されてもよい。さらに、本発明は、実施形態の機能を実現する情報処理プログラムが、システムあるいは装置に供給され、内蔵されたプロセッサによって実行される場合にも適用可能である。したがって、本発明の機能をコンピュータで実現するために、コンピュータにインストールされるプログラム、あるいはそのプログラムを格納した媒体、そのプログラムをダウンロードさせるWWW(World Wide Web)サーバも、プログラムを実行するプロセッサも本発明の技術的範囲に含まれる。特に、少なくとも、上述した実施形態に含まれる処理ステップをコンピュータに実行させるプログラムを格納した非一時的コンピュータ可読媒体(non-transitory computer readable medium)は本発明の技術的範囲に含まれる。
この出願は、2019年11月8日に出願された日本出願特願2019-202985を基礎とする優先権を主張し、その開示の全てをここに取り込む。
Claims (5)
- 暖機運転中の振動、音、ボールねじを駆動するために印加される電流、熱、光および動力値の少なくともいずれか一つの検知値を検知する検知部と、
前記検知部で検知した前記検知値から第1特徴量と第2特徴量とを抽出する特徴量抽出部と、
前記第1特徴量に係る数値を第1軸とし前記第2特徴量に係る数値を第2軸とした平面上に、前記検知値をプロットした点と、前記ボールねじに異常が発生する可能性を表すために等高線状に配置された少なくとも2つの境界線と、を表示する表示部と、を備えた工作機械。 - 前記境界線の形状の補正を行う補正部をさらに備えた請求項1に記載の工作機械。
- 前記特徴量抽出部は、
前記検知値を周波数分解する周波数分解部と、周波数分解後のデータを正規化する正規化部と、正規化されたデータの次元を圧縮する次元圧縮部と、を備える請求項1または2に記載の工作機械。 - 前記表示部は、前記プロットした点を選択すると、前記プロットした点に関連した情報を表示する請求項1乃至3のいずれか1項に記載の工作機械。
- 暖機運転中の振動、音、ボールねじを駆動するために印加される電流、熱、光および動力値の少なくともいずれか一つの検知値を検知する検知部を有する工作機械から検出された検知値から第1特徴量と第2特徴量とを抽出し、前記ボールねじに異常が発生する可能性を表示する表示装置であって、
前記第1特徴量に係る数値を第1軸とし前記第2特徴量に係る数値を第2軸とした平面上に、前記検知値をプロットした点と、前記ボールねじに異常が発生する可能性を表すために等高線状に配置された少なくとも2つの境界線と、を表示する表示装置。
Priority Applications (3)
| Application Number | Priority Date | Filing Date | Title |
|---|---|---|---|
| US17/772,339 US20220410332A1 (en) | 2019-11-08 | 2020-11-04 | Machine tool and display device |
| CN202080077335.7A CN114729850A (zh) | 2019-11-08 | 2020-11-04 | 机床及显示装置 |
| EP20884346.6A EP4043853A4 (en) | 2019-11-08 | 2020-11-04 | MACHINE TOOL AND INDICATOR |
Applications Claiming Priority (2)
| Application Number | Priority Date | Filing Date | Title |
|---|---|---|---|
| JP2019-202985 | 2019-11-08 | ||
| JP2019202985A JP6764516B1 (ja) | 2019-11-08 | 2019-11-08 | 工作機械および表示装置 |
Publications (1)
| Publication Number | Publication Date |
|---|---|
| WO2021090842A1 true WO2021090842A1 (ja) | 2021-05-14 |
Family
ID=72614716
Family Applications (1)
| Application Number | Title | Priority Date | Filing Date |
|---|---|---|---|
| PCT/JP2020/041229 Ceased WO2021090842A1 (ja) | 2019-11-08 | 2020-11-04 | 工作機械および表示装置 |
Country Status (5)
| Country | Link |
|---|---|
| US (1) | US20220410332A1 (ja) |
| EP (1) | EP4043853A4 (ja) |
| JP (1) | JP6764516B1 (ja) |
| CN (1) | CN114729850A (ja) |
| WO (1) | WO2021090842A1 (ja) |
Cited By (1)
| Publication number | Priority date | Publication date | Assignee | Title |
|---|---|---|---|---|
| JP7377919B1 (ja) | 2022-06-20 | 2023-11-10 | 上銀科技股▲分▼有限公司 | リニア伝動装置用のメンテナンス情報取得方法及びリニア伝動装置用のメンテナンス情報取得システム |
Families Citing this family (8)
| Publication number | Priority date | Publication date | Assignee | Title |
|---|---|---|---|---|
| WO2021134253A1 (zh) * | 2019-12-30 | 2021-07-08 | 江苏南高智能装备创新中心有限公司 | 基于数控机床上传感器数据的故障预测系统及其方法 |
| KR20220071540A (ko) | 2020-11-24 | 2022-05-31 | 현대위아 주식회사 | 공작기계의 공구 상태 판정 장치 |
| JP7779088B2 (ja) * | 2021-11-01 | 2025-12-03 | 株式会社島津製作所 | データ解析システム及びコンピュータプログラム |
| US12370027B2 (en) * | 2022-02-04 | 2025-07-29 | Zeus Tech Co., Ltd. | Five-axis artificial tooth processing machine using linear motor |
| JP7734104B2 (ja) * | 2022-03-18 | 2025-09-04 | サイエンス ソリューションズ株式会社 | 回転機器の異常検出装置、回転機器の異常検出方法、回転機器の異常検出プログラム |
| WO2024122054A1 (ja) * | 2022-12-09 | 2024-06-13 | 日本電気株式会社 | 情報処理システム、情報処理方法、及び記録媒体 |
| TWI865992B (zh) * | 2022-12-16 | 2024-12-11 | 永進機械工業股份有限公司 | 綜合加工機暖機作業診斷系統及其診斷方法 |
| JP2025044741A (ja) * | 2023-09-20 | 2025-04-02 | 日立Geニュークリア・エナジー株式会社 | 制御棒駆動機構の異常検知装置及び制御棒駆動機構の異常検知方法 |
Citations (14)
| Publication number | Priority date | Publication date | Assignee | Title |
|---|---|---|---|---|
| JPS57168120A (en) * | 1981-12-07 | 1982-10-16 | Hitachi Ltd | Method for monitoring vibration of shaft of rotary body |
| JPH0484728A (ja) * | 1990-07-27 | 1992-03-18 | Central Glass Co Ltd | ボールねじの診断方法およびその装置 |
| JPH07168619A (ja) * | 1993-10-20 | 1995-07-04 | Hitachi Ltd | 機器/設備診断方法およびシステム |
| JP2000238106A (ja) | 1999-02-19 | 2000-09-05 | Toshiba Mach Co Ltd | 電動射出成形機のボールねじ寿命予測方法および装置 |
| JP2001255243A (ja) * | 2000-03-08 | 2001-09-21 | Japan Nuclear Cycle Development Inst States Of Projects | 回転機器の異常監視システム |
| JP2006258535A (ja) * | 2005-03-16 | 2006-09-28 | Omron Corp | 検査装置および検査方法 |
| WO2016016956A1 (ja) * | 2014-07-30 | 2016-02-04 | 株式会社日立製作所 | 装置劣化の発生原因推定方法、及びその装置 |
| JP2017161476A (ja) * | 2016-03-11 | 2017-09-14 | 東芝機械株式会社 | 産業機械および異常検出方法 |
| JP2018128284A (ja) * | 2017-02-06 | 2018-08-16 | 三菱日立パワーシステムズ株式会社 | 状態分析装置、表示方法、およびプログラム |
| WO2019049688A1 (ja) * | 2017-09-06 | 2019-03-14 | 日本電信電話株式会社 | 異常音検知装置、異常モデル学習装置、異常検知装置、異常音検知方法、異常音生成装置、異常データ生成装置、異常音生成方法、およびプログラム |
| WO2019107315A1 (ja) * | 2017-11-28 | 2019-06-06 | 国立研究開発法人産業技術総合研究所 | モニタリング対象機器の異常発生予兆検知方法及びシステム |
| JP2019096977A (ja) * | 2017-11-21 | 2019-06-20 | 富士通株式会社 | 可視化方法、可視化装置及び可視化プログラム |
| WO2019187138A1 (ja) * | 2018-03-30 | 2019-10-03 | 株式会社牧野フライス製作所 | 残寿命予測装置及び工作機械 |
| JP2019202985A (ja) | 2018-05-17 | 2019-11-28 | 旭化成ファーマ株式会社 | N−ホルミルピぺリジン含有量が低減されている、及び/又は、凍結乾燥ケーキの崩潰又は収縮が抑制されている、製剤 |
Family Cites Families (15)
| Publication number | Priority date | Publication date | Assignee | Title |
|---|---|---|---|---|
| JPS56137222A (en) * | 1980-03-31 | 1981-10-27 | Hitachi Ltd | Axial vibration monitoring method for rotating machine |
| US5469038A (en) * | 1994-05-10 | 1995-11-21 | Cincinnati Milacron Inc. | Method for compensating for efficient variations in an electric motor |
| JP3318825B2 (ja) * | 1996-08-20 | 2002-08-26 | ソニー株式会社 | デジタル信号符号化処理方法、デジタル信号符号化処理装置、デジタル信号記録方法、デジタル信号記録装置、記録媒体、デジタル信号伝送方法及びデジタル信号伝送装置 |
| US7680565B2 (en) * | 2006-03-23 | 2010-03-16 | Mitchell Gabriel Mircea Balasu | Systems for announcing the health of ball screw actuators and ball recirculation |
| US20100081891A1 (en) * | 2008-09-30 | 2010-04-01 | Nellcor Puritan Bennett Llc | System And Method For Displaying Detailed Information For A Data Point |
| US9145893B2 (en) * | 2011-06-08 | 2015-09-29 | Bendix Commercial Vehicle Systems Llc | Current control via speed control for driving screw compressor under cold conditions |
| US20130197854A1 (en) * | 2012-01-30 | 2013-08-01 | Siemens Corporation | System and method for diagnosing machine tool component faults |
| JP6143222B2 (ja) * | 2013-03-07 | 2017-06-07 | 三菱重工工作機械株式会社 | 工作機械の異常診断装置及び異常診断方法 |
| JP6340236B2 (ja) * | 2014-04-15 | 2018-06-06 | 三菱重工工作機械株式会社 | 工作機械の診断方法及びシステム |
| JP6285297B2 (ja) * | 2014-07-03 | 2018-02-28 | ファナック株式会社 | 工作機械の制御装置 |
| GB2537863B (en) * | 2015-04-28 | 2019-06-19 | Thales Holdings Uk Plc | Methods and systems for alerting a user to the presence of a fault in an electromechanical system in a railway infrastructure |
| JP6976080B2 (ja) * | 2017-05-22 | 2021-12-01 | 三菱パワー株式会社 | 状態分析装置、状態分析方法、およびプログラム |
| CN110023858B (zh) * | 2017-06-20 | 2020-01-07 | 山崎马扎克公司 | 机床管理系统以及机床的管理方法 |
| JP7040851B2 (ja) * | 2018-03-09 | 2022-03-23 | 株式会社インテック | 異常検知装置、異常検知方法及び異常検知プログラム |
| JP7379241B2 (ja) * | 2020-03-25 | 2023-11-14 | 三菱重工業株式会社 | 回転機の診断監視装置及び方法 |
-
2019
- 2019-11-08 JP JP2019202985A patent/JP6764516B1/ja active Active
-
2020
- 2020-11-04 US US17/772,339 patent/US20220410332A1/en active Pending
- 2020-11-04 EP EP20884346.6A patent/EP4043853A4/en active Pending
- 2020-11-04 WO PCT/JP2020/041229 patent/WO2021090842A1/ja not_active Ceased
- 2020-11-04 CN CN202080077335.7A patent/CN114729850A/zh active Pending
Patent Citations (14)
| Publication number | Priority date | Publication date | Assignee | Title |
|---|---|---|---|---|
| JPS57168120A (en) * | 1981-12-07 | 1982-10-16 | Hitachi Ltd | Method for monitoring vibration of shaft of rotary body |
| JPH0484728A (ja) * | 1990-07-27 | 1992-03-18 | Central Glass Co Ltd | ボールねじの診断方法およびその装置 |
| JPH07168619A (ja) * | 1993-10-20 | 1995-07-04 | Hitachi Ltd | 機器/設備診断方法およびシステム |
| JP2000238106A (ja) | 1999-02-19 | 2000-09-05 | Toshiba Mach Co Ltd | 電動射出成形機のボールねじ寿命予測方法および装置 |
| JP2001255243A (ja) * | 2000-03-08 | 2001-09-21 | Japan Nuclear Cycle Development Inst States Of Projects | 回転機器の異常監視システム |
| JP2006258535A (ja) * | 2005-03-16 | 2006-09-28 | Omron Corp | 検査装置および検査方法 |
| WO2016016956A1 (ja) * | 2014-07-30 | 2016-02-04 | 株式会社日立製作所 | 装置劣化の発生原因推定方法、及びその装置 |
| JP2017161476A (ja) * | 2016-03-11 | 2017-09-14 | 東芝機械株式会社 | 産業機械および異常検出方法 |
| JP2018128284A (ja) * | 2017-02-06 | 2018-08-16 | 三菱日立パワーシステムズ株式会社 | 状態分析装置、表示方法、およびプログラム |
| WO2019049688A1 (ja) * | 2017-09-06 | 2019-03-14 | 日本電信電話株式会社 | 異常音検知装置、異常モデル学習装置、異常検知装置、異常音検知方法、異常音生成装置、異常データ生成装置、異常音生成方法、およびプログラム |
| JP2019096977A (ja) * | 2017-11-21 | 2019-06-20 | 富士通株式会社 | 可視化方法、可視化装置及び可視化プログラム |
| WO2019107315A1 (ja) * | 2017-11-28 | 2019-06-06 | 国立研究開発法人産業技術総合研究所 | モニタリング対象機器の異常発生予兆検知方法及びシステム |
| WO2019187138A1 (ja) * | 2018-03-30 | 2019-10-03 | 株式会社牧野フライス製作所 | 残寿命予測装置及び工作機械 |
| JP2019202985A (ja) | 2018-05-17 | 2019-11-28 | 旭化成ファーマ株式会社 | N−ホルミルピぺリジン含有量が低減されている、及び/又は、凍結乾燥ケーキの崩潰又は収縮が抑制されている、製剤 |
Non-Patent Citations (1)
| Title |
|---|
| See also references of EP4043853A4 |
Cited By (2)
| Publication number | Priority date | Publication date | Assignee | Title |
|---|---|---|---|---|
| JP7377919B1 (ja) | 2022-06-20 | 2023-11-10 | 上銀科技股▲分▼有限公司 | リニア伝動装置用のメンテナンス情報取得方法及びリニア伝動装置用のメンテナンス情報取得システム |
| JP2024000099A (ja) * | 2022-06-20 | 2024-01-05 | 上銀科技股▲分▼有限公司 | リニア伝動装置用のメンテナンス情報取得方法及びリニア伝動装置用のメンテナンス情報取得システム |
Also Published As
| Publication number | Publication date |
|---|---|
| JP6764516B1 (ja) | 2020-09-30 |
| CN114729850A (zh) | 2022-07-08 |
| JP2021076465A (ja) | 2021-05-20 |
| US20220410332A1 (en) | 2022-12-29 |
| EP4043853A1 (en) | 2022-08-17 |
| EP4043853A4 (en) | 2022-12-07 |
Similar Documents
| Publication | Publication Date | Title |
|---|---|---|
| JP6764516B1 (ja) | 工作機械および表示装置 | |
| Iliyas Ahmad et al. | Machine monitoring system: a decade in review | |
| Wang et al. | Sensor fusion for online tool condition monitoring in milling | |
| US20230115878A1 (en) | Machine learning method for anomaly detection in an electrical system | |
| Zhu | Big data oriented smart tool condition monitoring system | |
| CN111829782B (zh) | 一种基于自适应流形嵌入动态分布对齐的故障诊断方法 | |
| EP4172702B1 (en) | System and method for instantaneous performance management of a machine tool | |
| CN112415950B (zh) | 机器学习装置、控制系统以及机器学习方法 | |
| JP2014524094A (ja) | パターン・シーケンスを持つカーネル回帰モデリングを用いる監視システム | |
| CN111954857A (zh) | 异常事件的原因确定 | |
| EP3629118A1 (en) | Diagnostic system of machine tools | |
| Bhattacharyya et al. | On-line tool condition monitoring in face milling using current and power signals | |
| JP6759439B1 (ja) | 工作機械および表示装置 | |
| Ambadekar et al. | Artificial intelligence and its relevance in mechanical engineering from Industry 4.0 perspective | |
| CN118720853A (zh) | 机理与数据混合驱动的铣削加工切削力监测方法及系统 | |
| Yao et al. | On-line cutting force coefficients identification for bull-end milling process with vibration | |
| Seevers et al. | Automatic detection of manufacturing equipment cycles using time series | |
| Manjunath et al. | In-process monitoring of the ultraprecision machining process with convolution neural networks | |
| Ni et al. | Mechanism and data hybrid-driven cutting forces prediction model for end milling | |
| Peña et al. | Poincaré plot features and statistical features from current and vibration signals for fault severity classification of helical gear tooth breaks | |
| Wang et al. | Online tool wear prediction based on cutting force coefficients identification using neural network | |
| Kucukyildiz et al. | A multistage cutting tool fault diagnosis algorithm for the involute form cutter using cutting force and vibration signals spectrum imaging and convolutional neural networks | |
| Chen et al. | Overview of titanium alloy cutting based on machine learning | |
| Mohanraj et al. | Real-time tool condition monitoring with the internet of things and machine learning algorithms | |
| Gururaja et al. | Development of smart manufacturing framework for micromilling of thin-walled Ti6Al4V |
Legal Events
| Date | Code | Title | Description |
|---|---|---|---|
| 121 | Ep: the epo has been informed by wipo that ep was designated in this application |
Ref document number: 20884346 Country of ref document: EP Kind code of ref document: A1 |
|
| ENP | Entry into the national phase |
Ref document number: 2020884346 Country of ref document: EP Effective date: 20220511 |
|
| NENP | Non-entry into the national phase |
Ref country code: DE |