WO2021145384A1 - 環境rnaを用いた水環境の生態系の調査方法 - Google Patents
環境rnaを用いた水環境の生態系の調査方法 Download PDFInfo
- Publication number
- WO2021145384A1 WO2021145384A1 PCT/JP2021/001076 JP2021001076W WO2021145384A1 WO 2021145384 A1 WO2021145384 A1 WO 2021145384A1 JP 2021001076 W JP2021001076 W JP 2021001076W WO 2021145384 A1 WO2021145384 A1 WO 2021145384A1
- Authority
- WO
- WIPO (PCT)
- Prior art keywords
- erna
- edna
- species
- analysis
- rna
- Prior art date
- Legal status (The legal status is an assumption and is not a legal conclusion. Google has not performed a legal analysis and makes no representation as to the accuracy of the status listed.)
- Ceased
Links
Images

Classifications
-
- C—CHEMISTRY; METALLURGY
- C12—BIOCHEMISTRY; BEER; SPIRITS; WINE; VINEGAR; MICROBIOLOGY; ENZYMOLOGY; MUTATION OR GENETIC ENGINEERING
- C12Q—MEASURING OR TESTING PROCESSES INVOLVING ENZYMES, NUCLEIC ACIDS OR MICROORGANISMS; COMPOSITIONS OR TEST PAPERS THEREFOR; PROCESSES OF PREPARING SUCH COMPOSITIONS; CONDITION-RESPONSIVE CONTROL IN MICROBIOLOGICAL OR ENZYMOLOGICAL PROCESSES
- C12Q1/00—Measuring or testing processes involving enzymes, nucleic acids or microorganisms; Compositions therefor; Processes of preparing such compositions
- C12Q1/68—Measuring or testing processes involving enzymes, nucleic acids or microorganisms; Compositions therefor; Processes of preparing such compositions involving nucleic acids
- C12Q1/6876—Nucleic acid products used in the analysis of nucleic acids, e.g. primers or probes
- C12Q1/6888—Nucleic acid products used in the analysis of nucleic acids, e.g. primers or probes for detection or identification of organisms
-
- C—CHEMISTRY; METALLURGY
- C12—BIOCHEMISTRY; BEER; SPIRITS; WINE; VINEGAR; MICROBIOLOGY; ENZYMOLOGY; MUTATION OR GENETIC ENGINEERING
- C12Q—MEASURING OR TESTING PROCESSES INVOLVING ENZYMES, NUCLEIC ACIDS OR MICROORGANISMS; COMPOSITIONS OR TEST PAPERS THEREFOR; PROCESSES OF PREPARING SUCH COMPOSITIONS; CONDITION-RESPONSIVE CONTROL IN MICROBIOLOGICAL OR ENZYMOLOGICAL PROCESSES
- C12Q1/00—Measuring or testing processes involving enzymes, nucleic acids or microorganisms; Compositions therefor; Processes of preparing such compositions
- C12Q1/68—Measuring or testing processes involving enzymes, nucleic acids or microorganisms; Compositions therefor; Processes of preparing such compositions involving nucleic acids
- C12Q1/6844—Nucleic acid amplification reactions
- C12Q1/686—Polymerase chain reaction [PCR]
-
- C—CHEMISTRY; METALLURGY
- C12—BIOCHEMISTRY; BEER; SPIRITS; WINE; VINEGAR; MICROBIOLOGY; ENZYMOLOGY; MUTATION OR GENETIC ENGINEERING
- C12Q—MEASURING OR TESTING PROCESSES INVOLVING ENZYMES, NUCLEIC ACIDS OR MICROORGANISMS; COMPOSITIONS OR TEST PAPERS THEREFOR; PROCESSES OF PREPARING SUCH COMPOSITIONS; CONDITION-RESPONSIVE CONTROL IN MICROBIOLOGICAL OR ENZYMOLOGICAL PROCESSES
- C12Q1/00—Measuring or testing processes involving enzymes, nucleic acids or microorganisms; Compositions therefor; Processes of preparing such compositions
- C12Q1/68—Measuring or testing processes involving enzymes, nucleic acids or microorganisms; Compositions therefor; Processes of preparing such compositions involving nucleic acids
- C12Q1/6869—Methods for sequencing
-
- Y—GENERAL TAGGING OF NEW TECHNOLOGICAL DEVELOPMENTS; GENERAL TAGGING OF CROSS-SECTIONAL TECHNOLOGIES SPANNING OVER SEVERAL SECTIONS OF THE IPC; TECHNICAL SUBJECTS COVERED BY FORMER USPC CROSS-REFERENCE ART COLLECTIONS [XRACs] AND DIGESTS
- Y02—TECHNOLOGIES OR APPLICATIONS FOR MITIGATION OR ADAPTATION AGAINST CLIMATE CHANGE
- Y02A—TECHNOLOGIES FOR ADAPTATION TO CLIMATE CHANGE
- Y02A40/00—Adaptation technologies in agriculture, forestry, livestock or agroalimentary production
- Y02A40/80—Adaptation technologies in agriculture, forestry, livestock or agroalimentary production in fisheries management
- Y02A40/81—Aquaculture, e.g. of fish
Definitions
- the present invention relates to a method for investigating an ecosystem of an aquatic environment using environmental RNA.
- RNA molecules may have a larger number of copies in cells than the DNA corresponding to the RNA, but are generally more likely to be degraded and therefore less likely to remain in the environment than DNA. Therefore, while eRNA is expected to reflect the current state of organisms in the environment more than eDNA, it was not clear whether it could be used as a marker for detecting organisms in the environment. Recently, an attempt to detect an organism in an aquatic environment using eRNA has been reported (Non-Patent Documents 3 to 6).
- Patent Document 1 Japanese Unexamined Patent Publication No. 2017-99376
- Non-Patent Document 2 Miya et al., Royal Society Open Science, 2015, 2 (7): 150088, doi: 10.1098 / rsos.150088
- Non-Patent Document 3 Tsuri et al., 66th Annual Meeting of the Ecological Society of Japan, February 20, 2019, http://www.esj.ne.jp/meeting/abst/66/P1-479.html
- Non-Patent Document 4 Nakamichi et al., Abstracts of the 66th Annual Meeting of the Ecological Society of Japan, February 20, 2019, http://www.esj.ne.jp/meeting/abst/66/P1-481.html
- Non-Patent Document 5 Kang et al., Abstracts of the 66th
- the present invention is a method for analyzing a species that survives in an aquatic environment. Quantitatively analyzing RNA contained in the aquatic environment and quantitatively evaluating the species living in the aquatic environment. Provide methods, including.
- water environment includes seas, rivers, lakes, ponds, swamps, tidal flats, glaciers, farms, aquariums, and their shores and bottoms.
- eDNA eDNA
- eRNA RNA contained in environmental samples such as water, mud, rock surface, and soil, respectively.
- the present inventor clarified the usefulness of eRNA metabarcoding analysis by comparing the results of classical ecosystem surveys on rivers with the results of metabarcoding analysis using eRNA / eDNA in aquatic environment samples. I made it.
- the present invention relates to a method for investigating an ecosystem of a water environment using environmental RNA. More specifically, the present invention provides a method for analyzing a species that survives in an aquatic environment. The method comprises comprehensively and / or quantitatively analyzing RNA (eRNA) contained in a water environment of interest.
- eRNA quantitatively analyzing RNA
- the species from which the eRNA is derived can be quantified by performing a quantitative analysis of the eRNA contained in the target water environment. Furthermore, the eRNA can be comprehensively analyzed to comprehensively identify the species that survive in the aquatic environment. This enables comprehensive identification of species living in the aquatic environment and / or quantitative evaluation of the amount thereof (for example, biomass or number of individuals, or increase / decrease thereof).
- the amount thereof for example, biomass or number of individuals, or increase / decrease thereof.
- only eRNA may be measured, but both eRNA and eDNA may be analyzed. By comparing the analysis results of both, more accurate ecological surveys that eliminate false positives and analysis of pollution sources and pollution levels in the aquatic environment will be possible.
- the eRNA and eDNA contained in the aquatic environment may be prepared according to a conventional method. For example, after obtaining a water environment sample by collecting water in the surface layer or deep part of the sea, rivers, lakes, ponds, swamps, farms, aquariums, etc., or collecting mud at the bottom of them, the water environment RNA or DNA may be extracted from the sample. Extraction of RNA and DNA from aquatic samples can be performed according to conventional methods. For example, after filtering the sample, RNA or DNA contained in the filtrate is extracted using a phenol / chloroform method, an AGPC (acid guanidinium thiocyanate-phenol-chromoform extension) method, a commercially available RNA or DNA extraction reagent, or the like. Just do it. The extracted RNA and DNA may be used immediately for analysis, or may be stored according to a conventional method (for example, stored frozen at ⁇ 80 ° C. or ⁇ 20 ° C.).
- AGPC acid guanidinium thiocyanate-phenol-
- the extracted eRNA derived from the aquatic environment sample may be used for various analyzes in the form of RNA, or may be converted into DNA.
- the eRNA derived from the aquatic environment sample is converted to cDNA by reverse transcription and then used for various analyzes.
- a general reverse transcriptase or reverse transcriptase can be used for reverse transcription of RNA.
- Examples of commercially available reverse transcriptases include PrimeScript (registered trademark) Reverse Transcriptase series (Takara Bio Inc.) and SuperScript (registered trademark) Reverse Transcriptase series (Thermo Scientific).
- RNA metabarcoding cDNA derived from marker RNA useful for determining species such as 12S rRNA and 16S rRNA is selectively amplified from cDNA prepared from sample RNA to prepare a library, and the library is sequenced. A method of singing and matching the determined sequence with the genomic sequence encoding the marker RNA of each species.
- Selective amplification of regions useful for species determination includes universal primers constructed for fish, arthropods, algae, etc., such as MiFish (Non-Patent Document 1), which is a universal primer for fish, arthropods. It can be carried out by PCR using gInsec (Biological Research Institute Co., Ltd.), photosynthetic biological primer (psbA) (Biological Technology Research Institute Co., Ltd.), etc. The sequence of the genome of the organism to be collated with the sequencing result can be obtained using a tool such as BLAST ([blast.ncbi.nlm.nih.gov/Blast.cgi]).
- Quantitative analysis of the extracted eRNA can be performed on a part of the species from which the eRNA identified in the above comprehensive analysis is derived, but it is performed comprehensively on the identified species. That is, it is preferable that it is a comprehensive quantitative analysis.
- the quantitative analysis the amount of eRNA derived from each species identified in the comprehensive analysis is examined, and the species living in the aquatic environment are quantified.
- Quantitative analysis can be performed based on, for example, the number of sequence reads obtained by sequencing in the above-mentioned next-generation sequencing or RNA metabarcoding.
- the large number of reeds and the abundance of reed types are the abundance of eRNA species present in the sample, that is, the abundance of organisms that survive in the aquatic environment from which they are derived, and the abundance of species of the eRNA species.
- the amount of eRNA is calculated in advance by calculating the correlation between the quantitative value of eRNA derived from a predetermined species (for example, the number of sequence reads) and the number of individuals of the species observed in the actual field survey. It is also possible to estimate the population of the species from.
- the organism species that survive at the water sampling point are identified and / or quantified using the eRNA contained in the aquatic environment. Because eRNA is less stable and less residual to the environment than eDNA, analysis of eRNA allows accurate identification and / or quantification of species living in the aquatic environment compared to analysis of eDNA.
- eDNA is derived from DNA contained in pollutants mixed from the outside environment (for example, food waste contained in domestic wastewater, fish landed in fishing ports, etc.) in addition to the species living at the water sampling point. Species are also detected (see Examples below). No method has been reported that can efficiently identify false positives in eDNA analysis or estimate the source of contamination containing eDNA.
- eRNA is the only index that can analyze only the species that survive at the water sampling point.
- Comprehensive identification of biological species by metabar coding analysis of eRNA is more polluted from the outside environment than when using eDNA (for example, DNA of fish contained in food waste contained in human domestic wastewater, DNA of fish etc. contained in human domestic wastewater, and DNA of fish etc. It is not easily affected by DNA contamination of fish derived from fishing ports, and there are few false positives (see Examples below). Therefore, by using eRNA as a marker for species, more accurate ecosystem surveys (identification and quantification of surviving species, etc.) become possible.
- the analysis of eRNA according to the present invention may be performed in combination with the analysis of eDNA contained in the same water environment.
- the same method as the above-mentioned RNA comprehensive analysis and quantification such as next-generation sequencing and DNA metabarcoding, can be performed for the comprehensive analysis and quantification of the eDNA. ..
- DNA metabarcoding is preferred.
- DNA metabarcoding can be performed in the same procedure as RNA metabarcoding except that DNA extracted from the sample is used.
- those not identified by eRNA analysis can be identified as species that do not survive at the point of water sampling.
- those not identified by eRNA analysis can be identified as species that do not survive at the point of water sampling.
- the ratio of the quantitative value of eRNA to the quantitative value of eDNA for a predetermined organism is, for example, the formula (1): [number of reads of eRNA or eDNA ( Whichever is smaller)] / [Number of reads of eRNA or eDNA (whichever is larger)], but is not limited to this) is preferable as an index for evaluating false positives.
- the eNA ratio according to the formula (1) for the organism that survives in the target aquatic environment is higher than the eNA ratio for the organism that does not survive in the aquatic environment. Can be evaluated as to whether or not is a false positive due to false positives.
- the significant decrease in the eNA ratio in terrestrial arthropods mixed in the aquatic environment may be not only when the amount of eRNA ⁇ the amount of eDNA but also when the amount of eDNA ⁇ the amount of eRNA. Therefore, the combined use of eDNA analysis and eRNA analysis enables more accurate identification and / or quantification of species living in the aquatic environment than eRNA analysis alone.
- the combined use of eDNA analysis and eRNA analysis is an ecological survey with few false positives, or an evaluation of pollution of the water environment by biological waste derived from the outside environment (for example, biological waste contained in domestic wastewater and waste from fishing ports), for example. It can contribute to the analysis of pollution sources and pollution levels in the aquatic environment.
- [1] A method for analyzing species that survive in the aquatic environment. Quantitatively analyzing RNA contained in the aquatic environment and quantitatively evaluating the species living in the aquatic environment. Including methods. [2] The method according to [1], preferably comprising comprehensively analyzing RNA contained in the aquatic environment to comprehensively identify a species living in the aquatic environment. [3] The organism Preferably including fish, algae and arthropods More preferably fish, The method according to [1] or [2]. [4] The method according to any one of [1] to [3], wherein the analysis of the RNA is preferably performed by metabarcoding of the RNA.
- [5] The method according to [4], wherein the quantitative analysis of the RNA is preferably performed based on the number of sequence reads obtained by the metabarcoding.
- the quantitative analysis of the DNA is preferably performed based on the number of sequence reads obtained by the metabarcoding.
- [9] Preferably, [6] to [8] include comprehensively identifying the species living in the aquatic environment by comparing the analysis result of the RNA with the analysis result of the DNA.
- the method according to [9], wherein the comprehensive identification of the species preferably comprises the identification of a false positive species.
- [11] Preferably, [6] to [10] include quantitatively evaluating the species living in the aquatic environment by comparing the analysis result of the RNA with the analysis result of the DNA.
- the method according to any one item. [12] The method according to [10], which preferably identifies a false-positive species based on the ratio of the quantitative value of RNA to the quantitative value of DNA for the species.
- the method according to [11], wherein the ratio of the quantified value of RNA and the quantified value of DNA for the species is expressed as the following eNA ratio.
- the water environment includes seas, rivers, lakes, ponds, swamps, tidal flats, glaciers, farms, aquariums, and their shores and bottoms. More preferably, it includes seas, rivers, lakes, ponds, swamps, tidal flats, glaciers, and their shores and bottoms in a non-breeding natural environment.
- the method according to any one of [1] to [13].
- Example 1 Metabar coding of eDNA and eRNA derived from aquatic environment sample 1 Preparation of eDNA and eRNA derived from aquatic environment sample 1.
- the aquatic environment sample used for the test was from July 2018 to February 2019 in the Naka River in the middle reaches of the Naka River in Japan. It was collected from two sites, Ohashi (N36 ° 32'55 ", E140 ° 19'34") and Shin-Naka Bridge (N36 ° 45'26 ", E140 ° 08'30"). 1.5 L of water was collected from the surface of the river using a bucket. Water samples were immediately filtered using a Steivex TM filter unit (pore size 0.45 ⁇ m: millipore).
- EDNA and eRNA were extracted from the water sample.
- eDNA use DNeasy Blood and Tissue Kit (QIAGEN), but add a 15% polyvinylpyrrolidone (PVPP) solution to Buffer AL (addition of RNaseA, Proteinase K) of the kit so that the final concentration is 2.5%.
- PVPP polyvinylpyrrolidone
- Buffer AL addition of RNaseA, Proteinase K
- the extracted eDNA was purified using MPure Bacterial DNA Exhibition Kit (MP Biomedicals) and AMPure XP (Beckman Coulter).
- the eRNA was extracted using ChargeSwitch Total RNA Cell Kit (Thermo Fisher Scientific) according to the recommended protocol.
- cDNA was synthesized according to the recommended protocol using PrimeScript II 1st Strand cDNA Synthesis Kit (Takara Bio Inc.). EDNA and eRNA were similarly extracted and cDNA was synthesized using deionized water as a control, and the presence or absence of cross-contamination during eDNA / eRNA extraction and cDNA synthesis was confirmed.
- the amplicon library having a partial length of 12S rRNA gene, 16S rRNA gene and psbA gene includes fish primers MiFish-U and MiFish-E33 (Non-Patent Document 1), and gInsect and psbA. Made using (Biological Research Institute Co., Ltd.).
- the amplicon library was prepared by the two step tailed PCR method. In the first PCR, as a template, a 3-fold diluted solution of the eDNA solution prepared in 1) with DDW was used, and for the cDNA, the cDNA solution prepared in 1) was used. Each primer was set to 0.5 ⁇ M.
- PCR In PCR, with MiFish-U, MiFish-E33 and gInsec primers, 35 cycles of 95 ° C. for 3 minutes followed by a cycle of 98 ° C. for 20 seconds, 65 ° C. for 15 seconds and 52 ° C. for 30 seconds were performed, followed by 72. Final elongation at ° C. for 5 minutes.
- the psbA primer was subjected to 30 cycles consisting of 94 ° C. for 2 minutes, 94 ° C. for 30 seconds, 52 ° C. for 30 seconds, and 72 ° C. for 30 seconds, followed by final elongation at 72 ° C. for 5 minutes.
- First PCR was performed four times for each eDNA and cDNA sample, and the obtained four PCR products were combined into one and used for second PCR.
- second PCR a 0.5 ⁇ M primer pair containing a MiSeq adapter sequence and an 8 bp index sequence was used to ligate the adapter sequence and index sequence at both ends of the amplicon.
- a cycle consisting of 94 ° C. for 2 minutes, 94 ° C. for 30 seconds, 60 ° C. for 30 seconds, and 72 ° C. for 30 seconds was performed for 10 to 12 cycles, and then the final extension was performed at 72 ° C. for 5 minutes. did.
- the obtained amplification product was used as an amplicon library.
- Example 2 Performance evaluation of metabar coding in biota evaluation of ecosystem survey 1 Field survey A field survey (TFS) of algae and arthropods was carried out.
- the TFS of arthropods was performed at the same survey point / season as the water environment sample, according to the method described in the 27th edition of the "River Environment Census Manual" (River Environment Division, Water Management and Land Conservation Bureau, Ministry of Land, Infrastructure, Transport and Tourism). .. Samples were collected by qualitative sampling using a net and quantitative sampling using a 25 cm 2 ⁇ 25 cm 2 (250 ⁇ m square) quadrate. When quadrat was used, sampling was performed at 3 points at each survey point / season.
- the TFS of algae focused on rock epiphytic algae.
- Sensitivity (%) ⁇ (number of species belonging to the true positive group detected by eDNA or eRNA metabar coding) / (total number of species belonging to the true positive group) ⁇ ⁇ 100
- Positive prediction rate (%) ⁇ (number of species belonging to the true positive group detected by eDNA or eRNA metabarcoding) / (total number of species detected by eDNA or eRNA metabarcoding) ⁇ x 100
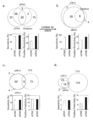
- FIG. 1 is a Venn diagram showing species detected by eDNA / eRNA metabarcoding analysis and TFS for fish, algae and arthropods, and a graph showing the sensitivity and positive prediction rate of the eDNA / eRNA analysis.
- eRNA analysis 77 species and 51 species were detected by eDNA and eRNA analysis, respectively, and 20 and 22 species out of 37 species detected by TFS were included, respectively. Forty-six species were commonly detected in eDNA and eRNA analysis. The sensitivity of eRNA analysis (59%) was slightly higher than the sensitivity of eDNA analysis (54%), and the positive prediction rate of eRNA analysis (43%) was much higher than the positive prediction rate of eDNA analysis (26%). (Fig. 1a). When the observation point was limited to Shin-Nakabashi (Fig. 1b), the eRNA analysis detected all the fish species detected by TFS, but the eDNA analysis overlooked one species. The sensitivity and positive predictive value of eRNA analysis for fish species detection at this station were 100% and 20%, respectively, which eliminated false negatives, but detected false positives and eRNA analysis species with TFS. Indicates that it may contain true positives that were not.
- eDNA and eRNA analysis 80 species and 82 species were detected by eDNA and eRNA analysis, respectively, which corresponded to the number of species detected by TFS (84 species). However, only 12 species were detected in common with TFS. Conversely, almost all species (78 species) detected by eDNA and eRNA analysis were common to both analyzes, and the sensitivity and positive prediction rate of eDNA and eRNA analysis were similar (sensitivity: 14%, Positive prediction rate: 15%) (Fig. 1c). It was considered that the cause of the discrepancy between the results of eDNA / eRNA analysis and TFS was that TFS focused on algae attached to river stones, while eDNA and eRNA were collected from surface water.
- eDNA and eRNA analysis For arthropods, 44 and 23 species were detected by eDNA and eRNA analysis, respectively, and 147 species were detected by TFS. Twenty-one species were common between eDNA and eRNA analysis, but only three species were common to eDNA and eRNA analysis and TFS. The sensitivity of eDNA and eRNA analysis was comparable at 2%. The positive predictive value of eRNA (13%) was higher than that of eDNA (7%) (Fig. 1d).
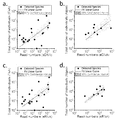
- FIG. 2 is a scatter plot in which the number of individuals (depending on the amount of biomass) of each species detected by TFS is plotted against the number of sequencing reads calculated by eDNA / eRNA metabarcoding analysis.
- 2a and 2b are plots for eDNA
- FIGS. 2c and 2d are plots for eRNA.
- the average number of total sequencing reads (reads) in the eDNA and eRNA metabarcoding analysis performed at the same period was calculated and used as the number of reads by the eDNA and eRNA analysis, respectively.
- species having a read length of ⁇ 10 bp for both eDNA and eRNA were excluded, and 1 was added to all read numbers for drawing on a logarithmic scale.
- the correlation strength between eDNA and eRNA was equal.
- eRNA and eDNA can be used as an evaluation index of biomass existing in the aquatic environment.
- eDNA has a high risk of false positives as described later, and quantitative values were often calculated even for species that did not survive at the water sampling point.
- the correlation between the number of sequencing reads and the number of individuals (biomass amount) was analyzed including the organisms not detected by TFS, the correlation of eRNA was higher than that of eDNA. Therefore, eRNA analysis was considered to be superior to eDNA analysis as a method for quantitative evaluation of species in ecosystems as an alternative to field research.
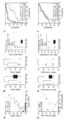
- FIG. 3 is a scatter plot plotting the number of sequencing reads between eDNA analysis and eRNA analysis for fish, algae and arthropods. The number of reads in eRNA analysis of fish, algae and arthropods was similar to the number of reads in eDNA analysis, and a positive correlation was observed.
- eNA ratio [Number of reads of eRNA or eDNA (whichever is smaller)] / [Number of reads of eRNA or eDNA (whichever is larger)]
- sensitivity and specificity of eDNA analysis, eRNA analysis, and eNA ratio were determined according to the following formulas, a ROC (Receiver Operating Characteristic) curve was created, and the effectiveness as an index capable of eliminating false positives was examined.
- Sensitivity (%) ⁇ (Number of species belonging to freshwater fish or aquatic arthropods detected by eDNA or eRNA metabar coding when the number of reads as a threshold is changed) / (eDNA or eRNA metabar Number of species belonging to freshwater fish or aquatic arthropods detected by coding) ⁇ x 100
- Specificity (%) ⁇ (Number of species belonging to seawater and steam fish or terrestrial arthropods detected by eDNA or eRNA metabar coding when the number of reads as a threshold is changed) / ( Number of species belonging to seawater and steam fish, or terrestrial arthropods detected by eDNA or eRNA metabar coding) ⁇ x 100
- FIG. 4a is a scatter diagram plotting the number of sequencing reads between eDNA and eRNA analysis for freshwater fish (FW), saltwater fish (SW), steamed fish (BW), and unknown species of fish.
- 4b shows a box whiskers of the number of eDNA reads, the number of eRNA reads and the eNA ratio for freshwater fish (FW) and saltwater fish (SW) + steamed fish (BW), and
- FIG. 4c shows the ROC curve. Twenty-nine of the 36 species, which were identified by eDNA analysis but whose read number was hardly detected by eRNA analysis, are saltwater fish that are not considered to exist in the water environment (middle river) where they were collected. It was SW) or saltwater fish (BW).
- the eDNA analysis detects a species that does not survive in the aquatic environment as a false positive, and therefore is not suitable as an accurate evaluation method for the species that survives in the aquatic environment.
- the eRNA read number and eNA ratio of freshwater fish (FW) living in the sampled water environment are more statistical than the eNA ratio of seawater / brackish water fish (SW + BW) that do not survive in the sampled water environment.
- Significantly higher and clearly different distributions (Fig. 4b, * p ⁇ 0.05, ** p ⁇ 0.001; because the variance was unequal than the F-test, the Spearman correlation test and Wilcoxon rank signed rank The sum test was performed).
- FIG. 4df shows the results of the same analysis as in FIG. 4ac for aquatic arthropods (Aquatic) and terrestrial arthropods (Terrestrial).
- the significant decrease in the eNA ratio of seawater / brackish fish is mainly due to the amount of eRNA ⁇ the amount of eDNA. This is because the eDNA of organisms that do not survive in the aquatic environment is accumulated in the aquatic environment, but the abundance ratio of eDNA and eRNA is different because the eRNAs of those organisms are decomposed without being accumulated in the aquatic environment. It was thought that the cause was. In addition, in domestic wastewater containing fish nucleic acids that may be mixed in river water, only eDNA remains, and there is a possibility that eRNA has already been decomposed.
- the amount of eRNA ⁇ the amount of eDNA and the amount of eDNA ⁇ the amount of eRNA.
- the former may be due to the elution of nucleic acids containing more eDNA into river water from individuals with advanced degradation of eRNA that died near the river, and the latter is more than DNA that has just died. This may also be due to the fact that the eRNA concentration is maintained in a low fluid environment after the nucleic acid of an individual with a high RNA abundance has flowed out into river water.
- the fluctuation of the amount ratio of eDNA to eRNA seen in the pollution source from the outside environment can be observed as a significant decrease in the eNA ratio, so the organism with a significantly low eNA ratio is not a species that survives in the aquatic environment. There is a possibility. Also, in quantitative evaluation, as described above, since a certain quantitative value is calculated even for species that are false positives in the analysis of eDNA, an evaluation method using eRNA or using both eDNA and eRNA is available. It was considered valid.
- the eRNA and eNA ratios are used as indicators for comprehensively identifying and quantifying species of fish and arthropods that live in the aquatic environment without erroneously detecting species that do not live in the aquatic environment. It has been shown to be valid.
Landscapes
- Chemical & Material Sciences (AREA)
- Life Sciences & Earth Sciences (AREA)
- Organic Chemistry (AREA)
- Proteomics, Peptides & Aminoacids (AREA)
- Zoology (AREA)
- Wood Science & Technology (AREA)
- Health & Medical Sciences (AREA)
- Engineering & Computer Science (AREA)
- Analytical Chemistry (AREA)
- Microbiology (AREA)
- Bioinformatics & Cheminformatics (AREA)
- Molecular Biology (AREA)
- Biotechnology (AREA)
- Biophysics (AREA)
- Physics & Mathematics (AREA)
- Biochemistry (AREA)
- Immunology (AREA)
- General Engineering & Computer Science (AREA)
- General Health & Medical Sciences (AREA)
- Genetics & Genomics (AREA)
- Chemical Kinetics & Catalysis (AREA)
- Measuring Or Testing Involving Enzymes Or Micro-Organisms (AREA)
- Farming Of Fish And Shellfish (AREA)
Abstract
簡便で、環境負荷が低く、且つ正確性の高い生態系調査方法の提供。水環境に生存する生物種の解析方法。該方法では、水環境に含まれるRNAを解析することで、該水環境に生存する生物種を定量的に評価し、さらには網羅的に特定する。
Description
本発明は、環境RNAを用いた水環境の生態系の調査方法に関する。
魚類や藻類などの水産資源の保全と持続的利用に対する関心が世界的に高まっている。水産資源の保全及び管理において、水産資源の存在する水環境の生態系調査は重要な役割を果たしている。水環境の生態系調査において、魚類、藻類、及び節足動物は生態系の指標となるモデル生物として長らく使用されている。しかしながら、従来の水環境の生態系調査方法、すなわち釣り、罠などで個体を捕獲する手法や、目視やカメラ撮影等の個体観察に依存した方法は、種判定に専門知識を要し、またコストと労力、及び環境への負荷がかかるうえ、網羅性及び再現性が充分とはいえない。
生態系調査方法として、近年、バイオモニタリング技術が着目されている。特に、水や土壌などの環境サンプル中に含まれるDNA(いわゆる、環境DNA;environmental DNA、eDNA)の解析は、生態系調査に大きなブレークスルーを起こすと期待されている。例えば水環境由来のeDNAは、多くの場合、水棲生物の個体から水環境に放出されるDNAに由来すると考えられる(特許文献1)。eDNAのメタバーコーディング解析を用いた水環境中の生態系調査が試みられている。例えば、魚類のミトコンドリアDNAをターゲットとしたeDNAメタバーコーディング解析用のユニバーサルPCRプライマーのセットが開発され、魚類の定量的モニタリングに有用であることが報告されている(非特許文献1、2)。しかしながら、eDNAは安定性が高く環境中に長く存在するため、eDNAを用いた生態系調査は偽陽性(誤検出)が生じる可能性が否定できない。特に、河川や湾については、生活排水や漁港由来の魚類等のeDNAによって汚染されている可能性があるため、メタバーコーディング解析により推定された生物種の全てが、サンプリングした環境に存在しているとは限らない。実際、水揚げされた魚に由来するeDNAが、漁港付近の海中に多く存在してeDNA解析に深刻な影響を与えることが示されている。
環境中に、eDNAとともに環境RNA(environmental RNA、eRNA)が存在することを示唆する報告がある。RNA分子は、細胞中ではそのRNAに対応するDNAよりもコピー数が多い場合があるが、一般的に分解されやすいためDNAよりも環境中に残りにくいと考えられる。そのため、eRNAは、eDNAよりも環境中の生物の現在の状態を反映している可能性が期待される一方で、環境中の生物の検出マーカーとして実用できるものであるかは明らかではなかった。最近、eRNAを用いて水環境中の生物を検出する試みが報告された(非特許文献3~6)。それらの報告では、eRNAはeDNAと同様に、特定の魚種の検出に使用でき、またメタバーコーディング解析による生態系調査が実施できたことを報告したが、検出種の組成はeDNAと大きな違いはなく、eRNAが持つ誤検出における有用性は報告されていない。
(特許文献1)特開2017-99376号公報
(非特許文献1)Miya et al., Royal Society Open Science, 2015, 2(7):150088, doi: 10.1098/rsos.150088
(非特許文献2)Ushio et al., Metabarcoding and Metagenomics, 2018, 2:1-15
(非特許文献3)釣ら、第66回日本生態学会大会要旨集、2019年2月20日、http://www.esj.ne.jp/meeting/abst/66/P1-479.html
(非特許文献4)中道ら、第66回日本生態学会大会要旨集、2019年2月20日、http://www.esj.ne.jp/meeting/abst/66/P1-481.html
(非特許文献5)姜ら、第66回日本生態学会大会要旨集、2019年2月20日、http://www.esj.ne.jp/meeting/abst/66/P2-074.html
(非特許文献6)伊地知ら、第1回日本環境DNA学会東京大会要旨集、2018年9月18日、28頁P55
本発明は、水環境に生存する生物種の解析方法であって、
水環境に含まれるRNAを定量的に解析して、該水環境に生存する該生物種を定量的に評価すること、
を含む、方法を提供する。
水環境に含まれるRNAを定量的に解析して、該水環境に生存する該生物種を定量的に評価すること、
を含む、方法を提供する。
本明細書において、「水環境」とは、海、河川、湖、池、沼、干潟、氷河、養殖場、水槽、ならびにそれらの岸辺及び底、などを含む。好ましくは飼育水でない自然環境の海、河川、湖、池、沼、干潟、氷河、ならびにそれらの岸辺及び底である。
本明細書において、「環境DNA(eDNA)」及び「環境RNA(eRNA)」とは、それぞれ水、泥、岩肌、土壌などの環境サンプル中に含まれるDNA及びRNAをいう。
簡便で、環境負荷が低く、且つ正確性の高い生態系調査方法が求められている。
本発明者は、河川についての古典的な生態系調査結果と、水環境サンプル中のeRNA/eDNAを用いたメタバーコーディング解析結果とを比較することにより、eRNAメタバーコーディング解析の有用性を明らかにした。
本発明は、環境RNAを用いた水環境の生態系調査方法に関する。より詳細には、本発明は、水環境に生存する生物種の解析方法を提供する。該方法は、対象とする水環境に含まれるRNA(eRNA)を網羅的及び/又は定量的に解析することを含む。
本発明の方法によれば、従来のバイオモニタリング技術を用いた生態系調査方法、例えばeDNAを用いたメタバーコーディング解析と比べて、偽陽性を低減し、より正確に水環境の生態系を調べることができる。
本発明の方法においては、対象とする水環境に含まれるeRNAの定量解析を行うことにより、該eRNAが由来する生物種を定量することができる。さらにはeRNAを網羅的に解析して、該水環境に生存する生物種を網羅的に特定することもできる。これにより、該水環境に生存する生物種の網羅的特定、及び/又はその量(例えばバイオマスもしくは個体数、又はそれらの増減)の定量評価が可能になる。本発明の方法においては、eRNAのみを測定対象としてもよいが、eRNAとeDNAの両者を解析してもよい。両者の解析結果を比較することで、偽陽性を排除したより正確な生態調査や、水環境の汚染源や汚染度の分析が可能になる。
水環境に含まれるeRNA及びeDNAの調製は、常法に従って行えばよい。例えば海、河川、湖、池、沼、養殖場、水槽などの表層や深部の水を採取したり、それらの底部の泥を採取したりすることによって水環境サンプルを得た後、該水環境サンプルからRNA又はDNAを抽出すればよい。水環境サンプルからのRNA及びDNAの抽出は、常法に従って行うことができる。例えば、サンプルをろ過した後、ろ液に含まれるRNA又はDNAを、フェノール/クロロホルム法、AGPC(acid guanidinium thiocyanate-phenol-chloroform extraction)法、又は市販のRNA又はDNA抽出試薬等を用いて抽出すればよい。抽出されたRNA及びDNAは、直ちに解析に使用してもよいが、常法に従って保存(例えば-80℃下又は-20℃下で冷凍保存)されてもよい。
抽出された水環境サンプル由来のeRNAは、RNAの形態のまま各種解析に使用されてもよいが、DNAに変換されてもよい。好ましくは、該水環境サンプル由来のeRNAは、逆転写によりcDNAに変換されたのち、各種解析に使用される。RNAの逆転写には、一般的な逆転写酵素または逆転写試薬を使用することが出来る。市販の逆転写試薬の例としては、PrimeScript(登録商標)Reverse Transcriptaseシリーズ(タカラバイオ社)、SuperScript(登録商標)Reverse Transcriptaseシリーズ(Thermo Scientific社)等が挙げられる。
抽出されたeRNAには、RNAの網羅解析に使用することができる各種方法を応用することができる。該網羅解析により、抽出されたeRNAがどの生物種に由来するものかを調べて、水環境に生存している生物種を特定する。RNAの網羅解析法としては、RNA次世代シーケンシング、RNAメタバーコーディング、などが挙げられる。このうち、RNAメタバーコーディングが好ましい。RNAメタバーコーディングは、サンプルRNAから調製したcDNAから、例えば12S rRNA、16S rRNAなどの種の判定に有用なマーカーRNAに由来するcDNAを選択的に増幅してライブラリを作製し、該ライブラリをシーケンシングし、決定された配列を各生物種の該マーカーRNAをコードするゲノム配列と照合させる方法である。種の判定に有用な領域の選択的な増幅は、魚類、節足動物、藻類等のために構築されたユニバーサルプライマー、例えば、魚類のユニバーサルプライマーであるMiFish(非特許文献1)、節足動物のユニバーサルプライマーであるgInsect(株式会社生物技研)、光合成生物プライマー(psbA)(株式会社生物技研)など、を用いたPCRによって行うことができる。シーケンシング結果と照合させる生物種のゲノムの配列はBLAST([blast.ncbi.nlm.nih.gov/Blast.cgi])などのツールを用いて取得することができる。
抽出されたeRNAの定量解析は、上記網羅解析で特定された該eRNAが由来する生物種のうちの一部に対して行うこともできるが、該特定された生物種に対して網羅的に行う、すなわち網羅的定量解析であることが好ましい。該定量解析により、上記網羅解析で特定された各生物種由来eRNAの量を調べ、水環境に生存している生物種を定量する。定量解析は、例えば、上述の次世代シーケンシングやRNAメタバーコーディングにおけるシーケンシングで得られたシーケンスリードの数を基準にして行うことができる。リード数の多さ、及びリードの種類の豊富さは、サンプルに存在したeRNA種、つまりそれが由来する水環境に生存する生物種の量の多さ、及び該生物種の種数の豊富さを反映する。さらに、所定の生物種に由来するeRNAの定量値(例えばシーケンスリード数)と、実際のフィールド調査で観測された該生物種の個体数との相関関係を予め算出しておくことによって、eRNA量から該生物種の個体数を推定することも可能である。
以上の手順で、本発明では、水環境に含まれるeRNAを用いて、採水ポイントに生存する生物種を特定し、及び/又は定量する。eRNAはeDNAより安定性が低く環境への残存が少ないため、eRNAの解析は、eDNAの解析と比べて、水環境に生存する生物種の正確な特定及び/又は定量を可能にする。これに対しeDNAは、採水ポイントに生存する生物種に加えて、外環境から混入する汚染源(例えば生活排水に含まれる食品ゴミや、漁港に水揚げされる魚類等)に含まれるDNAに由来する生物種をも検出する(後述の実施例参照)。eDNA分析の偽陽性を効率的に見極められる方法や、eDNAが含まれる汚染源を推定可能な方法は報告されていない。つまり、採水ポイントに生存する生物種のみを解析可能な指標はeRNAのみである。eRNAのメタバーコーディング解析による網羅的な生物種の特定は、eDNAを用いた場合と比べて、外環境からの汚染(例えば人間の生活排水に含まれる食品ゴミに含まれる魚類等のDNAや、漁港由来の魚類等のDNAによる汚染)の影響を受けにくく、偽陽性が少ない(後述の実施例参照)。したがって、生物種のマーカーとしてeRNAを用いることで、より正確性の高い生態系調査(生存する生物種の特定や定量など)が可能になる。
本発明によるeRNAの解析は、同じ水環境に含まれるeDNAの解析と組み合わせて行われてもよい。本発明においてeRNAとともにeDNAも解析する場合、該eDNAの網羅解析及び定量には、上述したRNAの網羅解析及び定量と同様の手法、例えば次世代シーケンシング、DNAメタバーコーディングなどを行うことができる。このうち、DNAメタバーコーディングが好ましい。DNAメタバーコーディングは、サンプルから抽出したDNAを用いる以外は、RNAメタバーコーディングと同様の手順で行うことができる。該eRNAとeDNAの解析結果を比較することで、水環境の生態調査に有用な情報を得ることができる。例えば、eDNA解析で特定された生物種のうち、eRNA解析によって特定されないものは、採水したポイントに生存しない生物種として特定できる。また、水環境に混入した古い死骸由来のDNAや新鮮な死骸からの大量のRNAの放出等に起因して、採水したポイントに生存しない生物種ではeDNA量とeRNA量の間に偏りが生じる。したがって、後述の実施例に示すとおり、所定の生物種についてのeRNAの定量値とeDNAの定量値との比(eNA比:eNA比は、例えば式(1):[eRNA又はeDNAのリード数(いずれか少ないほう)]/[eRNA又はeDNAのリード数(いずれか多いほう)]と表すことができるが、これに限定されるものではない。)は、偽陽性を評価する指標として好ましい。例えば、対象の水環境に生存する生物種についての式(1)に従うeNA比は、該水環境に生存しない生物種についてのeNA比よりも高値になるため、eNA比を基準に、該生物種が誤検出による偽陽性であるか否かを評価することができる。この評価を、特定された生物種群に対して網羅的に行うことで、特定した生物種群からの偽陽性の生物種の検出と排除を行うことができる。また後述の実施例に示すとおり、水環境に混入した陸棲節足動物でのeNA比の著しい減少は、eRNA量<eDNA量の場合だけでなくeDNA量<eRNA量の場合もある。そのため、eRNA解析のみより、eDNA解析とeRNA解析の併用の方が、水環境に生存する生物種のより正確な特定及び/又は定量が可能である。したがって、eDNA解析とeRNA解析の併用は、偽陽性の少ない生態調査、又は外環境由来の生物ゴミ(例えば生活排水や漁港からの廃棄物に含まれる生物ゴミ)による水環境の汚染の評価、例えば水環境の汚染源や汚染度の分析に寄与し得る。
本発明の例示的実施形態として、以下の物質、製造方法、用途、方法等をさらに本明細書に開示する。但し、本発明はこれらの実施形態に限定されない。
〔1〕水環境に生存する生物種の解析方法であって、
水環境に含まれるRNAを定量的に解析して、該水環境に生存する該生物種を定量的に評価すること、
を含む、方法。
〔2〕好ましくは、前記水環境に含まれるRNAを網羅的に解析して、該水環境に生存する生物種を網羅的に特定することをさらに含む、[1]記載の方法。
〔3〕前記生物が、
好ましくは魚類、藻類及び節足動物を含み、
より好ましくは魚類である、
〔1〕又は〔2〕記載の方法。
〔4〕好ましくは、前記RNAの解析が該RNAのメタバーコーディングによって行われる、〔1〕~〔3〕のいずれか1項記載の方法。
〔5〕好ましくは、前記RNAの定量解析が前記メタバーコーディングで得られたシーケンスリード数に基づいて行われる、〔4〕記載の方法。
〔6〕好ましくは、前記水環境に含まれるDNAを網羅的及び/又は定量的に解析することをさらに含む、〔1〕~〔5〕のいずれか1項記載の方法。
〔7〕好ましくは、前記DNAの解析が該DNAのメタバーコーディングによって行われる、〔6〕記載の方法。
〔8〕好ましくは、前記DNAの定量解析が前記メタバーコーディングで得られたシーケンスリード数に基づいて行われる、〔7〕記載の方法。
〔9〕好ましくは、前記RNAの解析結果と前記DNAの解析結果とを比較することで、前記水環境に生存する生物種を網羅的に特定することを含む、〔6〕~〔8〕のいずれか1項記載の方法。
〔10〕好ましくは前記生物種の網羅的特定が偽陽性の生物種の識別を含む、〔9〕記載の方法。
〔11〕好ましくは、前記RNAの解析結果と前記DNAの解析結果とを比較することで、前記水環境に生存する生物種を定量的に評価することを含む、〔6〕~〔10〕のいずれか1項記載の方法。
〔12〕好ましくは、生物種についてのRNAの定量値とDNAの定量値との比を基準に偽陽性の生物種を識別する、〔10〕記載の方法。
〔13〕好ましくは、前記生物種についてのRNAの定量値とDNAの定量値との比が、下記eNA比として表される、〔11〕記載の方法。
eNA比=[該生物種のRNA又はDNAについてのシーケンスリード数(いずれか少ないほう)]/[該生物種のRNA又はDNAについてのシーケンスリード数(いずれか多いほう)]
〔14〕前記水環境が、
好ましくは、海、河川、湖、池、沼、干潟、氷河、養殖場、水槽、ならびにそれらの岸辺及び底を含み、
より好ましくは、飼育水でない自然環境の海、河川、湖、池、沼、干潟、氷河、ならびにそれらの岸辺及び底を含む、
〔1〕~〔13〕のいずれか1項記載の方法。
以下、実施例に基づき本発明をさらに詳細に説明するが、本発明はこれに限定されるものではない。
実施例1 水環境サンプル由来eDNA及びeRNAのメタバーコーディング
1)eDNA及びeRNAの調製
試験に供した水環境サンプルは、2018年7月から2019年2月にかけて、日本の那珂川の中流域にある那珂川大橋(N36°32’55″、E140°19’34″)、及び新那珂橋(N36°45’26″、E140°08’30″)の2地点から採取した。河川の表層からバケツを用いて1.5Lの水を採取した。水サンプルは、直ちにSterivexTMフィルターユニット(ポアサイズ0.45μm:ミリポア)を用いて濾過した。
1)eDNA及びeRNAの調製
試験に供した水環境サンプルは、2018年7月から2019年2月にかけて、日本の那珂川の中流域にある那珂川大橋(N36°32’55″、E140°19’34″)、及び新那珂橋(N36°45’26″、E140°08’30″)の2地点から採取した。河川の表層からバケツを用いて1.5Lの水を採取した。水サンプルは、直ちにSterivexTMフィルターユニット(ポアサイズ0.45μm:ミリポア)を用いて濾過した。
水サンプルからeDNA及びeRNAを抽出した。eDNAは、DNeasy Blood and Tissue Kit(QIAGEN)を用いて、但しキットのBuffer AL(RNaseA,Proteinase K添加)に15%ポリビニルピロドン(PVPP)溶液を最終濃度2.5%になるように添加して、抽出した。抽出後のeDNAは、MPure Bacterial DNA Extraction Kit(MP Biomedicals)、及びAMPure XP(Beckman Coulter)を用いて精製した。eRNAは、ChargeSwitch Total RNA Cell Kit(Thermo Fisher Scientific)を用い、推奨プロトコールに従って抽出した。該eRNAを鋳型とし、PrimeScript II 1st strand cDNA Synthesis Kit(Takara Bio Inc.)を用いて推奨プロトコールに従ってcDNAを合成した。コントロールとして脱イオン水を用いて同様にeDNA及びeRNAの抽出とcDNA合成を行い、eDNA/eRNA抽出、及びcDNA合成中のクロスコンタミネーションの有無を確認した。
2)アンプリコンライブラリの作成
12S rRNA遺伝子、16S rRNA遺伝子及びpsbA遺伝子の各部分長のアンプリコンライブラリは、魚類のプライマーであるMiFish-U及びMiFish-E33(非特許文献1)、ならびにgInsect及びpsbA(株式会社生物技研)を用いて作製した。アンプリコンライブラリは、two step tailed PCR法により作成した。first PCRでは、テンプレートとして、eDNAについては1)で調製したeDNA溶液のDDWによる3倍希釈液を、cDNAについては1)で調製したcDNA溶液を用いた。各プライマーは0.5μMに設定した。PCRでは、MiFish-U、MiFish-E33及びgInsectプライマーでは、95℃で3分の後、98℃で20秒、65℃で15秒、52℃で30秒からなるサイクルを35サイクル行い、次いで72℃で5分最終伸長した。psbAプライマーでは、94℃で2分の後、94℃で30秒、52℃で30秒、72℃で30秒からなるサイクルを30サイクル行い、次いで72℃で5分最終伸長した。first PCRは、各eDNA及びcDNA試料に対して4回行い、得られた4回分のPCR産物を1つにまとめてsecond PCRに供した。second PCRでは、MiSeqアダプタ配列及び8bpインデックス配列を含む0.5μMプライマーペアを用いて、該アダプタ配列及びインデックス配列をアンプリコンの両末端に連結させた。second PCRのサイクルとしては、94℃を2分の後、94℃を30秒、60℃を30秒、72℃を30秒からなるサイクルを10~12サイクル行い、次いで72℃で5分最終伸長した。得られた増幅産物をアンプリコンライブラリとした。
12S rRNA遺伝子、16S rRNA遺伝子及びpsbA遺伝子の各部分長のアンプリコンライブラリは、魚類のプライマーであるMiFish-U及びMiFish-E33(非特許文献1)、ならびにgInsect及びpsbA(株式会社生物技研)を用いて作製した。アンプリコンライブラリは、two step tailed PCR法により作成した。first PCRでは、テンプレートとして、eDNAについては1)で調製したeDNA溶液のDDWによる3倍希釈液を、cDNAについては1)で調製したcDNA溶液を用いた。各プライマーは0.5μMに設定した。PCRでは、MiFish-U、MiFish-E33及びgInsectプライマーでは、95℃で3分の後、98℃で20秒、65℃で15秒、52℃で30秒からなるサイクルを35サイクル行い、次いで72℃で5分最終伸長した。psbAプライマーでは、94℃で2分の後、94℃で30秒、52℃で30秒、72℃で30秒からなるサイクルを30サイクル行い、次いで72℃で5分最終伸長した。first PCRは、各eDNA及びcDNA試料に対して4回行い、得られた4回分のPCR産物を1つにまとめてsecond PCRに供した。second PCRでは、MiSeqアダプタ配列及び8bpインデックス配列を含む0.5μMプライマーペアを用いて、該アダプタ配列及びインデックス配列をアンプリコンの両末端に連結させた。second PCRのサイクルとしては、94℃を2分の後、94℃を30秒、60℃を30秒、72℃を30秒からなるサイクルを10~12サイクル行い、次いで72℃で5分最終伸長した。得られた増幅産物をアンプリコンライブラリとした。
3)MiSeqシーケンシング、アセンブリング、及びBLAST検索
得られたアンプリコンライブラリをIllumina MiSeq Reagent Kit v3(600Cycle)for 2×300bp PE(Illumina)に供し、シーケンシングを行った。FASTX-Toolkit([hannonlab.cshl.edu/fastx_toolkit/]、ハノン研究所、ケンブリッジ大学)を使用して、シーケンシングで得られた各リードのプライマー配列の末端から40bpを削除した。QS20以下のリードは削除した。アセンブル後の断片長180bp、リードの断片長170bp、最低オーバーラップ長10bpでアセンブリングを行った。上記条件を満たさないリードは破棄した。同一の塩基配列と判断される、すなわち97%以上の同一性を有するリードはUSEARCHを使用してアセンブリングし、BLAST検索を行った。
得られたアンプリコンライブラリをIllumina MiSeq Reagent Kit v3(600Cycle)for 2×300bp PE(Illumina)に供し、シーケンシングを行った。FASTX-Toolkit([hannonlab.cshl.edu/fastx_toolkit/]、ハノン研究所、ケンブリッジ大学)を使用して、シーケンシングで得られた各リードのプライマー配列の末端から40bpを削除した。QS20以下のリードは削除した。アセンブル後の断片長180bp、リードの断片長170bp、最低オーバーラップ長10bpでアセンブリングを行った。上記条件を満たさないリードは破棄した。同一の塩基配列と判断される、すなわち97%以上の同一性を有するリードはUSEARCHを使用してアセンブリングし、BLAST検索を行った。
実施例2 生態系調査の生物相評価おけるメタバーコーディングの性能評価
1)フィールド調査
藻類及び節足動物のフィールド調査(Traditional Field survey;TFS)を実施した。節足動物のTFSは、水環境サンプルと同じ調査地点/季節に、「河川環境の国勢調査マニュアル」第27版(国土交通省水管理・国土保全局河川環境課)に記載の方法に従って行った。サンプルは、網を用いた定性サンプリング及び25cm2×25cm2(一区画250μm四方)のコドラートを用いた定量サンプリングで採取した。コドラートを用いた場合、各調査地点/季節において3点でサンプリングを行った。藻類のTFSは、岩着生藻類に注目した。すなわち、水環境サンプルと同じ各調査地点/季節でそれぞれ3個の石を採取し、各石の5cm×5cmから藻類を削り取った。魚類に関しては、国主導による生態調査以外の侵襲性の高い調査が禁止されているため、国土交通省による河川水辺の国勢調査に基づく河川環境データベースにおける那珂川のデータを使用した。
2)eDNA/eRNAメタバーコーディング解析の性能評価
eDNA/eRNAメタバーコーディング解析の妥当性評価のために、魚類、藻類及び節足動物について、eDNA又はeRNAから同定した生物種数と、フィールド調査(TFS)から同定した生物種数とを比較した。TFSにより決定した生息生物種の一群を真陽性群として定義し、以下の式に基づいてメタバーコーディングの感度(Sensitivity)と陽性予測率(Positive Predictivity)を計算した。
感度(%)={(eDNA又はeRNAメタバーコーディングで検出された真陽性群に属する生物種の数)/(真陽性群に属する生物種の総数)}×100
陽性予測率(%)={(eDNA又はeRNAメタバーコーディングで検出された真陽性群に属する生物種の数)/(eDNA又はeRNAメタバーコーディングで検出された生物種の総数)}×100
図1は、魚類、藻類及び節足動物についての、eDNA/eRNAメタバーコーディング解析及びTFSで検出された種を示すベン図、ならびに該eDNA/eRNA解析の感度及び陽性予測率を示すグラフである。
魚類について、eDNA及びeRNA解析ではそれぞれ77種及び51種が検出され、それらにはTFSで検出された37種のうち20種と22種がそれぞれ含まれていた。eDNA及びeRNA解析の検出種は46種が共通した。eRNA解析の感度(59%)は、eDNA解析の感度(54%)よりわずかに高く、eRNA解析の陽性予測率(43%)は、eDNA解析の陽性予測率(26%)よりもはるかに高かった(図1a)。観測点を新那珂橋に限った場合(図1b)、eRNA解析はTFSでの検出魚類種を全て検出したが、eDNA解析は1つの種を見落としていた。この観測点での魚類種検出についてのeRNA解析の感度と陽性予測率はそれぞれ100%と20%であり、これは偽陰性が排除されたが、偽陽性やeRNA解析の検出種がTFSで検出されなかった真陽性を含む可能性があることを示す。
藻類について、eDNA及びeRNA解析ではそれぞれ80種及び82種が検出され、それらにはTFSでの検出種数(84種)に相当した。しかし、TFSと共通して検出された種は12種のみであった。逆に、eDNA及びeRNA解析で検出された種のほぼ全て(78種)が、両解析に共通しており、eDNA及びeRNA解析の感度及び陽性予測率は類似していた(感度:14%、陽性予測率:15%)(図1c)。eDNA/eRNA解析とTFSでの結果の不一致の原因として、TFSは川の石に付着した藻類に焦点を当てたのに対し、eDNA及びeRNAは表面水から採取されたことが考えられた。
節足動物について、eDNA及びeRNA解析ではそれぞれ44種と23種が検出され、TFSでは147種が検出された。eDNA及びeRNA解析間では21種が共通したが、eDNA及びeRNA解析とTFSに共通する種は3種のみであった。eDNA及びeRNA解析の感度は2%で同等であった。eRNAの陽性予測率(13%)はeDNAのそれ(7%)よりも高かった(図1d)。
以上の結果より、水環境中にはeDNAと同様に、メタバーコーディング解析に十分な量のeRNAが存在していることが示された。藻類や節足動物の検出の感度と陽性予測率は魚類に比べて低いが、これは、藻類や節足動物に含まれる未知のゲノム配列に起因している可能性がある。藻類や水棲節足動物のゲノム配列は魚類に比べて十分に決定されておらず、また形態学的な差異では検出しづらい隠蔽種が存在する可能性もあるからである。藻類と節足動物のゲノムのさらなる解明が望まれる。
実施例3 生態系調査におけるメタバーコーディングの性能評価
1)バイオマス量推定
eDNA/eRNA解析のバイオマスの定量評価方法としての特性を評価した。図2は、TFSで検出した各生物種の個体数(バイオマス量に依存)を、eDNA/eRNAメタバーコーディング解析で算出したシーケンシングリード数に対してプロットした散布図である。図2a、bはeDNAに対するプロットであり、図2c、dはeRNAに対するプロットである。同時期に実施した2つの観測点におけるeDNA及びeRNAメタバーコーディング解析でのシーケンシング総読み取り(リード)数の平均値を算出し、それぞれeDNA及びeRNA解析によるリード数とした。なおプロットの際には、eDNAとeRNAの両方でリード長が<10bpであった種を除外し、さらに対数スケールで描画するため全てのリード数に1を加えた。
魚類及び藻類について、eDNA及びeRNA解析によるシーケンシングリード数は、いずれもTFSでの個体数(バイオマス量)と相関していた(魚類:eDNAとeRNAそれぞれについて、F検定:p=2.95E-12及びp=1.53E-12;スピアマンの相関係数:ε=0.49,p=0.03及びf=0.47,p=0.04、及び藻類:eDNAとeRNAそれぞれについて、F検定:p=2.91E-14及びp=2.08E-20;スピアマン相関係数:f=0.25,p=0.55及びf=0.26,p=0.53)。eDNAとeRNAとの相関強度は等しかった。従って、既にTFSで検出されていた魚類及び藻類においては、eRNA及びeDNAの両方が水環境に存在するバイオマスの評価指標として使用できる可能性が示された。一方、eDNAは、後述のとおり偽陽性リスクが高く、採水ポイントに生存していない生物種に対しても定量値を算出することが多かった。結果、TFSで検出されていない生物種を含めてシーケンシングリード数と個体数(バイオマス量)の相関性を解析した場合においては、eRNAの方がeDNAと比較して相関性が高くなった。したがって、フィールド調査に代わる生態系における生物種の定量評価の手法としては、eRNA解析の方がeDNA解析よりも優れていると考えられた。
2)偽陽性リスク評価
図3は、魚類、藻類及び節足動物について、eDNA解析とeRNA解析との間でシーケンシングリード数をプロットした散布図である。魚類、藻類及び節足動物のeRNA解析でのリード数はeDNA解析でのリード数と類似しており、正の相関が認められた。
図3は、魚類、藻類及び節足動物について、eDNA解析とeRNA解析との間でシーケンシングリード数をプロットした散布図である。魚類、藻類及び節足動物のeRNA解析でのリード数はeDNA解析でのリード数と類似しており、正の相関が認められた。
eDNA解析とeRNA解析についての偽陽性のリスク(検出率等)を評価した。本メタバーコーディングのサンプルは河川中流から採取されたため、海水魚及び汽水魚の検出は偽陽性とみなすことができ、また陸棲節足動物の検出も偽陽性の可能性がある。本評価では、海水及び汽水魚と陸棲節足動物を偽陽性と定義し、eDNA及びeRNA解析の偽陽性リスクを調べた。さらに、eRNAとeDNAとの間のリード数の比から以下の式によりeNA比を求め、その偽陽性リスクを調べた。
eNA比=[eRNA又はeDNAのリード数(いずれか少ないほう)]/[eRNA又はeDNAのリード数(いずれか多いほう)]
さらに、eDNA解析、eRNA解析、及びeNA比の感度と特異度を以下の式に従って求め、ROC(Receiver Operatorating Characteristic)曲線を作成し、偽陽性を排除できる指標としての有効性を調べた。
感度(%)={(閾値としてのリード数を変化させていったときのeDNA又はeRNAメタバーコーディングで検出された淡水魚又は水棲節足動物に属する生物種の数)/(eDNA又はeRNAメタバーコーディングで検出された淡水魚又は水棲節足動物に属する生物種の数)}×100
特異度(%)={(閾値としてのリード数を変化させていったときのeDNA又はeRNAメタバーコーディングで検出された海水及び汽水魚、又は陸棲節足動物に属する生物種の数)/(eDNA又はeRNAメタバーコーディングで検出された海水及び汽水魚、又は陸棲節足動物に属する生物種の数)}×100
図4aは、淡水魚(FW)、海水魚(SW)、汽水魚(BW)、及び未同定種(Unknown)の魚類についてeDNA解析とeRNA解析との間でシーケンシングリード数をプロットした散布図を、図4bは、淡水魚(FW)、及び海水魚(SW)+汽水魚(BW)についてのeDNAリード数、eRNAリード数及びeNA比の箱ひげ図を、図4cはROC曲線を示す。eDNA解析では同定された一方、eRNA解析ではリード数の検出がほとんど認められなかった36種のうち29種は、採取を行った水環境(河川中流)には本来存在しないと考えられる海水魚(SW)又は汽水魚(BW)であった。この結果から、eDNA解析は、水環境に生存しない生物種を偽陽性として検出してしまうこと、そのため水環境に生存する生物種の正確な評価方法としては不適であることが示された。また、サンプリングを行った水環境に生存している淡水魚(FW)のeRNAリード数及びeNA比は、サンプリングを行った水環境には生存しない海水/汽水魚類(SW+BW)のeNA比よりも統計学的に有意に高い、明確に異なる分布を示した(図4b、*p < 0.05, **p < 0.001;F検定より非等分散であったため、スピアマンの相関検定、及びウィルコクソンの順位符号付順位和検定を行った)。ROC分析により、eRNA及びeNA比が偽陽性を排除できる指標として有効性が高いことが示された一方、eDNAには偽陽性排除における有効性は認められなかった(eRNA:AUC=0.88、eNA比:AUC=0.87、eDNA:AUC=0.59、図4b、c)。
図4d-fは、水棲節足動物(Aquatic)と陸棲節足動物(Terrestrial)について図4a-cと同様の解析を行った結果を示している。節足動物においても同様に、eRNA及びeNA比が偽陽性、すなわち陸棲節足動物の誤検出を排除できる指標として有効性が高いことが示された(eRNA:AUC=0.68,eNA比:AUC=0.77、図4e、f)。
海水/汽水魚類のeNA比の著しい減少は、主にeRNA量<eDNA量に由来している。これは、水環境中に生存しない生物のeDNAが水環境に蓄積されているが、それら生物のeRNAは水環境に蓄積されることが無く分解されることにより、eDNAとeRNAの存在比が異なっていることが原因と考えられた。また、河川水に混入される可能性がある魚類の核酸を含む生活排水中では、eDNAのみが残存し、既にeRNAは分解されている可能性がある。一方、陸棲節足動物のeNA比の著しい減少は、eRNA量<eDNA量の場合と、eDNA量<eRNA量の2つの場合があった。前者は、河川近傍で死亡したeRNAの分解が進んだ個体から、eDNAをより多く含む核酸が河川水に溶出していることに起因する可能性があり、後者は、死んで間もないDNAよりもRNA存在量が多い個体の核酸が河川水に流出した後、流動性の少ない環境でeRNAの濃度が維持されていることに起因する可能性がある。いずれにせよ、外環境からの汚染源にみられるeDNAとeRNAの量比の変動は、eNA比の著しい減少として観測できるため、eNA比が顕著に低い生物種は水環境に生存する生物種ではない可能性が考えられる。また、定量的な評価においても、前述の通りeDNAの解析では偽陽性となる生物種に対しても一定の定量値が算出されてしまうため、eRNAを用いる又はeDNAとeRNAを併用する評価方法が有効であると考えられた。以上の結果より、水環境に生存する魚類や節足動物の生物種を、該水環境中に生存しない種を誤検出せずに網羅的特定や定量するための指標として、eRNA及びeNA比が有効であることが示された。
Claims (8)
- 水環境に生存する生物種の解析方法であって、
水環境に含まれるRNAを定量的に解析して、該水環境に生存する該生物種を定量的に評価すること、
を含む、方法。 - 前記水環境に含まれるRNAを網羅的に解析して、該水環境に生存する生物種を網羅的に特定することをさらに含む、請求項1記載の方法。
- 前記生物が魚類、藻類及び節足動物を含む、請求項1又は2記載の方法。
- 前記生物が魚類である、請求項3記載の方法。
- 前記RNAの解析が該RNAのメタバーコーディングによって行われる、請求項1~4のいずれか1項記載の方法。
- 前記水環境に含まれるDNAを網羅的及び/又は定量的に解析することをさらに含む、請求項1~5のいずれか1項記載の方法。
- 前記RNAの解析結果と前記DNAの解析結果とを比較することで、前記水環境に生存する生物種を網羅的に特定することを含む、請求項6記載の方法。
- 前記生物種の網羅的特定が偽陽性の生物種の識別を含む、請求項7記載の方法。
Priority Applications (3)
| Application Number | Priority Date | Filing Date | Title |
|---|---|---|---|
| US17/792,812 US20230043155A1 (en) | 2020-01-14 | 2021-01-14 | Method for surveying ecosystem in water environment by using environmental rna |
| CN202180009156.4A CN114981449A (zh) | 2020-01-14 | 2021-01-14 | 使用环境rna的水环境的生态系统的调查方法 |
| EP21741963.9A EP4092131A4 (en) | 2020-01-14 | 2021-01-14 | METHOD FOR MONITORING THE ECOSYSTEM IN AN AQUATIC ENVIRONMENT USING AMBIENT RNA |
Applications Claiming Priority (2)
| Application Number | Priority Date | Filing Date | Title |
|---|---|---|---|
| JP2020003663A JP7041176B2 (ja) | 2020-01-14 | 2020-01-14 | 環境rnaを用いた水環境の生態系の調査方法 |
| JP2020-003663 | 2020-01-14 |
Publications (1)
| Publication Number | Publication Date |
|---|---|
| WO2021145384A1 true WO2021145384A1 (ja) | 2021-07-22 |
Family
ID=76864415
Family Applications (1)
| Application Number | Title | Priority Date | Filing Date |
|---|---|---|---|
| PCT/JP2021/001076 Ceased WO2021145384A1 (ja) | 2020-01-14 | 2021-01-14 | 環境rnaを用いた水環境の生態系の調査方法 |
Country Status (5)
| Country | Link |
|---|---|
| US (1) | US20230043155A1 (ja) |
| EP (1) | EP4092131A4 (ja) |
| JP (1) | JP7041176B2 (ja) |
| CN (1) | CN114981449A (ja) |
| WO (1) | WO2021145384A1 (ja) |
Families Citing this family (4)
| Publication number | Priority date | Publication date | Assignee | Title |
|---|---|---|---|---|
| WO2023171758A1 (ja) * | 2022-03-09 | 2023-09-14 | 花王株式会社 | 淡水環境における魚類の生態調査方法 |
| CN116042870A (zh) * | 2022-11-25 | 2023-05-02 | 中国医科大学 | 一种基于微生物组学推断水中尸体溺水地点的方法及其法医学应用 |
| JP2025079495A (ja) * | 2023-11-10 | 2025-05-22 | 株式会社豊田中央研究所 | 環境中に生息する生物の多様性の調査方法 |
| CN120818606A (zh) * | 2025-08-28 | 2025-10-21 | 中国科学院海洋研究所 | 一种基于环境rna的眼斑双锯鱼检测方法及其引物组合 |
Citations (1)
| Publication number | Priority date | Publication date | Assignee | Title |
|---|---|---|---|---|
| JP2017099376A (ja) | 2015-11-19 | 2017-06-08 | 株式会社日吉 | 環境水試料の前処理方法、環境水試料の前処理剤、並びに、生物相又は生物の量の推定方法 |
Family Cites Families (3)
| Publication number | Priority date | Publication date | Assignee | Title |
|---|---|---|---|---|
| CN102329896A (zh) * | 2011-10-18 | 2012-01-25 | 浙江省淡水水产研究所 | 一种水生双顺反子病毒的rt-pcr检测方法 |
| US11479813B2 (en) * | 2016-10-11 | 2022-10-25 | Uvic Industry Partnerships Inc. | Quantitative PCR-based environmental DNA assays |
| US20190371426A1 (en) * | 2016-12-28 | 2019-12-05 | Ascus Biosciences, Inc. | Methods, apparatuses, and systems for analyzing microorganism strains in complex heterogeneous communities, determining functional relationships and interactions thereof, and diagnostics and biostate management and biostate temporal forecasting based thereon |
-
2020
- 2020-01-14 JP JP2020003663A patent/JP7041176B2/ja active Active
-
2021
- 2021-01-14 US US17/792,812 patent/US20230043155A1/en active Pending
- 2021-01-14 CN CN202180009156.4A patent/CN114981449A/zh active Pending
- 2021-01-14 WO PCT/JP2021/001076 patent/WO2021145384A1/ja not_active Ceased
- 2021-01-14 EP EP21741963.9A patent/EP4092131A4/en active Pending
Patent Citations (1)
| Publication number | Priority date | Publication date | Assignee | Title |
|---|---|---|---|---|
| JP2017099376A (ja) | 2015-11-19 | 2017-06-08 | 株式会社日吉 | 環境水試料の前処理方法、環境水試料の前処理剤、並びに、生物相又は生物の量の推定方法 |
Non-Patent Citations (9)
| Title |
|---|
| IJICHI ET AL., FIRST MEETING OF THE EDNA SOCIETY, TOKYO, 18 September 2018 (2018-09-18), pages 28 |
| JIANG, MING-YANG; MAEGAWA, KAZUYA; NAKAO, RYOHEI; MINAMOTO, TOSHIFUMI: "P2-074 Detection of common carp using eRNA from water samples", 66TH ANNUAL MEETING OF THE ECOLOGICAL SOCIETY OF JAPAN; KOBE, JAPAN; MARCH 15-19, 2019, vol. 66, 6 June 2019 (2019-06-06) - 19 March 2019 (2019-03-19), pages 1 - 1, XP009538351 * |
| MASAYUKI USHIO, HIROAKI MURAKAMI, REIJI MASUDA, TETSUYA SADO, MASAKI MIYA, SHO SAKURAI, HIROKI YAMANAKA, TOSHIFUMI MINAMOTO, MICHI: "Quantitative monitoring of multispecies fish environmental DNA using high-throughput sequencing", METABARCODING AND METAGENOMICS, vol. 2, 14 March 2018 (2018-03-14), pages e23297, XP055842475 * |
| MIYA ET AL., ROYAL SOCIETY OPEN SCIENCE, vol. 2, no. 7, 2015, pages 150088 |
| MIYA M., SATO Y., FUKUNAGA T., SADO T., POULSEN J. Y., SATO K., MINAMOTO T., YAMAMOTO S., YAMANAKA H., ARAKI H., KONDOH M., IWASAK: "MiFish, a set of universal PCR primers for metabarcoding environmental DNA from fishes: detection of more than 230 subtropical marine species", ROYAL SOCIETY OPEN SCIENCE, vol. 2, no. 7, 1 July 2015 (2015-07-01), pages 150088, XP055842457 * |
| NAKAMICHI ET AL., 66TH ANNUAL MEETING OF THE ECOLOGICAL SOCIETY OF JAPAN, 20 February 2019 (2019-02-20) |
| NAKAMICHI TOMOKI, KENJI TSURI, YUICHIRO TERAZONO, KOTARO KAMO, TAKASHI ISHIHARA, HIROKI YAMANAKA: "P1-481 Comparison of the sensitivities of environmental DNA and RNA as markers for species detection from water samples and their time dependencies", 66TH ANNUAL MEETING OF THE ECOLOGICAL SOCIETY OF JAPAN; KOBE, JAPAN; MARCH 15-19, 2019, vol. 66, 2019, pages P1, XP009538350 * |
| See also references of EP4092131A4 |
| USHIO ET AL., METABARCODING AND METAGENOMICS, vol. 2, 2018, pages 1 - 15 |
Also Published As
| Publication number | Publication date |
|---|---|
| EP4092131A1 (en) | 2022-11-23 |
| EP4092131A4 (en) | 2024-02-14 |
| JP7041176B2 (ja) | 2022-03-23 |
| JP2021108593A (ja) | 2021-08-02 |
| US20230043155A1 (en) | 2023-02-09 |
| CN114981449A (zh) | 2022-08-30 |
Similar Documents
| Publication | Publication Date | Title |
|---|---|---|
| Bruce et al. | A practical guide to DNA-based methods for biodiversity assessment | |
| Afzali et al. | Comparing environmental metabarcoding and trawling survey of demersal fish communities in the Gulf of St. Lawrence, Canada | |
| Nester et al. | Development and evaluation of fish eDNA metabarcoding assays facilitate the detection of cryptic seahorse taxa (family: Syngnathidae) | |
| Brys et al. | Monitoring of spatiotemporal occupancy patterns of fish and amphibian species in a lentic aquatic system using environmental DNA | |
| Deiner et al. | The future of biodiversity monitoring and conservation utilizing environmental DNA | |
| Tsuji et al. | The detection of aquatic macroorganisms using environmental DNA analysis—A review of methods for collection, extraction, and detection | |
| JP7041176B2 (ja) | 環境rnaを用いた水環境の生態系の調査方法 | |
| Farrell et al. | The promise and pitfalls of environmental DNA and RNA approaches for the monitoring of human and animal pathogens from aquatic sources | |
| Stat et al. | Ecosystem biomonitoring with eDNA: metabarcoding across the tree of life in a tropical marine environment | |
| Simpfendorfer et al. | Environmental DNA detects Critically Endangered largetooth sawfish in the wild | |
| Mauvisseau et al. | On the way for detecting and quantifying elusive species in the sea: The Octopus vulgaris case study | |
| Qu et al. | Comparing fish prey diversity for a critically endangered aquatic mammal in a reserve and the wild using eDNA metabarcoding | |
| Coster et al. | The update and optimization of an eDNA assay to detect the invasive rusty crayfish (Faxonius rusticus) | |
| Mathai et al. | Water and sediment act as reservoirs for microbial taxa associated with invasive dreissenid mussels | |
| Rund et al. | Relating target fish DNA concentration to community composition analysis in freshwater fish via metabarcoding | |
| Schenk et al. | Sampling and processing of freshwater nematodes with emphasis on molecular methods. | |
| JP5474343B2 (ja) | カワヒバリガイ検出用プライマーセットとこれを利用したカワヒバリガイ幼生の検出・定量方法 | |
| Bae et al. | Quantitative comparison between environmental DNA and surface coverage of Ciona robusta and Didemnum vexillum | |
| Hogg et al. | Biodiversity genomics: monitoring restoration efforts using DNA barcoding and environmental DNA | |
| Fields et al. | Development, verification, and implementation of an eDNA detection assay for emydids with a case study on diamondback terrapins, Malaclemys terrapin, and red eared slider, Trachemys script elegans | |
| JP7398583B2 (ja) | 淡水環境における魚類の生態調査方法 | |
| HUMPHREY et al. | Comparing Aquatic Camera Trapping and Targeted Environmental DNA Detections of Brook Trout (Salvelinus fontinalis). | |
| Cowart et al. | Detecting local variations across metazoan communities in back-reef depressions of Reunion Island (Mascarene Archipelago) through environmental DNA survey | |
| Sakata | Characterization of environmental DNA in sediments and its application to reconstruction of past environments | |
| Toepfer | Development of a novel environmental DNA (eDNA) tool for monitoring Vulnerable Freckled Guitarfish, Pseudobatos lentiginosus, in the Western Central Atlantic |
Legal Events
| Date | Code | Title | Description |
|---|---|---|---|
| 121 | Ep: the epo has been informed by wipo that ep was designated in this application |
Ref document number: 21741963 Country of ref document: EP Kind code of ref document: A1 |
|
| NENP | Non-entry into the national phase |
Ref country code: DE |
|
| ENP | Entry into the national phase |
Ref document number: 2021741963 Country of ref document: EP Effective date: 20220816 |