WO2021157739A1 - シングルセルRNA-Seq解析のカウントデータセットの補正方法、シングルセルRNA-Seqの解析方法、細胞種の構成比率の解析方法、並びにこれらの方法を実行するための装置及びコンピュータプログラム - Google Patents
シングルセルRNA-Seq解析のカウントデータセットの補正方法、シングルセルRNA-Seqの解析方法、細胞種の構成比率の解析方法、並びにこれらの方法を実行するための装置及びコンピュータプログラム Download PDFInfo
- Publication number
- WO2021157739A1 WO2021157739A1 PCT/JP2021/004470 JP2021004470W WO2021157739A1 WO 2021157739 A1 WO2021157739 A1 WO 2021157739A1 JP 2021004470 W JP2021004470 W JP 2021004470W WO 2021157739 A1 WO2021157739 A1 WO 2021157739A1
- Authority
- WO
- WIPO (PCT)
- Prior art keywords
- cell
- rna
- seq
- cells
- analyzed
- Prior art date
- Legal status (The legal status is an assumption and is not a legal conclusion. Google has not performed a legal analysis and makes no representation as to the accuracy of the status listed.)
- Ceased
Links
Images





Classifications
-
- C—CHEMISTRY; METALLURGY
- C12—BIOCHEMISTRY; BEER; SPIRITS; WINE; VINEGAR; MICROBIOLOGY; ENZYMOLOGY; MUTATION OR GENETIC ENGINEERING
- C12Q—MEASURING OR TESTING PROCESSES INVOLVING ENZYMES, NUCLEIC ACIDS OR MICROORGANISMS; COMPOSITIONS OR TEST PAPERS THEREFOR; PROCESSES OF PREPARING SUCH COMPOSITIONS; CONDITION-RESPONSIVE CONTROL IN MICROBIOLOGICAL OR ENZYMOLOGICAL PROCESSES
- C12Q1/00—Measuring or testing processes involving enzymes, nucleic acids or microorganisms; Compositions therefor; Processes of preparing such compositions
- C12Q1/68—Measuring or testing processes involving enzymes, nucleic acids or microorganisms; Compositions therefor; Processes of preparing such compositions involving nucleic acids
- C12Q1/6809—Methods for determination or identification of nucleic acids involving differential detection
-
- G—PHYSICS
- G16—INFORMATION AND COMMUNICATION TECHNOLOGY [ICT] SPECIALLY ADAPTED FOR SPECIFIC APPLICATION FIELDS
- G16B—BIOINFORMATICS, i.e. INFORMATION AND COMMUNICATION TECHNOLOGY [ICT] SPECIALLY ADAPTED FOR GENETIC OR PROTEIN-RELATED DATA PROCESSING IN COMPUTATIONAL MOLECULAR BIOLOGY
- G16B20/00—ICT specially adapted for functional genomics or proteomics, e.g. genotype-phenotype associations
-
- C—CHEMISTRY; METALLURGY
- C12—BIOCHEMISTRY; BEER; SPIRITS; WINE; VINEGAR; MICROBIOLOGY; ENZYMOLOGY; MUTATION OR GENETIC ENGINEERING
- C12Q—MEASURING OR TESTING PROCESSES INVOLVING ENZYMES, NUCLEIC ACIDS OR MICROORGANISMS; COMPOSITIONS OR TEST PAPERS THEREFOR; PROCESSES OF PREPARING SUCH COMPOSITIONS; CONDITION-RESPONSIVE CONTROL IN MICROBIOLOGICAL OR ENZYMOLOGICAL PROCESSES
- C12Q1/00—Measuring or testing processes involving enzymes, nucleic acids or microorganisms; Compositions therefor; Processes of preparing such compositions
- C12Q1/68—Measuring or testing processes involving enzymes, nucleic acids or microorganisms; Compositions therefor; Processes of preparing such compositions involving nucleic acids
- C12Q1/6869—Methods for sequencing
-
- G—PHYSICS
- G16—INFORMATION AND COMMUNICATION TECHNOLOGY [ICT] SPECIALLY ADAPTED FOR SPECIFIC APPLICATION FIELDS
- G16B—BIOINFORMATICS, i.e. INFORMATION AND COMMUNICATION TECHNOLOGY [ICT] SPECIALLY ADAPTED FOR GENETIC OR PROTEIN-RELATED DATA PROCESSING IN COMPUTATIONAL MOLECULAR BIOLOGY
- G16B25/00—ICT specially adapted for hybridisation; ICT specially adapted for gene or protein expression
- G16B25/10—Gene or protein expression profiling; Expression-ratio estimation or normalisation
-
- G—PHYSICS
- G16—INFORMATION AND COMMUNICATION TECHNOLOGY [ICT] SPECIALLY ADAPTED FOR SPECIFIC APPLICATION FIELDS
- G16B—BIOINFORMATICS, i.e. INFORMATION AND COMMUNICATION TECHNOLOGY [ICT] SPECIALLY ADAPTED FOR GENETIC OR PROTEIN-RELATED DATA PROCESSING IN COMPUTATIONAL MOLECULAR BIOLOGY
- G16B30/00—ICT specially adapted for sequence analysis involving nucleotides or amino acids
-
- G—PHYSICS
- G16—INFORMATION AND COMMUNICATION TECHNOLOGY [ICT] SPECIALLY ADAPTED FOR SPECIFIC APPLICATION FIELDS
- G16B—BIOINFORMATICS, i.e. INFORMATION AND COMMUNICATION TECHNOLOGY [ICT] SPECIALLY ADAPTED FOR GENETIC OR PROTEIN-RELATED DATA PROCESSING IN COMPUTATIONAL MOLECULAR BIOLOGY
- G16B40/00—ICT specially adapted for biostatistics; ICT specially adapted for bioinformatics-related machine learning or data mining, e.g. knowledge discovery or pattern finding
-
- G—PHYSICS
- G16—INFORMATION AND COMMUNICATION TECHNOLOGY [ICT] SPECIALLY ADAPTED FOR SPECIFIC APPLICATION FIELDS
- G16B—BIOINFORMATICS, i.e. INFORMATION AND COMMUNICATION TECHNOLOGY [ICT] SPECIALLY ADAPTED FOR GENETIC OR PROTEIN-RELATED DATA PROCESSING IN COMPUTATIONAL MOLECULAR BIOLOGY
- G16B40/00—ICT specially adapted for biostatistics; ICT specially adapted for bioinformatics-related machine learning or data mining, e.g. knowledge discovery or pattern finding
- G16B40/20—Supervised data analysis
Definitions
- RNA-Seq Single-cell RNA-Seq or scRNA-Seq
- Single-cell RNA-Seq Single-cell RNA-Seq or scRNA-Seq
- a comprehensive gene expression profile is analyzed, and the analysis data is decomposed into single cell expression levels to derive information on changes in single cells (Non-Patent Documents 1 to 5). Therefore, scRNA-Seq is said to be a powerful method for producing detailed normal and pathogenic organ molecular cell atlases.
- scRNA-Seq has its limits.
- tissue collected by surgery or the like are often cryopreserved for several months to several years, and such preserved tissues cannot be used for scRNA-Seq.
- the collection of human tissue is generally a biopsy, and there is a problem that the sample amount is small. Even if the entire organ can be collected by autopsy, it is not impossible to separate individual cells from the entire organ for the purpose of scRNA-Seq in the case of large organs such as the heart and brain. However, it is not realistic.
- scRNA-Seq also has the problem of experimental artifacts in gene expression. As such an example, it has been reported that the process of cell separation induces abnormal gene expression in the cell.
- RNA database deconvolution computational deconvolution of whole-organ RNA datasets
- the whole organ RNA database deconvolution is calculated by computer after extracting RNA from the collected test tissue without performing cell separation for each cell type and obtaining sequence information of RNA expressed by RNA-Seq.
- This is a method of estimating the expression level of each RNA for each cell type based on the ratio of the cell types contained in the test tissue. This method enables RNA expression analysis using not only fresh tissues but also cryopreserved tissues. This method also allows simultaneous purification of RNA from multiple organs.
- Non-Patent Document 6-19 RNA-Seq data from almost the entire corresponding organ to calculate the cell type composition of the organ to be analyzed.
- Non-Patent Document 17 MULti-Subject Single Cell deconvolution (MuSiC) (Non-Patent Document 17), Dampened Weighted Least Squares (DWLS) (Non-Patent Document 18), and Complete Deconvolution for Sequencing data (CDSeq) method (Non-Patent Document 19) have been reported. Was done. These three methods are said to be superior to the previously reported methods described in Non-Patent Documents 6 to 16.
- Non-Patent Documents 17 to 19 synthetic datasets, cultured cells, mixtures of several tissues, and / or RNA-Seq data from 1 to 4 actual organs. The sex has only been verified. In other words, its applicability to a wider variety of real organs has not been investigated.
- the present inventor evaluated the performance of MuSiC (Non-Patent Document 17) and the DWLS method (Non-Patent Document 19). These are the two latest methods that have been compared to other previous methods of deconvolution of one to four actual organs and have shown to be superior to other methods.
- the ratio of cell types calculated by the MuSiC or DWLS method by the computer deviates from the one experimentally estimated by the actual scRNA-Seq study.
- the degree of divergence also varied.
- the dissociation was remarkable in the skeletal muscle and the heart.
- RNA-Seq data for estimating the proportion of each cell type, which is closer to the proportion of various cells in an actual tissue.
- Another object of the present invention is to provide a deconvolution method for RNA-Seq data that can be applied to a wider variety of tissues.
- the count data set of the single cell RNA-Seq analysis obtained from the analysis target cell or predicted for the analysis target cell contains the total RNA for each cell type corresponding to the analysis target cell. Concerning how to correct the count dataset for single-cell RNA-Seq analysis, including weighting based on quantity.
- the weighting is based on the expression of a signature gene set that characterizes each cell type, the signature gene set comprising a predetermined number of genes.
- the count data set for single-cell RNA-Seq analysis obtained from the cells to be analyzed or predicted for the cells to be analyzed contains total RNA for each cell type corresponding to the cells to be analyzed. Weighting based on quantity and analyzing RNA expression patterns in each cell type that constitutes the organ to be analyzed, including the cells to be analyzed, based on the count data set of the weighted single-cell RNA-Seq analysis.
- the present invention relates to a method for analyzing single-cell RNA-Seq, including.
- the count data set of the single-cell RNA-Seq analysis obtained from the analysis target cell or predicted for the analysis target cell contains the total RNA for each cell type corresponding to the analysis target cell.
- Analysis including weighting based on quantity and analysis of the composition ratio of cell types constituting the analysis target organ including the analysis target cell based on the count data set of the weighted single cell RNA-Seq analysis.
- the present invention relates to a method for analyzing the composition ratio of cell types constituting the target organ.
- An embodiment of the present invention relates to a count dataset correction device (10) for single-cell RNA-Seq analysis.
- the correction device (10) includes a control unit (101).
- the control unit (101) weights the count data set of the single-cell RNA-Seq analysis obtained from the analysis target cell based on the total RNA content for each cell type corresponding to the analysis target cell.
- An embodiment of the present invention relates to a single cell RNA-Seq analyzer.
- the analysis device (20) includes a control unit (201).
- the control unit (201) includes the total RNA content for each cell type corresponding to the analysis target cell in the count data set of the single cell RNA-Seq analysis obtained from the analysis target cell or predicted for the analysis target cell.
- the RNA expression pattern in each cell type constituting the analysis target organ including the analysis target cell is analyzed based on the count data set of the weighted single-cell RNA-Seq analysis.
- An embodiment of the present invention relates to an analyzer for analyzing the composition ratio of cell types constituting the organ to be analyzed.
- the analysis device (20) includes a control unit (201).
- the control unit (201) includes the total RNA content for each cell type corresponding to the analysis target cell in the count data set of the single cell RNA-Seq analysis obtained from the analysis target cell or predicted for the analysis target cell. Based on the count data set of the weighted single-cell RNA-Seq analysis, the composition ratio of the cell types constituting the analysis target organ including the analysis target cell is analyzed.
- the analysis target cell when executed by a computer, the analysis target cell is subjected to a count data set of a single cell RNA-Seq analysis obtained from the analysis target cell or predicted for the analysis target cell.
- the present invention relates to a correction program for a count dataset for single-cell RNA-Seq analysis, which comprises performing a process comprising a weighting step based on the total RNA content for each corresponding cell type.
- An embodiment of the present invention when executed by a computer, is applied to the analysis target cell in a count data set of a single cell RNA-Seq analysis obtained from the analysis target cell or predicted for the analysis target cell. Based on the step of weighting based on the total RNA content of each corresponding cell type and the count data set of the weighted single-cell RNA-Seq analysis, each cell type constituting the analysis target organ including the analysis target cell.
- the present invention relates to a single-cell RNA-Seq analysis program, which comprises performing a process comprising analyzing an RNA expression pattern in.
- the analysis target cell when executed by a computer, is subjected to a count data set of a single cell RNA-Seq analysis obtained from the analysis target cell or predicted for the analysis target cell. Based on the step of weighting based on the total RNA content of each corresponding cell type and the count data set of the weighted single-cell RNA-Seq analysis, the cell types constituting the analysis target organ including the analysis target cell An analysis program for the composition ratio of cell types that make up the organ to be analyzed, which executes a process including a step for analyzing the composition ratio.
- the present invention can estimate the proportion of each cell type, which is closer to the proportion of various cells in the actual tissue, from the RNA sequence database.
- the proportion of each cell type can be estimated in a wider variety of tissues.
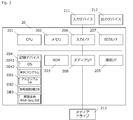
- An example of the hardware configuration of the correction device 10 is shown.
- the processing flow of the correction program 1042 is shown.
- An example of the hardware configuration of the analyzer 10 is shown.
- the processing flow of the analysis program 2042 is shown.
- Constituent ratio of reference cell type of each cell type present in each organ in aorta, brain, fat, heart, kidney, large intestine, liver, and lung composition ratio of cell type predicted by MuSiC, and predicted by DWLS method
- the composition ratio of the cell type was shown.
- the composition ratio of the reference cell type of each cell type present in each organ in the bone marrow, pancreas, skin, skeletal muscle, spleen, and thymus the composition ratio of the cell type predicted by MuSiC, and the cell predicted by the DWLS method.
- the composition ratio of the species is shown.
- the comparison between the estimated whole organ RNA-Seq data set obtained from the composition ratio of the reference cell type and the actual scRNA-Seq data of each organ and the actual whole organ RNA-Seq data set is shown.
- the weighting coefficient of each cell type existing in each organ and its distribution range are shown.
- the comparison between the estimated whole organ RNA-Seq data set estimated using the cell type-specific weighting coefficient obtained in the present invention and the actual whole organ RNA-Seq data set is shown.
- w indicates the weight
- m indicates the RNA count of each gene
- n indicates the ratio of each cell type.
- composition ratio of the reference cell type of each cell type present in each organ in the aorta, fat, heart, kidney, liver, lung, colon, bone marrow, skeletal muscle, and spleen, and the composition ratio of each cell estimated by the present invention are shown.
- the comparison between the estimated transcript count in the aorta, fat, heart, kidney, liver, lung, large intestine, bone marrow, skeletal muscle, and spleen and the gene expression in each cell type in the actual organ is shown.
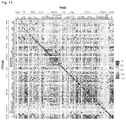
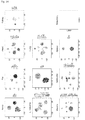
- the t-Distributed Stochastic Neighbor Embedding (t-SNE) analysis result of the estimated scRNA-Seq count data is shown.
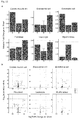
- MI myocardial infarction
- a indicates the rate of change of the estimated cell type composition ratio with respect to Sham.
- b shows the variation analysis result of the estimated gene expression profile.
- RNA-Seq The results of deconvolution of the whole human organ RNA-Seq dataset are shown using the weighting factors calculated using mouse data and the estimated scRNA-Seq count data.
- a indicates the cell type composition ratio estimated for the human heart and kidney.
- b shows the t-Distributed Stochastic Neighbor Embedding (t-SNE) analysis result of the gene expression profile estimated for the human heart and kidney.
- One embodiment of the present invention relates to a correction method, a correction device, and a correction program of a count data set for single-cell RNA-Seq analysis. 1-1. How to correct the count dataset for single-cell RNA-Seq analysis
- the method for correcting the count data set for single-cell RNA-Seq (scRNA-Seq) analysis is a single-cell RNA obtained from the cells to be analyzed or predicted for the cells to be analyzed.
- the count data set for Seq analysis includes weighting based on total RNA content by cell type. 1-1-1.
- RNA is not limited as long as it is RNA that can be analyzed by RNA-Seq analysis.
- RNA may include mRNA, untranslated RNA, microRNA and the like.
- RNA is not restricted as long as it is present in the organism.
- Organisms are not limited as long as they are multicellular organisms with organs.
- the organism may be an animal or a plant, but is preferably an animal.
- the animals are preferably mammals such as humans, mice, rats, dogs, cats, rabbits, cows, horses, goats, sheep and pigs, and birds such as chickens. More preferably, it is a mammal such as human, mouse, dog, cat, cow, horse, pig, etc., still more preferably human, mouse, dog, or cat, and even more preferably human or mouse, and most preferably. Is a human.
- Organisms also include both diseased and non-diseased organisms.
- the cells to be analyzed are not limited as long as they are present in the organ of the organism.
- An organ is preferably a cell whose cell composition within the organ is known.
- An organ is a collection of tissues existing in an organism that has a certain independent morphology and a specific function.
- the organs include circulatory organs (heart, arteries, veins, lymph vessels, etc.), respiratory organs (nasal cavity, sinus cavity, laryngeal, trachea, bronchi, lungs, etc.), digestion.
- Organ organs (lips, cheeks, palate, teeth, gingiva, tongue, salivary glands, pharynx, esophagus, stomach, duodenum, empty intestine, ileum, cecum, wormdrop, ascending colon, transverse colon, sigmoid colon, rectum, anus, liver , Biliary sac, bile duct, biliary tract, pancreas, pancreatic tract, etc.)
- Female reproductive system organs ovary, oviduct, uterus, vagina, etc.
- breast male reproductive system organs (penis, prostate, testis, supraclavicular body, sperm duct), endocrine system organs (thin hypothalamus, pituitary gland, pine fruit body) , Thyroid, parathyroid, adrenal, etc.), dermal organs (skin, hair, nails, etc.), hematopoietic organs (blood, bone marrow, spleen, etc.), immune system organs (lymph no
- the target tissues are preferably heart, cerebral, lung, kidney, adipose tissue, liver, skeletal muscle, testis, spleen, thymus, bone marrow, pancreas, and skin (for example, epidermis above the subcutaneous tissue). Includes papillary and reticular layers. Organs are preferably aorta, brain, fat, heart, kidney, large intestine, liver, lung, bone marrow, pancreas, skin, skeletal muscle, spleen, and thymus.
- RNA-Seq analysis is a so-called transcriptome analysis, in which a read containing sequence information is comprehensively obtained from RNA existing in a target sample, and the read is mapped to a reference sequence and expressed. This is a method for analyzing the genes that are being used and the number of counts (also called the number of reads). The count number corresponds to the gene expression level.
- the count data for RNA-Seq analysis may include the gene name and / or registration number of the expressed gene in the gene database and the count number of reads for each gene.
- RNA-Seq analysis can be performed using a DNA sequencer called a next-generation sequencer or a third-generation sequencer.
- Next-generation sequencers include, for example, MiSeq9 (registered trademark), HiSeq (registered trademark), NextSeq (registered trademark), MiSeq (registered trademark) of Illumina (San Diego, CA); Thermo Fisher (Walsom, MA). Ion Proton (registered trademark), Ion PGM (registered trademark); GS FLX + (registered trademark) of Roche (Basel, Switzerland), GS Junior (registered trademark), etc. can be mentioned.
- the third generation sequencer include PacBioSequel TM.
- the count data set for scRNA-Seq analysis is a set of count data generated based on gene expression analysis expressed in individual cells of an organism and / or gene expression predicted by a computer analysis method.
- the count data set for scRNA-Seq analysis can be count data obtained from actual individual cells by RNA-Seq analysis.
- the count data set for scRNA-Seq analysis is, for example, based on the count data obtained by RNA-Seq analysis from the entire organ by the method described in Non-Patent Document 6-19, based on the reference cell composition ratio by a computer analysis method. It may be a count data set predicted by deconvolution or the like.
- the Complete Deconvolution for Sequencing data (CDSeq) method Non-Patent Document 19
- CDSeq Complete Deconvolution for Sequencing data
- the cell composition of each organ can be obtained from the scRNA-Seq data described in Non-Patent Document 5 or Non-Patent Document 2 or from a database registered in NIH or the like.
- the composition of these cell types is information obtained by actually analyzing the composition of the cell type of the tissue of each organ.
- Such cell composition of each organ is also called "reference cell type".
- the reference cell type contains a count data set of scRNA-Seq for genes normally expressed in each cell type.
- the reference cell type includes the composition ratio (also referred to as reference) of the reference cell type in each organ, and is associated with a label indicating the name or abbreviation of each cell type.
- the composition of cell types in each organ described in Non-Patent Document 5 refers to the composition of cell types in each organ described in Non-Patent Document 5. It is preferable to use it as the composition ratio.
- the cell type ratio described in Non-Patent Document 2 it is preferable to use the cell type ratio described in Non-Patent Document 2 as a reference cell type and its constituent ratio.
- the composition ratio of the reference cell type described in Non-Patent Document 5 it is preferable to modify the composition ratio of the reference cell type described in Non-Patent Document 5 and use it as the composition ratio of the reference cell type according to the separation analysis of cardiomyocytes and non-muscle cells.
- the composition ratio (3.1%) of cardiomyocytes adopted in Non-Patent Document 5 is the ratio at which consensus is generally obtained in the field of tissue anatomy based on various past studies. Extremely low compared to (30% to 40%). Therefore, in this example, it is preferable to set the composition ratio of cardiomyocytes to 30% and divide the remaining 70% by the composition ratio of the non-muscle cell type to obtain the composition ratio of the reference cell type.
- the reference cell type and its composition ratio based on the report in NIH (http://www.nervenet.org/papers/BrainRev99.html#Numbers).
- NIH http://www.nervenet.org/papers/BrainRev99.html#Numbers.
- the corresponding cell type label of the scRNA-Seq data described in Non-Patent Document 5 was used.
- the cell type classes in the brain are classified into four classes, "neurons”, “glial cells”, “endothelial cells”, and “others”, and the ratio of each class is 75: 23: 7: Set to 4. This ratio follows the estimated ratio in the mouse brain (http://www.nervenet.org/papers/BrainRev99.html#Numbers).
- Non-Patent Document 5 "neurons”, “glial cells”, and “others” are further classified into more detailed cell type classes. Specifically, the class of “neurons” is further classified into “neurons-excitatory neurons, and some neural stem cells” and “neurons-inhibitory neurons". The “Other” class is divided into “pericyte cells-NA” and “oligodendrocyte progenitor cells-NA”. The class of "glial cells” is classified based on the following three assumptions. i) According to Non-Patent Document 5, four cell types of "glial cell” are "microglial cell-NA", “astrocyte-NA”, “Bergmann glial cell-NA”, and "oligodendrocyte NA”. Classify into.
- composition ratios of these four glial cell types are as described in Non-Patent Document 5. iii) Since it is reported that "microglia cells” occupy 10-15% of the cells of the whole brain, the ratio of "microglia cells-NA" of the whole brain is set to 0.1.
- the ratio of each brain cell type is "macrophages-NA” (about 0.2%), “microglial cell-NA” (10.0%), “astrocyte-NA” (about 2.2%), “ Bergman glia cells-NA (about 2.1%), brain peripheral cells-NA (about 1.5%), endothelial cells-NA (about 6.4%), nerve cells-excitatory neurons, and some "Neuron stem cells” (about 47.5%), “nerve cells-suppressive neurons” (about 21.3%), “poor astrocytes-NA” (about 8.7%), “poor astrocytes-NA” (about 1.9) %), which can be used as the reference cell type of the brain and its constituent ratio.
- the reference cell types used in the present specification and the composition ratios of the reference cell types are shown in the composition ratio list of the reference cell types at the end of this document.
- the count data of all these genes may be used, but it is possible to select a gene (signature gene) that can characterize each cell type and calculate the weighting factor using the count data of these gene sets. It is efficient.
- the signature gene set that characterizes each such cell type can be calculated, for example, by the method described below.
- the count data for scRNA-Seq analysis includes Rn45s, which has been reported as a non-mRNA artifact, although it significantly affects the count of spike-in genes labeled with ERCC and the total count. It is preferable to delete the counts derived from the three genes Akap5 and Lrrc17. Moreover, RNA count from each gene, the total count for each cell in the scRNA-Seq dataset in terms of 100, 10 3, 10 4, 10 5, 10 6 cases like, previously normalized Is preferable.
- a classifier generated by training artificial intelligence such as a random forest can be used. Artificial intelligence is trained and classifiers are generated using the composition ratio of reference cell types of each organ and the count data set of scRNA-Seq analysis reported for each reference cell type. For example, when using a random forest as artificial intelligence, the important features of the classifier are extracted as the signature gene name of each cell type, and the "Mean Decrease Gini" value is used as the importance index of each gene, and "Mean Decrease Gini” is used. "Genes with high values were extracted as signature genes. As the signature gene, about 2000 genes can be extracted from 100 genes from the one with the higher "Mean Decrease Gini" value and used as a signature gene set. Next, for each cell type present in each organ, a weighting factor for correcting the count data set of scRNA-Seq analysis with RNA content is calculated.
- the count data (also referred to as signature gene scRNA-Seq data) of the scRNA-Seq analysis of the signature gene set in each cell type of the reference cell type and all contained in each organ as a whole.
- Count data obtained by RNA-Seq analysis of RNA also referred to as whole organ RNA-Seq data
- Both the signature gene scRNA-Seq count data and the whole organ RNA-Seq count data are normalized and used.
- RNA-Seq analysis count datasets can be used as whole organ RNA-Seq data.
- Whole organ RNA-Seq data of mice can be obtained from "i-organs.atr.jp”.
- Whole human organ RNA-Seq data can be obtained from "The Human Protein Atlas”(https://www.proteinatlas.org/; heart (ERR315328) and kidney (ERR315494)).
- the weighting factor can be calculated according to the following method.
- n indicates the number of signature genes of each organ.
- the combination C m of cells to be analyzed is randomly selected under the restriction that the composition ratio of the reference cell type is kept within the total set size m.
- m indicates a magnification and is determined depending on n. m is set to less than n in each of the following calculations.
- w j is calculated by solving the quadratic programming problem according to the following equation (2) under the restriction that the value of the result is 0.01 or more.
- S represents the number of RNA-Seq count datasets for each gene for the entire organ. For example, when using the corresponding whole organ RNA-Seq count datasets taken from two different individuals, S is 2.
- This quadratic problem can be solved in R using the "quadprog" package. Random selection of cell combinations to be analyzed Both steps of calculation are performed recursively until the number of w j becomes 100 or more, and are performed for all selected cells to be analyzed.
- the weighting calculates the average and variance of the weighted counts of the genes of each analysis target cell according to the following equation (3).
- equation (3) Shows the weighted count vector of the gene of the analysis target cell j, the average value of the weighting coefficient of the analysis target cell j, and the variance of the weighting coefficient of the analysis target cell j, respectively. Represents the element-by-element product between two vectors.
- the mean and variance of the weighting factors in the corresponding cell types follow a Gaussian distribution, the mean and variance of the weighting factors in the corresponding cell types. Is calculated according to the following equation (4).
- k, C k , and N k indicate the cell type, the group of cells to be analyzed labeled with cell type k, and the number of cells to be analyzed in C k, respectively.
- the count data set for scRNA-Seq analysis weighted by this method is also called the estimated scRAN-Seq count data set.
- composition ratio of each organ and analysis of total RNA expression pattern in the cell type 1-1-2 can be analyzed.
- the analysis of the composition ratio of the cell types constituting the organ to be analyzed is described in 1-1-3. Includes calculating the composition ratio of cell types constituting the analysis target organ including the analysis target cell based on the count data set of the scRNA-Seq analysis weighted in. In other words, the cell type composition ratio obtained by this method is the estimated composition ratio.
- the above 1-1-2 Using the weighting coefficient calculated in, it is possible to analyze the total RNA expression pattern in the cell types constituting the organ to be analyzed.
- the analysis of the total RNA expression pattern is to obtain the count data of the estimated scRNA-Seq analysis.
- the total RNA is intended to include RNA expressed from the signature gene set and other genes.
- analysis of the composition ratio of cell types and the expression pattern of total RNA in each cell type can be calculated at the same time by designing an algorithm based on Bayes' theorem.
- the calculation can be performed according to the following equation (5).
- equation (5) Is the whole organ RNA-Seq data vector, the matrix for which the column is the estimated scRNA-Seq data, which is a weighted count calculated according to the above equation (4) using the weighting coefficient of each cell type, and the cell type.
- the coefficient vector corresponding to the composition ratio is shown.
- the count weighted by the weighting coefficient of each cell type calculated according to the above formula (4) is an initial value, and is updated to a new value by the calculation of the formula (7) described later.
- Bayes' theorem is used to calculate X and r.
- ⁇ represents a hyperparameter for controlling the degree of variation in distribution when estimating the gene expression pattern of each cell type.
- the posterior distribution of X and r is obtained as Eq. (7) below.
- P (X) and P (r) show prior distributions of X and r, respectively.
- P (X) and P (r) are given as the following equations (8) and (9).
- ⁇ is a hyperparameter that controls the degree of variation in distribution when estimating the ratio of cell types.
- the cell type composition ratio and the count of the reference data set weighted by the formula (4) are used.
- the hyperparameters ⁇ and ⁇ can be set to 10 -3 , 10 -2 , ..., 10 3 for convenience.
- Signature gene set 100 to 2000 genes that produced high similarity to actual whole organ RNA-Seq (high Pearson and Spearman correlation coefficients, and similarity determined based on low mean square error)
- the result of the combination of the number of hyperparameters ( ⁇ and ⁇ ) can be selected as the best estimation result.
- the correction device 10 can be a general-purpose computer.
- the correction device 10 is communicably connected to the input device 111, the output device 112, and the media drive 113.
- the correction device 10 includes a CPU 101, a memory 102, a ROM (read only memory) 103, a storage device 104, a communication interface (I / F) 105, an input interface (I / F) 106, and an output interface (I). It includes a / F) 107 and a media interface (I / F) 108.
- Each configuration in the correction device 10 is connected to each other by a bus 109 so as to be capable of data communication.
- the storage device 104 is composed of a hard disk, a semiconductor memory element such as a flash memory, an optical disk, or the like.
- the storage device 104 includes an operating system (OS) 1041, a correction program 1042 described later, an algorithm database (DB) DB1, a reference cell type database (DB) DB2, and an organ-wide RNA-Seq database (DB) DB3. It is stored.
- the correction program 1042 works with the operating system 1041 to cause the computer to function as the correction device 10.
- the CPU 101 is also referred to as a control unit 101 in this embodiment.
- the algorithm database DB1 is described in 1-1-3. Contains the formula for making the corrections described in.
- the reference cell type database DB2 stores a label indicating the cell type contained in each organ, its composition ratio, and the data count of the scRNA-Seq analysis of each cell type in association with each other. Further, in the reference cell type database DB2, the data count of the corrected scRNA-Seq analysis of each cell type is stored in association with the label indicating the organ name and the label indicating the cell type name.
- the whole organ RNA-Seq database DB3 count data of RNA-Seq analysis of each whole organ of mouse or human is registered for each organ. These data are 1-1-2. It is generated and stored from the known data described in.
- the input device 111 is composed of a touch panel, a keyboard, a mouse, a pen tablet, a microphone, and the like, and inputs characters or voices to the correction device 10.
- the input device 111 may be connected from the outside of the control unit 101 or may be integrated with the correction device 10.
- the output device 112 is composed of, for example, a display device such as a display, a printer, or the like, and outputs various operation windows, analysis results, and the like.
- the media drive 113 may be a USB drive, a flexible disk drive, a CD-ROM drive, a DVD-ROM drive, or the like.
- Communication I / F105 communicates with an external database and other computers.
- the output I / F 107 transmits information to the output device 112.
- FIG. 2 shows the processing flow of the correction program 1042.
- the control unit 101 of the correction device 10 first receives the processing start command input by the operator from the input device 111, and starts the processing. In step S1, the control unit 101 has the above 1-1-2.
- the signature genes that characterize each cell type of the organ to be analyzed are selected according to the method described in.
- step S2 the control unit 101 acquires the scRNA-Seq count data of the signature gene set to be acquired in step S1 from the reference cell type database DB2.
- step S3 the control unit 101 acquires the whole organ RNA-Seq count data from the whole organ RNA-Seq database DB3. Note that step S3 may be before step S2.
- step S4 the control unit 101 uses the algorithm database DB1 to perform the above 1-1-2.
- the equation (4) is read from the equation (1) described in the above.
- the scRNA-Seq count data of the signature gene set acquired in step S2 and the whole organ RNA-Seq count data acquired in step S4 were used in each of the read equations, and the above 1-1-2.
- the weighting coefficient for each cell type existing in each organ is calculated based on the formula explained in.
- the control unit 101 stores the calculated weighting coefficient in the algorithm database DB1.
- step S5 the control unit 101 has 1-1-3. According to this, a count data set of scRNA-Seq analysis weighted for each cell type is acquired and stored in the reference cell type database DB2.
- control unit 101 may receive the output processing start command input by the operator from the input device 111, and output the weighted scRNA-Seq analysis count data set from the output device 112.
- steps S1 to S5 are performed by one computer
- steps S1, steps S2 to S4, and step S5 may be performed by another computer. That is, the first computer selects the signature gene according to step S1, the second computer acquires the information of the signature gene set of each cell type existing in each organ from the first computer, and steps S2 to S4 Is performed to calculate the weighting coefficient.
- a third computer may obtain a count dataset for the weighted scRNA-Seq analysis.
- first computer may perform steps S1 to S4, and the second computer may perform step S5.
- first computer may perform step S1
- second computer may perform steps S2 to S5.
- ScRNA-Seq analyzer and analysis device for the composition ratio of cell types that make up the organ to be analyzed As explained in the above, the analysis of scRNA-Seq and the analysis of the composition ratio of the cell types constituting the organ to be analyzed can be performed at the same time. Therefore, the analyzer 20 performs both processes.
- FIG. 3 shows the hardware configuration of the analysis device 20.
- the configuration of the analysis device 20 is basically the same as the configuration of the correction device 10 except for the storage device 204.
- the storage device 204 stores the analysis program 2042, which will be described later, in place of the correction program 1042. Further, the storage device 204 stores the algorithm database (DB) DB1, the reference cell type database (DB) DB2, and the whole organ RNA-Seq database (DB) DB3, similarly to the storage device 104.
- DB algorithm database
- DB reference cell type database
- DB whole organ RNA-Seq database
- FIG. 4 shows the processing flow of the analysis program 2042.
- the control unit 201 of the analysis device 20 first receives the processing start command input by the operator from the input device 211, and starts the processing. In step S11, the control unit 201 described the above 2.
- the algorithm described in the above is read from the algorithm database DB1.
- step S13 the control unit 201 acquires the whole organ RNA-Seq count data from the whole organ RNA-Seq database DB3.
- step S13 the control unit 201 described the above 3-2.
- the count data set of the weighted scRNA-Seq analysis obtained in is read from the reference cell type database DB2 and applied to the algorithm.
- control unit 201 records the composition ratio of the cell types constituting the analysis target organ estimated by the algorithm and the estimated count data of the scRNA-Seq analysis in the storage device 204 as the estimation result.
- control unit 201 may output only the composition ratio of the cell types constituting the analysis target organ from the output device 212, and outputs only the estimated count data of the scRNA-Seq analysis from the output device 212. You may. Further, the control unit 201 may output both results from the output device 212.
- the recording medium on which the computer program is recorded The correction program 1042 and the analysis program 2042 may be recorded on the recording medium.
- each program is stored in a semiconductor memory element such as a hard disk or a flash memory, or a recording medium such as an optical disk. Further, each program may be stored in a recording medium that can be connected to a network such as a cloud server. Each program may be provided in download format or as a program product recorded on a recording medium.
- the storage format of the program in the recording medium is not limited as long as each device can read the program.
- the storage in the recording medium is preferably non-volatile.
- composition ratio of reference cell type 14 types of organs such as aorta, brain, fat, heart, kidney, colon, liver, lung, bone marrow, pancreas, skin, skeletal muscle, spleen, and thymus are described in Non-Patent Document 5.
- the composition ratio of the reference cell type was calculated based on the scRNA-Seq data of the above and the database registered in NIH and the like.
- the ratio of cell types in each organ described in Non-Patent Document 5 was used as the composition ratio of reference cell types.
- Non-Patent Document 2 For skeletal muscle, the cell type ratio described in Non-Patent Document 2 was used as the composition ratio of the reference cell type.
- the composition ratio of the cell type described in Non-Patent Document 5 was modified to be the composition ratio of the reference cell type (Referene) in accordance with the separation analysis of the myocardium and the non-muscle cell.
- the ratio of cardiomyocytes (3.1%) adopted in Non-Patent Document 5 is the ratio that is generally consensus in the field of tissue anatomy based on various past studies (3%). Extremely low compared to 30% to 40%). Therefore, in this example, the ratio of cardiomyocytes was set to 30%, and the remaining 70% was divided by the ratio of non-muscle cell types to obtain the composition ratio of reference cell types.
- the composition ratio of the reference cell type was determined based on the report in NIH (http://www.nervenet.org/papers/BrainRev99.html#Numbers).
- NIH http://www.nervenet.org/papers/BrainRev99.html#Numbers.
- the corresponding cell type label of the scRNA-Seq data described in Non-Patent Document 5 was used.
- the cell type classes in the brain are classified into four classes, "neurons”, “glial cells”, “endothelial cells”, and “others”, and the ratio of each class is 75: 23: 7: Set to 4. This ratio follows the estimated ratio in the mouse brain (http://www.nervenet.org/papers/BrainRev99.html#Numbers).
- Non-Patent Document 5 "neurons”, “glial cells”, and “others” were further classified into more detailed cell type classes. Specifically, the class of “neurons” was further classified into “neurons-excitatory neurons, and some neural stem cells” and “neurons-inhibitory neurons". The “Other” class was classified into “cerebral pericyte-NA” and “oligodendrocyte progenitor cell-NA”. The class of "glial cells” was classified based on the following three assumptions. i) According to Non-Patent Document 5, four cell types of "glial cell” are "microglial cell-NA", “astrocyte-NA”, “Bergmann glial cell-NA”, and "oligodendrocyte NA”.
- the ratio of each brain cell type is "macrophages-NA” (about 0.2%), “microglial cell-NA” (10.0%), “astrosite-NA” (about 2.2%), “ Bergman glia cells-NA (about 2.1%), brain pericutaneous cells-NA (about 1.5%), endothelial cells-NA (about 6.4%), nerve cells-excitatory neurons, and some "Neuron stem cells” (about 47.5%), “nerve cells-suppressive neurons” (about 21.3%), “poor splinter cells-NA” (about 8.7%), “poor splinter progenitor cells-NA” (about 1.9%) %), And these were used as the composition ratio of the reference cell type of the brain. For the human heart and kidney, the composition ratio of the heart cell type and the composition ratio of the kidney cell type in the mouse were used as the composition ratio of the reference cell type.
- composition ratio of the reference cell type of each organ is shown in the composition ratio list of the reference cell type described later.
- scRNA-Seq count data for each cell type is registered in a known database.
- RNA counts from each gene were then converted and normalized when the total count for each cell in the scRNA-Seq dataset was 100. This normalization step was performed similarly for each RNA contained in the whole organ RNA-Seq dataset.
- RNA-Seq data of mouse and whole organ RNA-Seq of myocardial infarction model mouse were obtained from "i-organs.atr.jp”.
- Whole human organ RNA-Seq data was taken from "The Human Protein Atlas”(https://www.proteinatlas.org/; heart (ERR315328) and kidney (ERR315494)).
- scRNA-Seq data was obtained from Non-Patent Document 5 (aorta, brain, fat, heart, kidney, large intestine, liver, lung, bone marrow, pancreas, skin, spleen, thoracic gland) and skeletal muscle of "mouse cell atlas”.
- RNA counts of all the predicted and calculated genes was normalized to 1 million copies.
- the normalized count of each gene was rounded to an integer and analyzed using the R package "DESeq2 (version 1.24.0)".
- the heart is composed of cardiomyocytes and non-muscle cells. Cardiomyocytes occupy the largest volume of the heart. However, when comparing the number of cells, there are more non-muscle cells than cardiomyocytes. Contrary to this fact, the composition of cardiac cell types calculated by the MuSiC or DWLS method is calculated to be 90% occupied by cardiomyocytes. The same tendency was seen in skeletal muscle.
- RNA content varies from cell to cell, ranging from 50,000 transcripts / cell to 300,000 transcripts / cell.
- the volume of cardiomyocytes is said to be 20 to 25 times the volume of non-muscle cells such as endothelial cells and fibroblasts. Therefore, the total RNA content per cell can vary significantly between muscle and non-muscle cells. In fact, this possibility is not considered in the MuSiC and DWLS methods. It is considered that such a point led to the deviation of the composition ratio of the cell type presumed to be the reference.
- Figure 7 shows the estimated whole organ RNA-Seq data.
- the putative whole organ RNA-Seq data was calculated as the sum of transcript counts for each gene normalized by weighting tissues composed of multiple cell types based on the composition ratio of known reference cell types. ..
- the result shown in FIG. 7 is the dedicated number (number of genes) of the signature gene according to the number of higher ranks in each cell type of each organ used to identify the cell type of each organ calculated by RF.
- the top ranks were 100 genes, 300 genes, and 2000 genes among the signature genes.
- the aorta was compared with 1577 genes instead of 2000 genes, and the kidney was compared with 1461 genes.
- the similarity / dissimilarity between the actual gene expression profile and the putative gene expression profile of 14 organs is indicated by the Pearson correlation coefficient.
- the Pearson correlation coefficient was less than 0.75 in 10 organs (aorta, brain, heart, large intestine, liver, lung, pancreas, skin, skeletal muscle, thymus).
- organs aorta, brain, heart, large intestine, liver, lung, pancreas, skin, skeletal muscle, thymus.
- the weight coefficient for each cell type existing in each organ was calculated according to the following method. Shows the vector of the normalized whole organ RNA-Seq count, the j weighting factor of each cell to be analyzed, and the matrix of the normalized scRNA-Seq count.
- n indicates the number of signature genes of each organ. The top 100, 300, or 2,000 genes were selected as signature genes by ranking based on the “Mean Decrease Gini” obtained by RF analysis. All genes were used for organs with a maximum signature gene count of less than 2000 in RF analysis.
- the combination C m of cells to be analyzed was randomly selected under the restriction that the composition ratio of the reference cell type was kept within the total set size m.
- Equation (1) m indicates a magnification and is determined depending on n. m is set to less than n in each of the following calculations.
- w j was calculated by solving the quadratic programming problem according to the following equation (2) under the restriction that the value of the result is 0.01 or more.
- S represents the number of RNA-Seq count datasets for each gene for the entire organ. In this study, we used the corresponding whole organ RNA-Seq count datasets from two different individuals. Therefore, S is 2. This quadratic problem was solved in R using the "quadprog" package.
- Equation (3) Shows the weighted count vector of the gene of the analysis target cell j, the average value of the weighting coefficient of the analysis target cell j, and the variance of the weighting coefficient of the analysis target cell j, respectively. Represents the element-by-element product between two vectors.
- the mean and variance of the weighting factors in the corresponding cell types were calculated according to the following equation (4).
- k, C k , and N k indicate the cell type, the group of cells to be analyzed labeled with cell type k, and the number of cells to be analyzed in C k, respectively.
- the weighting coefficient for each cell type existing in each organ, its average value, variance, and quartile are shown in the weighting coefficient list described later.
- Equation (6) was adopted.
- ⁇ represents a hyperparameter.
- the posterior distribution of X and r was obtained as Eq. (7) below.
- P (X) and P (r) show prior distributions of X and r, respectively.
- P (X) and P (r) are given as the following equations (8) and (9).
- the cell type composition ratio and the count of the reference dataset weighted by the formula (4) were used.
- Hyperparameters ⁇ and ⁇ are set to 10 -3 , 10 -2 ,..., 10 3 for convenience.
- Signature gene sets (100, 300, 2,000) that produced high similarity to actual whole organ RNA-Seq (high Pearson and Spearman correlation coefficients, and similarity determined based on low mean square error) / 1,577 / 1,461)
- the result of the combination of the number of hyperparameters ( ⁇ and ⁇ ) was selected as the best estimation result. The outline of this calculation is shown in FIG.
- the composition ratio of the cell type estimated by the method of the present invention and the comparison result with the reference cell type ratio are shown in FIGS. 11 and 12.
- the composition ratio of cell types of 10 organs was calculated.
- the result is shown in FIG. From the 14 organs used in FIGS. 5 and 6, the brain, pancreas, skin, and thymus were excluded from the study for the following reasons. 1) Actual cell type ratios are not available. 2) The pancreas is actually derived from islets. Actual cell type ratios are available for islets, but do not indicate actual pancreatic overall ratios. 3) In the case of skin or thymus, the Pearson correlation coefficient did not exceed 0.8 even when the cell type and specific weighting coefficient were used.
- the calculated cell type composition ratios of the above 10 organs were similar to the reference cell type composition ratios experimentally determined by actual scRNA-Seq studies (Fig. 11).
- the abnormally large proportions of cardiomyocytes and skeletal muscle cells estimated by the MuSiC and DWLS methods were improved by V-scRNA-Seq, respectively.
- the result is shown in FIG.
- the mean square error (MSE) with respect to the composition ratio of the reference cell type is V-scRNA-Seq in 5 actual organs (fat, heart, large intestine, liver, skeletal muscle) and other organs. It surpassed the method.
- the method of the present invention is applied to a mouse model of myocardial infarction (MI), and the method according to the present invention is the composition ratio of the cell type in the heart and the already known cell type-dependent gene expression during MI. It was examined whether both changes over time could be detected.
- the disease model calculation first calculated the weighting factor using sham heart organ-wide RNA-Seq data using the same reference cell type composition of normal mice at each stage (E, M, L). .. Next, using the total cardiac RNA-Seq data of the sham / MI model, the composition ratio and gene expression profile of the cell type at each stage were calculated as described above.
- RNA-Seq data from sham controls E-sham, M-sham, L-sham
- composition of reference cell types in normal mouse hearts were used to calculate weighting factors for each cell type. ..
- the calculated changes in gene expression in each cell type at the time of myocardial infarction were also detected with a plurality of characteristics expected from previous experimental studies (Fig. 15b).
- RNA-Seq dataset Each of the total counts of RNA expressed from each gene stored in the whole human organ RNA-Seq dataset was first normalized to 100. The mouse gene symbol was then matched to that of the human by extracting a gene with a common name between the mouse and the human. Using these mouse-human common gene sets, the computational techniques described for mouse datasets were applied. Human heart and kidney organ-wide RNA-Seq data were obtained from "The Human Protein Atlas" (https://www.proteinatlas.org/).
- Fig. 8 The results are shown in Fig. 8. It has been shown that the calculated cell type composition for the human heart and kidney is similar to the cell type composition for the corresponding normal mouse organs (Fig. 16a). Furthermore, t-SNE analysis of estimated human heart and kidney scRNA-Seq data showed that classification based on the gene expression profile of known cell types in each organ was possible (Fig. 16b). These results indicate the cell type-specific weighting factor and the cross-species applicability of the V-scRNASeq framework.
- Aorta Aorta-endothelial cell-NA: EC: 0.40; Aorta: Aorta-erythrocyte-NA: ERC: 0.21; Aorta: Aorta-fibroblast-NA: FC: 0.22; Aorta: Aorta-professional antigen presenting cell-NA: PAP: 0.16; Brain: Brain_Myeloid-macrophage-NA: MAC: 0.00; Brain: Brain_Myeloid-microglial cell-NA: MI: 0.10; Brain: Brain_Non-Myeloid-astrocyte-NA: AS: 0.02; Brain: Brain_Non-Myeloid-Bergmann glial cell-NA: BGC: 0.00; Brain: Brain_Non-Myeloid-brain pericyte-NA: BP: 0.02; Brain: Brain_Non-Myeloid-endothelial cell-NA: EC: 0.06; Brain: Brain_Non-Myeloid-neuron-excitatory neurons
Landscapes
- Life Sciences & Earth Sciences (AREA)
- Health & Medical Sciences (AREA)
- Engineering & Computer Science (AREA)
- Physics & Mathematics (AREA)
- Chemical & Material Sciences (AREA)
- Bioinformatics & Cheminformatics (AREA)
- Medical Informatics (AREA)
- Biophysics (AREA)
- General Health & Medical Sciences (AREA)
- Biotechnology (AREA)
- Proteomics, Peptides & Aminoacids (AREA)
- Bioinformatics & Computational Biology (AREA)
- Theoretical Computer Science (AREA)
- Spectroscopy & Molecular Physics (AREA)
- Evolutionary Biology (AREA)
- Analytical Chemistry (AREA)
- Genetics & Genomics (AREA)
- Organic Chemistry (AREA)
- Molecular Biology (AREA)
- Zoology (AREA)
- Wood Science & Technology (AREA)
- Data Mining & Analysis (AREA)
- Bioethics (AREA)
- Artificial Intelligence (AREA)
- Software Systems (AREA)
- Evolutionary Computation (AREA)
- Computer Vision & Pattern Recognition (AREA)
- Public Health (AREA)
- Databases & Information Systems (AREA)
- Epidemiology (AREA)
- Microbiology (AREA)
- Immunology (AREA)
- Biochemistry (AREA)
- General Engineering & Computer Science (AREA)
- Measuring Or Testing Involving Enzymes Or Micro-Organisms (AREA)
Abstract
Description
本発明のある実施形態は、シングルセルRNA-Seq解析のカウントデータセットの補正方法、補正装置及び補正プログラムに関する。
1-1.シングルセルRNA-Seq解析のカウントデータセットの補正方法
1-1-1.RNA-Seq解析
解析対象細胞は、前記生物の器官に存在する限り制限されない。器官は、好ましくは器官内の細胞構成がわかっている細胞である。
解析対象細胞から取得した、又は解析対象細胞について予測されたシングルセルRNA-Seq解析のカウントデータセットに、細胞種ごとの総RNAの含有量に基づいて重み付けするための重み係数の算出方法について説明する。
また、骨格筋については、非特許文献2に記載されている細胞種の比率を参照細胞種とその構成比率を使用することが好ましい。
本明細書において使用する参照細胞種、及びその細胞種の構成比率を、本書末尾の参照細胞種の構成比率リストに示す。
次に、各器官に存在する各細胞種について、scRNA-Seq解析のカウントデータセットをRNA含有量で補正するための重み係数を算出する。
重み係数は、以下の方法にしたがって、算出することができる。

次に下式(1)について説明する。


算出された重み係数を使用し、解析対象細胞から取得した、又は解析対象細胞について予測されたscRNA-Seqのカウントデータセットに、解析対象細胞に対応する細胞種ごとの総RNAの含有量に基づいて重み付けする。



上記1-1-2.で算出された重み係数を使用して、解析対象器官を構成する細胞種の構成比率を解析することができる。解析対象器官を構成する細胞種の構成比率の解析は、上記1-1-3.で重み付けされたscRNA-Seq解析のカウントデータセットに基づいて、解析対象細胞を含む解析対象器官を構成する細胞種の構成比率を算出することを含む。言い換えると、この方法によって取得される細胞種の構成比率は、推定された構成比率である。
計算は下式(5)にしたがうことができる。





3-1.scRNA-Seq解析のカウントデータセットの補正装置
図1に、scRNA-Seq解析のカウントデータセットの補正装置10のハードウエアの構成を示す。
アルゴリズムデータベースDB1は、上記1-1-3.で述べた補正を行うための数式を格納している。参照細胞種データベースDB2には、各器官に含まれる細胞種を示すラベルと、その構成比率と、各細胞種のscRNA-Seq解析のデータカウントが紐付けられて格納されている。また、参照細胞種データベースDB2には、補正された各細胞種のscRNA-Seq解析のデータカウントが、器官名を示すラベルと、細胞種名を示すラベルと紐付けられて格納される。器官全体RNA-SeqデータベースDB3には、マウス、またはヒトの各器官全体RNA-Seq解析のカウントデータが器官ごとに登録されている。これらのデータは、1-1-2.で述べた公知のデータから生成され格納されている。
図2に補正プログラム1042の処理の流れを示す。
補正装置10の制御部101は、はじめにオペレータが入力デバイス111から入力した処理開始指令を受け付け、処理を開始する。制御部101は、ステップS1において、上記1-1-2.に記載した方法にしたがって、解析対象器官の各細胞種を特徴付けるシグネチャ遺伝子を選択する。
上記2.において説明したように、scRNA-Seqの解析と解析対象器官を構成する細胞種の構成比率の解析は同時に行うことができる。したがって、解析装置20は、両方の処理を行う。
図4に、解析プログラム2042の処理の流れを示す。
解析装置20の制御部201は、はじめにオペレータが入力デバイス211から入力した処理開始指令を受け付け、処理を開始する。制御部201は、スッテプS11において、上記2.において、説明したアルゴリズムを、アルゴリズムデータベースDB1から読み出す。
補正プログラム1042及び解析プログラム2042は、記録媒体に記録されていてもよい。
1.参照細胞種の構成比率の計算
大動脈、脳、脂肪、心臓、腎臓、大腸、肝臓、肺、骨髄、膵臓、皮膚、骨格筋、脾臓、及び胸腺の14種の器官について、非特許文献5に記載のscRNA-Seqデータや、NIH等に登録されているデータベースに基づいて参照細胞種の構成比率を算出した。
大動脈、脂肪、腎臓、大腸、肝臓、肺、骨髄、膵臓、皮膚、脾臓、および胸腺については、非特許文献5に記載の各器官における細胞種の比率を参照細胞種の構成比率として使用した。
また、各参照細胞種の構成比率リストに示される各細胞種については、公知データベースに細胞種ごとのscRNA-Seqのカウントデータが登録されている。
すべてのデータ処理と分析は、ソフトウェア「R」 バージョン3.6.1を使用して実行した。すべての細胞種ラベルは、既報のscRNA-Seq研究において付されたラベルと同様とした。scRNA-Seqデータに付されている遺伝子シンボルは、「org.Mm.eg.db」のRパッケージ内の「org.Mm.egALIAS2EG」に由来するentrez遺伝子IDによって各器官全体RNA-Seqデータに対応付け変換された。ERCCラベルが付された遺伝子はスパイクイン遺伝子であるため削除した。さらに、Rn45s、Akap5、Lrrc17の3つの遺伝子に由来するRNAのカウントも、合計カウントに大きく影響する非mRNAアーチファクトであるため削除した。次に、各遺伝子に由来するRNAカウントを、scRNA-Seqデータセット内の各細胞の総カウントが100である場合に換算し、正規化した。この正規化の工程は、器官全体RNA-Seqデータセットに含まれる各RNAについても同様に行った。
ランダムフォレスト(RF)を使用し、前のセッションで説明した参照細胞種の構成比率データセットとscRNA-Seqデータを用いて、各細胞種のシグネチャ遺伝子をコンピュータで選択した。この選択ではRFによる分類器のチューニングと作成にRの「randomForest」パッケージを使用した。scRNA-Seqデータを最初に2分割し、一方をRFによる分類器を作成するためのトレーニングデータとし、もう一方を分類器の精度を検証するためのF1スコア計算用のテストデータとした。前のセッションで説明した細胞種の構成比率を維持したデータセットでRF分析を行った。分類器の生成に続いて、分類器の重要な特徴量を各細胞種のシグネチャ遺伝子名として抽出し、“Mean Decrease Gini”値を各遺伝子の重要度指標として使用した。
本実施例では、すべて公開データセットを使用した。マウスの器官全体RNA-Seqデータ、及び心筋梗塞モデルマウスの器官全体RNA-Seqは「i-organs.atr.jp」から取得した。ヒト器官全体RNA-Seqデータは「The Human Protein Atlas」(https://www.proteinatlas.org/;心臓(ERR315328)および腎臓(ERR315494))から取得した。scRNA-Seqデータは、非特許文献5(大動脈、脳、脂肪、心臓、腎臓、大腸、肝臓、肺、骨髄、膵臓、皮膚、脾臓、胸腺)、「マウス細胞アトラス」の骨格筋から取得した。
予測計算したすべての遺伝子のRNAカウントの合計を100万コピーに正規化した。 各遺伝子の正規化されたカウントを整数に四捨五入し、Rパッケージ「DESeq2(バージョン1.24.0)」を使用して解析した。
はじめに、既報の方法であるMuSiC(非特許文献17)およびDWLS法(非特許文献19)について、それぞれの方法によって算出された細胞種の構成比率と、scRNA-Seqデータ及び過去の報告から得られた参照細胞種の構成比率とのサイド・バイ・サイド比較を行い、各デコンボリューション法の性能を検証した。
MuSiC(非特許文献17)およびDWLS法(非特許文献19)は、それぞれの文献にしたがった。DWLS法でquadratic problem solver を行う際にはsolve.QP (R package: quadprog) をsolve_osqp (R package: osqp)に置き換えた。
MuSiC又はDWLS法によって、コンピュータにより算出された各器官の推定した細胞種の構成比率と上記2.において準備した各器官の参照細胞種の構成比率との比較結果を図5及び図6に示す。MuSiC又はDWLS法によって推定された各器官における推定した細胞種の構成比率と参照細胞種の構成比率は乖離しており、また乖離の程度も様々であった。特に、骨格筋、心臓、膵臓、及び肝臓では乖離が顕著であった。
参照細胞種の構成比率と推定した細胞種の構成比率の乖離は、器官の全RNAサンプルを抽出した際に器官から採取した組織に含まれている各細胞種間でのトータルRNAの含有量の差が原因であると仮説を立て、実際の遺伝子発現プロファイルと推定遺伝子発現プロファイルを比較することにより、この仮説を検証した。推定器官全体RNA-Seq データは、I.の1で取得した参照細胞種の構成比率にI. の2. で取得したカウントデータをかけ合わせた結果である。
各組織に存在する異なる細胞種におけるRNA含有量を補正するための重み係数を算出し、その精度の検証を行った。
各器官に存在する細胞種ごとの重み係数は、以下の手法にしたがって算出した。


次に、重み係数の分布がガウス分布にしたがうと仮定して、各解析対象細胞の遺伝子の重み付きカウントの平均と分散を下式(3)にしたがって算出した。


上記式(2)にしたがって、算出された各器官に存在する細胞種ごとの重み係数、その平均値、分散、四分位数を後述する重み係数リストに示す。
上記計算式(2)により、各細胞種の重み係数及びその範囲が作成された(図8)。筋細胞の重み係数は、心臓と骨格筋の両方で実際に非筋細胞種よりも高くなった(図8)。これらの細胞種特異的な重み係数を使用して、各細胞種のトランスクリプトカウントに重み付けをした。次に、各器官に含まれる各細胞種の参照細胞種の構成比率にしたがって、重み係数により重み付けされたトランスクリプトカウントにさらに各器官における各細胞種の参照細胞種の構成比率を適用し、RNA-Seqデータセットを生成した。この算出方法を推定器官全体RNA-Seq(v-RNA-Seq)と呼び、推定器官全体RNA-Seqで得られたRNA-Seqデータセットを推定器官全体RNA-Seqデータセットと呼ぶ。
上記IV.において算出された細胞種ごとのRNA含有量に基づく特異的重み係数を使用して、ベイズの定理に基づいたアルゴリズムを設計し、各器官に含まれる各細胞種の比率とその各細胞種における遺伝子発現パターンの両方を同時に計算した。
細胞種の構成比率と遺伝子発現パターンの計算は、下式(5)にしたがった。
各細胞種において重み係数によって重み付けされたトランスクリプトカウントの平均と分散を上記式(4)にしたがって算出した。






上記V.1.において算出した推定scRNA-Seqカウントデータが、各器官に存在する細胞種を識別できているか、t-Distributed Stochastic Neighbor Embedding(t-SNE)を使用して検証した。各器官に存在するそれぞれの細胞種に属する細胞において、合計サンプリングサイズを3,000に設定し、各細胞種のサンプリングされたセルの数と、細胞種kの推定scRNA-Seqカウントデータを、

本発明のおいては、2つのハイパーパラメータαとβを定義して、細胞種の比の組み合わせの影響を考慮した。異なる器官レベルの遺伝子発現パターン、例えば正常な器官と病理器官の遺伝子発現パターンは、異なる場合がある。しかし、この違いには、i)各細胞種における遺伝子発現パターンは一見同じままであるにもかかわらず、各細胞種の比率が異なっている場合、ii)細胞種の比率はおなじであるものの、同じ細胞種間で遺伝子発現パターンの違いが生じている場合、が考えられる。また、i)とii)が組み合わされている可能性もある。そこで、αとβの広範な範囲の包括的な組み合わせを評価して、器官レベルのトランスクリプトームの挙動を説明するために、細胞種の組成と各細胞タイプの重み付けトランスクリプトームカウントの最適な組み合わせを算出した。
次に、我々の方法が疾患プロセスに伴う各細胞種の細胞種比と遺伝子発現の変化を検出できるかどうかを評価した。心血管疾患は、世界最大の死因である(https://www.who.int/news-room/fact-sheets/detail/cardiovascular-diseases-(cvds))。心臓病の間の細胞種構成か経時的に変化することを示す報告が存在する。さらに、心臓は、上述したように、以前に公開されたデコンボリューション法ではなく、本発明に係る方法が細胞種の構成比率とその遺伝子発現パターンの両方を効果的に計算できる器官である。したがって、心筋梗塞(MI)のマウスモデルに本発明の方法を適用し、本発明に係る方法が、心臓における細胞種の構成比率と、既に知られているMI時の細胞種依存的な遺伝子発現の経時的変化の両方を検出できるか検討した。
疾患モデル計算は、はじめに、各ステージ(E、M、L)の正常マウスの同じ参照細胞種の構成比率を使用して、sham心臓の器官全体RNA-Seqデータを使用して重み係数を計算した。次に、sham/ MIモデルの心臓全RNA-Seqデータを使用して、上記のように各段階の細胞種の構成比率と遺伝子発現プロファイルを計算した。
心筋梗塞の動物モデルの作製方法は、公知である。心筋梗塞の3つの段階は、以下の通りである。1)冠動脈結紮後1日(E-MI、早期心筋梗塞段階)、2)冠動脈結紮7日後(M-MI、早期線維症段階)、3)冠動脈結紮後8週間(L-MI、心臓リモデリング段階)。 この解析では、shamコントロール(E-sham、M-sham、L-sham)のRNA-Seqデータと正常なマウス心臓の参照細胞種の構成比率を使用して、各細胞種の重み係数を計算した。
マウスの重み係数とV-scRNA-Seqをヒト器官全体RNA-Seqデータセットのデコンボリューションへ応用できることを検証した。心臓および腎臓の公的に入手可能なヒト器官全体RNA-Seqデータを使用して、それらの細胞種の構成比率とトランスクリプトームプロファイルを計算した。
下記リストは、Organ:Cell type:Abbreviation:Referenceの順に並んでいる。「;」は各細胞種のデータの区切りを意図している。細胞の構成比率は器官全体が「1」となるように正規化している。ここには、代表的な細胞種を示しているため、各器官における各細胞種の構成比率の合計は必ずしも1にはならない。
Aorta:Aorta-endothelial cell-NA:EC :0.40 ;
Aorta:Aorta-erythrocyte-NA:ERC:0.21 ;
Aorta:Aorta-fibroblast-NA:FC :0.22 ;
Aorta:Aorta-professional antigen presenting cell-NA:PAP:0.16 ;
Brain:Brain_Myeloid-macrophage-NA:MAC:0.00 ;
Brain:Brain_Myeloid-microglial cell-NA:MI :0.10 ;
Brain:Brain_Non-Myeloid-astrocyte-NA:AS :0.02 ;
Brain:Brain_Non-Myeloid-Bergmann glial cell-NA:BGC:0.00 ;
Brain:Brain_Non-Myeloid-brain pericyte-NA:BP :0.02 ;
Brain:Brain_Non-Myeloid-endothelial cell-NA:EC :0.06 ;
Brain:Brain_Non-Myeloid-neuron-excitatory neurons and some neuronal stem cells:NEUR2 :0.47 ;
Brain:Brain_Non-Myeloid-neuron-inhibitory neurons:NEUR1 :0.21 ;
Brain:Brain_Non-Myeloid-oligodendrocyte-NA:OLC:0.09 ;
Brain:Brain_Non-Myeloid-oligodendrocyte precursor cell-NA:OPC:0.02 ;
Fat:Fat-B cell-NA:B:0.10 ;
Fat:Fat-endothelial cell-NA:EC :0.16 ;
Fat:Fat-mesenchymal stem cell of adipose-mesenchymal progenitor:MSA:0.43 ;
Fat:Fat-myeloid cell-NA:MYE:0.20 ;
Fat:Fat-NA-NA:NA :0.01 ;
Fat:Fat-natural killer cell-NA:NK :0.01 ;
Fat:Fat-T cell-NA:T:0.08 ;
Heart:Heart-cardiac muscle cell-NA:CM :0.30 ;
Heart:Heart-endocardial cell-NA:ECC:0.02 ;
Heart:Heart-endothelial cell-NA:EC :0.20 ;
Heart:Heart-fibroblast-NA:FC :0.29 ;
Heart:Heart-leukocyte-NA:LEU:0.13 ;
Heart:Heart-myofibroblast cell-NA:MYF:0.05 ;
Heart:Heart-NA-conduction cells:CC :0.01 ;
Heart:Heart-smooth muscle cell-NA:SM :0.01 ;
Kidney:Kidney-endothelial cell-NA:EC :0.19 ;
Kidney:Kidney-epithelial cell of proximal tubule-NA:PT :0.48 ;
Kidney:Kidney-kidney collecting duct epithelial cell-NA:CD :0.22 ;
Kidney:Kidney-leukocyte-NA:LEU:0.02 ;
Kidney:Kidney-macrophage-NA:MAC:0.09 ;
Large Intestine:Large Intestine-Brush cell of epithelium proper of large intestine-Tuft cell:TUF:0.01 ;
Large Intestine:Large Intestine-enterocyte of epithelium of large intestine-Enterocyte (Distal):EN-D :0.06 ;
Large Intestine:Large Intestine-enterocyte of epithelium of large intestine-Enterocyte (Proximal):EN-P :0.21 ;
Large Intestine:Large Intestine-enteroendocrine cell-Chromaffin Cell:CHR:0.01 ;
Large Intestine:Large Intestine-epithelial cell of large intestine-Lgr5- amplifying undifferentiated cell:EP1:0.16 ;
Large Intestine:Large Intestine-epithelial cell of large intestine-Lgr5- undifferentiated cell:EP2:0.10 ;
Large Intestine:Large Intestine-epithelial cell of large intestine-Lgr5+ amplifying undifferentiated cell (Distal):EP3-D:0.03 ;
Large Intestine:Large Intestine-epithelial cell of large intestine-Lgr5+ amplifying undifferentiated cell (Proximal):EP3-P:0.05 ;
Large Intestine:Large Intestine-epithelial cell of large intestine-Lgr5+ undifferentiated cell (Distal):EP4-D:0.08 ;
Large Intestine:Large Intestine-epithelial cell of large intestine-Lgr5+ undifferentiated cell (Proximal):EP4-P:0.12 ;
Large Intestine:Large Intestine-large intestine goblet cell-Goblet cell (Distal):GB1-D:0.09 ;
Large Intestine:Large Intestine-large intestine goblet cell-Goblet cell (Proximal):GB1-P:0.05 ;
Large Intestine:Large Intestine-large intestine goblet cell-Goblet cell, top of crypt (Distal):GB2-D:0.02 ;
Liver:Liver-B cell-NA:B:0.07 ;
Liver:Liver-endothelial cell of hepatic sinusoid-NA:EC :0.33 ;
Liver:Liver-hepatocyte-NA:HE :0.42 ;
Liver:Liver-Kupffer cell-NA:KUP:0.11 ;
Liver:Liver-natural killer cell-NK/NKT cells:NK2:0.07 ;
Lung:Lung-B cell-NA:B:0.02 ;
Lung:Lung-ciliated columnar cell of tracheobronchial tree-multiciliated cells:CCC:0.01 ;
Lung:Lung-classical monocyte-invading monocytes:CMN:0.07 ;
Lung:Lung-epithelial cell of lung-alveolar epithelial type 1 cells, alveolar epithelial type 2 cells, club cells, and basal cells:EP5:0.06 ;
Lung:Lung-leukocyte-mast cells and unknown immune cells:LEU2 :0.02 ;
Lung:Lung-lung endothelial cell-NA:EC :0.34 ;
Lung:Lung-monocyte-circulating monocytes:MN2:0.07 ;
Lung:Lung-myeloid cell-dendritic cells, alveolar macrophages, and interstital macrophages:MYE2 :0.01 ;
Lung:Lung-NA-lung neuroendocrine cells and unknown cells:NC :0.03 ;
Lung:Lung-natural killer cell-NA:NK :0.02 ;
Lung:Lung-stromal cell-NA:SC :0.33 ;
Lung:Lung-T cell-NA:T:0.03 ;
Marrow:Marrow-B cell-Cd3e+ Klrb1+ B cell:B2 :0.01 ;
Marrow:Marrow-basophil-NA:BAS:0.00 ;
Marrow:Marrow-common lymphoid progenitor-NA:CLP:0.04 ;
Marrow:Marrow-granulocyte-NA:GRA:0.16 ;
Marrow:Marrow-granulocyte monocyte progenitor cell-NA:GMP:0.02 ;
Marrow:Marrow-granulocytopoietic cell-NA:GC :0.05 ;
Marrow:Marrow-hematopoietic precursor cell-NA:HPC:0.08 ;
Marrow:Marrow-immature B cell-NA:IB :0.06 ;
Marrow:Marrow-immature natural killer cell-NA:INK:0.01 ;
Marrow:Marrow-immature NK T cell-NA:INKT :0.01 ;
Marrow:Marrow-immature T cell-NA:IT :0.02 ;
Marrow:Marrow-late pro-B cell-Dntt- late pro-B cell:LPB1 :0.04 ;
Marrow:Marrow-late pro-B cell-Dntt+ late pro-B cell:LPB2 :0.03 ;
Marrow:Marrow-macrophage-NA:MAC:0.03 ;
Marrow:Marrow-mature natural killer cell-NA:MNT:0.01 ;
Marrow:Marrow-megakaryocyte-erythroid progenitor cell-NA:EPC:0.01 ;
Marrow:Marrow-monocyte-NA:MN :0.04 ;
Marrow:Marrow-naive B cell-NA:NBC:0.12 ;
Marrow:Marrow-pre-natural killer cell-NA:PNK:0.00 ;
Marrow:Marrow-precursor B cell-pre-B cell (Philadelphia nomenclature):PB :0.11 ;
Marrow:Marrow-regulatory T cell-NA:RT :0.00 ;
Marrow:Marrow-Slamf1-negative multipotent progenitor cell-NA:MPC1 :0.10 ;
Marrow:Marrow-Slamf1-positive multipotent progenitor cell-NA:MPC2 :0.04 ;
SkMuscle:B cell_Jchain high(Muscle):B3 :0.02 ;
SkMuscle:B cell_Vpreb3 high(Muscle):B4 :0.09 ;
SkMuscle:Dendritic cell(Muscle):DEN:0.01 ;
SkMuscle:Endothelial cell(Muscle):EC :0.02 ;
SkMuscle:Erythroblast_Car1 high(Muscle):ERB1 :0.03 ;
SkMuscle:Erythroblast_Car2 high(Muscle):ERB2 :0.16 ;
SkMuscle:Granulocyte monocyte progenitor cell(Muscle):GMP:0.08 ;
SkMuscle:Macrophage_Ms4a6c high(Muscle):MAC2 :0.13 ;
SkMuscle:Macrophage_Retnla high(Muscle):MAC3 :0.02 ;
SkMuscle:Muscle cell_Tnnc1 high(Muscle):MC1:0.01 ;
SkMuscle:Muscle cell_Tnnc2 high(Muscle):MC2:0.03 ;
SkMuscle:Muscle progenitor cell(Muscle):MPC:0.08 ;
SkMuscle:Neutrophil_Camp high(Muscle):NEUT1 :0.16 ;
SkMuscle:Neutrophil_Prg2 high(Muscle):NEUT2 :0.01 ;
SkMuscle:Neutrophil_Retnlg high(Muscle):NEUT3 :0.12 ;
SkMuscle:Stromal cell(Muscle):SC :0.02 ;
SkMuscle:T cell(Muscle):T:0.01 ;
Pancreas:Pancreas-endothelial cell-NA:EC :0.06 ;
Pancreas:Pancreas-leukocyte-NA:LEU:0.04 ;
Pancreas:Pancreas-pancreatic A cell-pancreatic A cell:A:0.24 ;
Pancreas:Pancreas-pancreatic acinar cell-acinar cell:ACI:0.10 ;
Pancreas:Pancreas-pancreatic D cell-pancreatic D cell:D:0.11 ;
Pancreas:Pancreas-pancreatic ductal cell-ductal cell:DUC:0.12 ;
Pancreas:Pancreas-pancreatic PP cell-pancreatic PP cell:PP :0.05 ;
Pancreas:Pancreas-pancreatic stellate cell-stellate cell:PSC:0.04 ;
Pancreas:Pancreas-type B pancreatic cell-beta cell:BC :0.22 ;
Skin:Skin-basal cell of epidermis-Basal IFE:BE:0.22 ;
Skin:Skin-epidermal cell-Intermediate IFE:EPI :0.12 ;
Skin:Skin-keratinocyte stem cell-Inner Bulge:KSC:0.26 ;
Skin:Skin-keratinocyte stem cell-Outer Bulge:KSC2:0.37 ;
Skin:Skin-leukocyte-NA:LEU:0.01 ;
Skin:Skin-stem cell of epidermis-Replicating Basal IFE:SCE:0.02 ;
Spleen:Spleen-B cell-NA:B:0.77 ;
Spleen:Spleen-macrophage-NA:MAC:0.03 ;
Spleen:Spleen-T cell-NA:T:0.20 ;
Thymus:Thymus-DN1 thymic pro-T cell-DN1 thymocytes:TPT:0.01 ;
Thymus:Thymus-immature T cell-DN4-DP in transition Cd69 negative rapidly dividing thymocytes:IT3:0.15 ;
Thymus:Thymus-immature T cell-DN4-DP in transition Cd69 negative thymocytes:IT2:0.44 ;
Thymus:Thymus-immature T cell-DN4-DP in transition Cd69 positive thymocytes:IT4:0.37 ;
Thymus:Thymus-leukocyte-antigen presenting cell:LEU3:0.02
下記リストは、Organ:Singnature.gene.set.number:Cell.type:mean:var:min:first_quantile:Median:third_quantile:maxの順に並んでいる。「;」は各細胞種のデータの区切りを意図している。
Aorta:100:EC :0.151788089:0.320824524:0.01:0.01:0.01:0.020643025:4.333799883;
Aorta:100:ERC:24.67386955:27569.49096:0.01:0.268057658:0.947630617:4.647035248:1361.854647;
Aorta:100:FC :1.120387302:7.507603394:0.01:0.014564004:0.061908957:0.516121627:12.41886869;
Aorta:100:PAP:0.124841086:0.130858196:0.01:0.01:0.01211706:0.032624313:1.661400716;
Aorta:300:EC :0.335653916:0.888982181:0.01:0.01:0.01:0.10214728:5.784560681;
Aorta:300:ERC:20.7856725:15487.87723:0.01:0.132647672:0.943529224:3.121387266:1008.048707;
Aorta:300:FC :1.122992247:3.637888239:0.01:0.103255397:0.318573613:1.121704441:9.938671176;
Aorta:300:PAP:0.16699144:0.283733571:0.01:0.01:0.014927526:0.085629113:3.587288911;
Aorta:1577:EC :0.328052831:2.980101375:0.01:0.01:0.01:0.01:12.65695793;
Aorta:1577:ERC:0.861381942:10.22004111:0.01:0.01:0.01:0.189752138:24.51986069;
Aorta:1577:FC :1.157779979:11.62919843:0.01:0.01:0.011244537:0.227616723:17.14421124;
Aorta:1577:PAP:0.236296791:0.806728782:0.01:0.01:0.01:0.01:4.644598908;
Brain:100:AS :0.434856565:2.615451954:0.01:0.022455987:0.046046996:0.12257169:18.38001032;
Brain:100:BGC:1.072299836:4.247525505:0.052380374:0.193697173:0.441824763:0.815423538:9.813487019;
Brain:100:BP :1.286448516:7.416001166:0.01:0.149224444:0.442108329:1.349882731:20.55492602;
Brain:100:EC :0.155829289:2.482545762:0.01:0.011392245:0.018610335:0.058316551:33.77084044;
Brain:100:MAC:0.048124031:0.004108694:0.01:0.013496606:0.023131426:0.063089991:0.377400612;
Brain:100:MI :0.012961869:2.3118E-05:0.01:0.010033301:0.011173433:0.013679577:0.064623845;
Brain:100:NEUR1 :2.653825355:114.4922959:0.01:0.014365065:0.065192324:0.488780763:74.1873715;
Brain:100:NEUR2 :1.516349011:26.86180756:0.01:0.017777754:0.088547977:0.515962167:38.7956663;
Brain:100:OLC:1.47033239:789.3444746:0.01:0.043020985:0.137535878:0.575570849:1014.927739;
Brain:100:OPC:1.384613588:14.07919044:0.01:0.012646413:0.040728358:0.702904737:25.50241672;
Brain:300:AS :1.74038249:13.24520375:0.01:0.015261047:0.195577225:1.884738702:41.41426285;
Brain:300:BGC:1.341778577:3.944690072:0.045824361:0.224444365:0.549709956:1.458466949:8.815660456;
Brain:300:BP :1.749492174:12.04296246:0.01:0.014499893:0.199956059:1.774169825:17.37539007;
Brain:300:EC :0.205803506:0.364383999:0.01:0.01:0.010304075:0.054289482:7.530690763;
Brain:300:MAC:0.010347881:4.91595E-06:0.01:0.01:0.01:0.01:0.024372891;
Brain:300:MI :0.010016051:1.25293E-07:0.01:0.01:0.01:0.01:0.02439228;
Brain:300:NEUR1 :0.091026428:0.378856142:0.01:0.01:0.01:0.01:5.354404503;
Brain:300:NEUR2 :1.881598235:117.9200715:0.01:0.01:0.01:0.010376092:122.6759504;
Brain:300:OLC:0.683957014:4.665791152:0.01:0.01:0.031833092:0.255883967:30.43686688;
Brain:300:OPC:0.371699481:4.009370499:0.01:0.01:0.01:0.022522107:22.58268291;
Brain:2000:AS :1.591406611:8.974491561:0.01:0.01:0.070425016:1.748463704:15.85464919;
Brain:2000:BGC:1.125268038:5.864155062:0.01:0.01:0.013973665:0.729619368:9.858942038;
Brain:2000:BP :0.010231754:6.39702E-06:0.01:0.01:0.01:0.01:0.03860368;
Brain:2000:EC :0.046223928:0.054173766:0.01:0.01:0.01:0.01:2.487765951;
Brain:2000:MAC:0.010208662:4.75753E-07:0.01:0.01:0.01:0.01:0.013557299;
Brain:2000:MI :0.01008294:2.25461E-06:0.01:0.01:0.01:0.01:0.062541367;
Brain:2000:NEUR1 :0.044018483:0.043085508:0.01:0.01:0.01:0.01:1.347998842;
Brain:2000:NEUR2 :1.008760807:29.81632686:0.01:0.01:0.01:0.01:51.96076429;
Brain:2000:OLC:0.55101755:2.370980823:0.01:0.01:0.01:0.153605575:17.776641;
Brain:2000:OPC:0.014554191:0.001657313:0.01:0.01:0.01:0.01:0.498116609;
Fat:100:B:0.046754003:0.011173744:0.01:0.010216413:0.015136787:0.037396414:1.302102477;
Fat:100:EC :2.414604433:19.41475516:0.01:0.010548113:0.280908337:2.789098145:41.78589451;
Fat:100:MSA:0.320323969:1.112225282:0.01:0.01:0.01:0.04529986:10.49111527;
Fat:100:MYE:0.071228559:0.045200484:0.01:0.01:0.014329697:0.043635857:3.146909307;
Fat:100:NA :2.710777335:28.70862922:0.01:0.01:0.285071051:3.167316468:27.15404948;
Fat:100:NK :0.318498521:0.146633229:0.013489934:0.060943058:0.201014136:0.368195143:1.823855366;
Fat:100:T:0.45552476:2.077988331:0.01:0.01:0.029935117:0.292900664:16.31685769;
Fat:300:B:0.085593432:0.063367131:0.01:0.01:0.01:0.010472349:1.660266129;
Fat:300:EC :1.951699824:32.94181255:0.01:0.01:0.01:0.449707234:46.60358358;
Fat:300:MSA:0.301040647:2.273597383:0.01:0.01:0.01:0.01:20.45002588;
Fat:300:MYE:0.145061513:0.432465824:0.01:0.01:0.01:0.011508338:8.06361426;
Fat:300:NA :0.097562096:0.200890568:0.01:0.01:0.01:0.01:2.807266835;
Fat:300:NK :0.01:8.01339E-29:0.01:0.01:0.01:0.01:0.01;
Fat:300:T:0.010988287:0.000224172:0.01:0.01:0.01:0.01:0.237562315;
Fat:2000:B:0.267000961:1.17913974:0.01:0.01:0.01:0.012349464:10.30491319;
Fat:2000:EC :1.52498714:15.89721155:0.01:0.01:0.01:0.367139836:29.44172018;
Fat:2000:MSA:0.352538559:3.267249585:0.01:0.01:0.01:0.01:26.45242703;
Fat:2000:MYE:0.154984661:0.568213675:0.01:0.01:0.01:0.010339534:12.65610984;
Fat:2000:NA :0.038760219:0.01129055:0.01:0.01:0.01:0.01:0.520072065;
Fat:2000:NK :0.011812948:8.05709E-05:0.01:0.01:0.01:0.01:0.062738677;
Fat:2000:T:0.050755542:0.090293712:0.01:0.01:0.01:0.01:4.357269635;
Heart:100:CC :0.01:4.19568E-32:0.01:0.01:0.01:0.01:0.01;
Heart:100:CM :2.823889258:54.45296231:0.01:0.01:0.077634074:0.644519204:37.63426786;
Heart:100:EC :0.383886505:8.95708179:0.01:0.01:0.0145107:0.127136156:60.17501651;
Heart:100:ECC:0.142329405:0.121205364:0.01:0.012507964:0.028868296:0.164640401:2.344871042;
Heart:100:FC :0.089502111:0.035613316:0.01:0.01:0.013279019:0.057356411:1.287831061;
Heart:100:LEU:0.049459847:0.008453581:0.01:0.011171809:0.016984044:0.053998062:1.156060563;
Heart:100:MYF:0.197874897:0.106739298:0.01:0.01282829:0.041756576:0.227034214:1.680778788;
Heart:100:SM :1.348022055:1.282516297:0.297989562:0.449770835:0.871973921:1.854237253:4.078581375;
Heart:300:CC :0.01:2.41086E-32:0.01:0.01:0.01:0.01:0.01;
Heart:300:CM :1.706492592:22.04625552:0.01:0.01:0.014028892:0.385791139:22.6212958;
Heart:300:EC :0.308624254:0.996382718:0.01:0.01:0.01441405:0.228046496:14.13284018;
Heart:300:ECC:0.075306832:0.026880368:0.01:0.01:0.018232343:0.066596459:1.01598398;
Heart:300:FC :0.080447546:0.034630326:0.01:0.01:0.012546049:0.04781712:1.673015079;
Heart:300:LEU:0.024387404:0.006626406:0.01:0.01:0.011895671:0.021707587:1.457680288;
Heart:300:MYF:0.292706873:0.433907162:0.01:0.011944381:0.075827223:0.295975505:6.11236449;
Heart:300:SM :0.123010953:0.023413091:0.01:0.01:0.056597312:0.185566209:0.509664676;
Heart:2000:CC :0.010313811:7.39796E-07:0.01:0.01:0.01:0.01:0.01312443;
Heart:2000:CM :3.112064232:77.80962808:0.01:0.01:0.01:0.390638194:51.1228028;
Heart:2000:EC :0.13368653:0.143577296:0.01:0.01:0.01:0.040965266:2.829282942;
Heart:2000:ECC:0.310990008:4.392293003:0.01:0.01:0.01:0.01:14.68197108;
Heart:2000:FC :0.053694616:0.018926396:0.01:0.01:0.01:0.02231088:1.648764347;
Heart:2000:LEU:0.039521164:0.287158212:0.01:0.01:0.01:0.01:9.759389068;
Heart:2000:MYF:0.017612063:0.002417966:0.01:0.01:0.01:0.01:0.422266391;
Heart:2000:SM :0.077480204:0.044825118:0.01:0.01:0.01:0.01:0.817152076;
Kidney:100:CD :0.861873721:5.325131329:0.01:0.01:0.027677075:0.429648536:15.29691009;
Kidney:100:EC :0.087685384:0.053268255:0.01:0.01:0.010467171:0.079612624:1.530825402;
Kidney:100:LEU:0.019678869:0.000210734:0.01:0.01:0.01:0.029438172:0.048074249;
Kidney:100:MAC:0.014345637:0.00027765:0.01:0.01:0.01:0.01:0.096159876;
Kidney:100:PT :1.066404822:6.559136387:0.01:0.01:0.042416515:0.656508148:14.31773311;
Kidney:300:CD :1.02990839:31.96503195:0.01:0.01:0.01:0.01:46.00176013;
Kidney:300:EC :0.148567471:0.401009826:0.01:0.01:0.01:0.01:3.505286789;
Kidney:300:LEU:0.01:3.0112E-29:0.01:0.01:0.01:0.01:0.01;
Kidney:300:MAC:0.010736962:1.52072E-05:0.01:0.01:0.01:0.01:0.030634931;
Kidney:300:PT :1.078855015:17.30970861:0.01:0.01:0.01:0.01:34.86889454;
Kidney:1461:CD :0.571606592:3.043433891:0.01:0.01:0.01:0.082063639:10.68411549;
Kidney:1461:EC :0.262442826:0.506765362:0.01:0.01:0.01:0.040553741:4.187360011;
Kidney:1461:LEU:0.448563929:1.140902526:0.01:0.01:0.025451239:0.131769898:3.072526545;
Kidney:1461:MAC:0.015812234:0.000494913:0.01:0.01:0.01:0.01:0.126188915;
Kidney:1461:PT :1.009683719:9.1880931:0.01:0.01:0.010200921:0.349203618:18.39498163;
Large Intestine:100:CHR:0.012506713:9.45398E-05:0.01:0.01:0.01:0.01:0.059484444;
Large Intestine:100:EN-D :0.02890134:0.011490302:0.01:0.01:0.01:0.01:0.914454533;
Large Intestine:100:EN-P :0.245917773:0.409541469:0.01:0.01:0.01:0.099277919:5.442989504;
Large Intestine:100:EP1:0.010344637:3.46044E-05:0.01:0.01:0.01:0.01:0.113368671;
Large Intestine:100:EP2:0.108748193:1.93259855:0.01:0.01:0.01:0.01:19.76858819;
Large Intestine:100:EP3-D:0.589057488:2.322023876:0.01:0.01:0.036088665:0.212778459:7.753674897;
Large Intestine:100:EP3-P:1.359012809:13.83295307:0.01:0.01:0.038106769:0.79029694:30.18008581;
Large Intestine:100:EP4-D:1.334742196:8.776057103:0.01:0.01:0.051754177:0.765595964:15.7202124;
Large Intestine:100:EP4-P:1.936669446:21.3101594:0.01:0.01:0.048946915:0.996926491:29.43809417;
Large Intestine:100:GB1-D:0.567448195:1.714325103:0.01:0.01:0.040470534:0.529872099:10.85628586;
Large Intestine:100:GB1-P:0.206993092:0.398629305:0.01:0.01:0.01:0.035904714:4.782087384;
Large Intestine:100:GB2-D:0.020528901:0.001429011:0.01:0.01:0.01:0.01:0.171902125;
Large Intestine:100:TUF:0.01:4.6781E-30:0.01:0.01:0.01:0.01:0.01;
Large Intestine:300:CHR:0.01:8.55585E-28:0.01:0.01:0.01:0.01:0.01;
Large Intestine:300:EN-D :0.028139446:0.0207549:0.01:0.01:0.01:0.01:1.423039804;
Large Intestine:300:EN-P :0.225660499:0.725122737:0.01:0.01:0.01:0.01:9.328144914;
Large Intestine:300:EP1:0.124803964:1.666430783:0.01:0.01:0.01:0.01:21.98275274;
Large Intestine:300:EP2:0.136387448:1.286467877:0.01:0.01:0.01:0.01:12.06235413;
Large Intestine:300:EP3-D:0.100450079:0.080406616:0.01:0.01:0.01:0.031250293:1.703547206;
Large Intestine:300:EP3-P:2.013779797:104.0491511:0.01:0.01:0.01:0.010203473:93.19098724;
Large Intestine:300:EP4-D:0.618244402:4.172513336:0.01:0.01:0.01:0.069821296:14.62455624;
Large Intestine:300:EP4-P:2.216779474:81.90841528:0.01:0.01:0.01:0.089417422:72.73878781;
Large Intestine:300:GB1-D:0.625078047:4.444453549:0.01:0.01:0.01:0.143932698:20.8490123;
Large Intestine:300:GB1-P:0.136413664:0.845071847:0.01:0.01:0.01:0.01:9.557555803;
Large Intestine:300:GB2-D:0.584599971:1.070237117:0.01:0.01:0.089996554:0.651617884:4.481089012;
Large Intestine:300:TUF:0.01:3.04504E-29:0.01:0.01:0.01:0.01:0.01;
Large Intestine:2000:CHR:0.015394585:0.000704757:0.01:0.01:0.01:0.01:0.153127464;
Large Intestine:2000:EN-D :0.058661679:0.087600473:0.01:0.01:0.01:0.01:2.68276365;
Large Intestine:2000:EN-P :0.186182828:0.342939218:0.01:0.01:0.01:0.018775138:4.579226957;
Large Intestine:2000:EP1:0.242031163:1.52035394:0.01:0.01:0.01:0.01:13.54761958;
Large Intestine:2000:EP2:0.137616207:0.684872242:0.01:0.01:0.01:0.01:7.342157204;
Large Intestine:2000:EP3-D:0.248573596:1.254007981:0.01:0.01:0.01:0.043345374:8.244720325;
Large Intestine:2000:EP3-P:1.160239961:8.681215788:0.01:0.01:0.01:0.196549515:14.92215724;
Large Intestine:2000:EP4-D:1.024156717:12.94504348:0.01:0.01:0.01:0.153132844:28.16052677;
Large Intestine:2000:EP4-P:1.870495516:32.95764143:0.01:0.01:0.01:0.241904836:37.58578581;
Large Intestine:2000:GB1-D:0.703346962:4.343873838:0.01:0.01:0.017259145:0.246563149:15.28585118;
Large Intestine:2000:GB1-P:0.267045238:3.849090953:0.01:0.01:0.01:0.01:20.24231902;
Large Intestine:2000:GB2-D:0.602863068:0.645603881:0.01:0.02646894:0.232151648:0.877725989:3.034948802;
Large Intestine:2000:TUF:0.01:6.86261E-32:0.01:0.01:0.01:0.01:0.01;
Liver:100:B:0.213797267:0.325687856:0.01:0.01:0.01:0.056571357:2.613370426;
Liver:100:EC :0.037007003:0.043483818:0.01:0.01:0.01:0.01:2.711247341;
Liver:100:HE :1.577528039:35.04314183:0.01:0.01:0.01:0.183535291:43.73524356;
Liver:100:KUP:0.509042737:6.621034858:0.01:0.01:0.01:0.012229472:18.82181524;
Liver:100:NK2:0.539076723:10.69009305:0.01:0.01:0.01:0.01:20.43361731;
Liver:300:B:0.011314986:7.08967E-05:0.01:0.01:0.01:0.01:0.063914422;
Liver:300:EC :0.113993526:0.733401923:0.01:0.01:0.01:0.01:10.81729271;
Liver:300:HE :1.561492365:98.12025078:0.01:0.01:0.01:0.01:105.9140195;
Liver:300:KUP:0.260603997:2.328280291:0.01:0.01:0.01:0.01:11.82954434;
Liver:300:NK2:0.125984933:0.524647684:0.01:0.01:0.01:0.01:4.533412393;
Liver:2000:B:0.046524022:0.014063618:0.01:0.01:0.01:0.01:0.629735622;
Liver:2000:EC :0.155958403:0.528364338:0.01:0.01:0.01:0.01:8.591024824;
Liver:2000:HE :1.498511944:62.89746473:0.01:0.01:0.01:0.01:83.09827976;
Liver:2000:KUP:0.255600958:1.055424386:0.01:0.01:0.01:0.04115651:7.789532314;
Liver:2000:NK2:0.367333689:2.537527345:0.01:0.01:0.01:0.01:9.737383429;
Lung:100:B:0.01857141:0.001028567:0.01:0.01:0.01:0.01:0.129999746;
Lung:100:CCC:1.456821314:8.825647444:0.01:0.01:0.01:1.547008977:9.746616082;
Lung:100:CMN:0.028888155:0.013039084:0.01:0.01:0.01:0.010769856:0.835026957;
Lung:100:EC :0.592266493:3.130564936:0.01:0.01:0.01:0.14637682:17.3946568;
Lung:100:EP5:2.184258795:31.36444499:0.01:0.142788:0.468145799:1.199237162:33.16037781;
Lung:100:LEU2 :0.01:2.14937E-25:0.01:0.01:0.01:0.01:0.01;
Lung:100:MN2:0.015465605:0.000828191:0.01:0.01:0.01:0.01:0.194112768;
Lung:100:MYE2 :0.01115847:5.79673E-06:0.01:0.01:0.01:0.010703344:0.016013027;
Lung:100:NC :5.849657994:83.74798893:0.01:0.01:0.391509729:8.663540696:29.4471241;
Lung:100:NK :0.01:6.00811E-27:0.01:0.01:0.01:0.01:0.01;
Lung:100:SC :0.596743132:2.135538046:0.01:0.01:0.025279551:0.325975557:10.78671528;
Lung:100:T:0.01:5.256E-27:0.01:0.01:0.01:0.01:0.01;
Lung:300:B:0.044904601:0.017056636:0.01:0.01:0.01:0.01:0.498664407;
Lung:300:CCC:1.891546254:5.51406788:0.01:0.056520696:0.298394181:3.445486709:6.056462974;
Lung:300:CMN:0.01072913:1.36084E-05:0.01:0.01:0.01:0.01:0.032120838;
Lung:300:EC :0.716551065:10.93183795:0.01:0.01:0.01:0.025238049:41.15891979;
Lung:300:EP5:2.367899563:40.49001777:0.01:0.01:0.075846939:1.72436971:34.37901999;
Lung:300:LEU2 :0.01:3.0477E-29:0.01:0.01:0.01:0.01:0.01;
Lung:300:MN2:0.011887933:9.99892E-05:0.01:0.01:0.01:0.01:0.080417127;
Lung:300:MYE2 :0.01:4.19293E-28:0.01:0.01:0.01:0.01:0.01;
Lung:300:NC :3.512526692:52.14415724:0.01:0.01:0.166310027:3.261063433:26.50611444;
Lung:300:NK :0.01:8.33236E-28:0.01:0.01:0.01:0.01:0.01;
Lung:300:SC :0.453653037:1.848672295:0.01:0.01:0.01:0.044123625:8.947055684;
Lung:300:T:0.011154861:3.06752E-05:0.01:0.01:0.01:0.01:0.036561792;
Lung:2000:B:0.257379098:0.134236035:0.01:0.011041603:0.089877832:0.287607349:1.094854368;
Lung:2000:CCC:3.063528155:12.0082984:0.01:0.061665312:1.300096759:5.627807116:9.698705171;
Lung:2000:CMN:0.019441605:0.000835036:0.01:0.01:0.01:0.011049543:0.185526719;
Lung:2000:EC :0.690009542:4.988718328:0.01:0.01:0.01:0.165162893:19.51617638;
Lung:2000:EP5:1.706230301:7.732375989:0.01:0.065375787:0.461915327:1.751011363:10.1566163;
Lung:2000:LEU2 :0.010031388:1.37926E-08:0.01:0.01:0.01:0.01:0.010439427;
Lung:2000:MN2:0.010778167:1.48816E-05:0.01:0.01:0.01:0.01:0.033806873;
Lung:2000:MYE2 :0.154800639:0.063766588:0.01:0.014829632:0.056271633:0.122672891:0.660438295;
Lung:2000:NC :2.838071299:26.0408083:0.01:0.01:0.011684946:2.709452458:15.53664066;
Lung:2000:NK :0.011379011:1.8491E-05:0.01:0.01:0.01:0.01:0.026888432;
Lung:2000:SC :0.325228195:1.505962612:0.01:0.01:0.01:0.040614985:13.08108162;
Lung:2000:T:0.435842093:0.882885258:0.01:0.01:0.037300932:0.313265777:4.183441938;
Marrow:100:B2 :0.185902275:0.434241737:0.01:0.01:0.01:0.01:2.712418872;
Marrow:100:BAS:0.014519176:0.000265498:0.01:0.01:0.01:0.01:0.068749284;
Marrow:100:CLP:2.420824383:24.86621029:0.01:0.01:0.214101778:2.430900549:26.01299376;
Marrow:100:EPC:1.904845804:16.12612784:0.01:0.01:0.210311004:1.707937823:19.04839729;
Marrow:100:GC :1.621135952:4.828924043:0.01:0.117158592:0.707247043:2.393001514:11.24602065;
Marrow:100:GMP:0.181084318:0.236147535:0.01:0.01:0.016960511:0.092667507:3.474723251;
Marrow:100:GRA:0.374090145:0.702833462:0.01:0.012786779:0.047776796:0.259564272:7.914217848;
Marrow:100:HPC:1.13030154:12.97866174:0.01:0.01:0.01:0.195455929:27.27162771;
Marrow:100:IB :0.31131546:5.521495558:0.01:0.01:0.01:0.01:32.72827775;
Marrow:100:INK:0.01:3.00023E-30:0.01:0.01:0.01:0.01:0.01;
Marrow:100:INKT :0.047342165:0.025679816:0.01:0.01:0.01:0.01:0.709047616;
Marrow:100:IT :0.053571303:0.039218934:0.01:0.01:0.01:0.01:1.336584538;
Marrow:100:LPB1 :1.608961936:8.767079358:0.01:0.01:0.177612782:1.660130475:16.04030105;
Marrow:100:LPB2 :2.376398871:16.3857241:0.01:0.01:0.239978477:2.936407898:16.65895823;
Marrow:100:MAC:0.0259025:0.006520404:0.01:0.01:0.01:0.01:0.564218133;
Marrow:100:MN :0.038996541:0.026703762:0.01:0.01:0.01091448:0.019318394:1.81463237;
Marrow:100:MNT:0.056297223:0.082362769:0.01:0.01:0.01:0.01:1.825894631;
Marrow:100:MPC1 :0.367024786:1.315133774:0.01:0.01:0.01:0.090052996:9.312120992;
Marrow:100:MPC2 :0.175320535:0.418543065:0.01:0.01:0.01:0.023679329:5.238568571;
Marrow:100:NBC:0.095766964:0.126490199:0.01:0.01:0.01:0.036544526:5.940112975;
Marrow:100:PB :0.010675228:0.000122283:0.01:0.01:0.01:0.01:0.218063081;
Marrow:100:PNK:2.482467108:17.15464909:0.01:0.022599142:0.036680956:3.944061666:14.74284385;
Marrow:100:RT :0.012112594:6.19298E-05:0.01:0.01:0.01:0.01:0.040539169;
Marrow:300:B2 :0.072463781:0.080445354:0.01:0.01:0.01:0.01:1.517781713;
Marrow:300:BAS:0.518609643:3.362888996:0.01:0.01:0.01:0.01:6.621925359;
Marrow:300:CLP:1.284579894:25.89444494:0.01:0.01:0.01:0.047828455:31.57063454;
Marrow:300:EPC:0.975661564:17.3377232:0.01:0.01:0.01:0.017342857:20.88881381;
Marrow:300:GC :0.95647576:6.392217988:0.01:0.01:0.021089981:0.538024117:20.6035697;
Marrow:300:GMP:1.437037515:20.63563736:0.01:0.01:0.01:0.149559748:24.18271454;
Marrow:300:GRA:0.626599281:4.597668957:0.01:0.01:0.01:0.147438321:23.3880025;
Marrow:300:HPC:1.304453698:29.11832644:0.01:0.01:0.01:0.031238635:46.69346883;
Marrow:300:IB :0.581646271:13.28705952:0.01:0.01:0.01:0.01:40.52106243;
Marrow:300:INK:0.010677684:7.80735E-06:0.01:0.01:0.01:0.01:0.021520634;
Marrow:300:INKT :0.011091919:2.26534E-05:0.01:0.01:0.01:0.01:0.030746458;
Marrow:300:IT :0.187626221:0.516269114:0.01:0.01:0.01:0.01:4.414912871;
Marrow:300:LPB1 :2.327177218:39.45478944:0.01:0.01:0.01:0.669150502:47.664881;
Marrow:300:LPB2 :3.027541169:44.75653921:0.01:0.01:0.028413594:1.591414395:32.7034205;
Marrow:300:MAC:0.533265095:3.571316901:0.01:0.01:0.01:0.038816232:13.60439309;
Marrow:300:MN :0.113166634:1.302606568:0.01:0.01:0.01:0.01:14.07338651;
Marrow:300:MNT:0.187233959:0.61635283:0.01:0.01:0.01:0.01:4.786642481;
Marrow:300:MPC1 :0.201187132:1.513216898:0.01:0.01:0.01:0.01:14.12861891;
Marrow:300:MPC2 :0.049832787:0.104629922:0.01:0.01:0.01:0.01:3.562672271;
Marrow:300:NBC:0.186056236:4.138595569:0.01:0.01:0.01:0.01:37.74765959;
Marrow:300:PB :0.011186099:0.00027564:0.01:0.01:0.01:0.01:0.317098022;
Marrow:300:PNK:2.032067255:22.65497581:0.01:0.01:0.063921568:1.501403207:18.24728518;
Marrow:300:RT :0.01:1.13792E-28:0.01:0.01:0.01:0.01:0.01;
Marrow:2000:B2 :0.167172108:0.259600952:0.01:0.01:0.01:0.01:2.487743147;
Marrow:2000:BAS:2.130613564:8.466073636:0.01:0.056819654:0.825334925:3.54974934:9.299718758;
Marrow:2000:CLP:1.098629192:10.50141526:0.01:0.01:0.01:0.265548246:28.26777702;
Marrow:2000:EPC:0.420817747:2.493197877:0.01:0.01:0.01:0.093986726:10.33754185;
Marrow:2000:GC :0.969074716:3.773959377:0.01:0.01:0.069629699:1.107661712:13.42674231;
Marrow:2000:GMP:1.71162988:8.833804552:0.01:0.051021256:0.494409338:1.397984403:12.66009452;
Marrow:2000:GRA:0.675219767:3.340806905:0.01:0.01:0.014277322:0.347261219:14.96173219;
Marrow:2000:HPC:0.894207305:5.34592313:0.01:0.01:0.01:0.400270601:20.58178485;
Marrow:2000:IB :0.369499113:2.05090549:0.01:0.01:0.01:0.010907813:14.24513112;
Marrow:2000:INK:0.056216304:0.027923716:0.01:0.01:0.01:0.01:0.699996817;
Marrow:2000:INKT :0.111411572:0.167818618:0.01:0.01:0.01:0.01:1.797976351;
Marrow:2000:IT :0.11687255:0.091009648:0.01:0.01:0.01:0.01347243:1.739893257;
Marrow:2000:LPB1 :1.893858092:16.46027996:0.01:0.01:0.050292558:1.496103716:27.37277965;
Marrow:2000:LPB2 :3.302615802:36.83218789:0.01:0.01:0.210685719:3.784145256:27.26089787;
Marrow:2000:MAC:0.423312503:0.893001499:0.01:0.01:0.01:0.220012709:4.183752057;
Marrow:2000:MN :0.263946748:2.930026775:0.01:0.01:0.01:0.015794453:16.7846469;
Marrow:2000:MNT:0.181549588:0.183314907:0.01:0.01:0.01:0.029673303:1.778545776;
Marrow:2000:MPC1 :0.362290945:1.790559251:0.01:0.01:0.01:0.035890566:14.05147694;
Marrow:2000:MPC2 :0.147777286:0.464731193:0.01:0.01:0.01:0.01:6.22391615;
Marrow:2000:NBC:0.137362883:0.348696493:0.01:0.01:0.01:0.01:7.142698962;
Marrow:2000:PB :0.058905676:0.294446787:0.01:0.01:0.01:0.01:9.928819957;
Marrow:2000:PNK:1.833011369:8.638914818:0.01:0.011389807:0.226801309:2.007042567:9.85192995;
Marrow:2000:RT :0.010730026:7.99407E-06:0.01:0.01:0.01:0.01:0.02095039;
Pancreas:100:A:0.01:2.95436E-27:0.01:0.01:0.01:0.01:0.01;
Pancreas:100:ACI:11.89919455:1239.078518:0.01:0.027755043:1.992745424:10.39200207:299.3981303;
Pancreas:100:BC :0.014382556:0.001847759:0.01:0.01:0.01:0.01:0.531578068;
Pancreas:100:D:0.01:3.72485E-28:0.01:0.01:0.01:0.01:0.01;
Pancreas:100:DUC:0.085962055:0.033775105:0.01:0.01:0.012791323:0.057646561:1.321106184;
Pancreas:100:EC :9.397344192:1396.05103:0.01:0.01:0.188111294:0.979741716:253.3114757;
Pancreas:100:LEU:0.961108391:10.44635577:0.01:0.014391258:0.041267131:0.085491737:15.68452118;
Pancreas:100:PP :0.025692694:0.002933414:0.01:0.01:0.01:0.011266917:0.308624983;
Pancreas:100:PSC:2.221217553:63.14401388:0.01:0.01:0.054436934:0.626533357:46.16280282;
Pancreas:300:A:0.015787667:0.006866904:0.01:0.01:0.01:0.01:1.19647179;
Pancreas:300:ACI:13.64002226:1753.848566:0.01:0.01:0.01:2.740798527:312.48915;
Pancreas:300:BC :0.023946869:0.035699395:0.01:0.01:0.01:0.01:2.607600067;
Pancreas:300:D:0.01:1.69592E-25:0.01:0.01:0.01:0.01:0.01;
Pancreas:300:DUC:0.14580081:0.480585724:0.01:0.01:0.01:0.01:6.811039251;
Pancreas:300:EC :1.476887113:58.74553799:0.01:0.01:0.01:0.01:53.07849045;
Pancreas:300:LEU:2.617639833:230.4585141:0.01:0.01:0.01:0.01:93.58914858;
Pancreas:300:PP :0.01:3.8384E-25:0.01:0.01:0.01:0.01:0.01;
Pancreas:300:PSC:0.158792338:0.445999812:0.01:0.01:0.01:0.01:4.047027631;
Pancreas:2000:A:0.013012481:0.001619796:0.01:0.01:0.01:0.01:0.584870878;
Pancreas:2000:ACI:10.86705529:601.7602352:0.01:0.01:0.815365852:8.845002453:155.7998631;
Pancreas:2000:BC :0.012869098:0.000777185:0.01:0.01:0.01:0.01:0.381544425;
Pancreas:2000:D:0.010021663:1.6756E-08:0.01:0.01:0.01:0.01:0.01106179;
Pancreas:2000:DUC:0.206309149:0.698594703:0.01:0.01:0.01:0.020448076:6.846125984;
Pancreas:2000:EC :0.624484527:6.177609328:0.01:0.01:0.01:0.022861064:16.26364263;
Pancreas:2000:LEU:0.224386478:1.390589728:0.01:0.01:0.01:0.016633662:7.289777506;
Pancreas:2000:PP :0.01169833:5.85563E-05:0.01:0.01:0.01:0.01:0.049072198;
Pancreas:2000:PSC:0.22808577:0.454643165:0.01:0.01:0.01:0.024362231:2.982198696;
Skin:100:BE:0.088525095:0.433917818:0.01:0.01:0.01:0.01:9.105400656;
Skin:100:EPI :1.497255989:8.07664797:0.01:0.023857561:0.156802628:1.353358422:15.12733217;
Skin:100:KSC:0.025219498:0.016150493:0.01:0.01:0.01:0.01:1.945234359;
Skin:100:KSC2:0.317196037:3.681240333:0.01:0.01:0.01:0.03712216:40.56973381;
Skin:100:LEU:6.537198302:190.7648029:0.01:0.01:0.076820057:6.008499214:46.96736574;
Skin:100:SCE:0.098152807:0.13388837:0.01:0.01:0.01:0.036533711:2.313070393;
Skin:300:BE:0.108357985:1.13393988:0.01:0.01:0.01:0.01:18.55862333;
Skin:300:EPI :1.305163535:21.44147441:0.01:0.01:0.01:0.098746599:36.14180497;
Skin:300:KSC:0.019268223:0.015211094:0.01:0.01:0.01:0.01:2.485425355;
Skin:300:KSC2:0.419843734:9.493485969:0.01:0.01:0.01:0.01:63.04223322;
Skin:300:LEU:7.856353791:227.1964209:0.01:0.01:0.01:10.01127642:50.34195125;
Skin:300:SCE:0.041529126:0.025377722:0.01:0.01:0.01:0.01:1.015417564;
Skin:2000:BE:0.054235631:0.107612828:0.01:0.01:0.01:0.01:4.894140689;
Skin:2000:EPI :1.463389585:13.46542866:0.01:0.01:0.041508019:0.580429537:24.10158418;
Skin:2000:KSC:0.057082183:0.283160697:0.01:0.01:0.01:0.01:8.947880368;
Skin:2000:KSC2:0.358296776:2.180414803:0.01:0.01:0.01:0.01:17.56111049;
Skin:2000:LEU:3.062859377:42.92355399:0.01:0.01:0.039353867:2.372801805:22.81755758;
Skin:2000:SCE:0.418997541:4.3441421:0.01:0.01:0.01:0.01:13.10047803;
SkMuscle:100:B3 :0.576226174:6.536569269:0.01:0.01:0.01:0.010556533:12.0156782;
SkMuscle:100:B4 :0.126395942:0.228262628:0.01:0.01:0.01:0.01:3.576026664;
SkMuscle:100:DEN:0.01:7.18298E-31:0.01:0.01:0.01:0.01:0.01;
SkMuscle:100:EC :0.675764223:2.800705161:0.01:0.01:0.030371209:0.285263553:7.310227407;
SkMuscle:100:ERB1 :0.01:4.75706E-24:0.01:0.01:0.01:0.01:0.01;
SkMuscle:100:ERB2 :0.010000162:4.76075E-12:0.01:0.01:0.01:0.01:0.010029355;
SkMuscle:100:GMP:0.087430963:0.486566491:0.01:0.01:0.01:0.01:6.365643955;
SkMuscle:100:MAC2 :0.029195195:0.03837845:0.01:0.01:0.01:0.01:2.308267274;
SkMuscle:100:MAC3 :0.013829597:0.000133662:0.01:0.01:0.01:0.01:0.06064265;
SkMuscle:100:MC1:28.93245718:212.9191713:0.101008:28.7416311:35.43885636:36.5236684:44.08999214;
SkMuscle:100:MC2:15.04398917:182.2259111:0.01:5.74097169:11.36666489:21.01674324:54.58031214;
SkMuscle:100:MPC:0.02286293:0.004120317:0.01:0.01:0.01:0.01:0.523549078;
SkMuscle:100:NEUT1 :0.010017958:4.95878E-08:0.01:0.01:0.01:0.01:0.012908385;
SkMuscle:100:NEUT2 :0.011664165:9.56584E-06:0.01:0.01:0.01:0.011539886:0.017153774;
SkMuscle:100:NEUT3 :0.018413406:0.009697599:0.01:0.01:0.01:0.01:1.162636555;
SkMuscle:100:SC :0.087895601:0.009532824:0.01:0.01:0.05575928:0.105801958:0.345386647;
SkMuscle:100:T:0.109161343:0.059970569:0.01:0.01:0.01:0.028898199:0.752215042;
SkMuscle:300:B3 :0.010361993:2.88286E-06:0.01:0.01:0.01:0.01:0.017963856;
SkMuscle:300:B4 :0.029963223:0.03376483:0.01:0.01:0.01:0.01:1.858624152;
SkMuscle:300:DEN:0.16913301:0.253233149:0.01:0.01:0.01:0.01:1.601330102;
SkMuscle:300:EC :0.895315862:11.40577034:0.01:0.01:0.01:0.01:16.86925061;
SkMuscle:300:ERB1 :0.01:9.0575E-24:0.01:0.01:0.01:0.01:0.01;
SkMuscle:300:ERB2 :0.010088532:1.41868E-06:0.01:0.01:0.01:0.01:0.026024377;
SkMuscle:300:GMP:0.037725117:0.063800617:0.01:0.01:0.01:0.01:2.311184743;
SkMuscle:300:MAC2 :0.014416578:0.002691851:0.01:0.01:0.01:0.01:0.619487802;
SkMuscle:300:MAC3 :0.010123343:3.80338E-07:0.01:0.01:0.01:0.01:0.013083577;
SkMuscle:300:MC1:7.592685729:87.58666453:0.01:1.765507418:4.031314363:10.95550861:30.46760561;
SkMuscle:300:MC2:15.5601171:833.7239616:0.01:0.01:1.157277635:12.19090123:106.3308553;
SkMuscle:300:MPC:0.030102624:0.035158047:0.01:0.01:0.01:0.01:1.75892828;
SkMuscle:300:NEUT1 :0.01:5.49289E-23:0.01:0.01:0.01:0.01:0.01;
SkMuscle:300:NEUT2 :0.032082425:0.003901068:0.01:0.01:0.01:0.01:0.186659401;
SkMuscle:300:NEUT3 :0.01087057:0.000103831:0.01:0.01:0.01:0.01:0.129268097;
SkMuscle:300:SC :0.033081414:0.009127034:0.01:0.01:0.01:0.01:0.465886089;
SkMuscle:300:T:0.010433177:1.68878E-06:0.01:0.01:0.01:0.01:0.013898597;
SkMuscle:2000:B3 :2.27902329:55.61744578:0.01:0.01:0.01:0.01:29.79690193;
SkMuscle:2000:B4 :0.081475145:0.454831686:0.01:0.01:0.01:0.01:6.820171116;
SkMuscle:2000:DEN:0.023446865:0.001476213:0.01:0.01:0.01:0.01:0.132248841;
SkMuscle:2000:EC :1.148049772:26.0796183:0.01:0.01:0.01:0.01:26.51870209;
SkMuscle:2000:ERB1 :0.01:2.62163E-29:0.01:0.01:0.01:0.01:0.01;
SkMuscle:2000:ERB2 :0.012219673:0.000496529:0.01:0.01:0.01:0.01:0.28302578;
SkMuscle:2000:GMP:0.010542119:2.43931E-05:0.01:0.01:0.01:0.01:0.054995847;
SkMuscle:2000:MAC2 :0.09516298:0.982113219:0.01:0.01:0.01:0.01:11.65243136;
SkMuscle:2000:MAC3 :0.01:2.2775E-30:0.01:0.01:0.01:0.01:0.01;
SkMuscle:2000:MC1:7.164084475:71.86606507:0.01:0.787027995:4.186646381:11.04237596:27.32437377;
SkMuscle:2000:MC2:14.32686526:568.351699:0.01:0.156707198:2.07884161:13.74566834:82.41595513;
SkMuscle:2000:MPC:0.274615674:3.129079571:0.01:0.01:0.01:0.01:14.27447261;
SkMuscle:2000:NEUT1 :0.012227059:0.00053056:0.01:0.01:0.01:0.01:0.306938325;
SkMuscle:2000:NEUT2 :0.01:2.46619E-30:0.01:0.01:0.01:0.01:0.01;
SkMuscle:2000:NEUT3 :0.215387785:5.34538476:0.01:0.01:0.01:0.01:27.06598056;
SkMuscle:2000:SC :0.384236497:3.218447212:0.01:0.01:0.01:0.01:8.613897029;
SkMuscle:2000:T:0.01:4.29784E-30:0.01:0.01:0.01:0.01:0.01;
Spleen:100:B:0.789739043:13.27629372:0.009999999:0.01:0.014974386:0.175114572:76.01353696;
Spleen:100:MAC:0.033677171:0.000928003:0.01:0.01052609:0.019320469:0.044604965:0.119540695;
Spleen:100:T:0.889478679:2.626844949:0.01:0.028523727:0.229516685:1.134817519:11.21089027;
Spleen:300:B:0.6007074:5.718042953:0.009999997:0.01:0.01:0.014069245:24.35418936;
Spleen:300:MAC:0.110306986:0.104400051:0.01:0.01:0.01:0.017623009:1.695440132;
Spleen:300:T:1.193135349:9.943389873:0.01:0.01:0.01:0.306849232:26.93225583;
Spleen:2000:B:0.527834996:2.847863632:0.01:0.01:0.01:0.026519544:14.2891133;
Spleen:2000:MAC:0.028947532:0.008489124:0.01:0.01:0.01:0.01:0.526640415;
Spleen:2000:T:0.902514553:4.96652535:0.01:0.01:0.01:0.263963255:13.63243794;
Thymus:100:IT2:0.892838408:8.146903544:0.01:0.01:0.01:0.187870672:27.72681703;
Thymus:100:IT3:1.517353985:8.980022847:0.01:0.01:0.087409456:1.088970761:12.81068485;
Thymus:100:IT4:0.509593999:2.415552664:0.01:0.01:0.019557589:0.222231944:12.92113673;
Thymus:100:LEU3:0.075703947:0.050678587:0.01:0.01:0.01:0.010156311:0.855605674;
Thymus:100:TPT:0.603227667:0.873439087:0.01:0.02145553:0.26503743:0.596217908:2.432418181;
Thymus:300:IT2:0.569771808:9.930095561:0.01:0.01:0.01:0.01:31.00492796;
Thymus:300:IT3:1.539814872:17.40773119:0.01:0.01:0.01:0.178454647:21.665993;
Thymus:300:IT4:0.293142261:3.327556195:0.01:0.01:0.01:0.01:19.65626539;
Thymus:300:LEU3:0.100077789:0.113494376:0.01:0.01:0.01:0.01:1.270564448;
Thymus:300:TPT:0.01:5.05421E-28:0.01:0.01:0.01:0.01:0.01;
Thymus:2000:IT2:0.461222048:2.278633079:0.01:0.01:0.01:0.015257748:11.52396779;
Thymus:2000:IT3:1.632787561:11.73465067:0.01:0.01:0.032282811:1.271299967:19.54368881;
Thymus:2000:IT4:0.249174221:1.215448065:0.01:0.01:0.01:0.01:7.965207557;
Thymus:2000:LEU3:1.037253207:2.514034235:0.01:0.04187717:0.257041468:0.893381107:4.991732332;
Thymus:2000:TPT:0.011241477:9.2476E-06:0.01:0.01:0.01:0.01:0.017448864;
101 制御部
20 解析装置
201 制御部
Claims (10)
- 解析対象細胞から取得した、又は解析対象細胞について予測されたシングルセルRNA-Seq解析のカウントデータセットに、前記解析対象細胞に対応する細胞種ごとの総RNAの含有量に基づいて重み付けすること、を含むシングルセルRNA-Seq解析のカウントデータセットの補正方法。
- 前記重み付けが、各細胞種を特徴付けるシグネチャ遺伝子セットの発現に基づいて行われ、前記シグネチャ遺伝子セットは、所定数の遺伝子数を含む、請求項1に記載の補正方法。
- 解析対象細胞から取得した、又は解析対象細胞について予測されたシングルセルRNA-Seq解析のカウントデータセットに、前記解析対象細胞に対応する細胞種ごとの総RNAの含有量に基づいて重み付けすることと、
重み付けされたシングルセルRNA-Seq解析のカウントデータセットに基づいて、解析対象細胞を含む解析対象器官を構成する各細胞種におけるRNAの発現パターンを解析すること、
と含む、シングルセルRNA-Seqの解析方法。 - 解析対象細胞から取得した、又は解析対象細胞について予測されたシングルセルRNA-Seq解析のカウントデータセットに、前記解析対象細胞に対応する細胞種ごとの総RNAの含有量に基づいて重み付けすることと、
重み付けされたシングルセルRNA-Seq解析のカウントデータセットに基づいて、解析対象細胞を含む解析対象器官を構成する細胞種の構成比率を解析することを含む、
解析対象器官を構成する細胞種の構成比率の解析方法。 - シングルセルRNA-Seq解析のカウントデータセットの補正装置であって、
前記補正装置は、制御部を備え、
前記制御部は、
解析対象細胞から取得したシングルセルRNA-Seq解析のカウントデータセットに、前記解析対象細胞に対応する細胞種ごとの総RNAの含有量に基づいて重み付けする、
前記補正装置。 - シングルセルRNA-Seqの解析装置であって、
前記解析装置は、制御部を備え、
前記制御部は、
解析対象細胞から取得した、又は解析対象細胞について予測されたシングルセルRNA-Seq解析のカウントデータセットに、前記解析対象細胞に対応する細胞種ごとの総RNAの含有量に基づいて重み付けし、
重み付けされたシングルセルRNA-Seq解析のカウントデータセットに基づいて、解析対象細胞を含む解析対象器官を構成する各細胞種におけるRNAの発現パターンを解析する、
前記解析装置。 - 解析対象器官を構成する細胞種の構成比率の解析装置であって、
前記解析装置は、制御部を備え、
前記制御部は、
解析対象細胞から取得した、又は解析対象細胞について予測されたシングルセルRNA-Seq解析のカウントデータセットに、前記解析対象細胞に対応する細胞種ごとの総RNAの含有量に基づいて重み付けし、
重み付けされたシングルセルRNA-Seq解析のカウントデータセットに基づいて、解析対象細胞を含む解析対象器官を構成する細胞種の構成比率を解析する、
前記解析装置。 - コンピュータに実行させた時に、
コンピュータに、
解析対象細胞から取得した、又は解析対象細胞について予測されたシングルセルRNA-Seq解析のカウントデータセットに、前記解析対象細胞に対応する細胞種ごとの総RNAの含有量に基づいて重み付けするステップを備える処理を実行させる、シングルセルRNA-Seq解析のカウントデータセットの補正プログラム。 - コンピュータに実行させた時に、
コンピュータに、
解析対象細胞から取得した、又は解析対象細胞について予測されたシングルセルRNA-Seq解析のカウントデータセットに、前記解析対象細胞に対応する細胞種ごとの総RNAの含有量に基づいて重み付けするステップと、
重み付けされたシングルセルRNA-Seq解析のカウントデータセットに基づいて、解析対象細胞を含む解析対象器官を構成する各細胞種におけるRNAの発現パターンを解析するステップと、
を備える処理を実行させる、シングルセルRNA-Seqの解析プログラム。 - コンピュータに実行させた時に、
コンピュータに、
解析対象細胞から取得した、又は解析対象細胞について予測されたシングルセルRNA-Seq解析のカウントデータセットに、前記解析対象細胞に対応する細胞種ごとの総RNAの含有量に基づいて重み付けするステップと、
重み付けされたシングルセルRNA-Seq解析のカウントデータセットに基づいて、解析対象細胞を含む解析対象器官を構成する細胞種の構成比率を解析するステップと、
を備える処理を実行させる、解析対象器官を構成する細胞種の構成比率の解析プログラム。
Priority Applications (5)
| Application Number | Priority Date | Filing Date | Title |
|---|---|---|---|
| JP2021576209A JP7689737B2 (ja) | 2020-02-06 | 2021-02-06 | シングルセルRNA-Seq解析のカウントデータセットの補正方法、シングルセルRNA-Seqの解析方法、細胞種の構成比率の解析方法、並びにこれらの方法を実行するための装置及びコンピュータプログラム |
| US17/796,509 US20230074644A1 (en) | 2020-02-06 | 2021-02-06 | Correction Method for Single-Cell RNA-Seq Analysis Count Data Set, Analysis Method for Single-Cell RNA-Seq, Analysis Method for Cell Type Rations, and Devices and Computer Programs for Executing Said Methods |
| CA3170368A CA3170368A1 (en) | 2020-02-06 | 2021-02-06 | Correction method for single-cell rna-seq analysis count data set, analysis method for single-cell rna-seq, analysis method for cell type ratios, and devices and computer programs for executing said methods |
| EP21751230.0A EP4101933A4 (en) | 2020-02-06 | 2021-02-06 | CORRECTION METHODS FOR SINGLE-CELL RNA-SEQ ANALYSIS DATA SETS, ANALYZING METHODS FOR SINGLE-CELL RNA-SEQ, ANALYZING METHODS FOR CELL TYPE RATIO, AND DEVICES AND COMPUTER PROGRAMS FOR PERFORMING THESE METHODS |
| IL295227A IL295227A (en) | 2020-02-06 | 2021-02-06 | Correction method for single-cell rna-seq analysis count data set, analysis method for single-cell rna-seq, analysis method for cell type ratios, and devices and computer programs for executing said methods |
Applications Claiming Priority (2)
| Application Number | Priority Date | Filing Date | Title |
|---|---|---|---|
| JP2020018989 | 2020-02-06 | ||
| JP2020-018989 | 2020-02-06 |
Publications (1)
| Publication Number | Publication Date |
|---|---|
| WO2021157739A1 true WO2021157739A1 (ja) | 2021-08-12 |
Family
ID=77199636
Family Applications (1)
| Application Number | Title | Priority Date | Filing Date |
|---|---|---|---|
| PCT/JP2021/004470 Ceased WO2021157739A1 (ja) | 2020-02-06 | 2021-02-06 | シングルセルRNA-Seq解析のカウントデータセットの補正方法、シングルセルRNA-Seqの解析方法、細胞種の構成比率の解析方法、並びにこれらの方法を実行するための装置及びコンピュータプログラム |
Country Status (6)
| Country | Link |
|---|---|
| US (1) | US20230074644A1 (ja) |
| EP (1) | EP4101933A4 (ja) |
| JP (1) | JP7689737B2 (ja) |
| CA (1) | CA3170368A1 (ja) |
| IL (1) | IL295227A (ja) |
| WO (1) | WO2021157739A1 (ja) |
Family Cites Families (1)
| Publication number | Priority date | Publication date | Assignee | Title |
|---|---|---|---|---|
| EP3655955B1 (en) * | 2017-07-21 | 2025-04-09 | The Board of Trustees of the Leland Stanford Junior University | Systems and methods for analyzing mixed cell populations |
-
2021
- 2021-02-06 EP EP21751230.0A patent/EP4101933A4/en not_active Withdrawn
- 2021-02-06 US US17/796,509 patent/US20230074644A1/en not_active Abandoned
- 2021-02-06 WO PCT/JP2021/004470 patent/WO2021157739A1/ja not_active Ceased
- 2021-02-06 CA CA3170368A patent/CA3170368A1/en active Pending
- 2021-02-06 IL IL295227A patent/IL295227A/en unknown
- 2021-02-06 JP JP2021576209A patent/JP7689737B2/ja active Active
Non-Patent Citations (22)
| Title |
|---|
| ABBAS, A. R. ET AL., PLOS ONE, vol. 4, 2009, pages e6098 |
| AVILA COBOS, F. ET AL., BIOINFORMATICS, vol. 34, 2018, pages 1969 - 1979 |
| DENG, Q.RAMSKOLD, D.REINIUS, B.SANDBERG, R., SCIENCE, vol. 343, 2014, pages 193 - 196 |
| GAUJOUX, R.SEOIGHE, C., INFECT GENET EVOL, vol. 12, 2012, pages 913 - 921 |
| GONG, T ET AL., PLOS ONE, vol. 6, 2011, pages e27156 |
| GONG, T.SZUSTAKOWSKI, J. D., BIOINFORMATICS, vol. 29, 2013, pages 1083 - 1085 |
| HAN, X. ET AL.: "Mapping the Mouse Cell Atlas by Microwell-Seq", CELL, vol. 172, 2018, pages 1091 - 1107 |
| KANG KAI, MENG QIAN, SHATS IGOR, UMBACH DAVID M., LI MELISSA, LI YUANYUAN, LI XIAOLING, LI LEPING: "CDSeq: A novel complete deconvolution method for dissecting heterogeneous samples using gene expression data", PLOS COMPUTATIONAL BIOLOGY, vol. 15, no. 12, 2019, pages 1 - 12, XP055845890 * |
| KANG, K ET AL., PLOS COMPUTATIONAL BIOLOGY, vol. 15, 2019, pages el007510 |
| LI, B ET AL., GENOME BIOLOGY, vol. 17, no. 174, 2016 |
| MONACO GIANNI; LEE BERNETT; XU WEILI; MUSTAFAH SERI; HWANG YOU YI; CARRÉ CHRISTOPHE; BURDIN NICOLAS; VISAN LUCIAN; CECCARELLI MICH: "RNA-Seq Signatures Normalized by mRNA Abundance Allow Absolute Deconvolution of Human Immune Cell Types", CELL REPORTS, vol. 26, 2019, pages 1627 - 1640, XP055816150 * |
| NEWMAN, A. M. ET AL., NATURE METHODS, vol. 12, 2015, pages 453 - 457 |
| REGEV, A ET AL.: "Science Forum: The Human Cell Atlas", ELIFE, vol. 6, 2017 |
| REPSILBER, D ET AL., BMC BIOINFORMATICS, vol. 11, 2010, pages 27 |
| SANDBERG, R., NATURE METHODS, vol. 11, 2014, pages 22 - 24 |
| See also references of EP4101933A4 |
| SHEN-ORR, S. S.GAUJOUX, R., CURR OPIN IMMUNOL, vol. 25, 2013, pages 571 - 578 |
| TABULA MURIS, C. ET AL., NATURE, vol. 562, 2018, pages 367 - 372 |
| TSOUCAS DAPHNE, DONG RUI, CHEN HAIDE, ZHU QIAN, GUO GUOJI, YUAN GUO-CHENG: "Accurate estimation of cell-type composition from gene expression data", NATURE COMMUNICATIONS, vol. 10, 2019, pages 1 - 9, XP055845891 * |
| TSOUCAS, D ET AL., NAT COMMUN, vol. 10, 2019, pages 2975 |
| WANG, N. ET AL., BIOINFORMATICS, vol. 31, 2015, pages 137 - 139 |
| ZHONG, Y ET AL., BMC BIOINFORMATICS, vol. 14, 2013, pages 89 |
Also Published As
| Publication number | Publication date |
|---|---|
| US20230074644A1 (en) | 2023-03-09 |
| CA3170368A1 (en) | 2021-08-12 |
| EP4101933A4 (en) | 2024-02-28 |
| EP4101933A1 (en) | 2022-12-14 |
| IL295227A (en) | 2022-10-01 |
| JP7689737B2 (ja) | 2025-06-09 |
| JPWO2021157739A1 (ja) | 2021-08-12 |
Similar Documents
| Publication | Publication Date | Title |
|---|---|---|
| US11676684B2 (en) | Artificial intelligence model for predicting actions of test substance in humans | |
| Liang et al. | Pervasive correlated evolution in gene expression shapes cell and tissue type transcriptomes | |
| EP4152343A1 (en) | Method and system for generating medical prediction related to biomarker from medical data | |
| WO2021145434A1 (ja) | 目的とする薬剤又はその等価物質の適応症の予測方法、予測装置、及び予測プログラム | |
| Chen et al. | Population size may shape the accumulation of functional mutations following domestication | |
| US20250201417A1 (en) | Method and system for generating medical prediction related to biomarker from medical data | |
| CN113574604A (zh) | 人类微生物组的衰老标记物和微生物组的衰老时钟 | |
| CN114093411B (zh) | 基于样本的微生物群体的进化关系和丰度信息的分析方法及设备 | |
| WO2021157739A1 (ja) | シングルセルRNA-Seq解析のカウントデータセットの補正方法、シングルセルRNA-Seqの解析方法、細胞種の構成比率の解析方法、並びにこれらの方法を実行するための装置及びコンピュータプログラム | |
| US20240153649A1 (en) | Artificial Intelligence Model for Predicting Indications for Test Substances in Humans | |
| Sandel et al. | Primate behavior and the importance of comparative studies in biological anthropology | |
| JP7326574B1 (ja) | 美容レベル推定システム、美容レベル推定方法、及び総合健康度推定システム及び総合健康度推定方法 | |
| Zhang et al. | Phylotranscriptomic analysis based on coalescence was less influenced by the evolving rates and the number of genes: a case study in Ericales | |
| Gerhards et al. | Genome-Wide Association Study Reveals Single Nucleotide Polymorphisms Associated with Tail Length and Tail Kinks in Piglets | |
| Lim et al. | Systems biology and integration of multi-omics data | |
| US20220336092A1 (en) | Information processing system and non-transitory computer-readable storage medium | |
| Chen et al. | Bayesian inference of gene regulatory network | |
| CN114678072B (zh) | 一种基因表达数据处理方法及其相关设备 | |
| JP2025009997A (ja) | 保険料算出システム及び保険料算出方法 | |
| CN118194163B (zh) | 种猪评分方法、装置、电子设备及存储介质 | |
| WO2024024795A1 (ja) | 保険料算出システム、美容レベル推定システム、及び総合健康度推定システム | |
| Kelemen | Modelling human complex traits with regression and neural-network based methods | |
| Lake | Muscle disorder or metabolic disorder: genomic, transcriptomic, and metabolomic insights into the pathogenesis of wooden breast and white striping in commercial broiler chickens | |
| Marubayashi et al. | Phenotypic plasticity drives the development of laterality in the scale-eating cichlid fish Perissodus microlepis | |
| e Cunha | Neural Networks for 2D Representations of Cell Expression |
Legal Events
| Date | Code | Title | Description |
|---|---|---|---|
| 121 | Ep: the epo has been informed by wipo that ep was designated in this application |
Ref document number: 21751230 Country of ref document: EP Kind code of ref document: A1 |
|
| ENP | Entry into the national phase |
Ref document number: 2021576209 Country of ref document: JP Kind code of ref document: A |
|
| ENP | Entry into the national phase |
Ref document number: 3170368 Country of ref document: CA |
|
| NENP | Non-entry into the national phase |
Ref country code: DE |
|
| ENP | Entry into the national phase |
Ref document number: 2021751230 Country of ref document: EP Effective date: 20220906 |
|
| WWW | Wipo information: withdrawn in national office |
Ref document number: 2021751230 Country of ref document: EP |