WO2021177056A1 - 情報処理装置および機械学習方法 - Google Patents
情報処理装置および機械学習方法 Download PDFInfo
- Publication number
- WO2021177056A1 WO2021177056A1 PCT/JP2021/006302 JP2021006302W WO2021177056A1 WO 2021177056 A1 WO2021177056 A1 WO 2021177056A1 JP 2021006302 W JP2021006302 W JP 2021006302W WO 2021177056 A1 WO2021177056 A1 WO 2021177056A1
- Authority
- WO
- WIPO (PCT)
- Prior art keywords
- data
- graph structure
- unit
- input data
- information processing
- Prior art date
- Legal status (The legal status is an assumption and is not a legal conclusion. Google has not performed a legal analysis and makes no representation as to the accuracy of the status listed.)
- Ceased
Links
Images









Classifications
-
- G—PHYSICS
- G06—COMPUTING OR CALCULATING; COUNTING
- G06N—COMPUTING ARRANGEMENTS BASED ON SPECIFIC COMPUTATIONAL MODELS
- G06N3/00—Computing arrangements based on biological models
- G06N3/02—Neural networks
- G06N3/04—Architecture, e.g. interconnection topology
- G06N3/045—Combinations of networks
- G06N3/0455—Auto-encoder networks; Encoder-decoder networks
-
- G—PHYSICS
- G06—COMPUTING OR CALCULATING; COUNTING
- G06N—COMPUTING ARRANGEMENTS BASED ON SPECIFIC COMPUTATIONAL MODELS
- G06N3/00—Computing arrangements based on biological models
- G06N3/02—Neural networks
- G06N3/08—Learning methods
- G06N3/082—Learning methods modifying the architecture, e.g. adding, deleting or silencing nodes or connections
-
- G—PHYSICS
- G06—COMPUTING OR CALCULATING; COUNTING
- G06N—COMPUTING ARRANGEMENTS BASED ON SPECIFIC COMPUTATIONAL MODELS
- G06N3/00—Computing arrangements based on biological models
- G06N3/02—Neural networks
- G06N3/04—Architecture, e.g. interconnection topology
-
- G—PHYSICS
- G06—COMPUTING OR CALCULATING; COUNTING
- G06N—COMPUTING ARRANGEMENTS BASED ON SPECIFIC COMPUTATIONAL MODELS
- G06N3/00—Computing arrangements based on biological models
- G06N3/02—Neural networks
- G06N3/04—Architecture, e.g. interconnection topology
- G06N3/044—Recurrent networks, e.g. Hopfield networks
- G06N3/0442—Recurrent networks, e.g. Hopfield networks characterised by memory or gating, e.g. long short-term memory [LSTM] or gated recurrent units [GRU]
-
- G—PHYSICS
- G06—COMPUTING OR CALCULATING; COUNTING
- G06N—COMPUTING ARRANGEMENTS BASED ON SPECIFIC COMPUTATIONAL MODELS
- G06N3/00—Computing arrangements based on biological models
- G06N3/02—Neural networks
- G06N3/04—Architecture, e.g. interconnection topology
- G06N3/0475—Generative networks
-
- G—PHYSICS
- G06—COMPUTING OR CALCULATING; COUNTING
- G06N—COMPUTING ARRANGEMENTS BASED ON SPECIFIC COMPUTATIONAL MODELS
- G06N3/00—Computing arrangements based on biological models
- G06N3/02—Neural networks
- G06N3/04—Architecture, e.g. interconnection topology
- G06N3/0495—Quantised networks; Sparse networks; Compressed networks
-
- G—PHYSICS
- G06—COMPUTING OR CALCULATING; COUNTING
- G06N—COMPUTING ARRANGEMENTS BASED ON SPECIFIC COMPUTATIONAL MODELS
- G06N3/00—Computing arrangements based on biological models
- G06N3/02—Neural networks
- G06N3/08—Learning methods
- G06N3/084—Backpropagation, e.g. using gradient descent
-
- G—PHYSICS
- G06—COMPUTING OR CALCULATING; COUNTING
- G06N—COMPUTING ARRANGEMENTS BASED ON SPECIFIC COMPUTATIONAL MODELS
- G06N3/00—Computing arrangements based on biological models
- G06N3/02—Neural networks
- G06N3/08—Learning methods
- G06N3/0895—Weakly supervised learning, e.g. semi-supervised or self-supervised learning
-
- G—PHYSICS
- G06—COMPUTING OR CALCULATING; COUNTING
- G06N—COMPUTING ARRANGEMENTS BASED ON SPECIFIC COMPUTATIONAL MODELS
- G06N3/00—Computing arrangements based on biological models
- G06N3/02—Neural networks
- G06N3/08—Learning methods
- G06N3/09—Supervised learning
-
- G—PHYSICS
- G06—COMPUTING OR CALCULATING; COUNTING
- G06N—COMPUTING ARRANGEMENTS BASED ON SPECIFIC COMPUTATIONAL MODELS
- G06N3/00—Computing arrangements based on biological models
- G06N3/02—Neural networks
- G06N3/04—Architecture, e.g. interconnection topology
- G06N3/042—Knowledge-based neural networks; Logical representations of neural networks
-
- G—PHYSICS
- G06—COMPUTING OR CALCULATING; COUNTING
- G06N—COMPUTING ARRANGEMENTS BASED ON SPECIFIC COMPUTATIONAL MODELS
- G06N3/00—Computing arrangements based on biological models
- G06N3/02—Neural networks
- G06N3/04—Architecture, e.g. interconnection topology
- G06N3/047—Probabilistic or stochastic networks
-
- G—PHYSICS
- G06—COMPUTING OR CALCULATING; COUNTING
- G06N—COMPUTING ARRANGEMENTS BASED ON SPECIFIC COMPUTATIONAL MODELS
- G06N3/00—Computing arrangements based on biological models
- G06N3/02—Neural networks
- G06N3/08—Learning methods
- G06N3/094—Adversarial learning
Definitions
- This disclosure relates to an information processing device and a machine learning method.
- Non-Patent Document 1 a syntax tree is generated by the REINFORCE (REward Increment Nonnegative Factor Offset Reinforcement Characteristic Eligibility) algorithm, and the data structured by the syntax tree is reconstructed by VAE (Variational Autoencoder) as an intermediate representation.
- REINFORCE REward Increment Nonnegative Factor Offset Reinforcement Characteristic Eligibility
- VAE Variational Autoencoder
- Non-Patent Document 1 In reinforcement learning including the REINFORCE algorithm used in Non-Patent Document 1, it may be difficult to identify the correct answer for the output of the model because the model (agent) to be optimized advances the optimization of parameters while repeating trial and error. be. Therefore, for reinforcement learning, backpropagation is used to differentiate the loss function that defines the error between the output from the model and the correct answer, and propagate the error from the output layer of the model to the input layer based on the chain rule. It is known that it may be more difficult to improve the accuracy of the model than the machine learning used. There is room for improvement in the accuracy of the trained model formed by machine learning in the configuration disclosed in Non-Patent Document 1.
- This disclosure was made to solve the above problems, and the purpose is to improve the accuracy of the model that extracts the graph structure as an intermediate representation from the input data.
- the information processing device extracts a graph structure representing the correlation between elements included in the input data from the input data, and generates output data from the graph structure.
- the information processing device includes an encoding unit, a sampling unit, a decoding unit, and a learning unit.
- the encoding unit extracts the features of each of the plurality of vertices included in the graph structure from the input data, and calculates the likelihood that the edges representing the correlation are connected to the vertices.
- the sampling unit determines the graph structure based on the conversion result of the Gumbel-Softmax function for the likelihood.
- the decoding unit generates output data by receiving the graph structure and the features of each of the plurality of vertices.
- the learning unit optimizes the decoding unit and the encoding unit by backpropagation that minimizes the loss function including the error between the output data and the correct answer data.
- the loss function can be differentiated even by the process of determining the graph structure by the sampling unit, so the error between the output data and the correct answer data is backpropagated from the output layer of the decoding unit to the input layer of the encoding unit. It becomes possible to propagate back.
- the decoding unit and the encoding unit can be optimized end-to-end from the output layer of the decoding unit to the input of the encoding unit, so that the accuracy of the graph structure as an intermediate representation and the accuracy of the output data are improved. be able to.
- the information processing apparatus may further include a reconstruction unit that reconstructs the graph structure from the output data.
- the loss function may include an error between the output from the reconstruction section and the correct graph structure.
- lossless compression by the encoding unit is performed by performing machine learning so that the sameness is maintained between the graph structure reconstructed by the reconstructing unit and the correct graph structure. Be promoted. As a result, the accuracy of the graph structure as an intermediate representation and the accuracy of the output data can be further improved as compared with the configuration 1.
- an inference unit that receives a graph structure from the sampling unit and outputs an inference result for the input data may be further provided.
- the learning unit may perform unsupervised learning for the decoding unit and the encoding unit, and supervised learning for the inference unit.
- lossless compression by the encoding unit is promoted, and the inference accuracy of the inference unit can be improved by supervised learning for the inference unit.
- the input data may include the first data and the second data.
- the modality of the first data may be different from the modality of the second data.
- the encoding unit may include a first encoder and a second encoder.
- the first encoder may extract the feature amount of the first data.
- the second encoder may extract the feature amount of the second data.
- the graph structure can be extracted from various input data.
- the modality of the output data may be different from the modality of the input data.
- various data can be generated from the graph structure.
- a graph structure representing the correlation between the elements included in the input data is extracted from the input data, and the output data is generated from the graph structure in the storage unit. It is done by a processor that runs a stored machine learning program.
- the machine learning method is a step of extracting the features of each of a plurality of vertices included in the graph structure from the input data and calculating the likelihood that the side representing the correlation is connected to the vertices, and the function for the likelihood.
- the step of determining the graph structure based on the conversion result of the Softmax function, the step of generating the output data by receiving the features of each of the graph structure and multiple vertices, and the error between the output data and the correct answer data. Includes steps to optimize the model by backpropagation that minimizes the included loss function.
- the loss function is also differentiable by the step of determining the graph structure, so the error between the output data and the correct answer data is backpropagated from the output layer of the model to the input layer of the model by backpropagation.
- the model can be optimized end-to-end from the output layer of the model to the input layer of the model, so that the accuracy of the graph structure as an intermediate representation and the accuracy of the output data can be improved.
- the information processing device and the machine learning method according to the present disclosure it is possible to improve the accuracy of the model that extracts the graph structure as an intermediate representation from the input data.
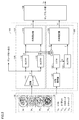
- FIG. It is a block diagram which shows the structure of the information processing apparatus which concerns on Embodiment 1.
- FIG. It is a block diagram for demonstrating the specific structure of the input data and the encoding part of FIG.
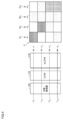
- FIG. shows the adjacency matrix which expresses the tree structure of FIG.
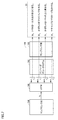
- It is a block diagram which shows the specific structure of the decoding part of FIG. 1 and output data.
- It is a flowchart which shows the flow of the machine learning method performed in an information processing apparatus.
- FIG. 1 It is a block diagram which shows the functional structure of the collection analysis server apparatus of FIG. It is a block diagram which shows the hardware configuration of the collection analysis server apparatus of FIG. It is a figure which shows an example of the graph structure which was visualized with the error of quality data and standard quality data. It is a figure for demonstrating the route planning by a robot corresponding to the information processing apparatus which concerns on embodiment. It is a figure which shows the directed graph structure extracted by the robot of FIG. It is a figure which shows the matrix representation corresponding to the directed graph structure of FIG.
- FIG. 1 is a block diagram showing a configuration of the information processing apparatus 1 according to the first embodiment.
- the information processing apparatus 1 includes an encoding unit 100, a sampling unit 130, a decoding unit 140, and a learning unit 150.
- the information processing device 1 extracts a graph structure representing the correlation between the elements included in the input data 10 from the input data 10, and generates output data 20 from the graph structure.
- output data including the cooking procedure column data is generated from the input data including the image string data and the foodstuff string data of the cooking procedure will be described.
- FIG. 2 is a block diagram for explaining a specific configuration of the input data 10 and the encoding unit 100 of FIG.
- the input data 10 includes the image string data 11 (first data) and the food string data 12 (second data).
- the modality of the image sequence data 11 is an image.
- the modality of the food material string data 12 is a character string.
- the modality of the image sequence data 11 is different from the modality of the foodstuff sequence data 12.
- the modality includes a data format, type, or type.
- the image sequence data 11 includes images Im 1 to Im M.
- Each image Im 1 ⁇ Im M represents an image of each step of the cooking, the cooking in the order of the image Im 1 ⁇ Im M is performed. That is, the images Im 1 to Im M are ordered in this order.
- the food material string data 12 includes the character strings Tx 1 to Tx N.
- Each of the character strings Tx 1 to Tx N represents a food material name. In the cooking process, the character strings Tx 1 to Tx N are used in this order. That is, the character strings Tx 1 to Tx N are ordered in this order. In FIG. 2, the case where the number of procedures M is 4 and the number of foodstuffs N is 4 is shown.
- the character strings Tx 1 to Tx 4 represent "tomato", “pumpkin”, “mayonnaise”, and “ketchup”, respectively.
- the number of steps M is not limited to 4, and may be 3 or less, or 5 or more.
- the encoding unit 100 includes an encoder 110 (first encoder) and an encoder 120 (second encoder).
- the encoder 110 includes a trained image encoder 111, a biLSTM (bidirectional Long Short-Term Memory) 112, 113, and a matrix estimator 114.
- the encoder 120 includes a distributed expression device 121, an LSTM 122, a biLSTM 123, and a matrix estimator 124.
- the distributed expression device 121 includes, for example, word2vec.
- the feature vectors ⁇ 1 to ⁇ M correspond to the feature vectors v 1 to v M, respectively.
- the feature vectors ⁇ 1 to ⁇ M correspond to the feature vectors v 1 to v M, respectively.
- the index k is a natural number.
- the matrix estimator 114 receives the vector representations ⁇ and ⁇ , estimates the adjacency relationship of the images Im 1 to Im M , and outputs the adjacency matrix Y.
- the estimation of the adjacencies of the image Im 1 ⁇ Im M, each image Im 1 ⁇ Im M as the vertex of the graph structure, means to calculate the likelihood that the sides exists between two vertices.
- the components Y i and j of the adjacency matrix Y are represented by the following equation (1).
- the vector expression ⁇ ( ⁇ 1 , ⁇ 2 , ..., ⁇ k , ..., ⁇ M ) (feature amount) is calculated from the vector expressions ⁇ , ⁇ , and the vector expression ⁇ is input to the matrix estimator 124. Will be done.
- the component of each dimension of the feature vector ⁇ k is the larger component of the components of the dimension of the feature vectors ⁇ k and ⁇ k.
- the distributed expression device 121 outputs a distributed expression of the character string Tx k included in the food string data 12.
- the feature vectors ⁇ 1 to ⁇ N correspond to the feature vectors g 1 to g N, respectively.
- the matrix estimator 124 receives the vector representations ⁇ and ⁇ , estimates the adjacency relationship between the images Im 1 to Im M and the character strings Tx 1 to Tx N , and outputs the adjacency relationship as the adjacency matrix X.
- the estimation of the adjacency of the image Im 1 ⁇ Im M and string Tx 1 ⁇ Tx N, each string Tx 1 ⁇ Tx N as the vertex of the graph structure, corresponding to each of the strings Tx 1 ⁇ Tx N This means calculating the likelihood that an edge exists between the vertices and the vertices corresponding to each of the images Im1 to Im4.
- the components X i and j of the adjacency matrix X are represented by the following equation (2).
- FIG. 3 is a schematic diagram of the adjacency matrix Y of FIG. The darker the hatching attached to each component in FIG. 3, the greater the likelihood of the component.
- the likelihood of the existence of an edge from the apex included in the row to the apex included in the column is a component of the adjacency matrix specified by the row and the column. That is, the adjacency matrix Y represents a directed graph structure.
- the likelihood of the existence of an edge from the vertex contained in the column to the vertex contained in the row may be a component of the adjacency matrix specified by the row and column.
- the adjacency matrix Y representing the directed graph structure may be converted into the adjacency matrix T representing the undirected graph structure, if necessary.
- the average value of each component of the adjacency matrix Y and the row and column inverted components of the adjacency matrix Y is set so that the transposed matrix of the adjacency matrix T becomes equal to the adjacency matrix T. It can be a component of the adjacency matrix T corresponding to the two components.
- FIG. 4 is a schematic diagram of the adjacency matrix X of FIG.
- the relationship between the hatching density and the likelihood is the same as in FIG.
- the likelihood of an edge existing between the vertices included in the row and the vertices included in the column is a component of the adjacency matrix specified by the row and the column.
- the adjacency matrix X represents an undirected graph structure.
- the sampling unit 130 receives the Y, the vertices corresponding to each of the strings Tx 1 ⁇ Tx N is a leaf node, corresponding to the last image in the image sequence data 11
- a tree structure Tr (graph structure) is output, in which the vertices to be used are the root nodes and the vertices corresponding to other images are the nodes.
- the sampling unit 130 uses the Gumbel-Softmax function (see Non-Patent Document 2) to convert the likelihood of each component of the adjacency matrix X and Y into the probability that an edge exists between two vertices corresponding to the component. (Reparameterization trick).
- the sampling unit 130 converts the adjacency matrices X and Y into the adjacency matrices A and B, respectively, by a reparameterization trick.
- the components A i, j , Bi, and j are represented by the following equations (3) and (4), respectively.
- ⁇ i, k , ⁇ i, k are noises sampled from the Gumbel (0,1) distribution.
- ⁇ is a temperature parameter of the Gumbel-Softmax function.
- the sampling unit 130 determines the presence or absence of branches (edges) between nodes using the adjacency matrices A and B, and determines the tree structure Tr.
- FIG. 5 is a diagram showing the tree structure Tr of FIG.
- the nodes Nd 1 to Nd 4 correspond to the images Im 1 to Im 4 , respectively.
- Node Nd 4 is the root node.
- the leaf nodes Lf 1 to Lf 4 correspond to the character strings Tx 1 to Tx 4, respectively.
- branches Br 1 and leaf node Lf 1 and node Nd are connected by branches Br 1.
- the leaf nodes Lf 2 and node Nd 2 are connected by branches Br 2.
- the leaf node Lf 3 and the root node Nd 4 are connected by a branch Br 3.
- a leaf node Lf 4 and the root node Nd 4 are connected by a branch Br 4.
- Nodes Nd 1 and Nd 3 are connected by a branch Br 5 from node Nd 1 to Nd 3.
- Nodes Nd 2 and Nd 3 are connected by a branch Br 6 from node Nd 2 to Nd 3.
- the node Nd 3 and the root node Nd 4 are connected by a branch Br 7 from the node Nd 3 to the root node Nd 4.
- Tree Tr is the procedure shown in the procedure shown in the image Im 1 results and image Im 2 results are used in the procedures shown in the image Im 3, the procedure shown in the image Im 3 results image Im 4 Indicates that it will be used in the procedure shown in. Furthermore, the tree structure Tr is used in the procedures ingredients string Tx 1 is shown in the image Im 1, foodstuff string Tx 2 is used in the procedure shown in image Im 2, strings Tx 3, Tx 4 It indicates that each of the ingredients is used in the procedure shown in the image Im 4.
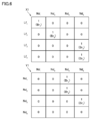
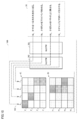
- FIG. 6 is a diagram showing adjacency matrices X1 and Y1 representing the tree structure Tr of FIG.
- the adjacency matrices X1 and Y1 are determined by the sampling unit 130 via the adjacency matrices A and B, respectively.
- the sampling unit 130 determines the adjacency matrices X1 and Y1 with the component corresponding to the maximum value in each row of the adjacency matrices A and B being 1, the other components being 0, and each row as a one-hot representation. If the maximum number of edges from vertices or the maximum number of edges to the vertices included in the graph structure extracted from the input data is determined, use Ensemble Gumbel-Softmax (see Non-Patent Document 3).
- Each row or column may be represented as a superposition of two or more one-hot representations.
- the characteristics of the extracted graph structure can be considered in addition to the conversion result of the reparameterization trick using the Gumbel-Softmax function for the likelihood of each component of the adjacency matrix X and Y. ..
- the characteristics of the extracted graph structure can be considered in addition to the conversion result of the reparameterization trick using the Gumbel-Softmax function for the likelihood of each component of the adjacency matrix X and Y. ..
- the characteristics of the extracted graph structure can be considered in addition to the conversion result of the reparameterization trick using the Gumbel-Softmax function for the likelihood of each component of the adjacency matrix X and Y. ..
- the characteristics of the extracted graph structure can be considered in addition to the conversion result of the reparameterization trick using the Gumbel-Softmax function for the likelihood of each component of the adjacency matrix X and Y. ..
- an edge self-loop
- the adjacency matrix Y1 representing the directed graph structure may be converted into the adjacency matrix T1 representing the undirected graph structure, if necessary.
- the minimum value, or a value randomly selected from any of them can be a component of the adjacency matrix T1 corresponding to the two components.
- FIG. 7 is a block diagram showing a specific configuration of the decoding unit 140 and the output data 20 of FIG.
- the decoding unit 140 includes an LSTM 141, an encoder / decoder model 142, and a sampling unit 143.
- the LSTM 141 includes a Tree-LSTM (see Non-Patent Document 4), for example, a Child-sum LSTM.
- the encoder / decoder model 142 receives the vector representation H from the RSTM 141 and the vector representation V from the image encoder 111 of FIG.
- the encoder / decoder model 142 converts a pair (h k , v k ) into a character string St k , and outputs output data 20 including character strings St 1 to St M , which are procedure string data.
- the modality of the output data 20 is a character string, which is different from the modality of the image string data 11 included in the input data 10.
- the character string St 1 represents "cut tomatoes into bite-sized pieces.”
- the character string St 2 represents “Fry the pumpkin in a frying pan.”
- the character string St 3 represents “put the pumpkin on the tomato.”
- the character string St 4 represents “apply ketchup and mayonnaise.”
- the output data 20 indicates that cooking is performed in the order of the character strings St 1 to St M. That is, the character strings St 1 to St M are ordered in this order.
- words are output using the Gumbel-Softmax function.
- the learning unit 150 optimizes the decoding unit 140 and the encoding unit 100 by backpropagation that minimizes the loss function L1 represented by the following equation (5).
- Loss function L 1 is the overall error caused in the process of the processes to the decoder 140 from the encoding unit 100 described above, is defined as the sum of the loss function L T and L P.
- Loss function L T defines the cross entropy error between adjacent matrices X, Y and a prepared correct matrix (correct graph structure) outputted from the encoding unit 100.
- Loss function L P defines the cross entropy difference from the correct data prepared in advance and the output data outputted from the decoding unit 140.
- the loss function L1 can be differentiated even by the process of determining the graph structure by the sampling unit 130, so that the error between the output data 20 and the correct answer data can be detected from the output layer of the decoding unit 140 to the input layer of the encoding unit 100.
- Backpropagation allows backpropagation.
- the decoding unit 140 and the encoding unit 100 can be optimized end-to-end from the output layer of the decoding unit 140 to the input layer of the encoding unit 100, so that the accuracy of the graph structure as an intermediate representation and the output data can be performed.
- FIG. 8 is a flowchart showing the flow of the machine learning method performed in the information processing device 1.
- the encoding unit 100 extracts the feature amount of the element (vertex) included in the input data 10 and proceeds to the process in S12.
- the encoding unit 100 calculates the likelihood that an edge exists between the two vertices by using the cosine similarity of the two vertices. In calculating the likelihood, a similarity or distance other than the cosine similarity may be used.
- the sampling unit 130 performs a reparameterization trick using the Gumbel-Softmax function to determine the graph structure.
- the decoding unit 140 generates output data from the graph structure from the sampling unit 130 and the feature amount of each vertex from the encoding unit 100.
- Learning unit 150 step S15 is the back propagation of the loss function L 1 minimization subject to optimize the parameters contained in each of the decoding unit 140 and the encoding unit 100, and ends the machine learning method.
- the parameters include the weights and biases of the neural networks included in the decoding unit 140 and the encoding unit 100.
- the information processing device and the machine learning method according to the first embodiment it is possible to improve the accuracy of the model that extracts the graph structure as an intermediate representation from the input data.
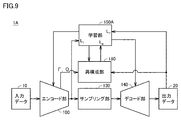
- FIG. 9 is a block diagram showing the configuration of the information processing device 1A according to the modified example of the first embodiment.
- the configuration of the information processing device 1A is such that the reconstruction unit 160 is added to the configuration of the information processing device 1 of FIG. 1, and the learning unit 150 is replaced with 150A. Other than these, the explanation is not repeated because it is the same.
- the reconstruction unit 160 receives the output data 20 and the vector representations ⁇ and ⁇ from the encoding unit 100.
- FIG. 10 is a block diagram showing a specific configuration of the reconstruction unit 160 of FIG.
- the biLSTM161, 162 and the matrix estimator 163 are included.
- biLSTM161 receives the output data 20, for each of the strings St 1 ⁇ St M, outputs a feature vector obtained by combining the first hidden layer and the last hidden layer.
- the feature vectors ⁇ 1 to ⁇ M correspond to the character strings St 1 to St M, respectively.
- the matrix estimator 163 receives the vector representations ⁇ , ⁇ , ⁇ and estimates the adjacency relationship of the character strings Tx 1 to Tx M and the character strings St 1 to St M as the adjacency matrix C, and the images Im 1 to Im M. And the adjacency relationship of the character strings St 1 to St M is estimated as the adjacency matrix D.
- the adjacency matrices C and D are expressed as the following equations (6) and (7), respectively.
- the loss function L that defines the error between the correct matrix used for calculating the error of the adjacency matrices X and Y output from the encoding unit 100 and the adjacency matrices C and D is defined. Add R to the loss function L1.
- the loss function L2 that defines the overall error in the modified example of the first embodiment is expressed by the following equation (8).
- the coefficient ⁇ of the loss function L2 is a hyperparameter.
- the loss function L R is the adjacency matrix C, D and the adjacent matrix X, may be a loss function that defines the error between Y (correct data).
- the learning unit 150A optimizes the parameters included in each of the reconstruction unit 160, the decoding unit 140, and the encoding unit 100 by backpropagation that minimizes the loss function L2.
- Table 1 below shows a comparison of the comparative example, the first embodiment, and the modified example of the first embodiment with respect to the accuracy of the output data 20.
- GLACNet GLocal Attention Cascading Networks
- BLEU Bit-Lingual Evaluation Understudy
- BLEU4 ROUGE-L (Recall-Oriented Understudy for Visiting Evaluation Longest common subsequence)
- CIDEr Consensus-based Image Description Evaluation
- MEOR which are automatic evaluation scales. Each score of (Metric for Evaluation of Translation with Explicit ORdering) is shown.
- the performance of the first embodiment exceeds the performance of the comparative example in each automatic evaluation scale. Further, the performance of the modified example of the first embodiment exceeds the performance of the first embodiment.
- the accuracy of the model for extracting the graph structure as an intermediate representation from the input data can be further improved as compared with the first embodiment.
- the graph structure extracted from the input data is not limited to the tree structure, and may be, for example, an N-part graph structure (N is a natural number of 2 or more).
- N is a natural number of 2 or more.
- the second embodiment as an example of the N-part graph structure, a configuration in which the bipartite graph structure is extracted from the input data will be described.
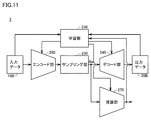
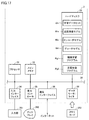
- FIG. 11 is a block diagram showing the configuration of the information processing device 2 according to the second embodiment.
- the information processing apparatus 2 includes an encoding unit 200, a sampling unit 230, a decoding unit 240, a learning unit 250, and an inference unit 270.
- the encoding unit 200, the sampling unit 230, the decoding unit 240, and the learning unit 250 form a VAE (Variational Autoencoder).
- the encoding unit 200 extracts the features of each of the plurality of vertices of the graph structure included in the input data 10B.
- the encoding unit 200 divides the plurality of vertices into two subsets Sb 1 and Sb 2 having no common vertices.
- the encoding unit 200 calculates the likelihood that an edge exists between the vertices included in the subset Sb 1 and the vertices included in the subset Sb 2 , and uses an adjacency matrix having the likelihood as a component in the sampling unit 230. Output. That is, the encoding unit 200 performs bipartite graph matching between the subsets Sb 1 and Sb 2.
- the sampling unit 230 performs a reparameterization trick using the Gumbel-Softmax function on the adjacency matrix from the encoding unit 200, determines the bipartite graph structure Bp, and determines the bipartite graph structure Bp and the bipartite graph structure Bp.
- the feature amount of each of the plurality of vertices included in is output to the decoding unit 240 and the inference unit 270.
- the decoding unit 240 reproduces the output data 20B from the bipartite graph structure Bp and the feature amount.
- the inference unit 270 performs inference based on the bipartite graph structure Bp and the feature amount, and outputs the inference result.
- the inference unit 270 includes, for example, a GNN (Graph Neural Network).
- the learning unit 250 optimizes the inference unit 270, the decoding unit 240, and the encoding unit 200 by backpropagation.
- the loss function to be minimized in backpropagation includes an error between the output data 20B and the input data 10B (correct answer data), and an error between the inference result of the inference unit 270 and the correct answer data included in the training data set. That is, the learning unit 250 performs semi-supervised learning on the inference unit 270, the decoding unit 240, and the encoding unit 200. Specifically, the learning unit 250 performs unsupervised learning on the decoding unit 240 and the encoding unit 200, and supervised learning on the inference unit 270.
- the main purpose of the information processing device 2 is to output the inference result by the inference unit 270.
- the optimization of the VAE formed by the encoding unit 200, the sampling unit 230, the decoding unit 240, and the learning unit 250 is positioned as a subtask for realizing lossless compression from the input data 10B to the bipartite graph structure.
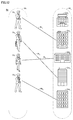
- FIG. 12 is a diagram showing an example of a bipartite graph structure Bp between a plurality of users and a plurality of companies extracted from the input data 10B.
- the correlation between the user Us 1 , Us 2 , Us 3 , Us 4 and the enterprise Cm 1 , Cm 2 , Cm 3 , Cm 4 , Cm 5 is shown.
- the user Us 1 and the company Cm 2 are connected by the side Rs 1.
- the user Us 2 and the company Cm 4 are connected by the side Rs 2. It is connected by the user Us 3 and enterprises Cm 3 Togahen Rs 3.
- FIG. 13 is a diagram showing a matrix representing the bipartite graph structure Bp shown in FIG.
- the inference unit 270 of FIG. 11 receives the bipartite graph structure Bp, infers a company that matches the needs of each user, and recommends the company to the user.
- the information processing device and the machine learning method according to the second embodiment it is possible to improve the accuracy of the model that extracts the graph structure as an intermediate representation from the input data.
- a plurality of sensors are structured as a graph structure based on the time series data of the detection values of the plurality of sensors in the plurality of processes included in the manufacturing equipment, and a defect occurring in the product occurs in which process.
- the configuration for specifying the above will be described.
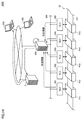
- FIG. 14 is a schematic view showing a configuration example of the management system 3000 according to the third embodiment.
- the management system 3000 is associated with a manufacturing facility 30 that includes a plurality of steps and provides a function for controlling the quality of products manufactured by the manufacturing facility 30.
- five consecutive steps Pr 1 , Pr 2 , Pr 3 , Pr 4 , and Pr 5 are shown along the conveyor 307 for transporting the workpiece.
- the work passes in the order of steps Pr 1 to Pr 5.
- Sensors for detecting the state of the process are installed in each of the steps Pr 1 to Pr 5.
- PLCs Programmable Logic Controllers
- the PLCs 301 to 305 are connected so that data communication is possible via the local network 306.
- the PLCs 301 to 305 transmit state information regarding the process to be controlled to the relay server device 308 on the local network 306 for each predetermined period or each event.
- the state information includes time-series data (sensor time-series data) of a plurality of detected values detected at a plurality of sampling times by a sensor provided in the process.
- the relay server device 308 transfers the state information from each of the PLCs 301 to 305 to the collection / analysis server device 3 (information processing device) via the Internet.
- the relay server device 308 may perform necessary preprocessing on the state information.
- the collection analysis server device 3 collects the status information received from the relay server device 308 and analyzes the collected information.
- the collection and analysis server device 3 outputs the analysis result to the terminal device 309 via the Internet when a predetermined condition is satisfied or when a request is received from the terminal device 309.
- a PLC is provided in each of a plurality of processes installed in the single manufacturing facility 30, and each PLC is connected to the relay server device 308 via the same local network 306.
- the configuration is illustrated, but it is not limited to this.
- a configuration in which a plurality of PLCs are directly connected to the collection / analysis server device 3 may be adopted without arranging the relay server device 308.
- each PLC transmits necessary information to the collection / analysis server device 3.
- a plurality of relay server devices 308 may be provided.
- a relay server device 308 transfers the status information from a part of the PLCs to the collection / analysis server device 3, and another relay server device 308 transfers the status information from the remaining PLCs to the collection / analysis server device 3. You may want to transfer it.
- FIG. 15 is a schematic view showing an example of the hardware configuration of PLCs 301 to 305 constituting the management system 3000 of FIG.
- each of the PLCs 301 to 305 includes an arithmetic unit 310 and one or more functional units 320.
- the arithmetic unit 310 is an arithmetic unit that executes a user program or the like stored in advance, acquires a field signal (information indicating the state of equipment to be controlled, etc.) from the functional unit 320, and performs necessary control through the functional unit 320. Output a signal.
- the arithmetic unit 310 controls the exchange of data via the processor 312 that executes the user program and the like, the memory 316 that stores the user program, the operating system (OS: Operating System), various data, and the like, and the internal bus 326. It includes a bus controller 314 and a communication interface 318.
- the memory 316 may be configured by combining a volatile storage device such as a DRAM (Dynamic Random Access Memory) and a non-volatile storage device such as a flash memory.
- the processor 312 acquires the detected value from the sensor 315 installed in the process corresponding to each of the PLCs 301 to 305.
- the detected value includes, for example, a current value, a voltage value, a power value, a temperature, a humidity, or a vibration value.
- a plurality of sensors 315 may be provided in one step.
- the communication interface 318 may be provided with one or more communication ports depending on the device to which data is exchanged. For example, it supports a communication port that follows Ethernet (registered trademark) for connecting to a local network 306 (see FIG. 14), a communication port that follows USB (Universal Serial Bus) for connecting to a personal computer, or a serial line / parallel line. A communication port or the like may be implemented.
- Ethernet registered trademark
- USB Universal Serial Bus
- the functional unit 320 may provide an IO (Input Output) function for exchanging various information with the equipment to be controlled.
- functions such as DI (Digital Input) that receives digital signals, DO (Digital Output) that outputs digital signals, AI (Analog Input) that receives analog signals, and AO (Analog Output) that outputs analog signals. May be implemented. Further, special functions such as PID (Proportional Integral Derivative) control or motion control may be implemented.
- each of the functional units 320 that provides the IO function includes an IO module 322 and a bus controller 324 for controlling the exchange of data between the arithmetic unit 310 via the internal bus 326.
- Each of the IO modules 322 acquires the state information from the process to be controlled and sends the state information to the relay server device 308 and the collection / analysis server device 3 through the arithmetic unit 310.
- any PLC may be adopted as long as it has an interface for outputting internal information to an external device by using some kind of communication means.
- the hardware configuration of the PLC is not limited to the configuration shown in FIG. 15, and any configuration can be adopted. In reality, it is assumed that the manufacturers and models are not unified among the plurality of PLCs arranged in the manufacturing equipment 30 shown in FIG. In the management system 3000, the relay server device 308 absorbs such a difference in PLC manufacturer and model.
- FIG. 16 is a block diagram showing a functional configuration of the collection / analysis server device 3 of FIG.
- the collection analysis server device 3 includes an encoding unit 300, a sampling unit 330, a decoding unit 340, and a quality inspection unit 370 (inference unit).
- the input data 10C includes sensor time series data from PLCs 301 to 305.
- the encoding unit 300, the sampling unit 330, the decoding unit 340, and the learning unit 350 form a VAE (Variational Autoencoder).
- the encoder unit 300 includes an encoder model Mc.
- the encoder model Mc extracts a graph structure representing the correlation between the sensors included in the input data 10C from the input data 10C.
- the encoding unit 300 extracts the feature amounts of each of the plurality of sensors, which are the vertices of the graph structure, from the sensor time series data.
- the encoding unit 300 calculates the likelihood that an edge exists between two vertices included in the plurality of vertices, and outputs an adjacency matrix having the likelihood as a component to the sampling unit 330.
- the sampling unit 330 performs a reparameterization trick using the Gumbel-Softmax function on the adjacency matrix from the encoding unit 300, determines the graph structure Gs, and determines each of the graph structure Gs and the plurality of vertices of the graph structure Gs. Is output to the decoding unit 340 and the quality inspection unit 370.
- the decoding unit 340 includes a decoder model Md.
- the decoder model Md reproduces the output data 20C from the graph structure Gs and the feature amount.
- the quality inspection unit 370 includes the quality inspection model Mm.
- the quality inspection model Mm calculates quality data representing the quality of the product based on the graph structure Gs and the feature quantity.
- the quality inspection unit 370 includes, for example, GNN.
- the quality inspection unit 370 visualizes the error between the quality data and the standard quality data in the graph structure Gs.
- Standard quality data is standard quality data corresponding to a normal product. The larger the error between the quality data and the standard quality data, the greater the degree of defects included in the quality data.
- heat mapping of the error using GradCAM Gradient-weighted Class Activation Mapping
- the learning unit 350 optimizes the neural network parameters included in each of the quality check model Mm, the decoder model Md, and the encoder model Mc by backpropagation.
- the parameters include the weights and biases of the neural network.
- the loss function to be minimized in backpropagation includes an error between the output data 20C and the input data 10C (correct answer data), and an error between the inspection result of the quality inspection unit 370 and the correct answer quality data included in the training data set. .. That is, the learning unit 350 performs semi-supervised learning on the quality inspection unit 370, the decoding unit 340, and the encoding unit 300. Specifically, the learning unit 350 performs unsupervised learning for the decoding unit 340 and the encoding unit 300, and supervised learning for the quality inspection unit 370.
- the main purpose of the collection analysis server device 3 is to output the inspection results by the quality inspection unit 370.
- the optimization of the VAE formed by the encoding unit 300, the sampling unit 330, the decoding unit 340, and the learning unit 350 is positioned as a subtask for realizing lossless compression from the input data 10C to the graph structure.
- FIG. 17 is a block diagram showing a hardware configuration of the collection / analysis server device 3 of FIG.
- the collection / analysis server device 3 includes a processor 31 which is an arithmetic processing unit, a main memory 32 and a hard disk 33 as a storage unit, an input interface 34, a display controller 35, and a communication interface 36. , Data reader / writer 38 and so on. Each of these parts is connected to each other via a bus 39 so as to be capable of data communication.
- the processor 31 includes a CPU (Central Processing Unit).
- the processor 31 may further include a GPU (Graphics Processing Unit).
- the processor 31 expands the programs (codes) stored in the hard disk 33 into the main memory 32 and executes them in a predetermined order to perform various operations.
- the main memory 32 is typically a volatile storage device such as a DRAM (Dynamic Random Access Memory).
- the main memory 32 holds the program read from the hard disk 33.
- the input interface 34 mediates data transmission between the processor 31 and the input unit 361.
- the input unit 361 includes, for example, a mouse, a keyboard, or a touch panel. That is, the input interface 34 receives an operation command given by the user operating the input unit 361.
- the display controller 35 is connected to a display 362, which is a typical example of a display device, and notifies the user of the result of image processing in the processor 31 and the like. That is, the display controller 35 is connected to the display 362 and controls the display on the display 362.
- the display 362 is, for example, a liquid crystal display, an organic EL (Electro Luminescence) display, or other display device.
- the communication interface 36 mediates data transmission via the Internet between the processor 31 and another external device.
- the communication interface 36 typically includes Ethernet (registered trademark) or USB (Universal Serial Bus).
- the data reader / writer 38 mediates data transmission between the processor 31 and the memory card 363, which is a recording medium.
- the memory card 363 stores, for example, a program executed by the collection analysis server device 3.
- the data reader / writer 38 reads the program from the memory card 363.
- the memory card 363 is a general-purpose semiconductor storage device such as CF (Compact Flash) or SD (Secure Digital), a magnetic storage medium such as a flexible disk (Flexible Disk), or a CD-ROM (Compact Disk Read Only Memory). ) And other optical storage media. If necessary, another output device such as a printer may be connected to the collection / analysis server device 3.
- the hard disk 33 is a non-volatile magnetic storage device.
- the learning data set Ds, the quality inspection model Mm, the encoder model Mc, the decoder model Md, the machine learning program Pg1, and the quality inspection program Pg2 are stored in the hard disk 33.
- Various setting values and the like may be stored in the hard disk 33.
- a semiconductor storage device such as a flash memory may be adopted.
- the learning data set Ds includes a plurality of learning data.
- Each of the plurality of training data is a combination of time series data of the values detected by the sensors of the plurality of processes through which the product has passed, and correct answer quality data corresponding to the quality of the product.
- the learning data set Ds, the encoder model Mc, the decoder model Md, and the quality inspection model Mm are referred to.
- the processor 31 that executes the machine learning program Pg1 realizes the encoding unit 300, the sampling unit 330, the decoding unit 340, the learning unit 350, and the quality inspection unit 370 of FIG.
- the processor 31 fits each of the encoder model Mc, the decoder model Md, and the quality inspection model Mm into trained by executing the machine learning program Pg1.
- the encoder model Mc and the quality inspection model Mm are referred to.
- the processor 31 calculates the quality data of the product from the sensor time series data corresponding to the product, and visualizes the error between the quality data and the reference quality data in the graph structure Gs.
- the error visualized in the graph structure Gs of the error is output to the display 362 and the terminal device 309.
- FIG. 18 is a diagram showing an example of the graph structure Gs visualized together with the error of the quality data and the standard quality data.
- the vertices Sn 1 to Sn 5 correspond to the sensors provided in each of the steps Pr 1 to Pr 5 of FIG. The darker the hatching, the more the detection value of the sensor corresponding to the vertex deviates from the normal value.
- the vertices Sn 3 are connected to Sn 1 , Sn 2 , and Sn 4.
- Vertex Sn 5 is connected to vertex Sn 2.
- the vertices Sn 2 are the darkest, and the vertices Sn 1 and Sn 4 are the lightest.
- the side connecting the vertices Sn 2 and Sn 3 and the side connecting the vertices Sn 2 and Sn 5 are emphasized thicker than the other sides.
- the graph structure Gs in which the error is visualized shows the correlation of the detected values of a plurality of sensors, and the detected values of the sensors that contribute to the defects (error between the quality data and the standard quality data) contained in the product. Is shown. In FIG.
- the detection value of the sensor that contributes most to the defect contained in the product is the detection value of the sensor provided in the step Pr 2 corresponding to the apex Sn 2. Therefore, there is a high possibility that a problem has occurred in the process Pr 2. Further, in the steps Pr 3 and Pr 5 corresponding to the vertices Sn 3 and Sn 5 connected to the vertices Sn 2 in the graph structure Gs, there is a possibility that a defect occurs next to the step Pr 2. In the steps Pr 1 and Pr 4 corresponding to the vertices Sn 1 and Sn 4 , respectively, the possibility that a defect has occurred is the lowest. According to the graph structure Gs in which the error is visualized, it is possible to easily identify the process that causes the defect included in the product completed through a plurality of processes.
- the information processing device and the machine learning method according to the third embodiment it is possible to improve the accuracy of the model that extracts the graph structure as an intermediate representation from the input data.
- FIG. 19 is a diagram for explaining route planning by the robot Rb corresponding to the information processing device according to the embodiment.
- the field of view of the robot Rb includes passersby Ps1, Ps2, and Ps3.
- Passerby Ps1 is looking at passerby Ps2.
- Passerby Ps2 is looking at passerby Ps3.
- Passerby Ps3 is looking at passerby Ps2.
- the robot Rb peaks each of the passersby Ps1 to Ps3 based on the posture, line-of-sight direction, and the relative positional relationship of the passersby Ps1 to Ps3 included in the visual field moving image which is time series data. Extract the directed graph structure.
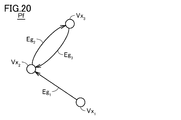
- FIG. 20 is a diagram showing a directed graph structure Pf extracted by the robot Rb of FIG.
- the vertices Vx 1 , Vx 2 , and Vx 3 correspond to the passersby Ps 1 , Ps 2 , and Ps 3 in FIG. 19, respectively.
- the apex Vx 1 and the apex Vx 2 are connected by an edge Eg 1 from the apex Vx 1 to Vx 2.
- the vertex Vx 2 and vertex Vx 3 are connected by edges Eg 3 extending from the edges Eg 2 and vertex Vx 3 directed from the vertex Vx 2 to Vx 3 to Vx 2.
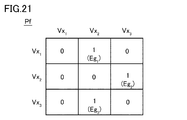
- FIG. 21 is a diagram showing a matrix representation corresponding to the directed graph structure Pf of FIG. Robot Rb inputs a directed graph structure Pf shown in FIG. 21 in the inference unit performs pedestrian flow prediction for passers-Ps 1 ⁇ Ps 3, the route Rt passers Ps 1 ⁇ Ps 3 avoidable 19 To plan.
- the inference unit includes, for example, a Social GAN (Generative Adversarial Network).
- the information processing device and machine learning method according to the embodiment can also be applied to the prediction of traffic congestion.
- the traffic volume at multiple points connected by roads is used as time-series input data, and each of the multiple points at each time is set as the peak from the input data over different times.
- a graph structure with the relationship of traffic volume between two points as an edge is extracted. That is, the graph structure is extracted from the input data as a result of N-part graph matching in which a plurality of points at each time are a subset of the vertex set.
- the information processing device predicts traffic congestion at each point at a specific time based on the graph structure.
- the information processing device and machine learning method according to the embodiment can also be applied to Materials Informatics (MI).
- MI Materials Informatics
- the physical properties of the molecular structure are estimated by associating the vertices and sides of the graph structure extracted from the input data with the atoms and bonds of the molecular structure.
- a graph structure (Tr, Bp, Gs, Pf) representing the correlation between the elements included in the input data (10, 10B, 10C) is extracted from the input data (10, 10B, 10C), and the graph structure (Tr) is extracted.
- Bp, Gs, Pf which is an information processing device (1,1A, 2,3) that generates output data (20, 20B, 20C).
- the features ( ⁇ , ⁇ , ⁇ , ⁇ ) of each of ⁇ Cm 5 , Sn 1 to Sn 5 , Vx 1 to Vx 3 ) are extracted, and the sides (Br 1 to Br 7 ,
- Decoding unit (140, 240, 340) that receives the graph structure (Tr, Bp, Gs, Pf) and the feature amount ( ⁇ , ⁇ , ⁇ , ⁇ ) and generates the output data (20, 20B, 20C).
- a reconstruction unit (160) for reconstructing the graph structure (Tr) from the output data (10) is further provided.
- the loss function comprising said error (L R) and the output from the reconstruction unit (160) and the correct graph structure, the information processing apparatus according to Structure 1 (1A).
- the inference unit (270,370) that receives the graph structure (Bp, Gs) from the sampling unit (230, 330) and outputs the inference result for the input data (10B, 10C) is further provided.
- the learning unit (250, 350) performs unsupervised learning on the decoding unit (240, 340) and the encoding unit (100, 200), and supervised the inference unit (270, 370).
- the information processing apparatus (2, 3) according to the configuration 1 or 2, which performs unsupervised learning.
- the input data (10) includes the first data (11) and the second data (12).
- the modality of the first data (11) is different from the modality of the second data (12).
- the encoding unit (100) The first encoder (110) for extracting the features ( ⁇ , ⁇ ) of the first data (11) and
- the information processing apparatus (1, 1A) according to any one of configurations 1 to 3, which includes a second encoder (120) for extracting a feature amount ( ⁇ ) of the second data (12).
- a graph structure (Tr, Bp, Gs, Pf) representing the correlation between the elements included in the input data (10, 10B, 10C) is extracted from the input data (10, 10B, 10C), and the graph structure (Tr) is extracted.
Landscapes
- Engineering & Computer Science (AREA)
- Theoretical Computer Science (AREA)
- Physics & Mathematics (AREA)
- Data Mining & Analysis (AREA)
- General Health & Medical Sciences (AREA)
- Biomedical Technology (AREA)
- Biophysics (AREA)
- Computational Linguistics (AREA)
- Life Sciences & Earth Sciences (AREA)
- Evolutionary Computation (AREA)
- Artificial Intelligence (AREA)
- Molecular Biology (AREA)
- Computing Systems (AREA)
- General Engineering & Computer Science (AREA)
- General Physics & Mathematics (AREA)
- Mathematical Physics (AREA)
- Software Systems (AREA)
- Health & Medical Sciences (AREA)
- Image Analysis (AREA)
Abstract
入力データからグラフ構造を中間表現として抽出するモデルの精度を向上させる。エンコード部(100)は、入力データ(10)からグラフ構造(Tr)に含まれる複数の頂点の各々の特徴量を抽出し、当該頂点に辺が接続されている尤度を算出する。サンプリング部(130)は、当該尤度に対するGumbel-Softmax関数の変換結果に基づいてグラフ構造(Tr)を決定する。学習部(150)は、グラフ構造(Tr)から生成された出力データ(20)と正解データとの誤差(LP)を含む損失関数を用いるバックプロパゲーションによってデコード部(140)およびエンコード部(100)を最適化する。
Description
本開示は、情報処理装置、および機械学習方法に関する。
従来、入力データに含まれる要素間の関係をグラフ構造として抽出し、当該グラフ構造を中間表現として後処理を行う構成が知られている。たとえば、非特許文献1には、REINFORCE(REward Increment Nonnegative Factor Offset Reinforcement Characteristic Eligibility)アルゴリズムによって構文木を生成し、当該構文木により構造化されたデータを中間表現としてVAE(Variational Autoencoder)による再構成を行う構成が開示されている。
Pengcheng Yin, Chunting Zhou, Junxian He, Graham Neubig, "StructVAE: Tree-structured Latent Variable Models for Semi-supervised Semantic Parsing" (https://www.aclweb.org/anthology/P18-1070/), in Proceedings of the 56th Annual Meeting of the Association for Computational Linguistics (Volume 1: Long Papers), pp. 754-765.
Eric Jang, Shixiang Gu, Ben Poole, "Categorical Reparameterization with Gumbel-Softmax", https://openreview.net/forum?id=rkE3y85ee, ICLR (International Conference on Learning Representations) 2017.
Jianlong Chang, Xinbang Zhang, Yiwen Guo, Gaofeng Meng, Shiming Xiang, Chunhong Pan, "Differentiable Architecture Search with Ensemble Gumbel-Softmax", https://arxiv.org/abs/1905.01786.
Kai Sheng Tai, Richard Socher, Christopher D. Manning, "Improved Semantic Representations From Tree-Structured Long Short-Term Memory Networks", https://www.aclweb.org/anthology/P15-1150/, in Proceedings of the 53rd Annual Meeting of the Association for Computational Linguistics and the 7th International Joint Conference on Natural Language Processing (Volume 1: Long Papers), pp. 1556-1566.
非特許文献1において用いられるREINFORCEアルゴリズムを含む強化学習においては、最適化対象のモデル(エージェント)が試行錯誤を繰り返しながらパラメータの最適化を進めるため、モデルの出力に対する正解の特定が困難な場合がある。そのため、強化学習には、モデルからの出力と正解との誤差を規定する損失関数を微分して、連鎖律に基づいてモデルの出力層から入力層に向かって当該誤差を伝播させるバックプロパゲーションを用いる機械学習よりもモデルの精度を向上させることが難しい場合があることが知られている。非特許文献1に開示されている構成には機械学習によって形成される学習済みモデルの精度に改善の余地がある。
本開示は上記のような課題を解決するためになされたものであり、その目的は、入力データからグラフ構造を中間表現として抽出するモデルの精度を向上させることである。
本開示の一例に係る情報処理装置は、入力データに含まれる要素間の相関関係を表すグラフ構造を入力データから抽出し、グラフ構造から出力データを生成する。情報処理装置は、エンコード部と、サンプリング部と、デコード部と、学習部とを備える。エンコード部は、入力データからグラフ構造に含まれる複数の頂点の各々の特徴量を抽出し、当該頂点に相関関係を表す辺が接続されている尤度を算出する。サンプリング部は、尤度に対するGumbel-Softmax関数の変換結果に基づいて、グラフ構造を決定する。デコード部は、グラフ構造、および複数の頂点の各々の特徴量を受けて出力データを生成する。学習部は、出力データと正解データとの誤差を含む損失関数を最小化対象とするバックプロパゲーションによって、デコード部およびエンコード部を最適化する。
この開示によれば、サンプリング部によるグラフ構造の決定処理によっても損失関数は微分可能となるため、出力データと正解データとの誤差をデコード部の出力層からエンコード部の入力層までバックプロパゲーションによって逆伝播させることが可能になる。その結果、デコード部およびエンコード部の最適化を、デコード部の出力層からエンコード部の入力までエンドツーエンドに行うことができるため、中間表現としてのグラフ構造の精度および出力データの精度を向上させることができる。
上述の開示において、情報処理装置は、出力データからグラフ構造を再構成する再構成部をさらに備えてもよい。損失関数は、再構成部からの出力と正解グラフ構造との誤差を含んでもよい。
この開示によれば、再構成部によって再構成されたグラフ構造と正解グラフ構造との間に同一性が維持されるように機械学習が行われることにより、エンコード部によるロスレス圧縮(可逆圧縮)が促進される。その結果、中間表現としてのグラフ構造の精度および出力データの精度を構成1よりもさらに向上させることができる。
上述の開示において、サンプリング部からグラフ構造を受けて、入力データに対する推論結果を出力する推論部をさらに備えてもよい。学習部は、デコード部およびエンコード部に対しては教師なし学習を行い、推論部に対しては教師あり学習を行ってもよい。
この開示によれば、エンコード部によるロスレス圧縮が促進されるとともに、推論部に対する教師あり学習によって推論部の推論精度を向上させることができる。
上述の開示において、入力データは、第1データおよび第2データを含んでもよい。第1データのモダリティは、第2データのモダリティとは異なってもよい。エンコード部は、第1エンコーダと、第2エンコーダとを含んでもよい。第1エンコーダは、第1データの特徴量を抽出してもよい。第2エンコーダは、第2データの特徴量を抽出してもよい。
この開示によれば、多様な入力データからグラフ構造を抽出することができる。
上述の開示において、出力データのモダリティは、入力データのモダリティとは異なってもよい。
上述の開示において、出力データのモダリティは、入力データのモダリティとは異なってもよい。
この開示によれば、グラフ構造から多様なデータを生成することができる。
本開示の他の例に係る機械学習方法は、入力データに含まれる要素間の相関関係を表すグラフ構造を入力データから抽出し、グラフ構造から出力データを生成するモデルに対して、記憶部に保存された機械学習プログラムを実行するプロセッサによって行われる。機械学習方法は、入力データからグラフ構造に含まれる複数の頂点の各々の特徴量を抽出し、当該頂点に相関関係を表す辺が接続されている尤度を算出するステップと、尤度に対するGumbel-Softmax関数の変換結果に基づいて、グラフ構造を決定するステップと、グラフ構造、および複数の頂点の各々の特徴量を受けて出力データを生成するステップと、出力データと正解データとの誤差を含む損失関数を最小化対象とするバックプロパゲーションによって、モデルを最適化するステップとを含む。
本開示の他の例に係る機械学習方法は、入力データに含まれる要素間の相関関係を表すグラフ構造を入力データから抽出し、グラフ構造から出力データを生成するモデルに対して、記憶部に保存された機械学習プログラムを実行するプロセッサによって行われる。機械学習方法は、入力データからグラフ構造に含まれる複数の頂点の各々の特徴量を抽出し、当該頂点に相関関係を表す辺が接続されている尤度を算出するステップと、尤度に対するGumbel-Softmax関数の変換結果に基づいて、グラフ構造を決定するステップと、グラフ構造、および複数の頂点の各々の特徴量を受けて出力データを生成するステップと、出力データと正解データとの誤差を含む損失関数を最小化対象とするバックプロパゲーションによって、モデルを最適化するステップとを含む。
この開示によれば、グラフ構造を決定するステップによっても損失関数は微分可能となるため、出力データと正解データとの誤差をモデルの出力層からモデルの入力層までバックプロパゲーションによって逆伝播させることが可能になる。その結果、モデルの最適化を、モデルの出力層からモデルの入力層までエンドツーエンドに行うことができるため、中間表現としてのグラフ構造の精度および出力データの精度を向上させることができる。
本開示に係る情報処理装置および機械学習方法によれば、入力データからグラフ構造を中間表現として抽出するモデルの精度を向上させることができる。
以下、実施の形態について図面を参照しながら詳細に説明する。なお、図中同一または相当部分には同一符号を付してその説明は原則として繰り返さない。
<適用例>
[実施の形態1]
図1は、実施の形態1に係る情報処理装置1の構成を示すブロック図である。図1に示されるように、情報処理装置1は、エンコード部100と、サンプリング部130と、デコード部140と、学習部150とを備える。情報処理装置1は、入力データ10に含まれる要素間の相関関係を表すグラフ構造を入力データ10から抽出し、当該グラフ構造から出力データ20を生成する。実施の形態1では、調理の手順の画像列データおよび食材列データを含む入力データから、料理の手順列データを含む出力データを生成する場合について説明する。
[実施の形態1]
図1は、実施の形態1に係る情報処理装置1の構成を示すブロック図である。図1に示されるように、情報処理装置1は、エンコード部100と、サンプリング部130と、デコード部140と、学習部150とを備える。情報処理装置1は、入力データ10に含まれる要素間の相関関係を表すグラフ構造を入力データ10から抽出し、当該グラフ構造から出力データ20を生成する。実施の形態1では、調理の手順の画像列データおよび食材列データを含む入力データから、料理の手順列データを含む出力データを生成する場合について説明する。
図2は、図1の入力データ10およびエンコード部100の具体的な構成を説明するためのブロック図である。図2に示されるように、入力データ10は、画像列データ11(第1データ)と、食材列データ12(第2データ)とを含む。画像列データ11のモダリティは、画像である。食材列データ12のモダリティは、文字列である。画像列データ11のモダリティは、食材列データ12のモダリティとは異なる。なお、モダリティとは、データの形式、種類、あるいは型を含む。
画像列データ11は、画像Im1~ImMを含む。画像Im1~ImMの各々は、調理の各手順の画像を表し、画像Im1~ImMの順に調理が行われる。すなわち、画像Im1~ImMは、この順に順序付けられている。食材列データ12は、文字列Tx1~TxNを含む。文字列Tx1~TxNの各々は、食材名を表す。調理の過程において、文字列Tx1~TxNの順に使用される。すなわち、文字列Tx1~TxNは、この順に順序付けられている。図2においては、手順数Mが4であり、食材数Nが4である場合が示されている。文字列Tx1~Tx4は、「トマト」,「かぼちゃ」,「マヨネーズ」,「ケチャップ」をそれぞれ表す。なお、手順数Mは4に限定されず、3以下であってもよいし、5以上であってもよい。食材数Nも同様である。また、手順数Mと食材数Nとは異なっていてもよい。
エンコード部100は、エンコーダ110(第1エンコーダ)と、エンコーダ120(第2エンコーダ)とを含む。エンコーダ110は、学習済みの画像エンコーダ111と、biLSTM(bidirectional Long Short-Term Memory)112,113と、行列推定器114とを含む。エンコーダ120は、分散表現器121と、LSTM122と、biLSTM123と、行列推定器124とを含む。分散表現器121は、たとえばword2vecを含む。
画像エンコーダ111は、画像列データ11に含まれる画像Imkの特徴ベクトルvkを抽出し、ベクトル表現V=(v1,v2,…,vk,…,vM)(特徴量)を出力する。biLSTM112は、ベクトル表現Vを受けて、ベクトル表現Θ=(θ1,θ2,…,θk,…θM)(特徴量)を出力する。特徴ベクトルθ1~θMは、特徴ベクトルv1~vMにそれぞれ対応する。biLSTM113は、ベクトル表現Vを受けて、ベクトル表現Φ=(φ1,φ2,…,φk,…,φM)(特徴量)を出力する。特徴ベクトルφ1~φMは、特徴ベクトルv1~vMにそれぞれ対応する。なお、インデックスkは自然数である。
行列推定器114は、ベクトル表現Θ,Φを受けて、画像Im1~ImMの隣接関係を推定し、隣接行列Yとして出力する。画像Im1~ImMの隣接関係の推定とは、画像Im1~ImMの各々をグラフ構造の頂点として、2つの頂点間に辺が存在する尤度を算出することを意味する。隣接行列Yの成分Yi,jは以下の式(1)で表される。

エンコーダ120においては、ベクトル表現Θ,Φからベクトル表現Ω=(ω1,ω2,…,ωk,…,ωM)(特徴量)が算出され、ベクトル表現Ωが行列推定器124に入力される。特徴ベクトルωkの各次元の成分は、特徴ベクトルθk,φkの当該次元の成分のうち、大きい方の成分である。
分散表現器121は、食材列データ12に含まれる文字列Txkの分散表現を出力する。LSTM122は、文字列Txkの分散表現を特徴ベクトルgkに変換し、ベクトル表現G=(g1,g2,…,gk,…,gN)を出力する。biLSTM123は、ベクトル表現Gを受けて、ベクトル表現Γ=(γ1,γ2,…,γk,…,γN)(特徴量)を出力する。特徴ベクトルγ1~γNは、特徴ベクトルg1~gNにそれぞれ対応する。
行列推定器124は、ベクトル表現Ω,Γを受けて、画像Im1~ImMおよび文字列Tx1~TxNの隣接関係を推定し、当該隣接関係を隣接行列Xとして出力する。画像Im1~ImMおよび文字列Tx1~TxNの隣接関係の推定とは、文字列Tx1~TxNの各々をグラフ構造の頂点として、文字列Tx1~TxNの各々に対応する頂点と画像Im1~Im4の各々に対応する頂点との間に辺が存在する尤度を算出することを意味する。隣接行列Xの成分Xi,jは以下の式(2)で表される。

図3は、図2の隣接行列Yの模式図である。図3において各成分に付されているハッチングが濃いほど、当該成分の尤度が大きい。図3においては、行に含まれる頂点から列に含まれる頂点に向かう辺が存在するかの尤度が当該行および列によって特定される隣接行列の成分である。すなわち、隣接行列Yは、有向グラフ構造を表現している。列に含まれる頂点から行に含まれる頂点に向かう辺が存在するかの尤度が当該行および列によって特定される隣接行列の成分であってもよい。
有向グラフ構造を表す隣接行列Yは、必要に応じて無向グラフ構造を表す隣接行列Tに変換されてもよい。隣接行列Yの変換にあたっては、隣接行列Tの転置行列が隣接行列Tに等しくなるように、たとえば隣接行列Yの各成分と当該成分の行と列とを逆にした成分との平均値を当該2つの成分に対応する隣接行列Tの成分にすることができる。
図4は、図2の隣接行列Xの模式図である。ハッチングの濃さと尤度との関係は図3と同様である。図4においては、行に含まれる頂点と列に含まれる頂点との間に辺が存在するかの尤度が当該行および列によって特定される隣接行列の成分である。隣接行列Xは、無向グラフ構造を表現している。
再び図2を参照して、サンプリング部130は、隣接行列X,Yを受けて、文字列Tx1~TxNの各々に対応する頂点をリーフノードとし、画像列データ11における最後の画像に対応する頂点をルートノードとし、他の画像に対応する頂点をノードとするツリー構造Tr(グラフ構造)を出力する。サンプリング部130は、Gumbel-Softmax関数(非特許文献2参照)を用いて、隣接行列X,Yの各成分の尤度を当該成分に対応する2つの頂点間に辺が存在する確率に変換する(再パラメータ化トリック)。サンプリング部130は、再パラメータ化トリックにより、隣接行列X,Yを隣接行列A,Bにそれぞれ変換する。成分Ai,j,Bi,jは、以下の式(3),(4)のようにそれぞれ表される。
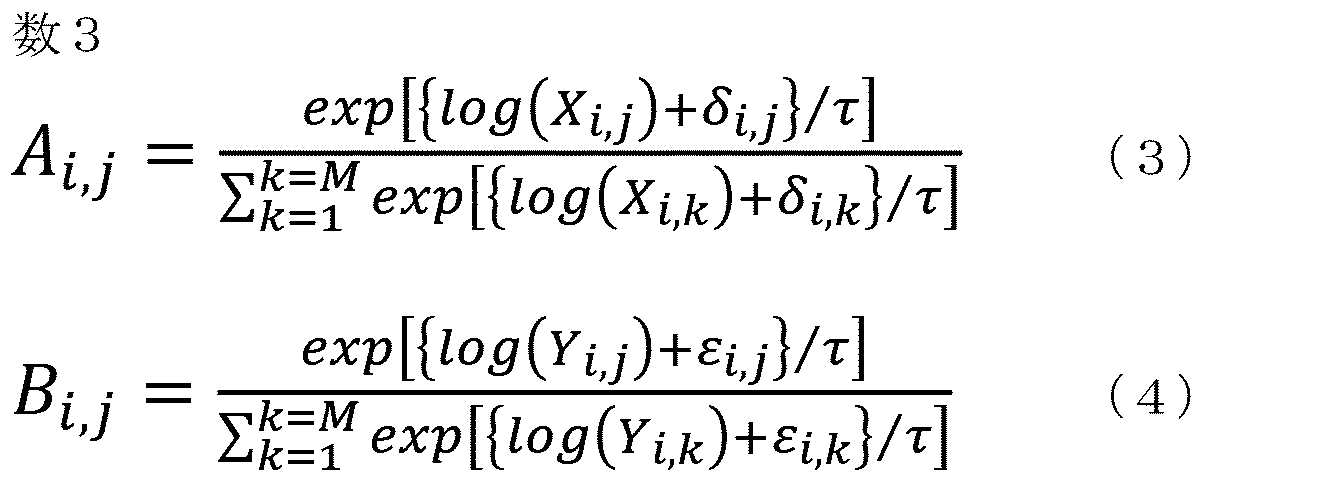
式(3),(4)において、δi,k,εi,kは、Gumbel(0,1)分布からサンプリングされたノイズである。τはGumbel-Softmax関数の温度パラメータである。サンプリング部130は、隣接行列A,Bを用いてノード間の枝(辺)の有無を決定し、ツリー構造Trを決定する。
図5は、図1のツリー構造Trを示す図である。図5において、ノードNd1~Nd4は、画像Im1~Im4にそれぞれ対応する。ノードNd4は、ルートノードである。リーフノードLf1~Lf4は、文字列Tx1~Tx4にそれぞれ対応する。
図5に示されるように、リーフノードLf1とノードNd1とは枝Br1によって接続されている。リーフノードLf2とノードNd2とは、枝Br2によって接続されている。リーフノードLf3とルートノードNd4とは、枝Br3によって接続されている。リーフノードLf4とルートノードNd4とは、枝Br4によって接続されている。ノードNd1とNd3とは、ノードNd1からNd3に向かう枝Br5によって接続されている。ノードNd2とNd3とは、ノードNd2からNd3に向かう枝Br6によって接続されている。ノードNd3とルートノードNd4とは、ノードNd3からルートノードNd4に向かう枝Br7によって接続されている。
ツリー構造Trは、画像Im1に示される手順の結果および画像Im2に示される手順の結果が、画像Im3に示される手順において使用され、画像Im3に示される手順の結果が画像Im4に示される手順において使用されることを示す。また、ツリー構造Trは、文字列Tx1の食材が画像Im1に示される手順において使用され、文字列Tx2の食材が画像Im2に示される手順において使用され、文字列Tx3,Tx4の各々の食材が画像Im4に示される手順において使用されることを示す。
図6は、図5のツリー構造Trを表現する隣接行列X1,Y1を示す図である。隣接行列X1,Y1は、それぞれ隣接行列A,Bを介して、サンプリング部130によって決定される。たとえば、サンプリング部130は、隣接行列A,Bの各行における最大値に対応する成分を1とし、それ以外の成分を0とし、各行をワンホット表現として隣接行列X1,Y1を決定する。入力データから抽出されるグラフ構造に含まれる頂点からの出辺の最大数または当該頂点への入辺の最大数が決定している場合には、Ensemble Gumbel-Softmax(非特許文献3参照)により、各行または各列が2個以上のワンホット表現の重ね合わせとして表現されてもよい。なお、グラフ構造の決定にあたっては、隣接行列X,Yの各成分の尤度に対するGumbel-Softmax関数を用いた再パラメータ化トリックの変換結果以外にも、抽出されるグラフ構造の特性も考慮され得る。たとえば、料理の手順を示すツリー構造Trにおいて或るノードから当該ノードへの辺(セルフループ)は許容されないため、隣接行列Y1の対角成分は0となる。また、ルートノードより階層が上のノードはツリー構造Trには存在しないため、隣接行列Y1においてルートノードに対応する第4行の各成分は0となる。
有向グラフ構造を表す隣接行列Y1は、必要に応じて無向グラフ構造を表す隣接行列T1に変換されてもよい。隣接行列Y1の変換にあたっては、隣接行列T1の転置行列が隣接行列T1に等しくなるように、たとえば隣接行列Y1の各成分と当該成分の行と列とを逆にした成分とのうちの最大値、最小値、またはいずれかがランダムに選択された値を当該2つの成分に対応する隣接行列T1の成分にすることができる。
図7は、図1のデコード部140および出力データ20の具体的な構成を示すブロック図である。図7に示されるように、デコード部140は、LSTM141と、エンコーダデコーダモデル142と、サンプリング部143とを含む。LSTM141は、Tree-LSTM(非特許文献4参照)を含み、たとえばChild-sum LSTMを含む。LSTM141は、ツリー構造Trにおける画像列データ11のk番目の手順に対応する特徴量をChild-sum LSTMのk番目の隠れ層から特徴ベクトルhkとして得て、ベクトル表現H=(h1,h2,…,hk,…,hM)を出力する。エンコーダデコーダモデル142は、LSTM141からベクトル表現Hを受けるとともに、図2の画像エンコーダ111からベクトル表現Vを受ける。エンコーダデコーダモデル142は、ペア(hk,vk)を文字列Stkに変換し、手順列データである文字列St1~StMを含む出力データ20を出力する。出力データ20のモダリティは、文字列であり、入力データ10に含まれる画像列データ11のモダリティとは異なる。文字列St1は、「トマトを一口大の大きさに切る。」を表す。文字列St2は、「かぼちゃをフライパンで炒める。」を表す。文字列St3は、「かぼちゃをトマトの上に乗せる。」を表す。文字列St4は、「ケチャップとマヨネーズをかける。」を表す。出力データ20は、文字列St1~StMの順に調理が行われることを表す。すなわち、文字列St1~StMは、この順に順序付けられている。なお、エンコーダデコーダモデル142においては、Gumbel-Softmax関数を用いて単語が出力される。
次に、図1の情報処理装置1において行われる機械学習処理について説明する。学習部150は、以下の式(5)のように表される損失関数L1を最小化対象とするバックプロパゲーションによって、デコード部140およびエンコード部100の最適化を行う。

損失関数L1は、上記において説明されたエンコード部100からデコード部140までの処理を行う過程で生じる全体の誤差を、損失関数LTとLPとの和として規定する。損失関数LTは、エンコード部100から出力される隣接行列X,Yと予め用意された正解行列(正解グラフ構造)との交差エントロピー誤差を規定する。損失関数LPは、デコード部140から出力される出力データと予め用意された正解データとの交差エントロピー誤差を規定する。再パラメータ化トリックにより、サンプリング部130によるグラフ構造の決定処理によっても損失関数L1は微分可能となるため、出力データ20と正解データとの誤差をデコード部140の出力層からエンコード部100の入力層までバックプロパゲーションによって逆伝播させることが可能になる。その結果、デコード部140およびエンコード部100の最適化を、デコード部140の出力層からエンコード部100の入力層までエンドツーエンドに行うことができるため、中間表現としてのグラフ構造の精度および出力データの精度を向上させることができる。
図8は、情報処理装置1において行われる機械学習方法の流れを示すフローチャートである。図8に示されるように、S11においてエンコード部100は、入力データ10に含まれる要素(頂点)の特徴量を抽出し、処理をS12に進める。S12においてエンコード部100は、2つの頂点のコサイン類似度を用いて、当該2つの頂点間に辺が存在する尤度を算出する。当該尤度の算出にあたっては、コサイン類似度以外の類似度または距離が用いられてもよい。S13においてサンプリング部130は、Gumbel-Softmax関数を用いる再パラメータ化トリックを行って、グラフ構造を決定する。S14においてデコード部140は、サンプリング部130からのグラフ構造およびエンコード部100からの各頂点の特徴量から出力データを生成する。S15において学習部150は、損失関数L1を最小化対象とするバックプロパゲーションにより、デコード部140およびエンコード部100の各々に含まれるパラメータを最適化し、機械学習方法を終了する。当該パラメータには、デコード部140およびエンコード部100に含まれるニューラルネットワークの重みおよびバイアスが含まれる。
以上、実施の形態1に係る情報処理装置および機械学習方法によれば、入力データからグラフ構造を中間表現として抽出するモデルの精度を向上させることができる。
[実施の形態1の変形例]
実施の形態1の変形例においては、出力データから隣接行列を再構成する場合について説明する。再構成された隣接行列とエンコード部から出力される隣接行列との間に同一性が維持されるように機械学習が行われることにより、エンコード部によるロスレス圧縮が促進される。その結果、中間表現としてのグラフ構造の精度および出力データの精度を実施の形態1よりもさらに向上させることができる。
実施の形態1の変形例においては、出力データから隣接行列を再構成する場合について説明する。再構成された隣接行列とエンコード部から出力される隣接行列との間に同一性が維持されるように機械学習が行われることにより、エンコード部によるロスレス圧縮が促進される。その結果、中間表現としてのグラフ構造の精度および出力データの精度を実施の形態1よりもさらに向上させることができる。
図9は、実施の形態1の変形例に係る情報処理装置1Aの構成を示すブロック図である。情報処理装置1Aの構成は、図1の情報処理装置1の構成に再構成部160が追加されているとともに、学習部150が150Aに置き換えられた構成である。これら以外は同様であるため説明を繰り返さない。図9に示されるように、再構成部160は、出力データ20を受けるとともに、エンコード部100からベクトル表現Γ,Ωを受ける。
図10は、図9の再構成部160の具体的な構成を示すブロック図である。図10に示されるように、biLSTM161,162と、行列推定器163とを含む。biLSTM161は、出力データ20を受けて、文字列St1~StMの各々に対して、最初の隠れ層と最後の隠れ層とを結合することによって得られる特徴ベクトを出力する。biLSTM162は、biLSTM161から文字列St1~StMの各々の特徴ベクトルを受けて、文字列St1~StMの順序が反映されたベクトル表現Λ=(λ1,λ2,…,λk,…,λM)(特徴量)を出力する。特徴ベクトルλ1~λMは、文字列St1~StMにそれぞれ対応する。
行列推定器163は、ベクトル表現Γ,Ω,Λを受けて、文字列Tx1~TxMおよび文字列St1~StMの隣接関係を隣接行列Cとして推定するとともに、画像Im1~ImMおよび文字列St1~StMの隣接関係を隣接行列Dとして推定する。隣接行列C,Dは、それぞれ以下の式(6),(7)のように表される。
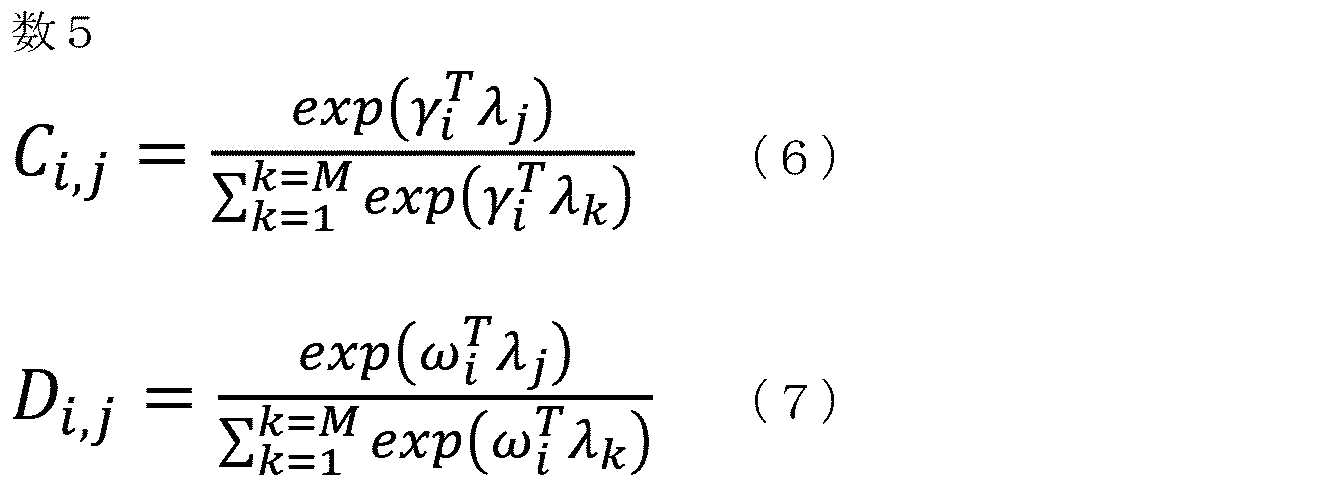
入力データに含まれるツリー構造が出力データ20に正確に反映されている場合、画像列データ11における画像Im1~ImMは、出力データ20における文字列St1~StMに対応する。そのため、隣接行列C,Dは、エンコード部100によって算出される隣接行列X,Yとそれぞれ同一性が認められる必要がある。そこで、実施の形態1の変形例においては、エンコード部100から出力される隣接行列X,Yの誤差の算出に用いられた正解行列と、隣接行列C,Dとの誤差を規定する損失関数LRを損失関数L1に加える。実施の形態1の変形例における全体の誤差を規定する損失関数L2は、以下の式(8)のように表される。損失関数L2の係数αはハイパーパラメータである。なお、損失関数LRは、隣接行列C,Dと隣接行列X,Y(正解データ)との誤差を規定する損失関数であってもよい。

学習部150Aは、損失関数L2を最小化対象とするバックプロパゲーションにより、再構成部160、デコード部140、およびエンコード部100の各々に含まれるパラメータを最適化する。
出力データ20の精度に関して、比較例、実施の形態1、および実施の形態1の変形例の比較を以下の表1に示す。表1においては、GLACNet(GLocal Attention Cascading Networks)を比較例としている。また、表1において、自動評価尺度であるBLEU(BiLingual Evaluation Understudy)1,BLEU4,ROUGE-L(Recall-Oriented Understudy for Gisiting Evaluation Longest common subsequence),CIDEr(Consensus-based Image Description Evaluation)-D,METEOR(Metric for Evaluation of Translation with Explicit ORdering)の各々のスコアが示されている。
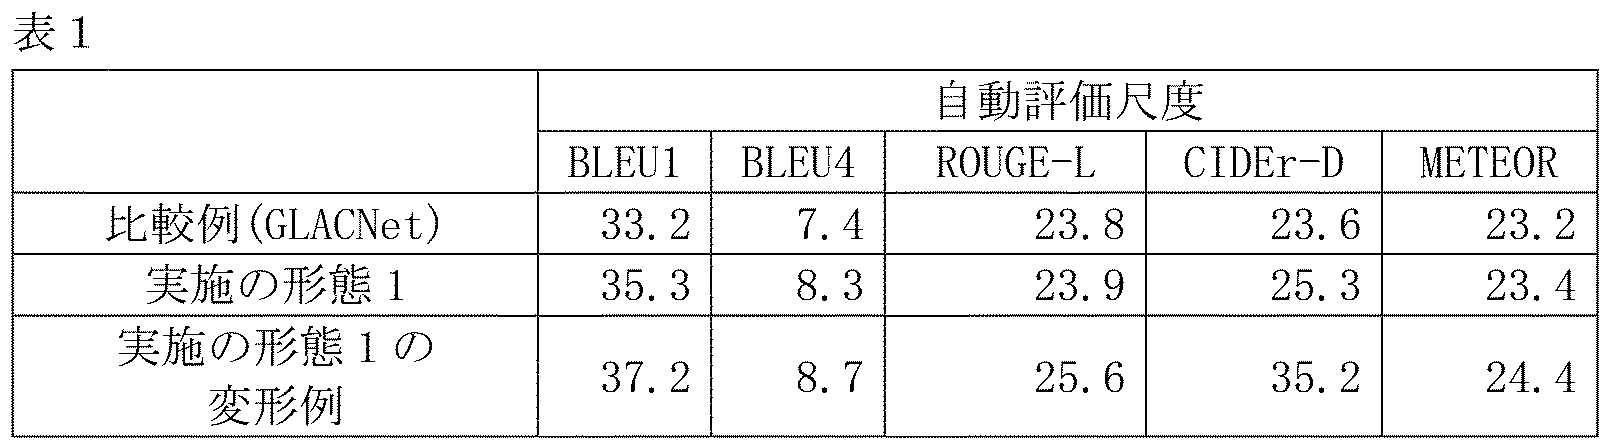
表1に示されているように、各自動評価尺度において、実施の形態1の性能は、比較例の性能を上回っている。また、実施の形態1の変形例の性能は、実施の形態1の性能を上回っている。
以上、実施の形態1の変形例に係る情報処理装置および機械学習方法によれば、入力データからグラフ構造を中間表現として抽出するモデルの精度を実施の形態1よりもさらに向上させることができる。
[実施の形態2]
実施の形態1においては、入力データからグラフ構造としてツリー構造が抽出される構成について説明した。入力データから抽出されるグラフ構造はツリー構造に限定されず、たとえばN部グラフ構造(Nは2以上の自然数)であってもよい。実施の形態2においては、N部グラフ構造の一例として、入力データから2部グラフ構造が抽出される構成について説明する。
実施の形態1においては、入力データからグラフ構造としてツリー構造が抽出される構成について説明した。入力データから抽出されるグラフ構造はツリー構造に限定されず、たとえばN部グラフ構造(Nは2以上の自然数)であってもよい。実施の形態2においては、N部グラフ構造の一例として、入力データから2部グラフ構造が抽出される構成について説明する。
図11は、実施の形態2に係る情報処理装置2の構成を示すブロック図である。図11に示されように、情報処理装置2は、エンコード部200と、サンプリング部230と、デコード部240と、学習部250と、推論部270とを備える。エンコード部200、サンプリング部230、デコード部240、および学習部250は、VAE(Variational Autoencoder)を形成している。
エンコード部200は、入力データ10Bに含まれるグラフ構造の複数の頂点の各々の特徴量を抽出する。エンコード部200は、当該複数の頂点を、共通の頂点を有さない2つの部分集合Sb1,Sb2に分割する。エンコード部200は、部分集合Sb1に含まれる頂点と部分集合Sb2に含まれる頂点との間に辺が存在する尤度を算出し、当該尤度を成分とする隣接行列をサンプリング部230に出力する。すなわち、エンコード部200は、部分集合Sb1とSb2との間において2部グラフマッチングを行う。
サンプリング部230は、エンコード部200からの隣接行列に対してGumbel-Softmax関数を用いた再パラメータ化トリックを行い、2部グラフ構造Bpを決定して、2部グラフ構造Bpおよび2部グラフ構造Bpに含まれる複数の頂点の各々の特徴量をデコード部240および推論部270に出力する。デコード部240は、2部グラフ構造Bpおよび当該特徴量から出力データ20Bを再生する。推論部270は、2部グラフ構造Bpおよび当該特徴量に基づいて推論を行い、推論結果を出力する。推論部270は、たとえばGNN(Graph Neural Network)を含む。
学習部250は、バックプロパゲーションによって、推論部270、デコード部240、エンコード部200を最適化する。バックプロパゲーションにおける最小化対象の損失関数は、出力データ20Bと入力データ10B(正解データ)との誤差、および推論部270の推論結果と学習データセットに含まれる正解データとの誤差を含む。すなわち、学習部250は、推論部270、デコード部240、エンコード部200に対して半教師あり学習を行う。具体的には、学習部250は、デコード部240およびエンコード部200に対しては教師なし学習を行い、推論部270に対しては教師あり学習を行う。
情報処理装置2の主目的は、推論部270による推論結果の出力である。エンコード部200、サンプリング部230、デコード部240、および学習部250によって形成されるVAEの最適化は、入力データ10Bから2部グラフ構造へのロスレス圧縮を実現するためのサブタスクとして位置付けられる。
以下では、検索システムに対するユーザの検索操作の履歴を入力データ10Bとする場合について説明する。図12は、入力データ10Bから抽出される、複数のユーザと複数の企業との間の2部グラフ構造Bpの一例を示す図である。図12においては、ユーザUs1,Us2,Us3,Us4と企業Cm1,Cm2,Cm3,Cm4,Cm5との間の相関関係が示されている。図12に示されるように、ユーザUs1と企業Cm2とが辺Rs1によって接続されている。ユーザUs2と企業Cm4とが辺Rs2によって接続されている。ユーザUs3と企業Cm3とが辺Rs3によって接続されている。ユーザUs4と企業Cm5とが辺Rs4によって接続されている。図13は、図12に示される2部グラフ構造Bpを表現する行列を示す図である。図11の推論部270は、2部グラフ構造Bpを受けて、各ユーザのニーズにマッチする企業を推論し、当該企業を当該ユーザに推奨する。
以上、実施の形態2に係る情報処理装置および機械学習方法によれば、入力データからグラフ構造を中間表現として抽出するモデルの精度を向上させることができる。
[実施の形態3]
実施の形態3においては、製造設備に含まれる複数の工程における複数のセンサの検出値の時系列データに基づいて複数のセンサをグラフ構造として構造化し、製品に発生した不具合がどの工程において発生したかを特定する構成について説明する。
実施の形態3においては、製造設備に含まれる複数の工程における複数のセンサの検出値の時系列データに基づいて複数のセンサをグラフ構造として構造化し、製品に発生した不具合がどの工程において発生したかを特定する構成について説明する。
図14は、実施の形態3に係る管理システム3000の構成例を示す模式図である。図14を参照して、管理システム3000は、複数の工程を含む製造設備30に関連付けられており、製造設備30によって製造される製品の品質を管理するための機能を提供する。図14においては、ワークを運搬するためのコンベア307に沿って、5つの連続する工程Pr1,Pr2,Pr3,Pr4,Pr5が示されている。ワークは、工程Pr1~Pr5の順に通過する。工程Pr1~Pr5の各々には、当該工程の状態を検出するためのセンサが設置されている。工程Pr1~Pr5においては、制御装置の一例であるPLC(Programmable Logic Controller)301,302,303,304,305によって、工程Pr1~Pr5がそれぞれ制御されるとともに監視される。
PLC301~305は、ローカルネットワーク306を介してデータ通信可能に接続されている。PLC301~305は、ローカルネットワーク306上の中継サーバ装置308に対して、制御対象の工程に関する状態情報を所定期間毎またはイベント毎に送信する。当該状態情報には、当該工程に設けられたセンサによって複数のサンプリングタイムにおいてそれぞれ検出された複数の検出値の時系列データ(センサ時系列データ)が含まれる。
中継サーバ装置308は、PLC301~305の各々から状態情報をインターネットを介して収集解析サーバ装置3(情報処理装置)へ転送する。中継サーバ装置308は、状態情報に対して必要な前処理を実施してもよい。
収集解析サーバ装置3は、中継サーバ装置308から受信した状態情報を収集し、収集した情報を解析する。収集解析サーバ装置3は、予め定められた条件が満たされたとき、または、端末装置309から要求を受信したときに、分析結果をインターネットを介して端末装置309へ出力する。
図14には、典型例として、単一の製造設備30に設置された複数の工程の各々にPLCが設けられ、それぞれのPLCが同一のローカルネットワーク306を介して中継サーバ装置308に接続されている構成について例示したがこれに限らない。たとえば、中継サーバ装置308を配置することなく、複数のPLCが収集解析サーバ装置3と直接的に接続されている構成を採用してもよい。この場合には、それぞれのPLCが収集解析サーバ装置3に必要な情報をそれぞれ送信することになる。
あるいは、複数の中継サーバ装置308を設けてもよい。この場合には、一部のPLCからの状態情報をある中継サーバ装置308が収集解析サーバ装置3へ転送し、残りのPLCからの状態情報を別の中継サーバ装置308が収集解析サーバ装置3へ転送するようにしてもよい。
次に、PLCのハードウェア構成例について説明する。図15は、図14の管理システム3000を構成するPLC301~305のハードウェア構成の一例を示す模式図である。図15を参照して、PLC301~305の各々は、演算ユニット310と、1または複数の機能ユニット320とを含む。演算ユニット310は、予め格納されたユーザプログラムなどを実行する演算装置であり、機能ユニット320からフィールド信号(制御対象の設備の状態を示す情報など)を取得し、機能ユニット320を通じて、必要な制御信号を出力する。
演算ユニット310は、ユーザプログラムなどを実行するプロセッサ312と、ユーザプログラム、オペレーティングシステム(OS:Operating System)、および各種データなどを格納するメモリ316と、内部バス326を介したデータの遣り取りを制御するバスコントローラ314と、通信インターフェイス318とを含む。メモリ316は、DRAM(Dynamic Random Access Memory)などの揮発性記憶装置と、フラッシュメモリなどの不揮発性記憶装置とを組み合わせて構成してもよい。プロセッサ312は、PLC301~305の各々に対応する工程に設置されたセンサ315から検出値を取得する。当該検出値は、たとえば、電流値、電圧値、電力値、温度、湿度、または振動値を含む。複数のセンサ315が、1つの工程に設けられてもよい。
通信インターフェイス318は、データを遣り取りする対象の装置に応じて、1つまたは複数の通信ポートが設けられてもよい。たとえば、ローカルネットワーク306(図14参照)に接続するためのイーサネット(登録商標)に従う通信ポート、パーソナルコンピュータなどと接続するためのUSB(Universal Serial Bus)に従う通信ポート、またはシリアル回線・パラレル回線をサポートする通信ポートなどが実装されてもよい。
機能ユニット320は、制御対象の設備との間で各種情報を遣り取りするためのIO(Input Output)機能を提供してもよい。具体的には、デジタル信号を受け取るDI(Digital Input)、デジタル信号を出力するDO(Digital Output)、アナログ信号を受け取るAI(Analog Input)、およびアナログ信号を出力するAO(Analog Output)などの機能が実装されてもよい。さらに、PID(Proportional Integral Derivative)制御、またはモーション制御などの特殊機能が実装されてもよい。
たとえば、IO機能を提供する機能ユニット320の各々は、IOモジュール322と、内部バス326とを介して演算ユニット310との間のデータの遣り取りを制御するためのバスコントローラ324とを含む。IOモジュール322の各々は、制御対象の工程からの状態情報を取得し、当該状態情報を演算ユニット310を通じて中継サーバ装置308および収集解析サーバ装置3へ送出する。
管理システム3000においては、何らかの通信手段を用いて、内部情報を外部装置へ出力するためのインターフェイスを有するPLCであれば、どのようなものを採用してもよい。PLCのハードウェア構成は、図15に示される構成に限定されず、任意の構成を採用することができる。現実的には、図14に示される製造設備30に配置される複数のPLCの間では、メーカおよび機種が統一されていないことが想定される。管理システム3000において、中継サーバ装置308は、このようなPLCのメーカおよび機種の相違を吸収する。
図16は、図14の収集解析サーバ装置3の機能構成を示すブロック図である。図16に示されるように、収集解析サーバ装置3は、エンコード部300と、サンプリング部330と、デコード部340と、品質検査部370(推論部)とを備える。入力データ10Cは、PLC301~305からのセンサ時系列データを含む。エンコード部300、サンプリング部330、デコード部340、および学習部350は、VAE(Variational Autoencoder)を形成している。
エンコード部300は、エンコーダモデルMcを含む。エンコーダモデルMcは、入力データ10Cに含まれるセンサ間の相関関係を表すグラフ構造を入力データ10Cから抽出する。エンコード部300は、センサ時系列データから当該グラフ構造の頂点である複数のセンサの各々の特徴量を抽出する。エンコード部300は、複数の頂点に含まれる2つの頂点の間に辺が存在する尤度を算出し、当該尤度を成分とする隣接行列をサンプリング部330に出力する。
サンプリング部330は、エンコード部300からの隣接行列に対してGumbel-Softmax関数を用いた再パラメータ化トリックを行い、グラフ構造Gsを決定して、グラフ構造Gsおよびグラフ構造Gsの複数の頂点の各々の特徴量をデコード部340および品質検査部370に出力する。
デコード部340は、デコーダモデルMdを含む。デコーダモデルMdは、グラフ構造Gsおよび当該特徴量から出力データ20Cを再生する。
品質検査部370は、品質検査モデルMmを含む。品質検査モデルMmは、グラフ構造Gsおよび当該特徴量に基づいて製品の品質を表す品質データを算出する。品質検査部370は、たとえばGNNを含む。品質検査部370は、当該品質データと基準品質データとの誤差をグラフ構造Gsにおいて可視化する。基準品質データとは、正常な製品に対応する標準的な品質データである。品質データと基準品質データとの誤差が大きいほど、当該品質データに含まれる不具合の程度が大きい。当該誤差のグラフ構造Gsにおける可視化の方法としては、たとえばGradCAM(Gradient-weighted Class Activation Mapping)を用いた当該誤差のヒートマップ化を挙げることができる。
学習部350は、バックプロパゲーションによって、品質検査モデルMm、デコーダモデルMd、およびエンコーダモデルMcの各々に含まれるニューラルネットワークのパラメータを最適化する。当該パラメータには、当該ニューラルネットワークの重みおよびバイアスが含まれる。バックプロパゲーションにおける最小化対象の損失関数は、出力データ20Cと入力データ10C(正解データ)との誤差、および品質検査部370の検査結果と学習データセットに含まれる正解品質データとの誤差を含む。すなわち、学習部350は、品質検査部370、デコード部340、エンコード部300に対して半教師あり学習を行う。具体的には、学習部350は、デコード部340およびエンコード部300に対しては教師なし学習を行い、品質検査部370に対しては教師あり学習を行う。
収集解析サーバ装置3の主目的は、品質検査部370による検査結果の出力である。エンコード部300、サンプリング部330、デコード部340、および学習部350によって形成されるVAEの最適化は、入力データ10Cからグラフ構造へのロスレス圧縮を実現するためのサブタスクとして位置付けられる。
図17は、図14の収集解析サーバ装置3のハードウェア構成を示すブロック図である。図17に示されるように、収集解析サーバ装置3は、演算処理部であるプロセッサ31と、記憶部としてのメインメモリ32およびハードディスク33と、入力インターフェイス34と、表示コントローラ35と、通信インターフェイス36と、データリーダ/ライタ38とを含む。これらの各部は、バス39を介して、互いにデータ通信可能に接続される。
プロセッサ31は、CPU(Central Processing Unit)を含む。プロセッサ31は、GPU(Graphics Processing Unit)をさらに含んでもよい。プロセッサ31は、ハードディスク33に格納されたプログラム(コード)をメインメモリ32に展開して、これらを所定順序で実行することで、各種の演算を実施する。
メインメモリ32は、典型的には、DRAM(Dynamic Random Access Memory)などの揮発性の記憶装置である。メインメモリ32は、ハードディスク33から読み出されたプログラムを保持する。
入力インターフェイス34は、プロセッサ31と入力部361との間のデータ伝送を仲介する。入力部361は、たとえば、マウス、キーボード、またはタッチパネルを含む。すなわち、入力インターフェイス34は、ユーザが入力部361を操作することで与えられる操作指令を受付ける。
表示コントローラ35は、表示装置の典型例であるディスプレイ362と接続され、プロセッサ31における画像処理の結果などをユーザに通知する。すなわち、表示コントローラ35は、ディスプレイ362に接続され、ディスプレイ362での表示を制御する。ディスプレイ362は、たとえば液晶ディスプレイ、有機EL(Electro Luminescence)ディスプレイ、またはその他の表示装置である。
通信インターフェイス36は、プロセッサ31と他の外部装置との間のインターネットを介するデータ伝送を仲介する。通信インターフェイス36は、典型的には、イーサネット(登録商標)、またはUSB(Universal Serial Bus)を含む。
データリーダ/ライタ38は、プロセッサ31と記録媒体であるメモリカード363との間のデータ伝送を仲介する。メモリカード363には、たとえば、収集解析サーバ装置3において実行されるプログラムが格納されている。データリーダ/ライタ38は、メモリカード363からプログラムを読み出す。なお、メモリカード363は、CF(Compact Flash)、SD(Secure Digital)などの汎用的な半導体記憶デバイスや、フレキシブルディスク(Flexible Disk)などの磁気記憶媒体や、CD-ROM(Compact Disk Read Only Memory)などの光学記憶媒体等からなる。なお、収集解析サーバ装置3には、必要に応じて、プリンタなどの他の出力装置が接続されてもよい。
ハードディスク33は、不揮発性の磁気記憶装置である。ハードディスク33には、学習データセットDs、品質検査モデルMm、エンコーダモデルMc、デコーダモデルMd、機械学習プログラムPg1、および品質検査プログラムPg2が保存されている。ハードディスク33には、各種設定値などが格納されてもよい。なお、ハードディスク33に加えて、あるいは、ハードディスク33に代えて、フラッシュメモリなどの半導体記憶装置を採用してもよい。
学習データセットDsは、複数の学習データを含む。複数の学習データの各々は、製品が通過した複数の工程の各々のセンサによる検出値の時系列データ、および当該製品の品質に対応する正解品質データの組み合わせである。
機械学習プログラムPg1において、学習データセットDs、エンコーダモデルMc、デコーダモデルMd、および品質検査モデルMmが参照される。機械学習プログラムPg1を実行するプロセッサ31によって、図16のエンコード部300、サンプリング部330、デコード部340、学習部350、および品質検査部370が実現される。プロセッサ31は、機械学習プログラムPg1を実行することによって、エンコーダモデルMc、デコーダモデルMd、および品質検査モデルMmの各々を学習済みに適合する。
品質検査プログラムPg2において、エンコーダモデルMcおよび品質検査モデルMmが参照される。プロセッサ31は、品質検査プログラムPg2を実行することによって、製品に対応するセンサ時系列データから当該製品の品質データを算出し、当該品質データと基準品質データとの誤差をグラフ構造Gsにおいて可視化する。当該誤差のグラフ構造Gsにおいて可視化された当該誤差は、ディスプレイ362および端末装置309に出力される。
図18は、品質データおよび基準品質データの誤差とともに可視化されたグラフ構造Gsの一例を示す図である。図18において、頂点Sn1~Sn5は、図14の工程Pr1~Pr5のそれぞれに設けられたセンサに対応する。ハッチングが濃い頂点ほど、当該頂点に対応するセンサの検出値が正常値から乖離していることを示す。
図18に示されるように、頂点Sn3は、Sn1,Sn2,Sn4に接続されている。頂点Sn5は、頂点Sn2に接続されている。頂点Sn2が最も濃く、頂点Sn1,Sn4が最も薄い。頂点Sn2とSn3とを接続する辺および頂点Sn2とSn5とを接続する辺は、他の辺よりも太く強調されている。誤差が可視化されたグラフ構造Gsは、複数のセンサの検出値の相関関係を表しているとともに、製品に含まれる不具合(品質データと基準品質データとの誤差)に寄与しているセンサの検出値を示している。図18において、製品に含まれる不具合に最も寄与しているセンサの検出値は、頂点Sn2に対応する工程Pr2に設けられたセンサの検出値である。そのため、工程Pr2に不具合が発生している可能性が高い。また、グラフ構造Gsにおいて頂点Sn2に接続されている頂点Sn3,Sn5にそれぞれ対応する工程Pr3,Pr5においても、工程Pr2に次いで不具合が発生している可能性がある。頂点Sn1,Sn4にそれぞれ対応する工程Pr1,Pr4においては、不具合が発生している可能性が最も低い。誤差が可視化されたグラフ構造Gsによれば、複数の工程を経て完成された製品に含まれる不具合の発生原因となる工程を容易に特定することができる。
以上、実施の形態3に係る情報処理装置および機械学習方法によれば、入力データからグラフ構造を中間表現として抽出するモデルの精度を向上させることができる。
[実施の形態に係る情報処理装置および機械学習方法の他の適用例]
実施の形態に係る情報処理装置および機械学習方法は、人流予測に基づくルートプランニングに適用可能である。図19は、実施の形態に係る情報処理装置に対応するロボットRbによるルートプランニングを説明するための図である。図19に示されるように、ロボットRbの視野には、通行人Ps1,Ps2,Ps3が含まれている。通行人Ps1は、通行人Ps2を見ている。通行人Ps2は、通行人Ps3を見ている。通行人Ps3は、通行人Ps2を見ている。ロボットRbは、時系列データである視野動画に含まれる通行人Ps1~Ps3の各々の姿勢、視線方向、および通行人Ps1~Ps3の相対位置関係等に基づいて通行人Ps1~Ps3の各々を頂点とする有向グラフ構造を抽出する。
実施の形態に係る情報処理装置および機械学習方法は、人流予測に基づくルートプランニングに適用可能である。図19は、実施の形態に係る情報処理装置に対応するロボットRbによるルートプランニングを説明するための図である。図19に示されるように、ロボットRbの視野には、通行人Ps1,Ps2,Ps3が含まれている。通行人Ps1は、通行人Ps2を見ている。通行人Ps2は、通行人Ps3を見ている。通行人Ps3は、通行人Ps2を見ている。ロボットRbは、時系列データである視野動画に含まれる通行人Ps1~Ps3の各々の姿勢、視線方向、および通行人Ps1~Ps3の相対位置関係等に基づいて通行人Ps1~Ps3の各々を頂点とする有向グラフ構造を抽出する。
図20は、図19のロボットRbによって抽出される有向グラフ構造Pfを示す図である。図19において頂点Vx1,Vx2,Vx3は、図19の通行人Ps1,Ps2,Ps3にそれぞれ対応する。図20に示されるように、頂点Vx1と頂点Vx2とは、頂点Vx1からVx2に向かう辺Eg1によって接続されている。頂点Vx2と頂点Vx3とは、頂点Vx2からVx3に向かう辺Eg2および頂点Vx3からVx2に向かう辺Eg3によって接続されている。
図21は、図20の有向グラフ構造Pfに対応する行列表現を示す図である。ロボットRbは、図21に示される有向グラフ構造Pfを推論部に入力して、通行人Ps1~Ps3に対する人流予測を行い、通行人Ps1~Ps3を回避可能な図19のルートRtを計画する。当該推論部は、たとえばSocial GAN(Generative Adversarial Network)を含む。
実施の形態に係る情報処理装置および機械学習方法は、交通渋滞の予測にも適用可能である。交通渋滞の予測に当たっては、道路によって接続されている複数の地点における時刻毎の交通量を時系列の入力データとして、当該入力データから各時刻における複数の地点の各々を頂点とし、異なる時刻に亘る2地点間の交通量の関係性を辺とするグラフ構造が抽出される。すなわち、時刻毎の複数の地点を頂点集合の部分集合とするN部グラフマッチングの結果として入力データからグラフ構造が抽出される。情報処理装置は、当該グラフ構造に基づいて、特定時刻における各地点の交通渋滞を予測する。
実施の形態に係る情報処理装置および機械学習方法は、マテリアルズ・インフォマティクス(MI:Materials Informatics)にも適用可能である。マテリアルズ・インフォマティクスへの適用例においては、入力データから抽出されたグラフ構造の頂点および辺を分子構造の原子および結合に対応させて、当該分子構造の物性が推定される。
<付記>
上述したような実施の形態は、以下のような技術思想を含む。
上述したような実施の形態は、以下のような技術思想を含む。
(構成1)
入力データ(10,10B,10C)に含まれる要素間の相関関係を表すグラフ構造(Tr,Bp,Gs,Pf)を前記入力データ(10,10B,10C)から抽出し、前記グラフ構造(Tr,Bp,Gs,Pf)から出力データ(20,20B,20C)を生成する情報処理装置(1,1A,2,3)であって、
前記入力データ(10,10B,10C)から前記グラフ構造(Tr,Bp,Gs,Pf)に含まれる複数の頂点(Lf1~Lf4,Nd1~Nd4,Us1~Us4,Cm1~Cm5,Sn1~Sn5,Vx1~Vx3)の各々の特徴量(Θ,Φ,Ω,Γ)を抽出し、当該頂点に前記相関関係を表す辺(Br1~Br7,Rs1~Rs4,Eg1~Eg3)が接続されている尤度を算出するエンコード部(100,200,300)と、
前記尤度に対するGumbel-Softmax関数の変換結果に基づいて、前記グラフ構造(Tr,Bp,Gs,Pf)を決定するサンプリング部(130,230,330)と、
前記グラフ構造(Tr,Bp,Gs,Pf)、および前記特徴量(Θ,Φ,Ω,Γ)を受けて前記出力データ(20,20B,20C)を生成するデコード部(140,240,340)と、
前記出力データ(20,20B,20C)と正解データとの誤差(LP)を含む損失関数を最小化対象とするバックプロパゲーションによって、前記デコード部(140,240,340)および前記エンコード部(100,200,300)を最適化する学習部(150,250,350)とを備える、情報処理装置(1,1A,2,3)。
入力データ(10,10B,10C)に含まれる要素間の相関関係を表すグラフ構造(Tr,Bp,Gs,Pf)を前記入力データ(10,10B,10C)から抽出し、前記グラフ構造(Tr,Bp,Gs,Pf)から出力データ(20,20B,20C)を生成する情報処理装置(1,1A,2,3)であって、
前記入力データ(10,10B,10C)から前記グラフ構造(Tr,Bp,Gs,Pf)に含まれる複数の頂点(Lf1~Lf4,Nd1~Nd4,Us1~Us4,Cm1~Cm5,Sn1~Sn5,Vx1~Vx3)の各々の特徴量(Θ,Φ,Ω,Γ)を抽出し、当該頂点に前記相関関係を表す辺(Br1~Br7,Rs1~Rs4,Eg1~Eg3)が接続されている尤度を算出するエンコード部(100,200,300)と、
前記尤度に対するGumbel-Softmax関数の変換結果に基づいて、前記グラフ構造(Tr,Bp,Gs,Pf)を決定するサンプリング部(130,230,330)と、
前記グラフ構造(Tr,Bp,Gs,Pf)、および前記特徴量(Θ,Φ,Ω,Γ)を受けて前記出力データ(20,20B,20C)を生成するデコード部(140,240,340)と、
前記出力データ(20,20B,20C)と正解データとの誤差(LP)を含む損失関数を最小化対象とするバックプロパゲーションによって、前記デコード部(140,240,340)および前記エンコード部(100,200,300)を最適化する学習部(150,250,350)とを備える、情報処理装置(1,1A,2,3)。
(構成2)
前記出力データ(10)から前記グラフ構造(Tr)を再構成する再構成部(160)をさらに備え、
前記損失関数は、前記再構成部(160)からの出力と正解グラフ構造との誤差(LR)を含む、構成1に記載の情報処理装置(1A)。
前記出力データ(10)から前記グラフ構造(Tr)を再構成する再構成部(160)をさらに備え、
前記損失関数は、前記再構成部(160)からの出力と正解グラフ構造との誤差(LR)を含む、構成1に記載の情報処理装置(1A)。
(構成3)
前記サンプリング部(230,330)から前記グラフ構造(Bp,Gs)を受けて、前記入力データ(10B,10C)に対する推論結果を出力する推論部(270,370)をさらに備え、
前記学習部(250,350)は、前記デコード部(240,340)および前記エンコード部(100,200)に対しては教師なし学習を行い、前記推論部(270,370)に対しては教師あり学習を行う、構成1または2に記載の情報処理装置(2,3)。
前記サンプリング部(230,330)から前記グラフ構造(Bp,Gs)を受けて、前記入力データ(10B,10C)に対する推論結果を出力する推論部(270,370)をさらに備え、
前記学習部(250,350)は、前記デコード部(240,340)および前記エンコード部(100,200)に対しては教師なし学習を行い、前記推論部(270,370)に対しては教師あり学習を行う、構成1または2に記載の情報処理装置(2,3)。
(構成4)
前記入力データ(10)は、第1データ(11)および第2データ(12)を含み、
前記第1データ(11)のモダリティは、前記第2データ(12)のモダリティとは異なり、
前記エンコード部(100)は、
前記第1データ(11)の特徴量(Θ,Φ)を抽出する第1エンコーダ(110)と、
前記第2データ(12)の特徴量(Γ)を抽出する第2エンコーダ(120)とを含む、構成1~3のいずれかに記載の情報処理装置(1,1A)。
前記入力データ(10)は、第1データ(11)および第2データ(12)を含み、
前記第1データ(11)のモダリティは、前記第2データ(12)のモダリティとは異なり、
前記エンコード部(100)は、
前記第1データ(11)の特徴量(Θ,Φ)を抽出する第1エンコーダ(110)と、
前記第2データ(12)の特徴量(Γ)を抽出する第2エンコーダ(120)とを含む、構成1~3のいずれかに記載の情報処理装置(1,1A)。
(構成5)
前記出力データ(20)のモダリティは、前記入力データ(10)のモダリティとは異なる、構成1~4のいずれかに記載の情報処理装置(1,1A)。
前記出力データ(20)のモダリティは、前記入力データ(10)のモダリティとは異なる、構成1~4のいずれかに記載の情報処理装置(1,1A)。
(構成6)
入力データ(10,10B,10C)に含まれる要素間の相関関係を表すグラフ構造(Tr,Bp,Gs,Pf)を前記入力データ(10,10B,10C)から抽出し、前記グラフ構造(Tr,Bp,Gs,Pf)から出力データ(20,20B,20C)を生成するモデル(Mc,Md)に対して、記憶部(33)に保存された機械学習プログラム(Pg1)を実行するプロセッサ(31)によって行われる機械学習方法であって、
前記入力データ(10,10B,10C)から前記グラフ構造(Tr,Bp,Gs,Pf)に含まれる複数の頂点(Lf1~Lf4,Nd1~Nd4,Us1~Us4,Cm1~Cm5,Sn1~Sn5,Vx1~Vx3)の各々の特徴量(Θ,Φ,Ω,Γ)を抽出し、当該頂点に前記相関関係を表す辺(Br1~Br7,Rs1~Rs4,Eg1~Eg3)が接続されている尤度を算出するステップ(S11,S12)と、
前記尤度に対するGumbel-Softmax関数の変換結果に基づいて、前記グラフ構造(Tr,Bp,Gs,Pf)を決定するステップ(S13)と、
前記グラフ構造(Tr,Bp,Gs,Pf)、および前記特徴量(Θ,Φ,Ω,Γ)を受けて前記出力データ(20,20B,20C)を生成するステップ(S14)と、
前記出力データ(20,20B,20C)と正解データとの誤差(LP)を含む損失関数を最小化対象とするバックプロパゲーションによって、前記モデル(Mc,Md)を最適化するステップ(S15)とを含む、機械学習方法。
入力データ(10,10B,10C)に含まれる要素間の相関関係を表すグラフ構造(Tr,Bp,Gs,Pf)を前記入力データ(10,10B,10C)から抽出し、前記グラフ構造(Tr,Bp,Gs,Pf)から出力データ(20,20B,20C)を生成するモデル(Mc,Md)に対して、記憶部(33)に保存された機械学習プログラム(Pg1)を実行するプロセッサ(31)によって行われる機械学習方法であって、
前記入力データ(10,10B,10C)から前記グラフ構造(Tr,Bp,Gs,Pf)に含まれる複数の頂点(Lf1~Lf4,Nd1~Nd4,Us1~Us4,Cm1~Cm5,Sn1~Sn5,Vx1~Vx3)の各々の特徴量(Θ,Φ,Ω,Γ)を抽出し、当該頂点に前記相関関係を表す辺(Br1~Br7,Rs1~Rs4,Eg1~Eg3)が接続されている尤度を算出するステップ(S11,S12)と、
前記尤度に対するGumbel-Softmax関数の変換結果に基づいて、前記グラフ構造(Tr,Bp,Gs,Pf)を決定するステップ(S13)と、
前記グラフ構造(Tr,Bp,Gs,Pf)、および前記特徴量(Θ,Φ,Ω,Γ)を受けて前記出力データ(20,20B,20C)を生成するステップ(S14)と、
前記出力データ(20,20B,20C)と正解データとの誤差(LP)を含む損失関数を最小化対象とするバックプロパゲーションによって、前記モデル(Mc,Md)を最適化するステップ(S15)とを含む、機械学習方法。
今回開示された各実施の形態は、矛盾しない範囲で適宜組み合わされて実施されることも予定されている。今回開示された実施の形態はすべての点で例示であって制限的なものではないと考えられるべきである。本発明の範囲は上記した説明ではなくて請求の範囲によって示され、請求の範囲と均等の意味および範囲内でのすべての変更が含まれることが意図される。
1,1A,2 情報処理装置、3 収集解析サーバ装置、10,10B,10C 入力データ、11 画像列データ、12 食材列データ、20,20B,20C 出力データ、30 製造設備、31,312 プロセッサ、32 メインメモリ、33 ハードディスク、34 入力インターフェイス、35 表示コントローラ、36,318 通信インターフェイス、38 データリーダ/ライタ、39 バス、100,200,300 エンコード部、110,120 エンコーダ、111 画像エンコーダ、114,124,163 行列推定器、121 分散表現器、130,143,230,330 サンプリング部、140,240,340 デコード部、142 エンコーダデコーダモデル、150,150A,250,350 学習部、160 再構成部、270 推論部、306 ローカルネットワーク、307 コンベア、308 中継サーバ装置、309 端末装置、310 演算ユニット、314,324 バスコントローラ、315 センサ、316 メモリ、320 機能ユニット、322 モジュール、326 内部バス、361 入力部、362 ディスプレイ、363 メモリカード、370 品質検査部、3000 管理システム、Bp 2部グラフ構造、Br1~Br7 枝、Cm1~Cm5 企業、Ds 学習データセット、Eg1~Eg3,Rs1~Rs4 辺、Gs グラフ構造、Im1~Im4 画像、LP,LR,LT 損失関数、Lf1~Lf4 リーフノード、Mc エンコーダモデル、Md デコーダモデル、Mm 品質検査モデル、Nd1~Nd4 ノード、Pf 有向グラフ構造、Pg1 機械学習プログラム、Pg2 品質検査プログラム、Pr1~Pr5 工程、Ps1~Ps3 通行人、Rb ロボット、Rt ルート、Sb1,Sb2 部分集合、Sn1~Sn5,Vx1~Vx3 頂点、St1~St4,Tx1~Tx4 文字列、Tr ツリー構造、Us1~Us4 ユーザ。
Claims (6)
- 入力データに含まれる要素間の相関関係を表すグラフ構造を前記入力データから抽出し、前記グラフ構造から出力データを生成する情報処理装置であって、
前記入力データから前記グラフ構造に含まれる複数の頂点の各々の特徴量を抽出し、当該頂点に前記相関関係を表す辺が接続されている尤度を算出するエンコード部と、
前記尤度に対するGumbel-Softmax関数の変換結果に基づいて、前記グラフ構造を決定するサンプリング部と、
前記グラフ構造、および前記特徴量を受けて前記出力データを生成するデコード部と、
前記出力データと正解データとの誤差を含む損失関数を最小化対象とするバックプロパゲーションによって、前記デコード部および前記エンコード部を最適化する学習部とを備える、情報処理装置。 - 前記出力データから前記グラフ構造を再構成する再構成部をさらに備え、
前記損失関数は、前記再構成部からの出力と正解グラフ構造との誤差を含む、請求項1に記載の情報処理装置。 - 前記サンプリング部から前記グラフ構造を受けて、前記入力データに対する推論結果を出力する推論部をさらに備え、
前記学習部は、前記デコード部および前記エンコード部に対しては教師なし学習を行い、前記推論部に対しては教師あり学習を行う、請求項1または2に記載の情報処理装置。 - 前記入力データは、第1データおよび第2データを含み、
前記第1データのモダリティは、前記第2データのモダリティとは異なり、
前記エンコード部は、
前記第1データの特徴量を抽出する第1エンコーダと、
前記第2データの特徴量を抽出する第2エンコーダとを含む、請求項1~3のいずれか1項に記載の情報処理装置。 - 前記出力データのモダリティは、前記入力データのモダリティとは異なる、請求項1~4のいずれか1項に記載の情報処理装置。
- 入力データに含まれる要素間の相関関係を表すグラフ構造を前記入力データから抽出し、前記グラフ構造から出力データを生成するモデルに対して、記憶部に保存された機械学習プログラムを実行するプロセッサによって行われる機械学習方法であって、
前記入力データから前記グラフ構造に含まれる複数の頂点の各々の特徴量を抽出し、当該頂点に前記相関関係を表す辺が接続されている尤度を算出するステップと、
前記尤度に対するGumbel-Softmax関数の変換結果に基づいて、前記グラフ構造を決定するステップと、
前記グラフ構造、および前記特徴量を受けて前記出力データを生成するステップと、
前記出力データと正解データとの誤差を含む損失関数を最小化対象とするバックプロパゲーションによって、前記モデルを最適化するステップとを含む、機械学習方法。
Priority Applications (3)
| Application Number | Priority Date | Filing Date | Title |
|---|---|---|---|
| CN202180015456.3A CN115136150A (zh) | 2020-03-06 | 2021-02-19 | 信息处理装置和机器学习方法 |
| US17/802,620 US20230013870A1 (en) | 2020-03-06 | 2021-02-19 | Information processing device and machine learning method |
| EP21764535.7A EP4116881A4 (en) | 2020-03-06 | 2021-02-19 | Information processing device and machine learning method |
Applications Claiming Priority (2)
| Application Number | Priority Date | Filing Date | Title |
|---|---|---|---|
| JP2020038785A JP7359394B2 (ja) | 2020-03-06 | 2020-03-06 | 情報処理装置および機械学習方法 |
| JP2020-038785 | 2020-03-06 |
Publications (1)
| Publication Number | Publication Date |
|---|---|
| WO2021177056A1 true WO2021177056A1 (ja) | 2021-09-10 |
Family
ID=77613527
Family Applications (1)
| Application Number | Title | Priority Date | Filing Date |
|---|---|---|---|
| PCT/JP2021/006302 Ceased WO2021177056A1 (ja) | 2020-03-06 | 2021-02-19 | 情報処理装置および機械学習方法 |
Country Status (5)
| Country | Link |
|---|---|
| US (1) | US20230013870A1 (ja) |
| EP (1) | EP4116881A4 (ja) |
| JP (1) | JP7359394B2 (ja) |
| CN (1) | CN115136150A (ja) |
| WO (1) | WO2021177056A1 (ja) |
Cited By (1)
| Publication number | Priority date | Publication date | Assignee | Title |
|---|---|---|---|---|
| CN119339008A (zh) * | 2024-12-20 | 2025-01-21 | 杭州宇泛智能科技股份有限公司 | 基于多模态数据的场景空间三维模型动态建模方法 |
Families Citing this family (6)
| Publication number | Priority date | Publication date | Assignee | Title |
|---|---|---|---|---|
| US11768754B2 (en) * | 2020-08-27 | 2023-09-26 | Tsinghua University | Parallel program scalability bottleneck detection method and computing device |
| CN115249057A (zh) * | 2021-04-26 | 2022-10-28 | 阿里巴巴新加坡控股有限公司 | 用于图形节点采样的系统和由计算机实现的方法 |
| CN116151337B (zh) * | 2021-11-15 | 2026-03-20 | 阿里巴巴达摩院(杭州)科技有限公司 | 用于加速图神经网络属性访问的方法、系统和存储介质 |
| DE102022103812A1 (de) * | 2022-02-17 | 2023-08-17 | WAGO Verwaltungsgesellschaft mit beschränkter Haftung | Computerimplementiertes verfahren zur zumindest teilweise automatisierten konfiguration eines feldbusses, feldbussystem, computerprogramm, computerlesbares speichermedium, trainingsdatensatz und verfahren zum trainieren eines konfigurations-ki-modells |
| CN114925811A (zh) * | 2022-05-16 | 2022-08-19 | 北京火山引擎科技有限公司 | 一种多变量时间序列处理方法、装置、设备及介质 |
| US20250252341A1 (en) * | 2024-02-05 | 2025-08-07 | Disney Enterprises, Inc. | Multi-Sourced Machine Learning Model-Based Artificial Intelligence Character Training and Development |
Family Cites Families (7)
| Publication number | Priority date | Publication date | Assignee | Title |
|---|---|---|---|---|
| US11704541B2 (en) * | 2017-10-27 | 2023-07-18 | Deepmind Technologies Limited | Graph neural network systems for generating structured representations of objects |
| CN108132968B (zh) * | 2017-12-01 | 2020-08-04 | 西安交通大学 | 网络文本与图像中关联语义基元的弱监督学习方法 |
| CN109117795B (zh) * | 2018-08-17 | 2022-03-25 | 西南大学 | 基于图结构的神经网络表情识别方法 |
| CN109359733A (zh) * | 2018-10-19 | 2019-02-19 | 中国石油大学(华东) | 一种基于变分自编码器的动态系统运行状态建模方法 |
| CN110490035A (zh) * | 2019-05-17 | 2019-11-22 | 上海交通大学 | 人体骨架动作识别方法、系统及介质 |
| CN110188168B (zh) * | 2019-05-24 | 2021-09-03 | 北京邮电大学 | 语义关系识别方法和装置 |
| CN110309268B (zh) * | 2019-07-12 | 2021-06-29 | 中电科大数据研究院有限公司 | 一种基于概念图的跨语言信息检索方法 |
-
2020
- 2020-03-06 JP JP2020038785A patent/JP7359394B2/ja active Active
-
2021
- 2021-02-19 WO PCT/JP2021/006302 patent/WO2021177056A1/ja not_active Ceased
- 2021-02-19 US US17/802,620 patent/US20230013870A1/en active Pending
- 2021-02-19 CN CN202180015456.3A patent/CN115136150A/zh active Pending
- 2021-02-19 EP EP21764535.7A patent/EP4116881A4/en active Pending
Non-Patent Citations (7)
| Title |
|---|
| CHEN, MENGYUAN ET AL.: "Inference for Network Structure and Dynamics rom Time Series Data via Graph Neural Network", ARXIV:2001.06576V1, 18 January 2020 (2020-01-18), pages 1 - 10, XP081581820, Retrieved from the Internet <URL:https://arxiv.org/abs/2001.06576vl> [retrieved on 20210408] * |
| ERIC JANGSHIXIANG GUBEN POOLE: "Categorical Reparameterization with Gumbel-Softmax", ICLR (INTERNATIONAL CONFERENCE ON LEARNING REPRESENTATIONS, 2017, Retrieved from the Internet <URL:https://openreview.net/forum?id=rkE3y85ee> |
| JIANLONG CHANGXINBANG ZHANGYIWEN GUOGAOFENG MENGSHIMING XIANGCHUNHONG PAN, DIFFERENTIABLE ARCHITECTURE SEARCH WITH ENSEMBLE GUMBEL-SOFTMAX, Retrieved from the Internet <URL:https://arxiv.org/abs/1905.01786> |
| KAI SHENG TAIRICHARD SOCHERCHRISTOPHER D. MANNING: "Proceedings of the 53rd Annual Meeting of the Association for Computational Linguistics and the 7th International Joint Conference on Natural Language Processing", vol. 1, LONG PAPERS, article "Improved Semantic Representations From Tree-Structured Long Short-Term Memory Networks", pages: 1556 - 1566 |
| PENGCHENG YINCHUNTING ZHOUJUNXIAN HEGRAHAM NEUBIG: "Proceedings of the 56th Annual Meeting of the Association for Computational Linguistics", vol. 1, LONG PAPERS, article "StructVAE: Tree-structured Latent Variable Models for Semi-supervised Semantic Parsing", pages: 754 - 765 |
| See also references of EP4116881A4 |
| WANG, CHEN ET AL.: "SAG-VAE: End-to-end Joint Inference of Data Representations and Feature Relations", ARXIV:1911.11984V2, 20 February 2020 (2020-02-20), pages 1 - 15, XP033831488, Retrieved from the Internet <URL:https://arxiv.org/abs/1911.11984v2>.> [retrieved on 20210408] * |
Cited By (1)
| Publication number | Priority date | Publication date | Assignee | Title |
|---|---|---|---|---|
| CN119339008A (zh) * | 2024-12-20 | 2025-01-21 | 杭州宇泛智能科技股份有限公司 | 基于多模态数据的场景空间三维模型动态建模方法 |
Also Published As
| Publication number | Publication date |
|---|---|
| CN115136150A (zh) | 2022-09-30 |
| EP4116881A4 (en) | 2024-03-20 |
| EP4116881A1 (en) | 2023-01-11 |
| JP2021140551A (ja) | 2021-09-16 |
| JP7359394B2 (ja) | 2023-10-11 |
| US20230013870A1 (en) | 2023-01-19 |
Similar Documents
| Publication | Publication Date | Title |
|---|---|---|
| JP7359394B2 (ja) | 情報処理装置および機械学習方法 | |
| US11687786B2 (en) | Pre-processing for data-driven model creation | |
| JP7267985B2 (ja) | 直接型ニューラルネットワーク構造を用いてアイテムを推奨するシステム、方法、及びコンピュータプログラム | |
| CN119377498B (zh) | 基于群体行为分析的私域流量调度与内容分发方法及系统 | |
| US11699095B2 (en) | Cross-domain recommender systems using domain separation networks and autoencoders | |
| CA3007853C (en) | End-to-end deep collaborative filtering | |
| US8983888B2 (en) | Efficient modeling system for user recommendation using matrix factorization | |
| KR102551997B1 (ko) | 콘텐츠 시청 성향 분석 기반 광고 콘텐츠 기획 자동화 및 커머스 플랫폼 서비스 제공 방법, 장치 및 시스템 | |
| CN115221396B (zh) | 基于人工智能的信息推荐方法、装置及电子设备 | |
| KR20200131549A (ko) | 인공지능 모델을 이용한 상품 판매량 예측 방법, 장치 및 시스템 | |
| JP2018195308A (ja) | プロセス及び製造業における業績評価指標のデータに基づく最適化のための方法及びシステム | |
| US20240346389A1 (en) | Ensemble learning model for time-series forecasting | |
| KR102669470B1 (ko) | 식자재 유통 처리를 위한 재고 관리 및 수요 예측 방법, 장치 및 시스템 | |
| Benadi et al. | Quantitative prediction of interactions in bipartite networks based on traits, abundances, and phylogeny | |
| KR102546871B1 (ko) | 인공지능 모델 기반 b2b 식자재 및 부자재의 유통의 주문 히스토리의 패턴 분석을 통한 주문 정보 추천 방법, 장치 및 시스템 | |
| KR102612805B1 (ko) | 기업 정보에 따른 인공지능 모델 기반 매체 큐레이션 서비스 제공 방법, 장치 및 시스템 | |
| CN117173885A (zh) | 一种基于动态图特征学习的交通状态预测方法及系统 | |
| Wu et al. | A user behavior-aware multi-task learning model for enhanced short video recommendation | |
| CN113259163B (zh) | 一种基于网络拓扑感知的Web服务质量预测方法及系统 | |
| KR20220151453A (ko) | 상품의 가격 예측 방법 | |
| Moradi et al. | Constructing explainable health indicators for aircraft engines by developing an interpretable neural network with discretized weights: M. Moradi et al. | |
| JP7839030B2 (ja) | 機械学習方法、情報処理システム、情報処理装置、サーバーおよびプログラム | |
| KR102814499B1 (ko) | 정상 데이터 기반 계층적 오토인코더를 이용한 헤어핀 모터 예지보전 시스템 및 방법 | |
| Eisenhauer | The approximate solution of finite‐horizon discrete‐choice dynamic programming models | |
| CN116304686A (zh) | 模型训练方法、点击率确定方法及相关设备 |
Legal Events
| Date | Code | Title | Description |
|---|---|---|---|
| 121 | Ep: the epo has been informed by wipo that ep was designated in this application |
Ref document number: 21764535 Country of ref document: EP Kind code of ref document: A1 |
|
| ENP | Entry into the national phase |
Ref document number: 2021764535 Country of ref document: EP Effective date: 20221006 |
|
| NENP | Non-entry into the national phase |
Ref country code: DE |