WO2021199937A1 - 金属組織の撮影条件決定方法、金属組織の撮影方法、金属組織の相分類方法、金属組織の撮影条件決定装置、金属組織の撮影装置、金属組織の相分類装置、金属材料の材料特性予測方法および金属材料の材料特性予測装置 - Google Patents
金属組織の撮影条件決定方法、金属組織の撮影方法、金属組織の相分類方法、金属組織の撮影条件決定装置、金属組織の撮影装置、金属組織の相分類装置、金属材料の材料特性予測方法および金属材料の材料特性予測装置 Download PDFInfo
- Publication number
- WO2021199937A1 WO2021199937A1 PCT/JP2021/009006 JP2021009006W WO2021199937A1 WO 2021199937 A1 WO2021199937 A1 WO 2021199937A1 JP 2021009006 W JP2021009006 W JP 2021009006W WO 2021199937 A1 WO2021199937 A1 WO 2021199937A1
- Authority
- WO
- WIPO (PCT)
- Prior art keywords
- phase
- metal structure
- imaging
- feature value
- metal
- Prior art date
- Legal status (The legal status is an assumption and is not a legal conclusion. Google has not performed a legal analysis and makes no representation as to the accuracy of the status listed.)
- Ceased
Links
Images








Classifications
-
- G—PHYSICS
- G01—MEASURING; TESTING
- G01N—INVESTIGATING OR ANALYSING MATERIALS BY DETERMINING THEIR CHEMICAL OR PHYSICAL PROPERTIES
- G01N21/00—Investigating or analysing materials by the use of optical means, i.e. using sub-millimetre waves, infrared, visible or ultraviolet light
- G01N21/17—Systems in which incident light is modified in accordance with the properties of the material investigated
-
- G—PHYSICS
- G01—MEASURING; TESTING
- G01N—INVESTIGATING OR ANALYSING MATERIALS BY DETERMINING THEIR CHEMICAL OR PHYSICAL PROPERTIES
- G01N1/00—Sampling; Preparing specimens for investigation
- G01N1/28—Preparing specimens for investigation including physical details of (bio-)chemical methods covered elsewhere, e.g. G01N33/50, C12Q
- G01N1/32—Polishing; Etching
-
- G—PHYSICS
- G01—MEASURING; TESTING
- G01N—INVESTIGATING OR ANALYSING MATERIALS BY DETERMINING THEIR CHEMICAL OR PHYSICAL PROPERTIES
- G01N21/00—Investigating or analysing materials by the use of optical means, i.e. using sub-millimetre waves, infrared, visible or ultraviolet light
- G01N21/84—Systems specially adapted for particular applications
-
- G—PHYSICS
- G01—MEASURING; TESTING
- G01N—INVESTIGATING OR ANALYSING MATERIALS BY DETERMINING THEIR CHEMICAL OR PHYSICAL PROPERTIES
- G01N33/00—Investigating or analysing materials by specific methods not covered by groups G01N1/00 - G01N31/00
- G01N33/20—Metals
- G01N33/204—Structure thereof, e.g. crystal structure
-
- G—PHYSICS
- G06—COMPUTING OR CALCULATING; COUNTING
- G06N—COMPUTING ARRANGEMENTS BASED ON SPECIFIC COMPUTATIONAL MODELS
- G06N20/00—Machine learning
-
- G—PHYSICS
- G06—COMPUTING OR CALCULATING; COUNTING
- G06N—COMPUTING ARRANGEMENTS BASED ON SPECIFIC COMPUTATIONAL MODELS
- G06N3/00—Computing arrangements based on biological models
- G06N3/02—Neural networks
- G06N3/08—Learning methods
-
- G—PHYSICS
- G06—COMPUTING OR CALCULATING; COUNTING
- G06N—COMPUTING ARRANGEMENTS BASED ON SPECIFIC COMPUTATIONAL MODELS
- G06N5/00—Computing arrangements using knowledge-based models
- G06N5/01—Dynamic search techniques; Heuristics; Dynamic trees; Branch-and-bound
-
- G—PHYSICS
- G06—COMPUTING OR CALCULATING; COUNTING
- G06T—IMAGE DATA PROCESSING OR GENERATION, IN GENERAL
- G06T7/00—Image analysis
- G06T7/0002—Inspection of images, e.g. flaw detection
- G06T7/0004—Industrial image inspection
-
- G—PHYSICS
- G06—COMPUTING OR CALCULATING; COUNTING
- G06T—IMAGE DATA PROCESSING OR GENERATION, IN GENERAL
- G06T7/00—Image analysis
- G06T7/10—Segmentation; Edge detection
- G06T7/11—Region-based segmentation
-
- G—PHYSICS
- G06—COMPUTING OR CALCULATING; COUNTING
- G06V—IMAGE OR VIDEO RECOGNITION OR UNDERSTANDING
- G06V10/00—Arrangements for image or video recognition or understanding
- G06V10/10—Image acquisition
-
- G—PHYSICS
- G06—COMPUTING OR CALCULATING; COUNTING
- G06V—IMAGE OR VIDEO RECOGNITION OR UNDERSTANDING
- G06V10/00—Arrangements for image or video recognition or understanding
- G06V10/70—Arrangements for image or video recognition or understanding using pattern recognition or machine learning
- G06V10/764—Arrangements for image or video recognition or understanding using pattern recognition or machine learning using classification, e.g. of video objects
-
- G—PHYSICS
- G06—COMPUTING OR CALCULATING; COUNTING
- G06V—IMAGE OR VIDEO RECOGNITION OR UNDERSTANDING
- G06V10/00—Arrangements for image or video recognition or understanding
- G06V10/98—Detection or correction of errors, e.g. by rescanning the pattern or by human intervention; Evaluation of the quality of the acquired patterns
- G06V10/993—Evaluation of the quality of the acquired pattern
-
- G—PHYSICS
- G06—COMPUTING OR CALCULATING; COUNTING
- G06V—IMAGE OR VIDEO RECOGNITION OR UNDERSTANDING
- G06V20/00—Scenes; Scene-specific elements
- G06V20/70—Labelling scene content, e.g. deriving syntactic or semantic representations
-
- H—ELECTRICITY
- H04—ELECTRIC COMMUNICATION TECHNIQUE
- H04N—PICTORIAL COMMUNICATION, e.g. TELEVISION
- H04N23/00—Cameras or camera modules comprising electronic image sensors; Control thereof
- H04N23/60—Control of cameras or camera modules
- H04N23/64—Computer-aided capture of images, e.g. transfer from script file into camera, check of taken image quality, advice or proposal for image composition or decision on when to take image
-
- G—PHYSICS
- G01—MEASURING; TESTING
- G01N—INVESTIGATING OR ANALYSING MATERIALS BY DETERMINING THEIR CHEMICAL OR PHYSICAL PROPERTIES
- G01N21/00—Investigating or analysing materials by the use of optical means, i.e. using sub-millimetre waves, infrared, visible or ultraviolet light
- G01N21/17—Systems in which incident light is modified in accordance with the properties of the material investigated
- G01N2021/1765—Method using an image detector and processing of image signal
-
- G—PHYSICS
- G06—COMPUTING OR CALCULATING; COUNTING
- G06T—IMAGE DATA PROCESSING OR GENERATION, IN GENERAL
- G06T2207/00—Indexing scheme for image analysis or image enhancement
- G06T2207/10—Image acquisition modality
- G06T2207/10056—Microscopic image
-
- G—PHYSICS
- G06—COMPUTING OR CALCULATING; COUNTING
- G06T—IMAGE DATA PROCESSING OR GENERATION, IN GENERAL
- G06T2207/00—Indexing scheme for image analysis or image enhancement
- G06T2207/10—Image acquisition modality
- G06T2207/10141—Special mode during image acquisition
-
- G—PHYSICS
- G06—COMPUTING OR CALCULATING; COUNTING
- G06T—IMAGE DATA PROCESSING OR GENERATION, IN GENERAL
- G06T2207/00—Indexing scheme for image analysis or image enhancement
- G06T2207/20—Special algorithmic details
- G06T2207/20081—Training; Learning
-
- G—PHYSICS
- G06—COMPUTING OR CALCULATING; COUNTING
- G06T—IMAGE DATA PROCESSING OR GENERATION, IN GENERAL
- G06T2207/00—Indexing scheme for image analysis or image enhancement
- G06T2207/20—Special algorithmic details
- G06T2207/20084—Artificial neural networks [ANN]
-
- G—PHYSICS
- G06—COMPUTING OR CALCULATING; COUNTING
- G06T—IMAGE DATA PROCESSING OR GENERATION, IN GENERAL
- G06T2207/00—Indexing scheme for image analysis or image enhancement
- G06T2207/30—Subject of image; Context of image processing
- G06T2207/30108—Industrial image inspection
- G06T2207/30136—Metal
-
- G—PHYSICS
- G06—COMPUTING OR CALCULATING; COUNTING
- G06T—IMAGE DATA PROCESSING OR GENERATION, IN GENERAL
- G06T2207/00—Indexing scheme for image analysis or image enhancement
- G06T2207/30—Subject of image; Context of image processing
- G06T2207/30168—Image quality inspection
Definitions
- the present invention relates to a method for determining imaging conditions for a metal structure, a method for photographing a metal structure, a method for classifying a phase of a metal structure, a device for determining a photographing condition for a metal structure, a device for photographing a metal structure, a phase classification device for a metal structure, and a material for a metal material.
- the present invention relates to a property prediction method and a material property prediction device for metallic materials.
- a metal material such as a steel plate has the same composition
- its characteristics strongly depend on the metal structure of the scale (mm to ⁇ m scale) at the level of an optical microscope or an electron microscope. Therefore, when developing a high-strength steel plate, a method of changing the composition such as a method of utilizing solid solution strengthening by adding a solid solution strengthening element or a method of precipitation strengthening using a precipitate by adding a precipitation strengthening element is used.
- a method of improving the mechanical properties by changing the finally realized metal structure by changing the heat treatment conditions with the same composition is used.
- the metal material is observed with an optical microscope or an electron microscope, and the metal structure is quantified. It is important to evaluate. In fact, in the field of material development, microstructure observation of metal materials with different heat treatment conditions is carried out on a daily basis.
- the ferrite phase and the martensite phase are observed with different contrasts, and both phases can be distinguished.
- the volume fraction of each phase of the metal structure composed of the soft ferrite phase and the hard martensite phase and the shape of the metal structure change, and the mechanical properties change significantly. Therefore, material development is routinely performed in an attempt to realize the mechanical properties required as a material by controlling the volume fraction of each phase of the metal structure and the shape of the metal structure.
- Identifying (classifying) and extracting a phase from an image of a metal structure is generally called “segmentation”, but in conventional segmentation, each phase of the tissue image is defined.
- this method not only requires an enormous amount of time to analyze a single tissue image, but also recognizes the phase differently depending on the operator, so that there is a large error depending on the operator who performs the hand coating. .. Therefore, in reality, segmentation by hand coating is rarely performed, and the evaluation of the tissue image is limited to a qualitative evaluation.
- a threshold value of the brightness value is set for the image data of the captured metal structure, and the image is converted using a computer or the like so as to have two colors, so that only a specific phase is extracted and each color is obtained. The phase fraction is measured by determining the area of.
- This method can accurately classify the phases when the brightness values are clearly different for each phase of the metallographic structure.
- the metallographic structure can be quantitatively evaluated much faster than the above-mentioned hand coating.
- the difference in brightness value for each phase is not clear, and when the difference in brightness value is not clear, the error becomes large, so that it is not possible to classify accurately in many cases.
- the brightness value depends on the etching time on the order of 10-2 s, which is difficult to control in the sample preparation performed before imaging with the metal material. Changes. Therefore, there is a problem that the binarization threshold value must be redetermined for each captured tissue image even if the phases are the same.
- the brightness value of an image can be changed by changing the intensity of the light source.
- the binarization threshold value must be redetermined for each photographer.
- Patent Document 1 discloses the following techniques. First, the image of the part on the surface of the human body is converted into an image in the opposite color space, and each of the components in the opposite color space of the image in the opposite color space is decomposed into subband images having different spatial frequencies. Then, for this subband image, feature values corresponding to the parts on the surface of the human body are calculated, and the appearance of the parts on the surface of the human body is evaluated based on the feature values. By using this technique, it is possible to objectively and quickly evaluate the skin condition, texture, etc. from the image of human skin.
- Patent Document 2 discloses the following techniques. First, a plurality of binarized images are generated by performing the binarization process a plurality of times while making the reference value for binarization different for one tissue image obtained by photographing the tissue. Subsequently, for each of the plurality of binarized images, the number of hole-shaped regions is calculated, and the number of features that characterizes the correspondence between the plurality of binarized reference values and the number of hole-shaped regions is specified. Then, the output information corresponding to this number of features is generated.
- Patent Document 1 since the technique disclosed in Patent Document 1 is only a technique for evaluating the skin tissue, it is difficult to apply it to the structure of a metal material such as a steel plate. Furthermore, it is difficult to deal with contrast differences and the like that vary depending on etching conditions that are difficult to control. Similarly, the technique disclosed in Patent Document 2 is a technique for analyzing an image of a living cell, and it is difficult to apply it to an analysis of a tissue image whose contrast greatly fluctuates due to etching, such as a metal material. Is.
- the present invention has been made in view of the above, and even when the imaging conditions vary depending on the etching conditions, the imaging means, or the photographer, the imaging of the metal structure capable of accurately classifying the phases of the metal structure is possible.
- Condition determination method metal structure imaging method, metal structure phase classification method, metal structure imaging condition determination device, metal structure imaging device, metal structure phase classification device, material property prediction method for metal materials, and materials for metal materials It is an object of the present invention to provide a characteristic predictor.
- the method for determining the imaging condition of the metal structure is a method for determining the imaging condition when photographing the metal structure of the metal material, and a predetermined sample preparation can be performed.
- a photographing step of photographing a part of the metal structure of the metal material applied under predetermined photographing conditions and one or a plurality of predetermined phases of the metal structure with respect to the image photographed in the photographing step corresponds to a photographing step of photographing a part of the metal structure of the metal material applied under predetermined photographing conditions and one or a plurality of predetermined phases of the metal structure with respect to the image photographed in the photographing step.
- the feature value with the label is input, and the feature value calculated in the feature value calculation step is input to the model learned in advance by using the label of each phase as the output, and the pixel corresponding to the input feature value is input.
- the phase classification step of classifying the phase of the metal structure of the image and the imaging conditions for photographing the other part of the metal structure based on the classification result of the phase classification step can be obtained. It includes a step of determining shooting conditions to be determined.
- the imaging step photographs a part of the metal structure under a plurality of predetermined imaging conditions, and the imaging condition determination step is performed.
- the imaging condition that maximizes the classification accuracy of each phase in the phase classification step is determined as the imaging condition when photographing the other part of the metal structure.
- the method for determining the imaging condition of the metal structure is a method for determining the imaging condition when photographing the metal structure of the metal material, and a predetermined sample preparation can be performed.
- a photographing step of continuously photographing a part of the applied metal structure while changing the photographing conditions, a feature value calculation step of calculating one or more feature values of the image photographed in the photographing step, and the above-mentioned A feature calculated in the feature value calculation step for a model learned in advance by inputting a feature value of a pixel to which a predetermined one or more phase labels of the metal structure are attached and using the label of each phase as an output.
- the imaging condition determination step of determining the imaging conditions when photographing the other part of the metal structure from the plurality of imaging conditions used in the imaging step is included.
- the imaging condition determining step has the highest classification accuracy of each phase in the phase classification step among the imaging conditions used in the imaging step.
- the imaging condition is determined as an imaging condition when photographing other parts of the metal structure.
- the imaging conditions include at least one of a contrast value, a brightness value, and an intensity of a light source.
- the metal material is roughly polished and then buffed using a polishing material of 0.05 ⁇ m to 2 ⁇ m. It includes a polishing step and an etching step of etching the metal material with a nital solution having a nitrate concentration of 0.5% to 8%, which is prepared by mixing ethanol and nitric acid.
- the method for photographing a metal structure according to the present invention comprises, after the above-mentioned method for determining imaging conditions for a metal material, the other part of the metal structure of the metal material. Shoot under the shooting conditions determined by the shooting condition determination method.
- the phase classification method of the metal structure according to the present invention photographs the metal structure by the above-mentioned method of photographing the metal structure and classifies the phase of the metal structure of the metal structure. do.
- the imaging condition determining device for a metal structure is an imaging condition determining device for photographing the metal structure of a metal material, and a predetermined sample preparation can be performed.
- a photographing unit that photographs a part of the metal structure of the metal material that has been applied under predetermined imaging conditions, and an image photographed by the imaging unit correspond to one or more predetermined phases of the metal structure.
- a phase designation unit that assigns a label for each phase to a pixel to be used, a feature value calculation unit that calculates one or more feature values for a pixel to which a label for each phase is assigned by the phase designation unit, and a feature value calculation unit for each phase.
- the feature value with the label is input, the feature value calculated by the feature value calculation unit is input to the model learned in advance by using the label of each phase as the output, and the pixels corresponding to the input feature value are input.
- the phase classification unit that classifies the phase of the metal structure of the image and the imaging conditions for photographing other parts of the metal structure based on the classification result of the phase classification unit can be obtained. It is provided with a shooting condition determination unit for determining.
- the imaging condition determining device for a metal structure is an imaging condition determining device for photographing the metal structure of a metal material, and a predetermined sample preparation can be performed.
- An imaging unit that continuously photographs a part of the applied metal structure while changing the imaging conditions, a feature value calculation unit that calculates one or more feature values for an image captured by the imaging unit, and the above.
- a shooting condition determining unit for determining a shooting condition when photographing the other part of the metal structure from a plurality of shooting conditions used in the shooting unit is provided.
- the metal structure imaging apparatus captures other parts of the metal structure of the metal material under the imaging conditions determined by the imaging condition determining apparatus. Take a picture below.
- the metal structure phase classification device photographs the metal structure by the above-mentioned metal structure imaging device and classifies the phases of the metal structure of the metal structure. do.
- the material property prediction method for a metal material is a material property prediction method for a metal material that predicts the material property of the metal material, and has the above-mentioned metal structure.
- a quantitative evaluation step of calculating the quantitative evaluation value of the metal structure by calculating the size, area ratio or shape of each classified phase, the quantitative evaluation value, and the quantitative evaluation value are prepared in advance.
- the material property prediction device for a metal material is a material property prediction device for a metal material that predicts the material properties of the metal material, and is a phase of the metal structure.
- An input unit for inputting an image in which the classification has been performed, a quantitative evaluation unit for calculating a quantitative evaluation value of a metal structure by calculating the size, area ratio, or shape of each classified phase, and the quantitative evaluation value.
- a data recording unit that records data in a database
- a data selection unit that selects data to be used for predicting the material properties of the metal material from the quantitative evaluation values and the material properties of the metal material recorded in the database.
- a model generation unit that generates a prediction model that predicts the material properties of the metal material using the selected data, and a material property prediction unit that predicts the material properties of the metal material using the generated prediction model. It is provided with an output unit that outputs the material properties of the metal material.
- the method for determining the imaging condition of the metal structure the method for photographing the metal structure, the method for classifying the phase of the metal structure, the apparatus for determining the imaging condition of the metal structure, the apparatus for photographing the metal structure, and the phase classification device for the metal structure according to the present invention, the following It has an effect like. That is, in segmentation for classifying the phases of important metal structures that have a great influence on various material properties such as mechanical properties and corrosion properties, even when the photographing conditions vary depending on the etching conditions, the photographing means, or the photographer. The phases of the metallographic structure can be classified accurately. In addition, it is possible to determine the imaging conditions that can be evaluated quantitatively.
- the material property prediction method for metal materials and the material property prediction device for metal materials according to the present invention quantitative evaluation can be efficiently performed from the classification result of the phase of the metal structure. Therefore, the material properties of the metal material can be accurately predicted by deriving the correlation between the quantitative evaluation value and the material properties of the metal material. As a result, the material properties of the metal material can be grasped at the same time as viewing the image of the metal structure, so that the efficiency of the development of the metal material (for example, a steel plate) can be improved.
- FIG. 1 is a block diagram showing a schematic configuration of an imaging condition determining device and an imaging device for a metal structure according to the first embodiment of the present invention.
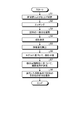
- FIG. 2 is a flowchart showing a method for determining shooting conditions and a flow of the shooting method according to the first embodiment of the present invention.
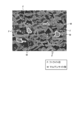
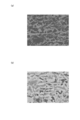
- FIG. 3 is a diagram showing a microstructure photograph of a DP steel sheet taken using a scanning electron microscope and a luminance value profile on the line L1.
- FIG. 4 is a block diagram showing a schematic configuration of an imaging condition determining device and an imaging device for a metal structure according to a second embodiment of the present invention.
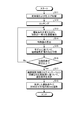
- FIG. 5 is a flowchart showing a method for determining shooting conditions and a flow of the shooting method according to the second embodiment of the present invention.
- FIG. 1 is a block diagram showing a schematic configuration of an imaging condition determining device and an imaging device for a metal structure according to the first embodiment of the present invention.
- FIG. 2 is a flowchart showing a method
- FIG. 6 is a block diagram showing a schematic configuration of a material property prediction device for a metal material according to an embodiment of the present invention.
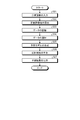
- FIG. 7 is a flowchart showing a flow of a material property prediction method for a metal material according to an embodiment of the present invention.
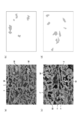
- FIG. 8 is an example of a method for determining imaging conditions and an imaging method according to the first embodiment of the present invention, and is a diagram showing a phase of a metal structure designated when constructing a database.
- FIG. 9 is an example of a method for determining imaging conditions and an imaging method according to the first embodiment of the present invention, and is a diagram showing a phase of a metal structure designated in the phase designation step.
- FIG. 8 is an example of a method for determining imaging conditions and an imaging method according to the first embodiment of the present invention, and is a diagram showing a phase of a metal structure designated in the phase designation step.
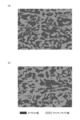
- FIG. 10 is an example of a method for determining imaging conditions and an imaging method according to the first embodiment of the present invention, and is a diagram showing the results of classification in the phase classification step.
- the region which was correctly classified is shown in gray.
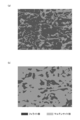
- FIG. 11 shows an example of the imaging condition determination method and the imaging method according to the first embodiment of the present invention, in which the tissue images captured by adjusting the contrast value in the second imaging step are classified by the phase classification step. It is a figure which shows the phase of the metal structure.
- FIG. 12 is a comparative example of the imaging condition determination method and the imaging method according to the first embodiment of the present invention, in which the microstructure image captured without adjusting the contrast value is classified in the phase classification step. It is a figure which shows.
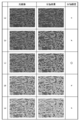
- FIG. 13 shows an example of the imaging condition determination method and the imaging method according to the second embodiment of the present invention, in which the contrast value of the sample prepared by the method A is changed in the first imaging step. It is a figure which shows the tissue image which was taken continuously, and the phase classification image corresponding to the tissue image.
- FIG. 14 shows an example of the imaging condition determination method and the imaging method according to the second embodiment of the present invention, in which the contrast value of the sample prepared by the method B is changed in the first imaging step. It is a figure which shows the tissue image which was taken continuously, and the phase classification image corresponding to the tissue image.
- FIG. 14 shows an example of the imaging condition determination method and the imaging method according to the second embodiment of the present invention, in which the contrast value of the sample prepared by the method B is changed in the first imaging step. It is a figure which shows the tissue image which was taken continuously, and the phase classification image corresponding to the tissue image.
- FIG. 15 is a comparative example of the imaging condition determination method and the imaging method according to the second embodiment of the present invention, and shows a tissue image captured without changing the contrast value and a phase classification image corresponding to the tissue image. It is a figure which shows.
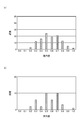
- FIG. 16 is an example of the material property prediction method for a metal material according to the present invention, and is a diagram showing a histogram of the roundness of the ferrite phase and the martensite phase calculated from the microstructure image of FIG. 11A. ..
- FIG. 17 is an example of the material property prediction method for a metal material according to the present invention, and is a diagram showing a histogram of the roundness of the ferrite phase and the martensite phase calculated from the microstructure image of FIG. 11 (b). ..
- FIG. 18 is an example of the material property prediction method for a metal material according to the present invention, and is a diagram showing a prediction result of tensile strength by a prediction model (neural network model) generated by the prediction
- the method for determining the imaging condition of the metal structure and the imaging condition determining device provide important information for controlling the characteristics of the metal material used as a material for various products such as structural members and automobile members. It is a method and an apparatus for determining the imaging conditions of a metal structure when learning the phase of the metal structure. Further, the method and apparatus for photographing a metal structure according to the present embodiment are a method and an apparatus for photographing a metal structure under the imaging conditions determined by the imaging condition determining method and the imaging condition determining apparatus.
- the metal material used in this embodiment is, for example, a DP steel sheet composed of a ferrite phase and a martensite phase.
- the imaging condition determination method and the imaging method using these devices and the model generation method will be described.
- the material property prediction method using this device will be described.
- the shooting condition determination device 1 includes a shooting unit 10, a storage unit 20, a calculation unit 30, and an output unit 40.
- the photographing apparatus according to the present embodiment is realized by the same configuration as the photographing condition determining device 1 shown in the figure.
- the photographing unit 10 is a means for taking a tissue image of a metal material and inputting it to the calculation unit 30.
- the photographing unit 10 is composed of a known photographing device such as an optical microscope or a scanning electron microscope widely used for photographing a tissue image, for example.
- the storage unit 20 is composed of a recording medium such as an EPROM (Erasable Programmable ROM), a hard disk drive (Hard Disk Drive: HDD), a solid state drive (Solid State Drive: SSD), and removable media.
- a recording medium such as an EPROM (Erasable Programmable ROM), a hard disk drive (Hard Disk Drive: HDD), a solid state drive (Solid State Drive: SSD), and removable media.
- removable media include disc recording media such as USB (Universal Serial Bus) memory, CD (Compact Disc), DVD (Digital Versatile Disc), and BD (Blu-ray (registered trademark) Disc).
- the storage unit 20 can store an operating system (Operating System: OS), various programs, various tables, various databases, and the like.
- OS Operating System
- the arithmetic unit 30 is realized by, for example, a processor including a CPU (Central Processing Unit) and a memory (main storage unit) including a RAM (Random Access Memory) and a ROM (Read Only Memory).
- the arithmetic unit 30 loads the program into the work area of the main storage unit, executes the program, and controls each component or the like through the execution of the program to realize a function that meets a predetermined purpose.
- the calculation unit 30 functions as a phase designation unit 31, a feature value calculation unit 32, a phase classification unit 33, and a shooting condition determination unit 34 through the execution of the above-mentioned program. The details of each part will be described later.
- the output unit 40 is an output means for outputting the calculation result by the calculation unit 30.
- the output unit 40 is composed of, for example, a display, a printer, a smartphone, or the like.
- the output unit 40 is, for example, a phase of the metal structure designated by the phase designation unit 31, a feature value of the phase of the metal structure calculated by the feature value calculation unit 32, and a result of classifying the phase of the metal structure by the phase classification unit 33.
- the shooting conditions and the like determined by the shooting condition determination unit 34 are output.
- the output format of the output unit 40 is not particularly limited, and data such as a text file or an image file or a format projected onto an output device may be output.
- a method of determining shooting conditions using the shooting condition determining device 1 and a shooting method using the shooting device will be described with reference to FIG.
- the imaging condition determination method the polishing step S1, the etching process S2, the first imaging process S3, the phase designation process S4, the feature value calculation process S5, the phase classification process S6, and the imaging condition determination step S7 are included. In this order. Further, in the photographing method, a second photographing step S8 is performed after each step of the photographing condition determining method. Hereinafter, each step will be described.
- polishing step S1 rough polishing and finish polishing are sequentially performed on the metal material to be observed.
- rough polishing for example, a commercially available sandpaper obtained by applying abrasive grains to paper is used to remove scratches visible to the naked eye.
- finish polishing buffing is performed using a polishing material having a thickness of 0.05 ⁇ m to 2 ⁇ m.
- abrasive a known abrasive such as diamond or silica can be used.
- finish polishing buffing is performed until scratches disappear when observed with an optical microscope at a magnification of 10 to 500 times, for example.
- polishing is performed so as not to leave scratches as much as possible.
- buffing is preferably performed because scratches become invisible when observed with an optical microscope at a magnification of 1000 or less.
- ⁇ Etching process S2> In metal materials, the amount of corrosion differs depending on the phase such as the ferrite phase or the martensite phase. Therefore, by etching, it is possible to add contrast to each phase and classify the phases.
- a nital solution having a nitric acid concentration of 0.5% to 8% which was prepared by mixing ethanol and nitric acid, was used to prepare a metal material (sample) into a nital solution for 0.5 s to 10.0 s. After soaking, it is washed with distilled water.
- the nital solution may be sprayed onto the metal material by mist blowing, and after 0.5 s to 10.0 s have elapsed, the metal material may be washed with distilled water. Further, in the etching step S2, instead of immersing the metal material in the nital solution, the nital solution is attached to the metal material using a soft cloth such as gauze, and after 0.5 s to 10.0 s have elapsed, the metal material is washed with distilled water. You may.
- the etching step S2 it is preferable to perform etching under the conditions that the nitric acid concentration difference from the etching solution in the etching step when the model is generated is less than 0.1% and the immersion time difference is less than 2.0 s. This makes it possible to improve the classification accuracy (reduce the classification error) in the phase classification step S6 described later.
- First shooting step S3> In the first photographing step S3, the photographing unit 10 previously prepares a part of the metal structure of the metal material (a part of the view of the metal structure) that has undergone predetermined sample preparation (the polishing step S1 and the etching step S2). Shoot under the specified shooting conditions.
- the above-mentioned "photographing condition” includes a contrast value and a brightness value when the photographing unit 10 is a scanning electron microscope, and includes the intensity of a light source when the photographing unit 10 is an optical microscope.
- the first photographing step S3 specifically, a part of the metal structure is photographed under a plurality of predetermined photographing conditions. That is, when the photographing unit 10 is a scanning electron microscope, a plurality of images of the same portion of the metal structure are taken while changing the contrast value or the brightness value. When the photographing unit 10 is an optical microscope, a plurality of images of the same portion of the metal structure are photographed while changing the intensity of the light source.
- phase designation unit 31 assigns a label for each phase to the pixels corresponding to one or a plurality of predetermined phases of the metal structure in the structure image taken in the first photographing step S3. Specify the phase by. "Giving a label for each phase to the pixels of each phase of the structure image” means, for example, in the case of a DP steel plate, the pixels corresponding to the ferrite phase and the martensite phase are specified in the structure image, and the pixels of the structure image and ferrite are used. It shows that the phase and the martensite phase are associated with each other (see FIG. 8).
- each phase may be designated by specifying a plurality of points for each pixel of the tissue image, or by enclosing a size of about the crystal grain size. Further, in the phase designation step S4, in order to improve the phase classification accuracy (reduce the classification error) in the second photographing step S8 described later, it is preferable to designate two or more regions of each phase in a plane.
- the feature value calculation unit 32 calculates one or more feature values for the pixels labeled with each phase in the phase designation step S4. For example, one or more of the following feature values (1) to (8) are calculated.
- Identity feature value is a feature value indicating the brightness value itself of the tissue image.
- the Mean feature value is a feature value indicating an average value of brightness values in a predetermined range of a tissue image. That is, the Mean feature value is obtained by extracting a predetermined range "number of pixels x x number of pixels y" from each phase of the tissue image and averaging the brightness values in the range.
- the "number of pixels x" and the “number of pixels y" may be the same size or different sizes. Further, the "number of pixels x" and the "number of pixels y" are, for example, 1/2 of the crystal grain size of the plurality of phases of the metal structure, which is larger than the noise contained in the structure image and has the smaller crystal grain size. It is preferable that the range includes a size less than.
- the region of x-pixel ⁇ y-pixel does not have to be rectangular.
- the region of x-pixel ⁇ y-pixel is also spherical.
- the Mean feature value may be calculated for a plurality of pixels x and y. If the pixel range is made too large, it will be affected by grain boundaries and other adjacent phases. Therefore, it is preferable that the pixel range includes a size of less than 1/2 of the crystal grain size of the larger crystal grain size.
- the "noise contained in the tissue image” indicates, for example, a portion of the tissue image in which the brightness value suddenly increases (see, for example, part A in FIG. 3B). And, “making the number of pixels x and y larger than the noise” means that the width of the noise (see part B in (b) of the same figure) is made larger.
- FIG. 3A shows a tissue image (original image) taken with a scanning electron microscope
- FIG. 3B shows a line profile of the brightness value of the central portion (position of the L1 line) of the tissue image. ing.
- the Gaussian feature value is a feature value indicating an average value of luminance values whose weight is increased toward the center in a predetermined range of a tissue image. That is, the Gaussian feature value is obtained by extracting a predetermined range "number of pixels x x number of pixels y" from each phase of the tissue image and extracting an average value having a larger weight toward the center pixel.
- the "number of pixels x" and the “number of pixels y" may be the same size or different sizes.
- the "number of pixels x" and the “number of pixels y" are, for example, 1/2 of the crystal grain size of the plurality of phases of the metal structure, which is larger than the noise contained in the structure image and has the smaller crystal grain size. It is preferable that the range includes a size less than. When there is anisotropy, it is preferable to set the size of the crystal grain size in each of the x-direction and the y-direction. Further, the region of x-pixel ⁇ y-pixel does not have to be rectangular. For example, when the tissue image has a spherical shape, it is preferable that the region of x-pixel ⁇ y-pixel is also spherical.
- the Gaussian feature value may be calculated for a plurality of pixels x and y. If the pixel range is made too large, it will be affected by grain boundaries and other adjacent phases. Therefore, it is preferable that the pixel range includes a size of less than 1/2 of the crystal grain size of the larger crystal grain size.
- the operator can arbitrarily set how much weight should be given to the central pixel, but the Gaussian function shown in the following equation (1) can be used. preferable.
- ⁇ x and ⁇ y of the above equation (1) can be expressed as the following equations (2) and (3).
- the Median feature value is a feature value indicating the center value of the brightness value in a predetermined range of the tissue image. That is, the Median feature value is obtained by extracting a predetermined range "number of pixels x x number of pixels y" from each phase of the tissue image and extracting the center from the brightness value in the predetermined range.
- the "number of pixels x" and the “number of pixels y" may be the same size or different sizes. Further, the "number of pixels x" and the “number of pixels y" are, for example, 1/2 of the crystal grain size of the plurality of phases of the metal structure, which is larger than the noise contained in the structure image and has the smaller crystal grain size.
- the range includes a size less than.
- the region of x-pixel ⁇ y-pixel does not have to be rectangular.
- the region of x-pixel ⁇ y-pixel is also spherical.
- the Median feature value may be calculated for a plurality of pixels x and y. If the pixel range is made too large, it will be affected by grain boundaries and other adjacent phases. Therefore, it is preferable that the pixel range includes a size of less than 1/2 of the crystal grain size of the larger crystal grain size.
- Max feature value is a feature value indicating the maximum value of the brightness value in a predetermined range of the tissue image. That is, the Max feature value is obtained by extracting a predetermined range "number of pixels x x number of pixels y" from each phase of the tissue image and extracting the maximum value from the brightness value in the predetermined range.
- the "number of pixels x" and the “number of pixels y" may be the same size or different sizes. Further, the "number of pixels x" and the "number of pixels y" are, for example, 1/2 of the crystal grain size of the plurality of phases of the metal structure, which is larger than the noise contained in the structure image and has the smaller crystal grain size.
- the range includes a size less than.
- the region of x-pixel ⁇ y-pixel does not have to be rectangular.
- the region of x-pixel ⁇ y-pixel is also spherical.
- the Max feature value may be calculated for a plurality of pixels x and y. If the pixel range is made too large, it will be affected by grain boundaries and other adjacent phases. Therefore, it is preferable that the pixel range includes a size of less than 1/2 of the crystal grain size of the larger crystal grain size.
- the Min feature value is a feature value indicating the minimum value of the brightness value in a predetermined range of the tissue image. That is, the Min feature value is obtained by extracting a predetermined range "number of pixels x x number of pixels y" from each phase of the tissue image and extracting the minimum value from the luminance value in the predetermined range.
- the "number of pixels x" and the “number of pixels y" may be the same size or different sizes. Further, the "number of pixels x" and the “number of pixels y" are, for example, 1/2 of the crystal grain size of the plurality of phases of the metal structure, which is larger than the noise contained in the structure image and has the smaller crystal grain size.
- the range includes a size less than.
- the region of x-pixel ⁇ y-pixel does not have to be rectangular.
- the region of x-pixel ⁇ y-pixel is also spherical.
- the Min feature value may be calculated for a plurality of pixels x and y. If the pixel range is made too large, it will be affected by grain boundaries and other adjacent phases. Therefore, it is preferable that the pixel range includes a size of less than 1/2 of the crystal grain size of the larger crystal grain size.
- Derivative feature value For the Derivative feature value, a predetermined range "number of pixels x x number of pixels y" is extracted from each phase of the tissue image, and the differential values in the x and y directions are calculated for the pixels at the ends thereof. The feature value is calculated for each direction.
- the "number of pixels x" and the “number of pixels y" may be the same size or different sizes. Further, the "number of pixels x" and the “number of pixels y" are, for example, 1/2 of the crystal grain size of the plurality of phases of the metal structure, which is larger than the noise contained in the structure image and has the smaller crystal grain size. It is preferable that the range includes a size less than.
- the region of x-pixel ⁇ y-pixel does not have to be rectangular.
- the region of x-pixel ⁇ y-pixel is also preferably spherical, and is differentiated in a plurality of directions. It is desirable to calculate the value. Further, the Derivative feature value may be calculated for a plurality of pixels x and y. If the pixel range is made too large, it will be affected by grain boundaries and other adjacent phases. Therefore, it is preferable that the pixel range includes a size of less than 1/2 of the crystal grain size of the larger crystal grain size.
- Derivative addition feature value is any of the above-mentioned Mean feature value, Gaussian feature value, Media feature value, Max feature value, and Min feature value with respect to the above-mentioned Derivative feature value, or from these. Derivative feature values in one direction or a plurality of directions are added by calculating a plurality of selected feature values.
- the above-mentioned "number of pixels x" and “number of pixels y" may be the same size or different sizes. Further, the "number of pixels x" and the "number of pixels y" are, for example, 1/2 of the crystal grain size of the plurality of phases of the metal structure, which is larger than the noise contained in the structure image and has the smaller crystal grain size.
- the range includes a size less than.
- the region of x-pixel ⁇ y-pixel does not have to be rectangular.
- the region of x-pixel ⁇ y-pixel is also spherical.
- the Derivative addition feature value may be calculated for a plurality of pixels x and y. If the pixel range is made too large, it will be affected by grain boundaries and other adjacent phases. Therefore, it is preferable that the pixel range includes a size of less than 1/2 of the crystal grain size of the larger crystal grain size.
- the above-mentioned feature values (1) to (8) perform calculations on a large number of pixels in each phase, they have different feature values even if they are in the same phase, and the features for each phase. You can create a histogram of values. Further, all of the above feature values (1) to (8) may be calculated, or only a part of the feature values may be calculated. Further, a feature value that combines the operations of each feature value may be added, and a feature value not listed above may be added as needed. These selections are preferably made by the operator so as to improve the classification accuracy of the phases, and it is preferable to adopt the feature values having a large difference in the feature values of each phase.
- the predetermined range "number of pixels x x number of pixels y" is taken out and the feature value is calculated. This "number of pixels x x number of pixels y" is calculated. The feature value convoluted with respect to the central pixel of "" is calculated. Then, the feature value of each position is calculated while moving "the number of pixels x x the number of pixels y" on the tissue image. Further, when “the number of pixels x x the number of pixels y" is located at the edges (upper, lower, left, and right edges) on the tissue image, a boundary condition is imposed or the number of pixels is limited from the center to the edge. Calculate the value.
- the feature value is calculated by extrapolating from the center to the outside using an interpolation function such as a linear function, an exponential function, or a spline function.
- phase classification unit 33 performs segmentation using a pre-generated model (for example, a decision tree). That is, in the phase classification step S6, the feature value with the label of each phase is input, and the label of each phase is used as the output to calculate the pre-learned model (for example, a decision tree) in the feature value calculation step S5. Enter the feature value. Then, by acquiring the label of the phase of the pixel corresponding to the input feature value, the phase of the metal structure of the structure image is classified.
- a pre-generated model for example, a decision tree
- the imaging condition determination unit 34 determines other parts of the metal structure (other parts of the metal structure) different from the portion photographed in the first imaging step S3 based on the classification result of the phase classification step S6. Determine the shooting conditions when shooting the field of view).
- the imaging condition determination step S7 specifically, among the plurality of imaging conditions used in the first imaging step S3, the imaging conditions in which the classification accuracy of each phase in the phase classification step S6 is the highest are set to other imaging conditions of the metal structure. It is decided as a shooting condition when shooting the part of.
- the shooting conditions are determined so that the weighted average correct answer rate obtained by weighting the correct answer rates of the two phases (ferrite phase and martensite phase) is maximized. If the correct answer rate of one of the two phases is more important, the weight given to the correct answer rate of the one phase is increased. When the correct answer rates of both phases are equalized, the weights given to the correct answer rates of both phases are set to the same value.
- the imaging conditions are selected so that the phase specified in the phase designation step S4 is classified with an accuracy of 80% or more.
- the imaging conditions are selected so that they are classified with an accuracy of 95% or more.
- a method other than the method of classifying using the model consisting of the decision tree described above may be used.
- the phases are classified by calculating the inner product of the feature vector consisting of the feature values. May be good.
- ⁇ Second shooting step S8> the photographing unit 10 photographs the other part of the metal structure under the photographing conditions determined in the photographing condition determining step S7. This is the end of this flow.
- the phase classification step S6 described above is performed on the photographed tissue image to classify the phase of the metal structure of the structure image.
- the feature value calculation result may be output from the output unit 40.
- the output format at that time is not particularly limited, and may be output in either a text file (for example, a set of numerical values) or an image file (for example, a histogram image, a tissue image showing feature values).
- the phase classification result may be output from the output unit 40.
- the output format at that time is not particularly limited, and either a text file or an image file (for example, an image in which the classified phases are color-coded with respect to the tissue image (hereinafter referred to as "phase classification image")) is used. You may output it.
- the phase classification image may be output from the output unit 40 by superimposing it on the tissue image photographed in the first photographing step S3 or by arranging it side by side with the tissue image.
- Model generation method The method for determining the imaging conditions and the method for generating the model used in the phase classification step S6 of the imaging method will be described. It should be noted that this model may be generated in advance before the above-mentioned method for determining shooting conditions and the method for shooting.
- a model generation method a polishing step, an etching step, a photographing step, a phase designation step, a feature value calculation step, and a model generation step are performed in this order.
- the specific methods of the polishing step, the etching step, the photographing step, the phase designation step, and the feature value calculation step are the same as those of each step of the photographing condition determination method described above.
- the same polishing and etching are performed on the metal material having the same phase as the metal material to be observed (hereinafter referred to as "observation sample") so as to be the metal material to be observed.
- observation sample the metal material having the same phase as the metal material to be observed
- the metal structure of the metal material is photographed.
- the phase designation step the phase is designated by assigning a label for each phase to the pixels corresponding to one or a plurality of predetermined phases of the metal structure in the structure image taken in the photographing step.
- the feature value calculation step one or more feature values among the above-mentioned feature values (1) to (8) are calculated for the pixels labeled with each phase in the phase designation step, and each phase of the metal structure is calculated. Build a database that stores feature values.
- the feature values calculated in the feature value calculation step are input for the pixels labeled with each phase, and the label of each phase is output.
- a model is generated by learning as (machine learning). Specifically, in the model generation step, a decision tree in which feature values are set as branching conditions is generated.
- the machine learning method in the model generation process is not limited to the decision tree, and may be, for example, a random forest or a neural network, but in the present embodiment, the decision tree will be described as an example.
- the phases of the metallographic structure are classified by repeating binarization a plurality of times from the feature values of each phase calculated in the feature value calculation step.
- the accuracy of classifying each phase is set in advance from the phase specified by the operator and the feature value of each phase calculated in the feature value calculation process, and based on the set numerical information. , Learn branching by binarization.
- the binarization branch when the binarization branch is set to be performed with an accuracy of 80%, the feature value is classified so that the phase classification is performed with a probability of 80% or more from the specified phase and its feature value.
- a decision tree is created by repeatedly learning binarization.
- the accuracy may be set arbitrarily by the operator, but the lower limit is preferably 80% or more. If the accuracy is less than 80%, the classification accuracy will decrease. On the contrary, if the accuracy is set too high, overfitting causes the classification accuracy to deteriorate in the image classification after learning. Therefore, the upper limit of accuracy is preferably less than 99%.
- the order of binarization (branching order) of each feature value when binarization is performed multiple times may be specified in advance by the operator, or is randomly determined using a random number. You may. Since the optimum order of binarization of each feature value is often unknown in advance, it is preferable to use a random number to search the binarization order of each feature value that can be classified with the above-mentioned accuracy or higher by a computer. .. Similarly, since the optimum number of binarization of each feature value is often unknown in advance, it is preferable to have a computer search for the number of binarization of each feature value that can be classified with the above-mentioned accuracy or higher. Further, the feature value used as the branching condition at the time of binarization may be used a plurality of times as the branching condition.
- phase classification method In the phase classification method of the metal structure according to the present embodiment, the metal structure is photographed by the above-mentioned imaging method, and the phase of the metal structure of the metal structure is classified.
- the phase classification device that executes the phase classification method may be realized by the same configuration as the imaging condition determination device 1, or may be realized by a configuration different from that of the imaging condition determination device 1.
- the classification device the following effects are obtained. That is, in segmentation for classifying the phases of important metal structures that have a great influence on various material properties such as mechanical properties and corrosion properties, even when the photographing conditions vary depending on the etching conditions, the photographing means, or the photographer.
- the phases of the metallographic structure can be classified accurately.
- the sample is used.
- the following processing is performed. First, a plurality of phases to be classified in advance are specified, and the designated area is automatically adjusted to shooting conditions (for example, a contrast value) that can be accurately classified based on a model prepared in advance. Then, by photographing the remaining metal material under the photographing conditions adjusted in this way, it is possible to cope with the difference in the contrast value that fluctuates due to a slight change in the etching conditions.
- segmentation can be performed automatically and accurately.
- the conventional method when observing an observation sample, it is not possible to perform accurate segmentation unless polishing and etching are performed under the same conditions as when the model was generated.
- polishing and etching are performed under the same conditions as when the model was generated.
- the method according to the present invention it is possible to perform segmentation with high accuracy even when the polishing / etching conditions at the time of model generation are deviated. This eliminates the need to match polishing / etching conditions that are difficult to control, and makes it possible to efficiently classify tissue images.
- the method for determining the imaging conditions of the metal structure, the method for photographing the metal structure, the method for classifying the phase of the metal structure, the apparatus for determining the imaging conditions for the metal structure 1, the imaging device for the metal structure, and the phase classification device for the metal structure according to the present embodiment are as follows. Even under the above conditions, the phase classification of the tissue image can be performed accurately. For example, even when the roughness of the abrasive material for finish polishing in the polishing step is in the range of 0.05 ⁇ m to 2 ⁇ m and the nitric acid concentration of the etching solution in the etching step is in the range of 0.5% to 8%, the structure The phase classification of the image can be performed accurately.
- a method for determining imaging conditions for a metal structure a method for photographing a metal structure, a method for classifying a phase of a metal structure, a device for determining an imaging condition for a metal structure, a device for determining a photographing condition for a metal structure, and a phase classification device for a metal structure according to a second embodiment of the present invention. Will be described with reference to FIGS. 4 and 5.
- the photographing condition determining device 1A includes a photographing unit 10, a storage unit 20, a calculation unit 50, and an output unit 40.
- the photographing apparatus according to the present embodiment has the same configuration as the photographing condition determining device 1A shown in the figure.
- the calculation unit 50 functions as a feature value calculation unit 51, a phase classification unit 52, and a shooting condition determination unit 53 through the execution of the program. The details of each part will be described later.
- a method of determining shooting conditions using the shooting condition determining device 1A and a shooting method using the shooting device will be described with reference to FIG.
- the imaging condition determination method the polishing process S11, the etching process S12, the first imaging process S13, the feature value calculation process S14, the phase classification process S15, the classification accuracy determination process S16, and the imaging condition determination step S17 are used. , In this order. Further, in the photographing method, a second photographing step S18 is performed after each step of the photographing condition determining method.
- the polishing step S11, the etching step S12, the feature value calculation step S14, the phase classification step S15, and the second photographing step S18 are the polishing step S1, the etching step S2, the feature value calculation step S5, and the phase of the first embodiment. This is the same as the classification step S6 and the second photographing step S8. Therefore, the description thereof will be omitted.
- the model used in the phase classification step S15 is the same as the model used in the phase classification step S6 of the first embodiment described above.
- the etching step S12 it is preferable to perform etching under the conditions that the nitric acid concentration difference from the etching solution in the etching step when the model is generated is less than 0.1% and the immersion time difference is less than 2.0 s.
- the classification accuracy in the second photographing step S18 can be improved (classification error can be reduced).
- the change width of the shooting conditions for example, the contrast value
- the first shooting step S13 can be reduced, so that the number of images to be continuously shot can be reduced.
- the imaging unit 10 photographs a part of the metal structure of the metal material (a part of the visual field of the metal structure) that has undergone predetermined sample preparation (polishing step S11 and etching step S12). Shoot continuously while changing the conditions. That is, in the first photographing step S13, when the photographing unit 10 is a scanning electron microscope, the above-mentioned “shooting condition” includes a contrast value and a brightness value. Further, the above-mentioned “shooting condition” includes the intensity of the light source when the photographing unit 10 is an optical microscope.
- the imaging unit 10 when the imaging unit 10 is a scanning electron microscope, an acceleration voltage of 0.5 kV to 20 kV is used. Then, based on the contrast value and brightness value initially set by the photographer, continuous shooting of 5 or more images is automatically performed while changing the contrast value and brightness value back and forth.
- the photographing unit 10 is an optical microscope, five or more continuous photographs are automatically taken while changing the intensity of the light source back and forth around the intensity of the light source initially set by the photographer.
- the light source of the optical microscope for example, a reflection mirror, a tungsten lamp or a halogen lamp can be used.
- the number of captured images is preferably 20 or less.
- the imaging condition determination unit 53 determines whether or not the classification accuracy of the segmentation in the phase classification step S15 is equal to or higher than a predetermined value. Then, the photographing condition determination unit 53 proceeds to the imaging condition determination step S17 when the classification accuracy is equal to or higher than a predetermined value, and returns to the first imaging step S13 when the classification accuracy is equal to or higher than a predetermined value.
- the imaging condition determination unit 53 determines the imaging conditions based on the classification result of the phase classification step S15, that is, the determination result of the classification accuracy determination step S16.
- the imaging condition determination step S17 among the plurality of imaging conditions used in the first imaging step S13, other parts of the metal structure (other visual fields of the metal structure) different from the portion photographed in the first imaging step S13. ) Is determined when shooting.
- the imaging condition determination step S17 specifically, among the imaging conditions used in the first imaging step S13, the imaging conditions in which the classification accuracy of each phase in the phase classification step S15 is the highest are set to the other parts of the metal structure. It is decided as a shooting condition when shooting.
- the feature value calculation result may be output from the output unit 40.
- the output format at that time is not particularly limited, and may be output in either a text file (for example, a set of numerical values) or an image file (for example, a histogram image, a tissue image showing feature values).
- the phase classification result may be output from the output unit 40.
- the output format at that time is not particularly limited, and may be output in either a text file or an image file (for example, a phase classification image) format.
- the phase classification image may be superimposed on the tissue image photographed in the first photographing step S13 or arranged next to the tissue image and output from the output unit 40.
- the shooting conditions may be determined by accepting the input from the shooting condition determining device 1A and the photographer who handles the shooting device.
- the imaging condition determination unit 53 outputs the tissue images after the classification of the plurality of phases by superimposing them on the plurality of tissue images captured in the first imaging step S13 or by arranging them next to the plurality of tissue images. Output from unit 40. Based on this output result, the photographer selects a tissue image (tissue image after phase classification) that seems to have the highest classification accuracy of each phase through an input unit (not shown).
- the imaging condition determination unit 53 determines the imaging conditions corresponding to the tissue image selected by the photographer as the imaging conditions when photographing other parts of the metal structure.
- phase classification method In the phase classification method of the metal structure according to the present embodiment, the metal structure is photographed by the above-mentioned imaging method, and the phase of the metal structure of the metal structure is classified.
- the phase classification device that executes the phase classification method may be realized by the same configuration as the imaging condition determination device 1, or may be realized by a configuration different from that of the imaging condition determination device 1.
- the classification device the following effects are obtained. That is, in segmentation for classifying the phases of important metal structures that have a great influence on various material properties such as mechanical properties and corrosion properties, even when the photographing conditions vary depending on the etching conditions, the photographing means, or the photographer.
- the phases of the metallographic structure can be classified accurately.
- the following Perform processing like when taking a tissue image of a metal material after sample preparation, the image is continuously photographed while changing the imaging conditions (for example, contrast value), and from a plurality of photographed tissue images, based on a model prepared in advance. Select shooting conditions that can be classified accurately. Then, by photographing the remaining metal material under the photographing conditions adjusted in this way, it is possible to cope with the difference in the contrast value that fluctuates due to a slight change in the etching conditions.
- the imaging conditions for example, contrast value
- the method for determining the imaging condition of the metal structure the method for photographing the metal structure, the phase classification method for the metal structure, the imaging condition determining device 1A for the metal structure, the imaging device for the metal structure, and the phase classification device for the metal structure according to the present embodiment.
- segmentation can be performed with high accuracy.
- the method according to the present invention when observing an observation sample, it is not possible to perform accurate segmentation unless polishing and etching are performed under the same conditions as when the model was generated.
- the material property prediction device 3 (Material property prediction device for metal materials)
- the material property prediction device 3 includes an input unit 70, an output unit 80, a calculation unit 90, and a storage unit 100.
- the input unit 70 is an input means for inputting an image in which the phases of the metal structure are classified (hereinafter, referred to as “classification image”) to the calculation unit 90.
- classification image the phase of the metal structure is classified by the above-mentioned method of classifying the phase of the metal structure, or the phase of the metal structure is classified by other methods such as binarization of the brightness value. It is an image etc.
- the output unit 80 is an output means for outputting the calculation result by the calculation unit 90.
- the output unit 80 is composed of, for example, a display, a printer, a smartphone, or the like.
- the output unit 80 obtains, for example, the quantitative evaluation value of the metal structure calculated by the quantitative evaluation unit 91, the data recorded in the database of the storage unit 100, the prediction result (material characteristics of the metal material) by the material property prediction unit 95, and the like.
- the output format of the output unit 80 is not particularly limited, and data such as a text file or an image file or a format projected onto an output device may be output.
- the arithmetic unit 90 is realized by, for example, a processor composed of a CPU or the like and a memory composed of a RAM, a ROM, or the like.
- the arithmetic unit 90 loads a program into the work area of the main storage unit, executes the program, and controls each component or the like through the execution of the program to realize a function that meets a predetermined purpose.
- the calculation unit 90 functions as a quantitative evaluation unit 91, a data recording unit 92, a data selection unit 93, a model generation unit 94, and a material property prediction unit 95 through the execution of the above-mentioned program. Details of each part will be described later (see FIG. 7).
- the storage unit 100 is composed of a recording medium such as an EPROM, a solid state drive, and a removable medium.
- the storage unit 100 stores, for example, a database in which predetermined data is recorded, a prediction model (learned model) generated by the model generation unit 94, and the like.
- a prediction model generated by the model generation unit 94, and the like.
- the quantitative evaluation value of the metal structure calculated by the quantitative evaluation unit 91 the material characteristic value (steel plate data) of the metal material obtained in advance by a mechanical test or the like, the component composition of the metal material, the metal material, etc. Is recorded.
- a method of learning the phase of the metal structure using the material property prediction device 3 will be described with reference to FIG. 7.
- the method for learning the phase of the metal structure is carried out by using the classification result (classification image) after performing the above-mentioned method for classifying the phase of the metal structure.
- the method for learning the phase of the metal structure is an image input step S21, a quantitative evaluation step S22, a data recording step S23, a data selection step S24, a model generation step S25, a material property prediction step S26, and a prediction result output step. S27 and so on are performed in this order.
- Image input process S21> In the image input step S21, the input unit 70 inputs the classification image to the calculation unit 90.
- the quantitative evaluation unit 91 calculates the quantitative evaluation value of the metal structure by quantitatively evaluating each phase included in the classification image.
- quantitative evaluation values as shown in the following (1) to (5) are calculated.
- the area ratio of the phase is calculated by obtaining the area of the classified phase.
- the major axis, minor axis, or aspect ratio of the ellipsoid is calculated by approximating the shape of each grain of the classified phases to an ellipsoid.
- the average diameter of the grains is derived by obtaining the area of each grain of the classified phase and taking the square root of the area.
- Roundness Obtain the area and circumference of each grain of the classified phase, and calculate the roundness of the grain by the following formula (4).
- the roundness is 1.0 when the grain is a perfect circle, and conversely, it becomes smaller than 1.0 as the grain deviates from the shape of the perfect circle.
- the data recording unit 92 records the quantitative evaluation value of the metal structure calculated in the quantitative evaluation step S22 in the database of the storage unit 100.
- the data selection unit 93 selects data to be used for predicting the material properties of the metal material from the quantitative evaluation values of the metal structure recorded in the database and the data of the material properties of the metal material (the data to be used for predicting the material properties of the metal material). Extract.
- the quantitative evaluation value is calculated for each grain, there are cases where a plurality of numerical values can be obtained for one tissue image.
- a plurality of numerical values can be obtained for one tissue image.
- the average value may be calculated and only the average value may be used for the prediction of the material property, or the standard deviation may be used for the prediction of the material property.
- the data selection step S24 it is desirable to select a quantitative evaluation value with good prediction accuracy of the material properties in the prediction model generation step S25 described later.
- the component composition of the metal material and the heat treatment conditions may be input.
- the model generation unit 94 generates a prediction model that predicts the material properties of the metal material using the data selected in the data selection step S24.
- a prediction model for predicting material properties is generated using the quantitative evaluation values, the component composition of the metal material, the heat treatment conditions, and the like selected in the data selection step S24.
- a prediction model is also generated using the data of the material properties of the metal material selected in the data selection step S24.
- the prediction model may be generated using a model such as a neural network, a support vector regression, or a Gaussian process regression, or may be generated as a simple regression equation such as a linear regression. Further, in the generation of the prediction model, it is preferable to predict the material properties using a plurality of prediction models and adopt the prediction model having the highest prediction accuracy.
- the measured value is taken on the X-axis and the predicted value is taken on the Y-axis, and it is confirmed by a two-dimensional graph how much the two data match, or the prediction error of each data. Is added and evaluated by the parameters divided by the number of data. Further, it is preferable to evaluate the prediction accuracy of the material properties by the following procedure, for example. First, the data selected from the database is divided into data used for parameter fitting in the prediction model (training data) and data not used for fitting (test data). Then, the prediction accuracy of the material properties is evaluated based on the degree of agreement between the predicted value of the test data and the measured value.
- the operator may select and divide the data, or after determining the ratio of training data and test data, randomize using random numbers or the like. You may decide on.
- the material property prediction unit 95 predicts the material properties of the metal material by using the prediction model generated in the prediction model generation step S25. Specifically, in the material property prediction step S26, the material properties of the metal material are predicted by inputting the quantitative evaluation value selected in the data selection step S24 into the prediction model generated in the prediction model generation step S25.
- the output unit 80 outputs the prediction result in the material property prediction step S26, that is, the material property of the metal material.
- the material property prediction method for metal materials and the material property prediction device for metal materials according to the present embodiment quantitative evaluation can be efficiently performed from the classification result of the phase of the metal structure. Therefore, the material properties of the metal material can be predicted accurately by deriving the correlation between the quantitative evaluation value and the material properties of the metal material. As a result, the material properties of the metal material can be grasped at the same time as viewing the image of the metal structure, so that the efficiency of the development of the metal material (for example, a steel plate) can be improved.
- the material property prediction method for metal materials and the material property prediction device for metal materials according to the present embodiment it is possible to efficiently quantitatively evaluate the metal structure unlike the conventional method by efficient segmentation of the structure image. Become.
- the index quantified in this way it is possible to accurately predict the material properties of the captured tissue image.
- Example 1 An imaging condition determination method and an example of the imaging method according to the first embodiment of the present invention will be described with reference to FIGS. 8 to 12.
- a DP steel plate (hereinafter referred to as "sample") is roughly polished and then scratched when observed with an optical microscope at a magnification of 500. Finish polishing was performed using 0.06 ⁇ m alumina as an abrasive until it disappeared (polishing step).
- etching step a tissue image of the sample after etching was taken using a scanning electron microscope (photographing step).
- the ferrite phase and the martensite phase were designated in the microstructure image (phase designation step). Subsequently, the identity feature value, the Mean feature value of 2pixel to 32pixel, the Gausian feature value, the Median feature value, the Max feature value, the Min feature value, the Derivative feature value, and the Derivative feature value are calculated for the two designated phases. , A database of feature values for each phase was constructed (feature value calculation process). Subsequently, a decision tree for classifying the ferrite phase and the martensite phase was created by repeatedly binarizing the ferrite phase and the martensite phase specified earlier so that they could be classified with an accuracy of 95% or more. Model generation process).
- finish polishing is performed by two methods (method A and method B) different from those when the database was constructed, as shown in Table 1 below. And etching was performed (polishing step and etching step). Subsequently, using a scanning electron microscope, a tissue image of a part of the two samples after etching was taken with a plurality of contrast values (first photographing step). Subsequently, as shown in FIGS. 9A and 9B, a plurality of ferrite phase and martensite phase were designated for the microstructure images of the two types of samples after imaging (phase designation step). Subsequently, the same feature values as when the database was constructed were calculated for the designated area (feature value calculation step), and the phases were classified based on the decision tree (phase classification step).
- FIGS. 10A to 10D the contrast value that can be classified most accurately among the contrast values at the time of shooting was determined (shooting condition determination step).
- FIG. 10B the region correctly classified in FIG. 10A is shown in gray.
- FIG. 10 (d) the regions correctly classified in (c) are shown in gray.
- a tissue image of the other part of the two samples was taken (second imaging step).
- FIG. 11 (a) The result of segmentation of the tissue image of the sample prepared by the method A in Table 1 is shown in FIG. 11 (a), and the result of segmentation of the tissue image of the sample prepared by the method B is shown in FIG. 11 (b). ), Each is shown. Further, for comparison, the segmentation results of the tissue images taken without performing the contrast adjustment by the method of the present invention for the samples prepared by the methods A and B in Table 1 are shown in FIGS. 12 (a) and 12 (b). ).
- FIGS. 11A and 11B it can be seen that the classification can be performed with high accuracy by adjusting the contrast by the method of the present invention.
- FIGS. 12 (a) and 12 (b) it can be seen that the classification cannot be performed accurately unless the contrast is adjusted by the method of the present invention.
- Example 2 An imaging condition determination method and an example of the imaging method according to the second embodiment of the present invention will be described with reference to FIGS. 8, 13 to 15.
- a DP steel plate (hereinafter referred to as "sample") is roughly polished and then scratched when observed with an optical microscope at a magnification of 500. Finish polishing was performed using 0.06 ⁇ m alumina as an abrasive until it disappeared (polishing step).
- etching step a tissue image of the sample after etching was taken using a scanning electron microscope (photographing step).
- the ferrite phase and the martensite phase were designated in the microstructure image (phase designation step). Subsequently, the identity feature value, the Mean feature value of 2pixel to 32pixel, the Gausian feature value, the Median feature value, the Max feature value, the Min feature value, the Derivative feature value, and the Derivative feature value are calculated for the two designated phases. , A database of feature values for each phase was constructed (feature value calculation process). Subsequently, a decision tree for classifying the ferrite phase and the martensite phase was created by repeatedly binarizing the ferrite phase and the martensite phase specified earlier so that they could be classified with an accuracy of 95% or more. Model generation process).
- finish polishing was performed by two methods (method A and method B) different from those when the database was constructed, as shown in Table 1 above. And etching was performed (polishing step and etching step).
- etching was performed (polishing step and etching step).
- tissue images of a part of the two samples after etching were continuously taken while automatically and continuously changing the contrast value at an acceleration voltage of 15 kV (first). Shooting process).
- feature value calculation step for the tissue images of 2 types ⁇ 5 samples, the same feature values as when the database was constructed were calculated (feature value calculation step), and the phases were classified based on the decision tree (phase classification step). ..
- FIG. 13 shows the result of segmentation of the tissue image of the sample prepared by the method A in Table 1
- FIG. 14 shows the result of segmentation of the tissue image of the sample prepared by the method B.
- the results of taking only one image without continuous photography in the first photographing step and performing segmentation are shown in FIGS. 15 (a) and 15 (b).
- FIGS. 13 and 14 in order from the left, a tissue image taken in the first photographing step, a phase classification image showing the phase classification result in the phase classification step, and the quality of the classification accuracy are shown.
- the phase classification accuracy is the best in the case of (e). Therefore, in the second photographing step, it can be seen that the other portion of the metal structure may be photographed by using the contrast value when the structure image of (e) is photographed. Further, in the segmentation result of FIG. 14, the phase classification accuracy is the best in the case of (c). Therefore, in the second photographing step, it can be seen that the other part of the metal structure may be photographed by using the contrast value when the structure image of (c) was photographed. On the other hand, in the segmentation result of FIG. 15, since the phase classification accuracy is poor, the phase classification accuracy is naturally poor when the tissue image of the same figure is photographed using the contrast value in the second imaging step. It is expected that.
- Example 3 The method for predicting the material properties of the metal material and the third embodiment of the device for predicting the material properties of the metal material according to the present invention will be described with reference to FIGS. 16 to 18.
- FIG. 16A shows a histogram of the roundness of the ferrite phase calculated from the classification result of Example 1 (see FIG. 11A).
- FIG. 16B shows a histogram of the roundness of the martensite phase calculated from the classification result of Example 1 (see FIG. 11A).
- FIG. 17A shows a histogram of the roundness of the ferrite phase calculated from the classification result of Example 1 (see FIG. 11B).
- FIG. 17B shows a histogram of the roundness of the martensite phase calculated from the classification result of Example 1 (see FIG. 11B).
- the component composition of the metal material is selected in addition to the average values of the area ratio and roundness of the ferrite phase and the martensite phase among the quantitative evaluation values calculated above, and the quantitative evaluation values (data selection step). , These data were used to predict material properties.
- a prediction model for predicting the tensile strength was generated from the above-mentioned quantitative evaluation value and the component composition of the metal material (prediction model generation step).
- the extracted data was randomly divided into training data and test data at a ratio of 9: 1.
- a neural network model was used to generate a prediction model for predicting tensile strength.
- FIG. 18 shows the prediction result of the tensile strength by the neural network model generated by the model generation unit.
- the horizontal axis shows the measured value of the tensile strength normalized by using the average value and the standard deviation of the tensile strength extracted from the database.
- the vertical axis shows the predicted value of the tensile strength standardized by using the average value of the tensile strength extracted from the database and the standard deviation.
- the round plot points indicate the prediction result of the tensile strength of the sample (training data) used for the parameter adjustment in the neural network model.
- the square plot points show the prediction results of the tensile strength of the sample (test data) not used for parameter adjustment.
- both the training data and the test data have good prediction accuracy of material properties, and by using the area ratio of the ferrite phase and the martensite phase, the average value of roundness, and the composition of the metal material, the tension is increased. It can be seen that the strength can be predicted accurately.
- the calculated quantitative evaluation value and the component composition of the metal material were used to calculate the predicted value of the tensile strength corresponding to the metal structures of FIGS. 11A and 11B.
- Table 2 shows the quantitative evaluation value, the predicted value of the tensile strength, and the measured value calculated from the tissue image. As shown in Table 2, it can be seen that the tensile strength can be predicted accurately.
- the method for determining the imaging conditions of the metal structure, the method for photographing the metal structure, the method for classifying the phase of the metal structure, the apparatus for determining the imaging conditions for the metal structure, the apparatus for imaging the metal structure, the phase classification device for the metal structure, the metal material according to the present invention The material property prediction method and the material property prediction device for metallic materials have been specifically described with reference to embodiments and examples for carrying out the invention, but the gist of the present invention is not limited to these descriptions, and claims are made. Must be broadly interpreted based on the description of the range of. Needless to say, various changes, modifications, etc. based on these descriptions are also included in the gist of the present invention.
- a method for determining imaging conditions of a metal structure a method for photographing a metal structure, a method for classifying a phase of a metal structure, and a method for predicting material properties of a metal material according to the present invention
- software that implements the method is generally commercially available. It may be realized by introducing it into a computer.
- a computer on the market is, for example, a CPU that executes instructions of a program that is software that realizes each function, and a recording medium (for example, a recording medium in which the software and various data are recorded in a form that can be read by the computer (or CPU)).
- the imaging condition determination device 1, the imaging device, the phase classification device, and the material property prediction device 3 according to the present invention have been described as one configuration as shown in FIGS. 1 and 6, but are realized by separate devices. It may be realized by one device.
- 1,1A Imaging condition determination device 3 Material property prediction device 10 Imaging unit 20 Storage unit 30 Calculation unit 31 Phase designation unit 32 Feature value calculation unit 33 Phase classification unit 34 Shooting condition determination unit 40 Output unit 50 Calculation unit 51 Feature value calculation unit 52 Phase classification unit 53 Imaging condition determination unit 70 Input unit 80 Output unit 90 Calculation unit 91 Quantitative evaluation unit 92 Data recording unit 93 Data selection unit 94 Model generation unit 95 Material characteristic prediction unit 100 Storage unit
Landscapes
- Engineering & Computer Science (AREA)
- Physics & Mathematics (AREA)
- General Physics & Mathematics (AREA)
- Theoretical Computer Science (AREA)
- Chemical & Material Sciences (AREA)
- Health & Medical Sciences (AREA)
- Life Sciences & Earth Sciences (AREA)
- General Health & Medical Sciences (AREA)
- Immunology (AREA)
- Pathology (AREA)
- Biochemistry (AREA)
- Analytical Chemistry (AREA)
- Computer Vision & Pattern Recognition (AREA)
- Multimedia (AREA)
- Quality & Reliability (AREA)
- Software Systems (AREA)
- Computing Systems (AREA)
- Artificial Intelligence (AREA)
- Evolutionary Computation (AREA)
- Crystallography & Structural Chemistry (AREA)
- Food Science & Technology (AREA)
- Computational Linguistics (AREA)
- Medicinal Chemistry (AREA)
- Mathematical Physics (AREA)
- General Engineering & Computer Science (AREA)
- Data Mining & Analysis (AREA)
- Medical Informatics (AREA)
- Molecular Biology (AREA)
- Biophysics (AREA)
- Biomedical Technology (AREA)
- Signal Processing (AREA)
- Databases & Information Systems (AREA)
- Investigating And Analyzing Materials By Characteristic Methods (AREA)
- Investigating Or Analysing Materials By Optical Means (AREA)
- Image Analysis (AREA)
- Analysing Materials By The Use Of Radiation (AREA)
Abstract
Description
本発明の第一実施形態に係る金属組織の撮影条件決定方法、金属組織の撮影方法、金属組織の相分類方法、金属組織の撮影条件決定装置、金属組織の撮影装置および金属組織の相分類装置について、図1および図2を参照しながら説明する。
金属組織の撮影条件決定装置(以下、「撮影条件決定装置」という)1について、図1を参照しながら説明する。撮影条件決定装置1は、撮影部10と、記憶部20と、演算部30と、出力部40と、を備えている。なお、本実施形態に係る撮影装置は、同図に示した撮影条件決定装置1と同一の構成によって実現される。
撮影条件決定装置1を用いた撮影条件決定方法および撮影装置を用いた撮影方法について、図2を参照しながら説明する。撮影条件決定方法では、研磨工程S1と、エッチング工程S2と、第一の撮影工程S3と、相指定工程S4と、特徴値算出工程S5と、相分類工程S6と、撮影条件決定工程S7と、をこの順で行う。また、撮影方法では、撮影条件決定方法の各工程の後に、第二の撮影工程S8を行う。以下、各工程について説明する。
研磨工程S1では、観察対象の金属材料に対して、粗研磨および仕上げ研磨を順に行う。粗研磨では、例えば紙に砥粒を塗布した市販の紙やすりを用い、肉眼レベルで見える傷を除去する。続いて、仕上げ研磨では、0.05μm~2μmの研磨材を用いたバフ研磨を行う。研磨剤としては、例えばダイヤモンドやシリカ等の公知の研磨剤を用いることができる。また、仕上げ研磨では、例えば光学顕微鏡によって10倍~500倍で観察した際に傷が見えなくなるまでバフ研磨を行う。また、研磨傷が多く残っているとエッチングむらの原因となり、相を分類する際の誤差の要因となるため、可能な限り傷が残らないように研磨を行う。仕上げ研磨では、好ましくは光学顕微鏡によって1000倍以下で観察した際に傷が見えなくなるためバフ研磨を行う。
金属材料では、フェライト相やマルテンサイト相等の相によって腐食量が異なるため、エッチングを行うことにより、相ごとにコントラストを付けることができ、相の分類が可能となる。エッチング工程S2では、エタノールおよび硝酸を混合して作成された、硝酸濃度が0.5%~8%のナイタール溶液を用い、金属材料(試料)を0.5s~10.0sの間ナイタール溶液に浸漬させた後、蒸留水によって洗浄を行う。
第一の撮影工程S3では、撮影部10が、所定の試料調整(上記研磨工程S1およびエッチング工程S2)が施された金属材料の金属組織の一部分(金属組織の一部の視野)を、予め定めた撮影条件の下で撮影する。前記した「撮影条件」としては、撮影部10が走査型電子顕微鏡である場合は、コントラスト値およびブライトネス値が含まれ、撮影部10が光学顕微鏡である場合は、光源の強さが含まれる。
相指定工程S4では、相指定部31が、第一の撮影工程S3で撮影した組織画像について、金属組織の予め定めた一または複数の相に対応する画素に対し、各相のラベルを付与することにより相を指定する。「組織画像の各相の画素に各相のラベルを付与する」とは、例えばDP鋼板の場合、組織画像内でフェライト相およびマルテンサイト相に対応する画素を特定し、組織画像の画素とフェライト相およびマルテンサイト相とを対応付けることを示している(図8参照)。なお、各相の指定は、組織画像の画素一点一点をポイントで複数点指定してもよく、あるいは結晶粒サイズ程度の大きさを囲うことにより面で指定してもよい。また、相指定工程S4では、後記する第二の撮影工程S8における相の分類精度を向上(分類誤差を減少)させるために、各相二つ以上の領域を面で指定することが好ましい。
特徴値算出工程S5では、特徴値算出部32が、相指定工程S4で各相のラベルを付与した画素について、一つ以上の特徴値を算出する。例えば以下の特徴値(1)~(8)のうちの一つ以上の特徴値を算出する。
恒等特徴値は、組織画像の輝度値そのものを示す特徴値である。
Mean特徴値は、組織画像の所定の範囲における輝度値の平均値を示す特徴値である。すなわち、Mean特徴値は、組織画像の各相から所定の範囲「画素数x×画素数y」を取り出し、その中の輝度値を平均したものである。「画素数x」および「画素数y」は、同一のサイズでもよく、異なるサイズでもよい。また、「画素数x」および「画素数y」は、例えば組織画像に含まれるノイズよりも大きく、かつ金属組織の複数の相のうち、結晶粒径が小さい方の結晶粒径の1/2未満の大きさが含まれる範囲とすることが好ましい。また、異方性がある場合は、各x方向、y方向の結晶粒サイズの大きさ程度に設定することが好ましい。また、x画素×y画素の領域は、長方形である必要はなく、例えば組織画像が球状の形状である場合は、x画素×y画素の領域も球状にすることが好ましい。また、Mean特徴値は、複数の画素数x,yについて算出してもよい。なお、画素の範囲を大きくしすぎると、粒界の影響や隣接する他相の影響が受ける。そのため、画素の範囲は、結晶粒径が大きい方の結晶粒径の1/2未満の大きさが含まれる範囲とすることが好ましい。
Gausian特徴値は、組織画像の所定の範囲において、中心に近いほど重みを大きくした輝度値の平均値を示す特徴値である。すなわち、Gausian特徴値は、組織画像の各相から所定の範囲「画素数x×画素数y」を取り出し、中心の画素ほど重みを大きくした平均値を取り出したものである。「画素数x」および「画素数y」は、同一のサイズでもよく、異なるサイズでもよい。また、「画素数x」および「画素数y」は、例えば組織画像に含まれるノイズよりも大きく、かつ金属組織の複数の相のうち、結晶粒径が小さい方の結晶粒径の1/2未満の大きさが含まれる範囲とすることが好ましい。また、異方性がある場合は、各x方向、y方向の結晶粒サイズの大きさ程度に設定することが好ましい。また、x画素×y画素の領域は、長方形である必要はなく、例えば組織画像が球状の形状である場合は、x画素×y画素の領域も球状にすることが好ましい。また、Gausian特徴値は、複数の画素数x,yについて算出してもよい。なお、画素の範囲を大きくしすぎると、粒界の影響や隣接する他相の影響が受ける。そのため、画素の範囲は、結晶粒径が大きい方の結晶粒径の1/2未満の大きさが含まれる範囲とすることが好ましい。


Median特徴値は、組織画像の所定の範囲における輝度値の中心値を示す特徴値である。すなわち、Median特徴値は、組織画像の各相から所定の範囲「画素数x×画素数y」を取り出し、その中の輝度値から中心地を取り出したものである。「画素数x」および「画素数y」は、同一のサイズでもよく、異なるサイズでもよい。また、「画素数x」および「画素数y」は、例えば組織画像に含まれるノイズよりも大きく、かつ金属組織の複数の相のうち、結晶粒径が小さい方の結晶粒径の1/2未満の大きさが含まれる範囲とすることが好ましい。また、異方性がある場合は、各x方向、y方向の結晶粒サイズの大きさ程度に設定することが好ましい。また、x画素×y画素の領域は、長方形である必要はなく、例えば組織画像が球状の形状である場合は、x画素×y画素の領域も球状にすることが好ましい。また、Median特徴値は、複数の画素数x,yについて算出してもよい。なお、画素の範囲を大きくしすぎると、粒界の影響や隣接する他相の影響が受ける。そのため、画素の範囲は、結晶粒径が大きい方の結晶粒径の1/2未満の大きさが含まれる範囲とすることが好ましい。
Max特徴値は、組織画像の所定の範囲における輝度値の最大値を示す特徴値である。すなわち、Max特徴値は、組織画像の各相から所定の範囲「画素数x×画素数y」を取り出し、その中の輝度値から最大値を取り出したものである。「画素数x」および「画素数y」は、同一のサイズでもよく、異なるサイズでもよい。また、「画素数x」および「画素数y」は、例えば組織画像に含まれるノイズよりも大きく、かつ金属組織の複数の相のうち、結晶粒径が小さい方の結晶粒径の1/2未満の大きさが含まれる範囲とすることが好ましい。また、異方性がある場合は、各x方向、y方向の結晶粒サイズの大きさ程度に設定することが好ましい。また、x画素×y画素の領域は、長方形である必要はなく、例えば組織画像が球状の形状である場合は、x画素×y画素の領域も球状にすることが好ましい。また、Max特徴値は、複数の画素数x,yについて算出してもよい。なお、画素の範囲を大きくしすぎると、粒界の影響や隣接する他相の影響が受ける。そのため、画素の範囲は、結晶粒径が大きい方の結晶粒径の1/2未満の大きさが含まれる範囲とすることが好ましい。
Min特徴値は、組織画像の所定の範囲における輝度値の最小値を示す特徴値である。すなわち、Min特徴値は、組織画像の各相から所定の範囲「画素数x×画素数y」を取り出し、その中の輝度値から最小値を取り出したものである。「画素数x」および「画素数y」は、同一のサイズでもよく、異なるサイズでもよい。また、「画素数x」および「画素数y」は、例えば組織画像に含まれるノイズよりも大きく、かつ金属組織の複数の相のうち、結晶粒径が小さい方の結晶粒径の1/2未満の大きさが含まれる範囲とすることが好ましい。また、異方性がある場合は、各x方向、y方向の結晶粒サイズの大きさ程度に設定することが好ましい。また、x画素×y画素の領域は、長方形である必要はなく、例えば組織画像が球状の形状である場合は、x画素×y画素の領域も球状にすることが好ましい。また、Min特徴値は、複数の画素数x,yについて算出してもよい。なお、画素の範囲を大きくしすぎると、粒界の影響や隣接する他相の影響が受ける。そのため、画素の範囲は、結晶粒径が大きい方の結晶粒径の1/2未満の大きさが含まれる範囲とすることが好ましい。
Derivative特徴値は、組織画像の各相から所定の範囲「画素数x×画素数y」を取り出し、そのうちの端の画素に対してx方向およびy方向の微分値を計算したものであり、各方向ごとに特徴値を演算する。「画素数x」および「画素数y」は、同一のサイズでもよく、異なるサイズでもよい。また、「画素数x」および「画素数y」は、例えば組織画像に含まれるノイズよりも大きく、かつ金属組織の複数の相のうち、結晶粒径が小さい方の結晶粒径の1/2未満の大きさが含まれる範囲とすることが好ましい。また、異方性がある場合は、各x方向、y方向の結晶粒サイズの大きさ程度に設定することが好ましい。また、x画素×y画素の領域は、長方形である必要はなく、例えば組織画像が球状の形状である場合は、x画素×y画素の領域も球状にすることが好ましく、複数の方向の微分値を演算することが望ましい。また、Derivative特徴値は、複数の画素数x,yについて算出してもよい。なお、画素の範囲を大きくしすぎると、粒界の影響や隣接する他相の影響が受ける。そのため、画素の範囲は、結晶粒径が大きい方の結晶粒径の1/2未満の大きさが含まれる範囲とすることが好ましい。
Derivative加算特徴値は、上記のDerivative特徴値に対して、上記のMean特徴値、Gaussian特徴値、Median特徴値、Max特徴値およびMin特徴値のいずれは、またはこれらから選択した複数の特徴値を演算することにより、1方向または複数の方向のDerivative特徴値を加算したものである。前記した「画素数x」および「画素数y」は、同一のサイズでもよく、異なるサイズでもよい。また、「画素数x」および「画素数y」は、例えば組織画像に含まれるノイズよりも大きく、かつ金属組織の複数の相のうち、結晶粒径が小さい方の結晶粒径の1/2未満の大きさが含まれる範囲とすることが好ましい。また、異方性がある場合は、各x方向、y方向の結晶粒サイズの大きさ程度に設定することが好ましい。また、x画素×y画素の領域は、長方形である必要はなく、例えば組織画像が球状の形状である場合は、x画素×y画素の領域も球状にすることが好ましい。また、Derivative加算特徴値は、複数の画素数x,yについて算出してもよい。なお、画素の範囲を大きくしすぎると、粒界の影響や隣接する他相の影響が受ける。そのため、画素の範囲は、結晶粒径が大きい方の結晶粒径の1/2未満の大きさが含まれる範囲とすることが好ましい。
相分類工程S6では、相分類部33が、予め生成されたモデル(例えば決定木)を用いてセグメンテーションを行う。すなわち、相分類工程S6では、各相のラベルが付与された特徴値を入力とし、各相のラベルを出力として予め学習されたモデル(例えば決定木)に対して、特徴値算出工程S5で算出した特徴値を入力する。そして、入力した特徴値に対応する画素の相のラベルを取得することにより、組織画像の金属組織の相を分類する。
撮影条件決定工程S7では、撮影条件決定部34が、相分類工程S6の分類結果に基づいて、第一の撮影工程S3で撮影した部分とは異なる金属組織のその他の部分(金属組織のその他の視野)を撮影する際の撮影条件を決定する。撮影条件決定工程S7では、具体的には、第一の撮影工程S3で用いた複数の撮影条件のうち、相分類工程S6における各相の分類精度が最も高くなる撮影条件を、金属組織のその他の部分を撮影する際の撮影条件として決定する。
第二の撮影工程S8では、撮影部10が、金属組織のその他の部分を、撮影条件決定工程S7で決定された撮影条件の下で撮影する。以上により、本フローは終了する。なお、第二の撮影工程S8の後は、例えば撮影した組織画像に対して、前記した相分類工程S6を実施し、組織画像の金属組織の相を分類する。
前記した撮影条件決定方法および撮影方法の相分類工程S6で用いるモデルの生成方法について説明する。なお、このモデルは、前記した撮影条件決定方法および撮影方法の実施前に予め生成しておけばよい。モデル生成方法は、研磨工程と、エッチング工程と、撮影工程と、相指定工程と、特徴値算出工程と、モデル生成工程と、をこの順で行う。なお、研磨工程、エッチング工程、撮影工程、相指定工程および特徴値算出工程の具体的な手法は、前記した撮影条件決定方法の各工程と同様である。
本実施形態に係る金属組織の相分類方法は、前記した撮影方法により金属組織を撮影し、該金属組織の金属組織の相を分類する。相分類方法を実行する相分類装置は、撮影条件決定装置1と同一の構成によって実現してもよく、撮影条件決定装置1と別の構成によって実現してもよい。
本発明の第二実施形態に係る金属組織の撮影条件決定方法、金属組織の撮影方法、金属組織の相分類方法、金属組織の撮影条件決定装置、金属組織の撮影装置および金属組織の相分類装置について、図4および図5を参照しながら説明する。
撮影条件決定装置1Aは、図4に示すように、撮影部10と、記憶部20と、演算部50と、出力部40と、を備えている。なお、本実施形態に係る撮影装置は、同図に示した撮影条件決定装置1Aと同一の構成によって実現される。
撮影条件決定装置1Aを用いた撮影条件決定方法および撮影装置を用いた撮影方法について、図5を参照しながら説明する。撮影条件決定方法では、研磨工程S11と、エッチング工程S12と、第一の撮影工程S13と、特徴値算出工程S14と、相分類工程S15と、分類精度判定工程S16と、撮影条件決定工程S17と、をこの順で行う。また、撮影方法では、撮影条件決定方法の各工程の後に、第二の撮影工程S18を行う。
第一の撮影工程S13では、撮影部10が、所定の試料調整(上記研磨工程S11およびエッチング工程S12)が施された金属材料の金属組織の一部分(金属組織の一部の視野)を、撮影条件を変更しながら連続的に撮影する。すなわち、第一の撮影工程S13では、前記した「撮影条件」としては、撮影部10が走査型電子顕微鏡である場合は、コントラスト値およびブライトネス値が含まれる。また、前記した「撮影条件」としては、撮影部10が光学顕微鏡である場合は、光源の強さが含まれる。
分類精度判定工程S16では、撮影条件決定部53が、相分類工程S15におけるセグメンテーションの分類精度が所定以上であるか否かを判定する。そして、撮影条件決定部53は、分類精度が所定以上である場合は撮影条件決定工程S17に進み、分類精度が所定以上である場合は第一の撮影工程S13に戻る。
撮影条件決定工程S17では、撮影条件決定部53が、相分類工程S15の分類結果、すなわち分類精度判定工程S16の判定結果に基づいて、撮影条件を決定する。撮影条件決定工程S17では、第一の撮影工程S13で用いた複数の撮影条件の中から、第一の撮影工程S13で撮影した部分とは異なる金属組織のその他の部分(金属組織のその他の視野)を撮影する際の撮影条件を決定する。撮影条件決定工程S17では、具体的には、第一の撮影工程S13で用いた撮影条件のうち、相分類工程S15における各相の分類精度が最も高くなる撮影条件を、金属組織のその他の部分を撮影する際の撮影条件として決定する。
本実施形態に係る金属組織の相分類方法は、前記した撮影方法により金属組織を撮影し、該金属組織の金属組織の相を分類する。相分類方法を実行する相分類装置は、撮影条件決定装置1と同一の構成によって実現してもよく、撮影条件決定装置1と別の構成によって実現してもよい。
金属材料の材料特性予測装置(以下、「材料特性予測装置」という)3について、図6を参照しながら説明する。材料特性予測装置3は、入力部70と、出力部80と、演算部90と、記憶部100と、を備えている。
材料特性予測装置3を用いた金属組織の相の学習方法について、図7を参照しながら説明する。金属組織の相の学習方法は、前記した金属組織の相の分類方法を行った後に、その分類結果(分類画像)を用いて実施する。金属組織の相の学習方法は、画像入力工程S21と、定量評価工程S22と、データ記録工程S23と、データ選択工程S24と、モデル生成工程S25と、材料特性予測工程S26と、予測結果出力工程S27と、をこの順で行う。
画像入力工程S21では、入力部70が、分類画像を演算部90に入力する。
定量評価工程S22では、定量評価部91が、分類画像に含まれる各相を定量評価することにより、金属組織の定量評価値を算出する。定量評価工程S22では、例えば以下の(1)~(5)に示すような定量評価値を算出する。
分類した相の面積を求めることにより、相の面積率を算出する。
分類した相の各粒の形状を楕円近似することにより、楕円体の長径、短径、またはアスペクト比を算出する。
分類した相の各粒の界面から直線を引き、その直線の距離が最大となるフェレー径を算出する。
分類した相の各粒の面積を求め、その面積の平方根を取ることにより、粒の平均径を導出する。
分類した相の各粒の面積および周長を求め、下記式(4)により粒の真円度を算出する。なお、真円度は、粒が真円の場合は1.0となり、反対に粒が真円の形状から離れるほど、1.0よりも小さくなる。

データ記録工程S23では、データ記録部92が、定量評価工程S22で算出した金属組織の定量評価値を、記憶部100のデータベースに記録する。
データ選択工程S24では、データ選択部93が、データベースに記録された金属組織の定量評価値と、金属材料の材料特性のデータの中から、金属材料の材料特性の予測に使用するデータを選択(抽出)する。
予測モデル生成工程S25では、モデル生成部94が、データ選択工程S24で選択したデータを用いて、金属材料の材料特性を予測する予測モデルを生成する。予測モデル生成工程S25では、具体的には、データ選択工程S24で選択した定量評価値、金属材料の成分組成、熱処理条件等を用いて、材料特性を予測する予測モデルを生成する。その際、同じくデータ選択工程S24で選択した金属材料の材料特性のデータも用いて予測モデルを生成する。
材料特性予測工程S26では、材料特性予測部95が、予測モデル生成工程S25で生成した予測モデルを用いて、金属材料の材料特性を予測する。材料特性予測工程S26では、具体的には、データ選択工程S24で選択した定量評価値を、予測モデル生成工程S25で生成した予測モデルに入力することにより、金属材料の材料特性を予測する。
予測結果出力工程S27では、出力部80が、材料特性予測工程S26における予測結果、すなわち金属材料の材料特性を出力する。
本発明の第一実施形態に係る撮影条件決定方法および撮影方法の実施例について、図8~図12を参照しながら説明する。本実施例では、まずフェライト相およびマルテンサイト相の特徴値のデータベースを構築するために、DP鋼板(以下、「試料」という)を粗研磨後、光学顕微鏡によって500倍で観察した際に傷が見えなくなるまで、0.06μmのアルミナを研磨剤として仕上げ研磨を行った(研磨工程)。続いて、仕上げ研磨後の試料に対して、硝酸濃度1%のナイタール溶液を染み込ませたガーゼで3s擦った後に、蒸留水で洗浄することでエッチングを行った(エッチング工程)。続いて、走査型電子顕微鏡を用いて、エッチング後の試料の組織画像を撮影した(撮影工程)。

本発明の第二実施形態に係る撮影条件決定方法および撮影方法の実施例について、図8、図13~図15を参照しながら説明する。本実施例では、まずフェライト相およびマルテンサイト相の特徴値のデータベースを構築するために、DP鋼板(以下、「試料」という)を粗研磨後、光学顕微鏡によって500倍で観察した際に傷が見えなくなるまで、0.06μmのアルミナを研磨剤として仕上げ研磨を行った(研磨工程)。続いて、仕上げ研磨後の試料に対して、硝酸濃度1%のナイタール溶液を染み込ませたガーゼで3s擦った後に、蒸留水で洗浄することでエッチングを行った(エッチング工程)。続いて、走査型電子顕微鏡を用いて、エッチング後の試料の組織画像を撮影した(撮影工程)。
本発明に係る金属材料の材料特性予測方法および金属材料の材料特性予測装置の実施例3について、図16~図18を参照しながら説明する。

3 材料特性予測装置
10 撮影部
20 記憶部
30 演算部
31 相指定部
32 特徴値算出部
33 相分類部
34 撮影条件決定部
40 出力部
50 演算部
51 特徴値算出部
52 相分類部
53 撮影条件決定部
70 入力部
80 出力部
90 演算部
91 定量評価部
92 データ記録部
93 データ選択部
94 モデル生成部
95 材料特性予測部
100 記憶部
Claims (14)
- 金属材料の金属組織を撮影する際の撮影条件決定方法であって、
所定の試料調整が施された前記金属材料の金属組織の一部分を、予め定めた撮影条件の下で撮影する撮影工程と、
前記撮影工程で撮影した画像について、前記金属組織の予め定めた一または複数の相に対応する画素に対し、各相のラベルを付与する相指定工程と、
前記相指定工程で各相のラベルを付与した画素について、一つ以上の特徴値を算出する特徴値算出工程と、
各相のラベルが付与された特徴値を入力とし、各相のラベルを出力として予め学習されたモデルに対して、前記特徴値算出工程で算出した特徴値を入力し、入力した特徴値に対応する画素の相のラベルを取得することにより、前記画像の金属組織の相を分類する相分類工程と、
前記相分類工程の分類結果に基づいて、前記金属組織のその他の部分を撮影する際の撮影条件を決定する撮影条件決定工程と、
を含む金属組織の撮影条件決定方法。 - 前記撮影工程は、前記金属組織の一部分を、予め定めた複数の撮影条件の下で撮影し、
前記撮影条件決定工程は、前記撮影工程で用いた複数の撮影条件のうち、前記相分類工程における各相の分類精度が最も高くなる撮影条件を、前記金属組織のその他の部分を撮影する際の撮影条件として決定する、
請求項1に記載の金属組織の撮影条件決定方法。 - 金属材料の金属組織を撮影する際の撮影条件決定方法であって、
所定の試料調整が施された前記金属組織の一部分を、撮影条件を変更しながら連続的に撮影する撮影工程と、
前記撮影工程で撮影した画像について、一つ以上の特徴値を算出する特徴値算出工程と、
前記金属組織の予め定めた一または複数の相のラベルが付与された画素の特徴値を入力とし、各相のラベルを出力として予め学習されたモデルに対して、前記特徴値算出工程で算出した特徴値を入力し、入力した特徴値に対応する画素の相のラベルを取得することにより、前記画像の金属組織の相を分類する相分類工程と、
前記相分類工程の分類結果に基づいて、前記撮影工程で用いた複数の撮影条件の中から、前記金属組織のその他の部分を撮影する際の撮影条件を決定する撮影条件決定工程と、
を含む金属組織の撮影条件決定方法。 - 前記撮影条件決定工程は、前記撮影工程で用いた撮影条件のうち、前記相分類工程における各相の分類精度が最も高くなる撮影条件を、前記金属組織のその他の部分を撮影する際の撮影条件として決定する、
請求項3に記載の金属組織の撮影条件決定方法。 - 前記撮影条件は、コントラスト値、ブライトネス値および光源の強さのうちの少なくとも一つを含む請求項1から請求項4のいずれか一項に記載の金属組織の撮影条件決定方法。
- 前記撮影工程の前に、
前記金属材料を粗研磨した後に、0.05μm~2μmの研磨材を用いたバフ研磨を行う研磨工程と、
エタノールおよび硝酸を混合して作成された、硝酸濃度が0.5%~8%のナイタール溶液を用いて前記金属材料をエッチングするエッチング工程と、
を含む請求項1から請求項5のいずれか一項に記載の金属組織の撮影条件決定方法。 - 請求項1から請求項6のいずれか一項に記載の金属組織の撮影条件決定方法の後に、
前記金属材料の金属組織のその他の部分を、前記撮影条件決定方法で決定された撮影条件の下で撮影する金属組織の撮影方法。 - 請求項7に記載の金属組織の撮影方法により金属組織を撮影し、該金属組織の金属組織の相を分類する金属組織の相分類方法。
- 金属材料の金属組織を撮影する際の撮影条件決定装置であって、
所定の試料調整が施された前記金属材料の金属組織の一部分を、予め定めた撮影条件の下で撮影する撮影部と、
前記撮影部で撮影した画像について、前記金属組織の予め定めた一または複数の相に対応する画素に対し、各相のラベルを付与する相指定部と、
前記相指定部で各相のラベルを付与した画素について、一つ以上の特徴値を算出する特徴値算出部と、
各相のラベルが付与された特徴値を入力とし、各相のラベルを出力として予め学習されたモデルに対して、前記特徴値算出部で算出した特徴値を入力し、入力した特徴値に対応する画素の相のラベルを取得することにより、前記画像の金属組織の相を分類する相分類部と、
前記相分類部の分類結果に基づいて、前記金属組織のその他の部分を撮影する際の撮影条件を決定する撮影条件決定部と、
を備える金属組織の撮影条件決定装置。 - 金属材料の金属組織を撮影する際の撮影条件決定装置であって、
所定の試料調整が施された前記金属組織の一部分を、撮影条件を変更しながら連続的に撮影する撮影部と、
前記撮影部で撮影した画像について、一つ以上の特徴値を算出する特徴値算出部と、
前記金属組織の予め定めた一または複数の相のラベルが付与された画素の特徴値を入力とし、各相のラベルを出力として予め学習されたモデルに対して、前記特徴値算出部で算出した特徴値を入力し、入力した特徴値に対応する画素の相のラベルを取得することにより、前記画像の金属組織の相を分類する相分類部と、
前記相分類部の分類結果に基づいて、前記撮影部で用いた複数の撮影条件の中から、前記金属組織のその他の部分を撮影する際の撮影条件を決定する撮影条件決定部と、
を備える金属組織の撮影条件決定装置。 - 前記金属材料の金属組織のその他の部分を、請求項9または請求項10に記載の撮影条件決定装置によって決定された撮影条件の下で撮影する金属組織の撮影装置。
- 請求項11に記載の金属組織の撮影装置により金属組織を撮影し、該金属組織の金属組織の相を分類する金属組織の相分類装置。
- 金属材料の材料特性を予測する金属材料の材料特性予測方法であって、
請求項8に記載の金属組織の相分類方法の後に、
分類した各相の大きさ、面積率または形状を算出することにより、金属組織の定量評価値を算出する定量評価工程と、
前記定量評価値と、予め用意された前記金属材料の材料特性との中から、前記金属材料の材料特性の予測に使用するデータを選択するデータ選択工程と、
選択したデータを用いて、前記金属材料の材料特性を予測する予測モデルを生成するモデル生成工程と、
生成した予測モデルを用いて前記金属材料の材料特性を予測する材料特性予測工程と、
を含む金属材料の材料特性予測方法。 - 金属材料の材料特性を予測する金属材料の材料特性予測装置であって、
金属組織の相の分類が行われた画像を入力する入力部と、
分類した各相の大きさ、面積率または形状を算出することにより、金属組織の定量評価値を算出する定量評価部と、
前記定量評価値をデータベースに記録するデータ記録部と、
前記データベースに記録された前記定量評価値および前記金属材料の材料特性の中から、前記金属材料の材料特性の予測に使用するデータを選択するデータ選択部と、
選択したデータを用いて、前記金属材料の材料特性を予測する予測モデルを生成するモデル生成部と、
生成した予測モデルを用いて前記金属材料の材料特性を予測する材料特性予測部と、
予測した前記金属材料の材料特性を出力する出力部と、
を備える金属材料の材料特性予測装置。
Priority Applications (5)
| Application Number | Priority Date | Filing Date | Title |
|---|---|---|---|
| EP21782081.0A EP4131159A4 (en) | 2020-03-31 | 2021-03-08 | METHOD FOR DETERMINING METALLOGRAPHIC STRUCTURE IMAGING CONDITION, METALLOGRAPHIC STRUCTURE IMAGING METHOD, METHOD FOR CLASSIFYING METALLOGRAPHIC STRUCTURE PHASES, DEVICE FOR DETERMINING METALLOGRAPHIC STRUCTURE IMAGING CONDITION, METALLOGRAPHIC STRUCTURE IMAGING CONDITION DEVICE METALLOGRAPHIC STRUCTURE, DEVICE FOR CLASSIFYING PHASES OF METALLOGRAPHIC STRUCTURE, METHOD FOR PREDICTING MATERIAL PROPERTIES OF METAL MATERIAL, AND DEVICE FOR PREDICTING MATERIAL PROPERTIES OF METAL MATERIAL |
| KR1020227036044A KR102808719B1 (ko) | 2020-03-31 | 2021-03-08 | 금속 조직의 촬영 조건 결정 방법, 금속 조직의 촬영 방법, 금속 조직의 상 분류 방법, 금속 조직의 촬영 조건 결정 장치, 금속 조직의 촬영 장치, 금속 조직의 상 분류 장치, 금속 재료의 재료 특성 예측 방법 및 금속 재료의 재료 특성 예측 장치 |
| JP2021533827A JP7173345B2 (ja) | 2020-03-31 | 2021-03-08 | 金属組織の撮影条件決定方法、金属組織の撮影方法、金属組織の相分類方法、金属組織の撮影条件決定装置、金属組織の撮影装置、金属組織の相分類装置、金属材料の材料特性予測方法および金属材料の材料特性予測装置 |
| US17/915,126 US12106466B2 (en) | 2020-03-31 | 2021-03-08 | Photographing condition determining method for metal structure, photographing method for metal structure, phase classification method for metal structure, photographing condition determining device for metal structure, photographing device for metal structure, phase classification device for metal structure, material property estimating method for metal material, and material property estimating device for metal material |
| CN202180025636.XA CN115398228B (zh) | 2020-03-31 | 2021-03-08 | 金属组织的拍摄条件确定方法及装置、拍摄方法及装置、相分类方法及装置、材料特性预测方法及装置 |
Applications Claiming Priority (2)
| Application Number | Priority Date | Filing Date | Title |
|---|---|---|---|
| JP2020063414 | 2020-03-31 | ||
| JP2020-063414 | 2020-03-31 |
Publications (1)
| Publication Number | Publication Date |
|---|---|
| WO2021199937A1 true WO2021199937A1 (ja) | 2021-10-07 |
Family
ID=77929098
Family Applications (1)
| Application Number | Title | Priority Date | Filing Date |
|---|---|---|---|
| PCT/JP2021/009006 Ceased WO2021199937A1 (ja) | 2020-03-31 | 2021-03-08 | 金属組織の撮影条件決定方法、金属組織の撮影方法、金属組織の相分類方法、金属組織の撮影条件決定装置、金属組織の撮影装置、金属組織の相分類装置、金属材料の材料特性予測方法および金属材料の材料特性予測装置 |
Country Status (6)
| Country | Link |
|---|---|
| US (1) | US12106466B2 (ja) |
| EP (1) | EP4131159A4 (ja) |
| JP (1) | JP7173345B2 (ja) |
| KR (1) | KR102808719B1 (ja) |
| CN (1) | CN115398228B (ja) |
| WO (1) | WO2021199937A1 (ja) |
Cited By (5)
| Publication number | Priority date | Publication date | Assignee | Title |
|---|---|---|---|---|
| JP2022166350A (ja) * | 2021-04-21 | 2022-11-02 | 株式会社日立製作所 | 材料プロセス探索装置、材料プロセス探索システム、および、相関モデル生成方法 |
| JP2022166376A (ja) * | 2021-04-21 | 2022-11-02 | 株式会社ジェイテクト | 研磨状態判定装置、研磨状態判定方法、及び品質評価装置 |
| WO2023228571A1 (ja) * | 2022-05-23 | 2023-11-30 | Jfeスチール株式会社 | 代表組織写真決定方法、代表組織写真決定装置、撮影装置及びプログラム |
| JP2025005602A (ja) * | 2023-06-28 | 2025-01-17 | Jfeスチール株式会社 | 自動車用鋼板のめっき種類識別方法、装置及びプログラム |
| JP2025129387A (ja) * | 2021-08-20 | 2025-09-04 | キヤノン株式会社 | 情報処理装置、情報処理システム、情報処理方法、及びプログラム |
Families Citing this family (4)
| Publication number | Priority date | Publication date | Assignee | Title |
|---|---|---|---|---|
| US12587274B2 (en) | 2023-03-28 | 2026-03-24 | Quantum Generative Materials Llc | Satellite optimization management system based on natural language input and artificial intelligence |
| US12368503B2 (en) | 2023-12-27 | 2025-07-22 | Quantum Generative Materials Llc | Intent-based satellite transmit management based on preexisting historical location and machine learning |
| US12603701B2 (en) | 2023-12-27 | 2026-04-14 | Quantum Generative Materials Llc | Distributed satellite constellation management and control system |
| CN117830731B (zh) * | 2024-01-02 | 2024-06-28 | 北京蓝耘科技股份有限公司 | 多维并行调度方法 |
Citations (7)
| Publication number | Priority date | Publication date | Assignee | Title |
|---|---|---|---|---|
| US4548903A (en) * | 1984-03-30 | 1985-10-22 | The United States Of America As Represented By The Secretary Of The Air Force | Method to reveal microstructures in single phase alloys |
| JPS6279361A (ja) * | 1985-10-02 | 1987-04-11 | Daido Steel Co Ltd | 二相ステンレス鋼の相定量方法 |
| JPH06148062A (ja) * | 1992-10-30 | 1994-05-27 | Sumitomo Metal Ind Ltd | 金属材の寿命評価方法 |
| JP2007204772A (ja) * | 2006-01-31 | 2007-08-16 | Jfe Steel Kk | 鋼のミクロ組織観察用着色エッチング液およびエッチング方法 |
| WO2017010397A1 (ja) | 2015-07-15 | 2017-01-19 | 国立大学法人大阪大学 | 画像解析装置、画像解析方法、画像解析システム、画像解析プログラム、および記録媒体 |
| JP2018121752A (ja) | 2017-01-30 | 2018-08-09 | 国立大学法人 東京大学 | 画像解析装置、画像解析方法、および画像解析プログラム |
| JP2019012037A (ja) * | 2017-06-30 | 2019-01-24 | Jfeスチール株式会社 | 材料特性推定装置及び材料特性推定方法 |
Family Cites Families (10)
| Publication number | Priority date | Publication date | Assignee | Title |
|---|---|---|---|---|
| JPH0824336B2 (ja) * | 1986-05-30 | 1996-03-06 | 株式会社東芝 | 画像情報処理装置 |
| JP3034975B2 (ja) * | 1991-03-26 | 2000-04-17 | 株式会社東芝 | パターン特徴抽出方法 |
| JP2004020519A (ja) | 2002-06-20 | 2004-01-22 | Jfe Steel Kk | 金属材料表層の内部酸化層評価方法 |
| JP2004325358A (ja) | 2003-04-25 | 2004-11-18 | Nakayama:Kk | 鋳鉄成分比率測定装置及びその測定方法 |
| WO2016038705A1 (ja) * | 2014-09-10 | 2016-03-17 | 東芝三菱電機産業システム株式会社 | 圧延シミュレーション装置 |
| JP6615706B2 (ja) | 2016-06-30 | 2019-12-04 | 京セラ株式会社 | 電子機器、制御方法、及びプログラム |
| JP6468262B2 (ja) * | 2016-08-12 | 2019-02-13 | Jfeスチール株式会社 | 走査型電子顕微鏡での観察による複相鋼中のフェライト相、マルテンサイト相、及びオーステナイト相の分離可視化方法、並びに組織観察用複相鋼片 |
| JP7345236B2 (ja) * | 2017-11-10 | 2023-09-15 | 株式会社小松製作所 | 作業車両の動作を推定するための方法、システム、学習済みの分類モデルの製造方法、学習データ、及び学習データの製造方法 |
| US11631230B2 (en) * | 2018-03-06 | 2023-04-18 | Omron Corporation | Method, device, system and computer-program product for setting lighting condition and storage medium |
| CN115038965B (zh) * | 2020-01-29 | 2024-12-24 | 杰富意钢铁株式会社 | 金相组织的相的分类方法、金相组织的相的分类装置、金相组织的相的学习方法、金相组织的相的学习装置、金属材料的材料特性预测方法和金属材料的材料特性预测装置 |
-
2021
- 2021-03-08 WO PCT/JP2021/009006 patent/WO2021199937A1/ja not_active Ceased
- 2021-03-08 EP EP21782081.0A patent/EP4131159A4/en active Pending
- 2021-03-08 CN CN202180025636.XA patent/CN115398228B/zh active Active
- 2021-03-08 JP JP2021533827A patent/JP7173345B2/ja active Active
- 2021-03-08 US US17/915,126 patent/US12106466B2/en active Active
- 2021-03-08 KR KR1020227036044A patent/KR102808719B1/ko active Active
Patent Citations (7)
| Publication number | Priority date | Publication date | Assignee | Title |
|---|---|---|---|---|
| US4548903A (en) * | 1984-03-30 | 1985-10-22 | The United States Of America As Represented By The Secretary Of The Air Force | Method to reveal microstructures in single phase alloys |
| JPS6279361A (ja) * | 1985-10-02 | 1987-04-11 | Daido Steel Co Ltd | 二相ステンレス鋼の相定量方法 |
| JPH06148062A (ja) * | 1992-10-30 | 1994-05-27 | Sumitomo Metal Ind Ltd | 金属材の寿命評価方法 |
| JP2007204772A (ja) * | 2006-01-31 | 2007-08-16 | Jfe Steel Kk | 鋼のミクロ組織観察用着色エッチング液およびエッチング方法 |
| WO2017010397A1 (ja) | 2015-07-15 | 2017-01-19 | 国立大学法人大阪大学 | 画像解析装置、画像解析方法、画像解析システム、画像解析プログラム、および記録媒体 |
| JP2018121752A (ja) | 2017-01-30 | 2018-08-09 | 国立大学法人 東京大学 | 画像解析装置、画像解析方法、および画像解析プログラム |
| JP2019012037A (ja) * | 2017-06-30 | 2019-01-24 | Jfeスチール株式会社 | 材料特性推定装置及び材料特性推定方法 |
Non-Patent Citations (1)
| Title |
|---|
| See also references of EP4131159A4 |
Cited By (9)
| Publication number | Priority date | Publication date | Assignee | Title |
|---|---|---|---|---|
| JP2022166350A (ja) * | 2021-04-21 | 2022-11-02 | 株式会社日立製作所 | 材料プロセス探索装置、材料プロセス探索システム、および、相関モデル生成方法 |
| JP2022166376A (ja) * | 2021-04-21 | 2022-11-02 | 株式会社ジェイテクト | 研磨状態判定装置、研磨状態判定方法、及び品質評価装置 |
| JP7622534B2 (ja) | 2021-04-21 | 2025-01-28 | 株式会社ジェイテクト | 研磨状態判定装置、研磨状態判定方法、及び品質評価装置 |
| JP2025129387A (ja) * | 2021-08-20 | 2025-09-04 | キヤノン株式会社 | 情報処理装置、情報処理システム、情報処理方法、及びプログラム |
| WO2023228571A1 (ja) * | 2022-05-23 | 2023-11-30 | Jfeスチール株式会社 | 代表組織写真決定方法、代表組織写真決定装置、撮影装置及びプログラム |
| JP2023172382A (ja) * | 2022-05-23 | 2023-12-06 | Jfeスチール株式会社 | 代表組織写真決定方法、代表組織写真決定装置、撮影装置及びプログラム |
| JP7704071B2 (ja) | 2022-05-23 | 2025-07-08 | Jfeスチール株式会社 | 代表組織写真決定方法、代表組織写真決定装置、撮影装置及びプログラム |
| JP2025005602A (ja) * | 2023-06-28 | 2025-01-17 | Jfeスチール株式会社 | 自動車用鋼板のめっき種類識別方法、装置及びプログラム |
| JP7845291B2 (ja) | 2023-06-28 | 2026-04-14 | Jfeスチール株式会社 | 自動車用鋼板のめっき種類識別方法、装置及びプログラム |
Also Published As
| Publication number | Publication date |
|---|---|
| US12106466B2 (en) | 2024-10-01 |
| US20230153976A1 (en) | 2023-05-18 |
| EP4131159A4 (en) | 2023-11-08 |
| EP4131159A1 (en) | 2023-02-08 |
| KR102808719B1 (ko) | 2025-05-15 |
| JP7173345B2 (ja) | 2022-11-16 |
| CN115398228A (zh) | 2022-11-25 |
| KR20220156044A (ko) | 2022-11-24 |
| JPWO2021199937A1 (ja) | 2021-10-07 |
| CN115398228B (zh) | 2025-06-13 |
Similar Documents
| Publication | Publication Date | Title |
|---|---|---|
| JP7173345B2 (ja) | 金属組織の撮影条件決定方法、金属組織の撮影方法、金属組織の相分類方法、金属組織の撮影条件決定装置、金属組織の撮影装置、金属組織の相分類装置、金属材料の材料特性予測方法および金属材料の材料特性予測装置 | |
| JP7147974B2 (ja) | 金属組織の相の分類方法、金属組織の相の分類装置、金属材料の材料特性予測方法および金属材料の材料特性予測装置 | |
| CN113963042B (zh) | 基于图像处理的金属零件缺陷程度评估方法 | |
| CN112435215A (zh) | 一种基于图像的车辆定损方法、移动终端、服务器 | |
| CN113176270B (zh) | 一种调光方法、装置及设备 | |
| CN116342597B (zh) | 一种汽车配件表面电镀加工缺陷检测方法和系统 | |
| CN120339278A (zh) | 一种销轴锻造成型质量检测方法及系统 | |
| US20140192178A1 (en) | Method and system for tracking motion of microscopic objects within a three-dimensional volume | |
| CN116740462B (zh) | 一种基于特征增强的单分支粗糙度检测方法 | |
| Wang et al. | A combined computer vision and image processing method for surface coverage measurement of shot peen forming | |
| CN119715569B (zh) | 一种2.5d成像与ai结合的安全扣全外观视觉检测方法及系统 | |
| JP2006292615A (ja) | 外観検査装置、外観検査方法、コンピュータを外観検査装置として機能させるためのプログラムおよび記録媒体 | |
| Hu et al. | Deep learning methods for roping defect analysis in aluminum alloy sheets: prediction and grading | |
| CN116630847A (zh) | 图像检测方法及装置 | |
| CN113850764A (zh) | 基于高斯模糊的理赔材料图像质量控制方法、系统以及设备 | |
| JP7704071B2 (ja) | 代表組織写真決定方法、代表組織写真決定装置、撮影装置及びプログラム | |
| JP7854655B2 (ja) | 定量評価装置、定量評価プログラム、および学習モデル生成プログラム | |
| JP7677232B2 (ja) | 組織写真評価方法、組織写真評価装置、撮影装置及びプログラム | |
| CN119269515B (zh) | 一种钼板的检测方法及系统 | |
| Diaz Ocampo et al. | Enhanced chip analysis with computed tomography for estimation of chip segmentation frequency | |
| Mubarak et al. | Classification of microscopic aluminium inclusions using machine learning techniques and generative methods | |
| CN120495258A (zh) | 一种微弱划痕检测方法、装置、电子设备及存储介质 | |
| Ovechkin et al. | The analysis of methods effectiveness of automated non-destructive testing of products based on Data Mining methods | |
| CN116843973A (zh) | 基于去除不良波段的医学高光谱影像分类方法 | |
| Satou et al. | Automatic analysis for neuron by confocal laser scanning microscope |
Legal Events
| Date | Code | Title | Description |
|---|---|---|---|
| ENP | Entry into the national phase |
Ref document number: 2021533827 Country of ref document: JP Kind code of ref document: A |
|
| 121 | Ep: the epo has been informed by wipo that ep was designated in this application |
Ref document number: 21782081 Country of ref document: EP Kind code of ref document: A1 |
|
| ENP | Entry into the national phase |
Ref document number: 20227036044 Country of ref document: KR Kind code of ref document: A |
|
| NENP | Non-entry into the national phase |
Ref country code: DE |
|
| ENP | Entry into the national phase |
Ref document number: 2021782081 Country of ref document: EP Effective date: 20221031 |
|
| WWG | Wipo information: grant in national office |
Ref document number: 202180025636.X Country of ref document: CN |