WO2021205737A1 - 生体検体解析装置 - Google Patents
生体検体解析装置 Download PDFInfo
- Publication number
- WO2021205737A1 WO2021205737A1 PCT/JP2021/004491 JP2021004491W WO2021205737A1 WO 2021205737 A1 WO2021205737 A1 WO 2021205737A1 JP 2021004491 W JP2021004491 W JP 2021004491W WO 2021205737 A1 WO2021205737 A1 WO 2021205737A1
- Authority
- WO
- WIPO (PCT)
- Prior art keywords
- biological sample
- label
- sample tube
- image
- processor
- Prior art date
- Legal status (The legal status is an assumption and is not a legal conclusion. Google has not performed a legal analysis and makes no representation as to the accuracy of the status listed.)
- Ceased
Links
Images






Classifications
-
- G—PHYSICS
- G06—COMPUTING OR CALCULATING; COUNTING
- G06V—IMAGE OR VIDEO RECOGNITION OR UNDERSTANDING
- G06V10/00—Arrangements for image or video recognition or understanding
- G06V10/20—Image preprocessing
- G06V10/22—Image preprocessing by selection of a specific region containing or referencing a pattern; Locating or processing of specific regions to guide the detection or recognition
-
- G—PHYSICS
- G06—COMPUTING OR CALCULATING; COUNTING
- G06T—IMAGE DATA PROCESSING OR GENERATION, IN GENERAL
- G06T7/00—Image analysis
- G06T7/90—Determination of colour characteristics
-
- G—PHYSICS
- G01—MEASURING; TESTING
- G01N—INVESTIGATING OR ANALYSING MATERIALS BY DETERMINING THEIR CHEMICAL OR PHYSICAL PROPERTIES
- G01N21/00—Investigating or analysing materials by the use of optical means, i.e. using sub-millimetre waves, infrared, visible or ultraviolet light
- G01N21/01—Arrangements or apparatus for facilitating the optical investigation
- G01N21/03—Cuvette constructions
-
- G—PHYSICS
- G01—MEASURING; TESTING
- G01N—INVESTIGATING OR ANALYSING MATERIALS BY DETERMINING THEIR CHEMICAL OR PHYSICAL PROPERTIES
- G01N21/00—Investigating or analysing materials by the use of optical means, i.e. using sub-millimetre waves, infrared, visible or ultraviolet light
- G01N21/17—Systems in which incident light is modified in accordance with the properties of the material investigated
- G01N21/25—Colour; Spectral properties, i.e. comparison of effect of material on the light at two or more different wavelengths or wavelength bands
- G01N21/27—Colour; Spectral properties, i.e. comparison of effect of material on the light at two or more different wavelengths or wavelength bands using photo-electric detection ; circuits for computing concentration
-
- G—PHYSICS
- G01—MEASURING; TESTING
- G01N—INVESTIGATING OR ANALYSING MATERIALS BY DETERMINING THEIR CHEMICAL OR PHYSICAL PROPERTIES
- G01N35/00—Automatic analysis not limited to methods or materials provided for in any single one of groups G01N1/00 - G01N33/00; Handling materials therefor
- G01N35/00584—Control arrangements for automatic analysers
- G01N35/00722—Communications; Identification
- G01N35/00732—Identification of carriers, materials or components in automatic analysers
-
- G—PHYSICS
- G06—COMPUTING OR CALCULATING; COUNTING
- G06T—IMAGE DATA PROCESSING OR GENERATION, IN GENERAL
- G06T5/00—Image enhancement or restoration
- G06T5/80—Geometric correction
-
- G—PHYSICS
- G06—COMPUTING OR CALCULATING; COUNTING
- G06T—IMAGE DATA PROCESSING OR GENERATION, IN GENERAL
- G06T7/00—Image analysis
- G06T7/0002—Inspection of images, e.g. flaw detection
- G06T7/0012—Biomedical image inspection
-
- G—PHYSICS
- G06—COMPUTING OR CALCULATING; COUNTING
- G06T—IMAGE DATA PROCESSING OR GENERATION, IN GENERAL
- G06T7/00—Image analysis
- G06T7/70—Determining position or orientation of objects or cameras
- G06T7/73—Determining position or orientation of objects or cameras using feature-based methods
-
- G—PHYSICS
- G06—COMPUTING OR CALCULATING; COUNTING
- G06T—IMAGE DATA PROCESSING OR GENERATION, IN GENERAL
- G06T7/00—Image analysis
- G06T7/70—Determining position or orientation of objects or cameras
- G06T7/73—Determining position or orientation of objects or cameras using feature-based methods
- G06T7/74—Determining position or orientation of objects or cameras using feature-based methods involving reference images or patches
-
- G—PHYSICS
- G06—COMPUTING OR CALCULATING; COUNTING
- G06V—IMAGE OR VIDEO RECOGNITION OR UNDERSTANDING
- G06V10/00—Arrangements for image or video recognition or understanding
- G06V10/20—Image preprocessing
- G06V10/26—Segmentation of patterns in the image field; Cutting or merging of image elements to establish the pattern region, e.g. clustering-based techniques; Detection of occlusion
- G06V10/267—Segmentation of patterns in the image field; Cutting or merging of image elements to establish the pattern region, e.g. clustering-based techniques; Detection of occlusion by performing operations on regions, e.g. growing, shrinking or watersheds
-
- G—PHYSICS
- G06—COMPUTING OR CALCULATING; COUNTING
- G06V—IMAGE OR VIDEO RECOGNITION OR UNDERSTANDING
- G06V10/00—Arrangements for image or video recognition or understanding
- G06V10/40—Extraction of image or video features
- G06V10/56—Extraction of image or video features relating to colour
-
- G—PHYSICS
- G06—COMPUTING OR CALCULATING; COUNTING
- G06V—IMAGE OR VIDEO RECOGNITION OR UNDERSTANDING
- G06V10/00—Arrangements for image or video recognition or understanding
- G06V10/40—Extraction of image or video features
- G06V10/60—Extraction of image or video features relating to illumination properties, e.g. using a reflectance or lighting model
-
- G—PHYSICS
- G06—COMPUTING OR CALCULATING; COUNTING
- G06V—IMAGE OR VIDEO RECOGNITION OR UNDERSTANDING
- G06V10/00—Arrangements for image or video recognition or understanding
- G06V10/70—Arrangements for image or video recognition or understanding using pattern recognition or machine learning
- G06V10/74—Image or video pattern matching; Proximity measures in feature spaces
- G06V10/75—Organisation of the matching processes, e.g. simultaneous or sequential comparisons of image or video features; Coarse-fine approaches, e.g. multi-scale approaches; using context analysis; Selection of dictionaries
- G06V10/759—Region-based matching
-
- G—PHYSICS
- G06—COMPUTING OR CALCULATING; COUNTING
- G06V—IMAGE OR VIDEO RECOGNITION OR UNDERSTANDING
- G06V10/00—Arrangements for image or video recognition or understanding
- G06V10/70—Arrangements for image or video recognition or understanding using pattern recognition or machine learning
- G06V10/764—Arrangements for image or video recognition or understanding using pattern recognition or machine learning using classification, e.g. of video objects
-
- G—PHYSICS
- G06—COMPUTING OR CALCULATING; COUNTING
- G06T—IMAGE DATA PROCESSING OR GENERATION, IN GENERAL
- G06T2207/00—Indexing scheme for image analysis or image enhancement
- G06T2207/10—Image acquisition modality
- G06T2207/10024—Color image
-
- G—PHYSICS
- G06—COMPUTING OR CALCULATING; COUNTING
- G06T—IMAGE DATA PROCESSING OR GENERATION, IN GENERAL
- G06T2207/00—Indexing scheme for image analysis or image enhancement
- G06T2207/20—Special algorithmic details
- G06T2207/20076—Probabilistic image processing
-
- G—PHYSICS
- G06—COMPUTING OR CALCULATING; COUNTING
- G06T—IMAGE DATA PROCESSING OR GENERATION, IN GENERAL
- G06T2207/00—Indexing scheme for image analysis or image enhancement
- G06T2207/20—Special algorithmic details
- G06T2207/20092—Interactive image processing based on input by user
- G06T2207/20104—Interactive definition of region of interest [ROI]
Definitions
- the present disclosure relates to a biological sample analyzer that analyzes a biological sample housed in a biological sample tube with a double label attached.
- the sample confirmation work such as the liquid volume measurement of the sample stored in the container such as the blood collection tube and the serum type (normal, hemolysis, jaundice, chyle, etc.) in the blood sample is determined. Analytical technology is required.
- Patent Document 1 The technique described in Patent Document 1 relates to a method of extracting color information of a detection area by specifying the boundary position of a label in the detection target area extracted based on the boundary position of the extracted label.
- Patent Document 1 for a sample to which a colored label similar to the color of the detection target is attached, the color of the colored label and the color of the detection target area are discriminated, and the colored label area and the detection target area are separated. There is a problem that the color extraction accuracy is lowered by erroneously extracting the color of the colored label.
- Patent Document 2 measures the serum amount by finding the boundary of the label, but it is not possible to obtain the color information of the analysis target and determine the sample type.
- the present disclosure has been made in view of such a situation, and the extraction accuracy of the analysis target area is not lowered due to the erroneous extraction of the color of the colored label, the analysis target area and the color information are acquired, and the sample is obtained.
- the biological sample analyzer cuts out a partial region from a color image of the biological sample tube, creates a developed view by connecting the partial region along the circumferential direction of the biological sample tube, and creates a developed view from the developed view. Extract the detection target area.
- the biological sample analyzer According to the biological sample analyzer according to the present disclosure, it is possible to detect with high accuracy the color and amount of a sample composed of a plurality of components in a sample to which a colored label is affixed. Further features relating to this disclosure will become apparent from the description herein and the accompanying drawings. Aspects of the present disclosure are achieved and realized by means of elements and combinations of various elements and the following detailed description and the appended claims. It should be understood that the description herein is merely a exemplary example and is not intended to limit the claims or applications of the present disclosure in any way.
- FIG. It is a figure which shows the schematic structure example of the biological sample analysis apparatus 100 which concerns on Embodiment 1.
- FIG. It is a figure which shows the schematic function which the program stored in the memory 107 or the storage device 108 is expanded and realized in a controller (processor) 106.
- S402 development view composition processing
- FIG. It is a figure which shows the setting example which sets the image center as a predetermined area in S501. This is an example of a development drawing created by the processing after S502.
- FIG. 5 is a flow chart showing a development diagram synthesis process according to the third embodiment. This is an example in which the cut-out image is distorted due to the curvature of the biological sample tube 116. It is a flow chart which shows the detailed process of S403 in Embodiment 4.
- FIG. 1 is a diagram showing a schematic configuration example of the biological sample analysis device 100 according to the first embodiment of the present disclosure.
- the biological sample analysis device 100 includes a fixed camera 101, a background plate 102, light sources 103a and 103b, light source drivers 104 réelle and 104b, a biological sample tube holder 105, a controller 106, a memory 107, a storage device 108, an input / output interface 109, and a data bus. It includes 110, a gripping mechanism 111, a moving mechanism 112, a vertical control driver 113, a biological sample tube rotation mechanism 114, and a rotation control driver 115.
- the controller 106 is composed of, for example, a processor (Central Processing Unit: CPU, etc.), reads various programs stored in the memory 107 or the storage device 108, expands them into an internal memory (not shown), and describes an image described later.
- a processing unit is generated and executed at a predetermined timing.
- the input / output interface 109 is composed of a keyboard, a touch panel, a microphone and a switch, a display device, a printer, a speaker, and the like, and displays the analysis result of the detected biological sample (type and amount of the biological sample, etc.) and the living body before the analysis. It is used to check the condition of specimens. Further, the input / output interface 109 accepts input of parameters used for setting predetermined region cutting conditions, which will be described later, data transmission, biological sample type, and / or analysis such as biological sample amount.
- the biological sample tube 116 By moving the biological sample tube 116 upward by the gripping mechanism 111, the light of the light source 103 réelle and the light source 103b is irradiated to the entire biological sample tube 116. More specifically, the biological sample tube 116 set in the biological sample tube holder 105 is gripped by the gripping mechanism 111 and moved into the field of view of the fixed camera 101 by the moving mechanism 112. At this time, the vertical control driver 113 adjusts the vertical position of the biological sample tube 116 by controlling the amount of movement of the moving mechanism 112. The fixed camera 101 needs to acquire a two-dimensional color image of at least the detection target region 117 of the biological sample tube 116.
- the vertical control driver 113 determines the amount of movement of the moving mechanism 112 according to the length of the biological sample tube 116, so that the detection target region 117 can be seen in the fixed camera 101 regardless of the length of the biological sample tube 116. It is possible to move inward and take an image in a state where the detection target area 117 is illuminated by the light source 103a and the light source 103b.
- the rotation control driver 115 rotates the biological sample tube 116 gripped by the gripping mechanism 111 by controlling the biological sample tube rotating mechanism 114.
- the fixed camera 101 can take an image of the entire circumference of the biological sample tube 116 by taking an image while rotating the biological sample tube 116. The method of synchronizing the rotation of the biological sample tube rotation mechanism 114 by the rotation control driver 115 and the imaging of the fixed camera 101 will be described later.
- the fixed camera 101 is an imaging device such as a CCD (Charge Coupled Device) image sensor or a CMOS (Complementary Metal-Oxide Sensor) image sensor.
- the fixed camera 101 acquires a two-dimensional color image of the biological sample tube 116 proved by the light source 103a and the light source 103b against the background plate 102, and inputs the image to the controller 106.
- lighting such as light source 103
- CMOS Complementary Metal-Oxide Sensor
- the light source 103 réelle and the light source 103b are composed of, for example, white LEDs, and are controlled by the light source driver 104 réelle and the light source driver 104b.
- the brightness of the light source 103 réelle and the light source 103b affects the color (pixel value) of the color image of the biological sample tube 116 acquired by the fixed camera 101. Since variations in the brightness of the light source affect the analysis results, for example, imaging evaluation of a calibration jig without color fading and color analysis of the background image of the biological sample tube 116 are performed, and the brightness of the light sources 103 réelle and 103b is analyzed. By performing the calibration before the measurement, it is possible to reduce the variation in the analysis result due to the illumination.
- the color image acquired by the above configuration is used by the controller 106 for image processing and analysis processing described later, and the controller 106 calculates (detects) the color and amount of the detection target area 117.
- the memory 107 or the storage device 108 stores, for example, the color feature amount of serum required for analyzing the color of the detection target area 117, and the information such as the color information and the analysis result of the detection target area 117 is stored.
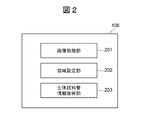
- FIG. 2 is a diagram showing a schematic function in which a program stored in the memory 107 or the storage device 108 is expanded and realized in the controller (processor) 106.
- the controller 106 includes an image processing unit 201, an area setting unit 202, and a biological sample tube information acquisition unit 203 as functions realized by software.
- the image processing unit 201 generates a developed view by a process described later based on a plurality of two-dimensional color images acquired by the fixed camera 101, extracts a detection target region (for example, a serum region) 117 from the developed view, and then obtains a development view. Performs processing such as specifying the color and sample type to be detected and calculating the amount of solution.
- a detection target region for example, a serum region
- the area setting unit 202 is a processing unit that realizes a function that enables a user (operator) to set and change a predetermined area (cutout area) in the cutting process of a two-dimensional color image for generating a development view described later. Is.
- the area setting unit 202 sets the predetermined area for the target two-dimensional color image.
- a setting file describing the reference coordinate value, width, height, etc. in the captured image of the predetermined area is stored in the memory 107 or the storage device 108, and the predetermined area is set / changed by reading the information of the setting file from the program. Allows you to.
- the biological sample tube information acquisition unit 203 receives color information (range of label color distribution) and / or size information of the colored label 118 extracted by the detection target area 117 extraction process described later, and / or biological sample tube 116 to be analyzed. It is a processing unit that realizes a function that makes it possible to acquire size (diameter and length in the major axis direction) information and set / change it.
- Unit 203 sets / changes the color / / size information of the colored label 118 and the size information of the biological sample tube 116 to be extracted in the detection target area 117 extraction process described later.
- a setting file in which label color information is described is stored in the memory 107 or the storage device 108, and the color or size information of the colored label 118 and the size of the biological sample tube 116 are read by reading the setting file information from the program. Allows you to set and change information.
- the area cutting unit 301 executes a process of cutting out the area set by the area setting unit 202 from each two-dimensional color image.
- the development drawing synthesis unit 302 executes a process of generating one development drawing by connecting a plurality of images cut out by the region cutting unit 301 along the circumferential direction of the biological sample tube 116.
- the detection target region extraction unit 303 detects the detection target based on the color information of the detection target (for example, serum region) acquired in advance or the color information of the label attached to the biological sample tube acquired by the biological sample tube information acquisition unit 203. A process for extracting the region (eg, serum region) 117 is performed.
- the analysis unit 304 identifies the color of the detection target area 117 extracted by the detection target area extraction unit 303, determines the type of the biological sample from the color information, and detects the detection target area extracted by the detection target area extraction unit 303. A process of calculating the liquid volume of the biological sample from 117 is carried out.
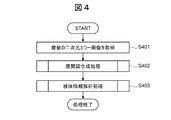
- FIG. 4 is a flowchart for explaining an outline of the biological sample analysis process executed by the biological sample analysis device 100 according to the present embodiment.
- the operation subject of each step is the corresponding processing unit, but since each processing unit is realized by the program stored in the memory 107 or the storage device 108, it is the execution subject of the program. The description may be read with the controller 106 as the operating subject of each step.
- the colored label 118 having a color similar to the detection target area 117 is a part of the detection target area 117. This has the effect of avoiding erroneous extraction and improving the analysis accuracy of the color and amount of the detection target region 117.
- the image processing unit 201 acquires a plurality of two-dimensional color images of the biological sample tube 116 captured by the fixed camera 101.
- FIG. 4 Step S401: Imaging method
- An imaging method of the biological sample tube 116 will be described.
- a two-dimensional color image of the region where the detection target area 117 is exposed is required among the labeled biological sample tubes 116. Is.
- the biological sample tube rotation mechanism 114 and the rotation control driver 115 control the rotation of the biological sample tube 116 based on the command of the controller 106 to acquire a plurality of two-dimensional color images while rotating the biological sample tube 116. do.
- the biological sample tube rotation mechanism 114 rotates the biological sample tube 116, and the rotation control driver 115 controls the speed or acceleration of rotation, the rotation angle, the number of rotations, and the timing of starting rotation. As described above, it is possible to acquire a plurality of images having information on the entire circumference of the biological sample tube 116.
- FIG. 4 Step S401: Imaging method: Supplement 1
- the user puts the biological sample tube 116 into the biological sample analyzer 100 so that the orientations of the biological sample tubes 116 gripped by the gripping mechanism 111 are aligned, it is necessary to take an image of the entire circumference of the biological sample tube 116. Instead, it suffices if a plurality of two-dimensional color images in which the region of the detection target region 117 is captured can be acquired while rotating the biological sample tube 116.
- Fig. 4 Step S401: Imaging method: Supplement 2
- the biological sample tube 116 is put into the biological sample analysis device without the user (operator) aligning the orientation of the biological sample tube 116 gripped by the gripping mechanism 111
- the information on the entire circumference of the biological sample tube 116 is displayed.
- the captured image of the detection target region 117 can be surely acquired. For example, if 36 images (36 frames) are acquired by repeating the acquisition of images by the fixed camera 101 every time the image is rotated by 10 degrees, information on the entire circumference of the biological sample tube 116 can be acquired.
- Fig. 4 Step S401: Imaging method: Supplement 3
- the rotation angle and the speed or acceleration of rotation do not have to be constant. For example, a total of 32 sheets are accelerated by accelerating from a low speed between 1 frame and 2 frames and decelerating between 31 frames and 32 frames.
- the entire circumference of the biological sample tube 116 may be imaged with the frame of. Further, the shutter speed and the imaging timing of the camera may be changed based on the rotation control signal.
- Step S402 Development drawing synthesis process
- the image processing unit 201 executes each image processing in the area cutting unit 301 and the development drawing synthesis unit 302, and creates one development drawing based on the two-dimensional color image acquired in S401. The details of this step will be described later with reference to FIG.
- the serum color is characterized by the serum status (normal, hemolysis, jaundice, chyle). Therefore, by storing the color feature amount and the range and threshold value of the color space used for classification in the memory 107 and collating the color information acquired by the analysis unit 304, the serum state of the sample can be determined. Further, the amount of the solution to be detected can be calculated from the information on the number of pixels in the height direction (vertical direction of the two-dimensional color image) of the detection target area 117 and the information on the diameter of the biological sample tube 116. The diameter of the biological sample tube 116 is acquired, for example, by directly inputting information such as the model number of the biological sample tube 116 used by the user using the touch panel which is the input / output interface 109 or the diameter of the biological sample tube 116.
- Fig. 4 Step S403: Specimen information analysis: Supplement 2
- the color of the colored label 118 is erroneously extracted as the detection target and the sample type is selected.
- the solution amount may be erroneously calculated by erroneously extracting the region of the colored label 118 as the detection target region 117. Therefore, the detection target area extraction unit 303 discriminates between the label color and the detection target color by the process described later, removes the colored label 118, and extracts only the detection target area 117. It is possible to avoid erroneous calculation of the amount and improve the discrimination accuracy of the sample type and the measurement accuracy of the solution amount.
- the colored label 118 and the detection target area 117 can be distinguished by, for example, the following procedure.
- the label color information (hue, saturation, distribution of brightness value and / or threshold) to be used is acquired in advance by the label calibration process described later executed by the biological sample tube information acquisition unit 203, and the memory 107 or the storage device 108 Stores the label color information used for.
- the memory 107 or the storage device 108 Stores the label color information used for.
- the area setting unit 202 sets a predetermined area of the two-dimensional color image, and the area cutting unit 301 is set by the area setting unit 202 from the two-dimensional color image. Cut out the area.
- the development view synthesizing unit 302 connects the cut-out images of a plurality of two-dimensional color images cut out by the area cutting-out unit 301 to synthesize one development drawing.
- Step S501 Predetermined area setting
- the area setting unit 202 responds to the setting input of the predetermined area (cutout area of the two-dimensional color image) by the user or the setting file stored in the memory 107 or the storage device 108, and the area setting unit 202 receives a plurality of two-dimensional colors acquired in S401.
- a predetermined area is set for each of the images.
- the setting input by the user or the description content of the setting file is, for example, the width and height of a predetermined area, and the reference coordinate value in the captured image. Details of this step will be described later with reference to FIGS. 6A to 7.
- the area cutting unit 301 cuts out a predetermined area (cutting area) set in S501 from each of the plurality of two-dimensional color images acquired in S401.
- the development drawing synthesis unit 302 synthesizes one development drawing by connecting the cut-out images of a plurality of two-dimensional color images output in S502.
- the connection portion can be smoothed by applying a smoothing filter such as a Gaussian filter.
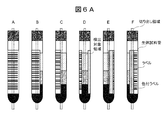
- FIG. 6A is a diagram showing a setting example in which the center of the image is set as a predetermined region in S501.
- the area setting unit 202 sets a predetermined area for each image.
- FIG. 6A shows an example in which a predetermined area is set so as to be symmetrical with the center of each acquired image as a reference coordinate, but the cutout area is not limited to this. Further, the coordinates and width of the predetermined region may be changed for each image based on the information such as the rotation speed or the rotation acceleration of the biological sample tube rotation mechanism 114.
- the coordinates and width of a predetermined region are set in consideration of the curvature of the biological sample tube 116, so that the development after synthesis is performed. It has the effect of reducing the distortion in the figure and improving the extraction accuracy of the detection target area 117.
- the horizontal center coordinates of the captured image are set as the reference coordinates of the predetermined area, and about 8% of the width of the biological sample tube 116 (10 pixels when the area of the biological sample tube 116 is 128 pixels) is the predetermined area.
- a region symmetrical with respect to the reference coordinates is set as a predetermined region so as to have a width of.
- the influence of the curvature of the biological sample tube 116 can be reduced.
- the effect of curvature becomes smaller as the width of the predetermined region is narrowed, but in order to obtain a development view including information on the entire circumference of the biological sample tube 116, the width of the predetermined region is narrowed to obtain the biological sample tube 116. It is necessary to increase the number of images taken.
- FIG. 7 is a diagram showing an example of the brightness distribution of the detection target region 117 imaged by the fixed camera 101.
- the influence of the setting of the coordinates and the width of the predetermined region on the color distribution of the detection target region 117 will be described with reference to FIG. 7.
- the center of the detection target area 117 is bright and the edge is bright even when the detection target area is a uniform solution.
- the development drawing will be synthesized. This has the effect of reducing the variation in the brightness value of the detection target region 117 after synthesis and improving the color analysis accuracy of the detection target region 117. That is, the region setting unit 202 determines a predetermined region based on the brightness distribution of the two-dimensional color image so that the variance of the brightness value after synthesis becomes small.
- the detection target area extraction unit 303 By suppressing the variation in the brightness of the cutout region, it is possible to reduce the variation in the brightness value of the colored label 118 area after synthesizing the developed view in the same manner for the color of the colored label 118. That is, it is possible to reduce the overlap of the color distributions of the detection target area 117 and the colored label 118 in the synthesized development view, and the colors of the detection target area 117 and the colored label 118 are displayed in the process executed by the detection target area extraction unit 303.
- the accuracy of separation analysis can be improved. If the separation / removal accuracy of the colored label 118 is improved, erroneous extraction of the colored label 118 can be avoided, and the analysis accuracy of the color and amount of the detection target can be improved.
- the region setting unit 202 can remove the region of the reflection component from the detection target region 117 after synthesizing the developed view by setting the setting coordinates of the predetermined region to the region where the reflected light noise is not reflected, and the detection target region 117 can be removed. Color analysis accuracy can be improved.
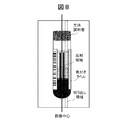
- the region of the reflection component it is possible to avoid erroneous detection in which the white reflection component is recognized as the boundary between the white label and the detection target region 117, and the extraction accuracy of the detection target region 117 is improved. It has the effect of improving the analysis accuracy of the amount to be detected. For example, when a two-line reflection region as shown in FIG. 8 appears, the region between the reflection regions (the center of the biological sample tube 116) should be a predetermined region, or the outside of the reflection region should be a predetermined region. Therefore, the reflection of the reflective component can be avoided.
- a method of setting the width of a predetermined region in consideration of the number of images taken by the biological sample tube 116 by the fixed camera 101 and the rotation speed of the biological sample tube rotation mechanism 114 will be described.
- the effect of improving the synthesis accuracy of the developed view and reducing the variation in the color distribution of the detection target region 117 can be obtained, but the information on the entire circumference of the biological sample tube 116 is included.
- the biological sample tube 116 (collecting blood vessel) is rotated once while the rotation speed of the biological sample tube rotating mechanism 114 is constant to acquire 36 images at a constant imaging interval, the biological sample tube 116 has 10 frames between frames.
- the radius of the biological sample tube 116 is r [mm]
- the width of the predetermined region is at least. About (2 ⁇ r / 36) [mm] is required.
- the rotation speed of the biological sample tube rotation mechanism 114 is not constant and is controlled by the rotation control driver 115 so that the rotation speed is accelerated at the beginning of rotation, decelerates after reaching a constant speed, and ends the rotation, the biological sample tube is controlled.
- the width of a predetermined region according to the acceleration of the rotation mechanism 114 for each imaging it is possible to efficiently obtain a developed view of the entire circumference of the biological sample tube 116 without chipping or overlapping of regions.
- the imaging timing of the fixed camera 101 is controlled based on the control signal of the rotation control driver 115 and the width of the predetermined region is set according to the rotational speed of the biological sample tube rotation mechanism 114 and the imaging timing of the fixed camera 101. good.
- a development view of only the region of interest (for example, the detection target region 117) is acquired and output in the subsequent processing. It has the effect of reducing the image size of the developed view and reducing the arithmetic processing. In addition, the effect of removing noise in the sample information analysis process and improving the analysis accuracy by excluding an area unnecessary for analysis, such as an area where only the background plate is imaged, from the captured image by setting a predetermined area. There is.
- FIG. 9 is a flowchart for explaining the detailed contents of S403 (sample information analysis processing).
- the operation subject of each step is the corresponding processing unit, but since each processing unit is realized by a program stored in the memory 107 or the storage device 108, the controller that is the execution subject of the program. The description may be read with (processor) 106 as the operating subject of each step.
- the detection target area extraction unit 303 and the analysis unit 304 extract the detection target area 117 based on the development drawing generated by the development drawing synthesis unit 302, and the color of the extracted area and the color of the extracted area.
- the state of the detection target is determined from the size of the area and the liquid volume is measured.
- Step S901 Label area identification / removal
- the detection target area extraction unit 303 executes a process of identifying a label area unnecessary for analysis of sample information from the development drawing output in S402. The specific processing of this step will be described later.
- the detection target area extraction unit 303 removes the label area specified in S901 from the development drawing output in the development drawing synthesis process in S402 as an area unnecessary for analysis of sample information.
- the detection target region extraction unit 303 further generates a mask that identifies the horizontal region to be analyzed in the processes after S903. Alternatively, a process of generating an image obtained by cutting out only the horizontal region necessary for analysis from the developed view is executed.
- the horizontal region is set based on the coordinates of both ends of the label region specified in, for example, S901.
- the detection target area extraction unit 303 executes an edge detection process or the like on a mask for specifying a horizontal region output in S902 or an image obtained by cutting out only a horizontal region. For example, by identifying the edge of each region of the sample, the detection target region 117 and the region such as the separating agent are separated, and the detection target region 117 is extracted.
- Step S904 Specimen information analysis process
- the analysis unit 304 discriminates the sample state and calculates the liquid amount from the color information of the detection target region 117 and the information of the region (coordinates and the number of pixels) specified in the process of S903.
- the detection target is serum
- the serum color changes according to the serum status (normal, hemolysis, jaundice, milkiness), so the color feature amount and the range and threshold of the color space used for classification are stored in memory.
- the serum state of the sample can be determined.
- the amount of the solution to be detected is calculated from the information of the region (coordinates and the number of pixels) of the detection target region 117 and the diameter information of the biological sample tube 116 acquired by the biological sample tube information acquisition unit 203.
- Fig. 9 Step S904: Specimen information analysis process: Supplement
- the advantages of extracting the detection target region 117 from the developed view instead of the captured image of one piece of the biological sample tube 116 include the following: (a) Setting of a predetermined region in S402. Depending on the method, the color variation of the detection target area 117 can be reduced and the state discrimination accuracy can be improved. (B) In the biological sample tube 116 to which the colored label 118 is attached, the removal accuracy of the colored label 118 can be improved and the erroneous extraction of the detection target region 117 by the colored label 118 can be avoided.
- the extraction process of the detection target region 117 can be executed after removing unnecessary regions such as reflection components from the captured image of the biological sample tube 116 from the developed view, so that the detection target region due to noise can be executed. It is possible to avoid 117 erroneous extraction and erroneous analysis and erroneous discrimination of the color to be detected.
- a method of specifying a label without a colored portion for example, a white label and a label having only a bar code and a black label for printing
- the label area without the colored portion is specified by image processing such as detection of the barcode area and / or white detection processing.
- image processing such as detection of the barcode area and / or white detection processing.
- detection of the barcode area for example, there are an extraction method using a black color threshold value and an extraction method by image processing such as edge extraction. In the case of detection by edge extraction, even thin lines of barcodes can be detected by combining morphology processing.
- a threshold value of color for example, hue, saturation, lightness
- the label range is specified and removed based on the information such as the label size acquired by the biological sample tube information acquisition unit 203. good.
- S901 an example of a method for specifying an area of a colored label 118 similar to the color to be detected will be described.
- Examples of the combination of the detection target and the colored label 118 include yellow serum and the yellow colored label 118, red serum and the red colored label 118, and the like. Further, when the color of the detection target is different for each measurement (sample) such as red or yellow, the combination of yellow serum and red colored label 118 or red serum and yellow colored label 118 is also applicable.
- the colored label 118 includes a white label having a colored portion at a part of the end and a colored label 118 having a colored portion at the upper and lower positions of the barcode area.
- the colored portion may be erroneously extracted as the detection target region 117 and the analysis accuracy of the sample information may be lowered.
- Method 1 A method of identifying a colored portion based on color information will be described.
- the biological sample tube information acquisition unit 203 acquires information on the label color to be used (hue, saturation, distribution of lightness value and / or threshold) in advance by, for example, executing a label calibration process described later.
- the label color information used in the memory 107 or the storage device 108 is stored.
- S901 the color information of the colored label 118 stored in the memory 107 or the storage device 108 is acquired, the color threshold (hue, saturation, lightness, etc.) of the colored label 118 is set, and the colored label 118 is displayed from the developed view. Create a mask to extract only the colored part and specify the area of the colored part.
- the color information of the colored label 118 to be used may be input by the user using, for example, a touch panel as an input / output interface 109 and stored in the memory 107 or the storage device 108.
- the biological sample tube information acquisition unit 203 identifies the region of the colored label 118 by searching in the color space with reference to the color specified by the user. As a result, a color matching the colored label 118 can be quickly found.
- Method 2 A method of identifying the colored portion from the size of the colored portion acquired by the biological sample tube information acquisition unit 203 and / or the position of the colored portion in the label (position of the right end, left end, top and bottom, etc. in the label). Will be described.
- the biological sample tube information acquisition unit 203 acquires the size of the colored label 118 and / or the position of the colored portion in the label by executing, for example, a label calibration process described later, and stores it in the memory 107 or the storage device 108. I will do it.
- the user may input the input using, for example, a touch panel which is an input / output interface 109 and store it in the memory 107 or the like.
- the biological sample tube information acquisition unit 203 specifies the barcode region and the white label region by the above-mentioned example of the method for specifying the label region without the colored portion.
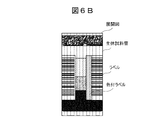
- the area of the colored part is specified based on the size of the colored label 118 and / or the arrangement information of the colored part in the label with reference to the coordinates of the specified barcode area or the white area. For example, in a label having a colored portion at the end of the label as shown in the developed view of FIG. 6, after detecting the edge coordinates of the white label area or the barcode area, the area outside the edge coordinates by the size of the colored portion. (In FIG. 6, the left side of the barcode area) specifies the area of the colored label 118.
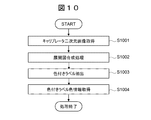
- FIG. 10 is a flowchart for explaining the detailed contents of the label calibration.
- the operation subject of each step is the corresponding processing unit, but since each processing unit is realized by the program stored in the memory 107 or the storage device 108, it is the execution subject of the program. The description may be read with the controller (processor) 106 as the operating subject of each step.
- the label calibration process executed by the biological sample tube information acquisition unit 203 is performed on the colored label 118 from the captured image of the empty biological sample tube 116 (hereinafter referred to as a calibrator) to which the colored label 118 to be used is attached prior to the sample analysis process. It is for acquiring information such as color information and size.
- This flowchart can be implemented as part of S901.
- Step S1001 Acquiring a calibrator two-dimensional image
- the biological sample tube information acquisition unit 203 acquires a plurality of two-dimensional color images of the calibrator captured by the fixed camera 101.
- the image acquisition method is the same as that of S401.
- Step S1002 Development view composition process
- the biological sample tube information acquisition unit 203 executes the same process as the development view synthesis process of FIG. 4, and creates a single development view based on the two-dimensional color image of the calibrator acquired in S1001.
- Step S1003 Colored label extraction
- the biological sample tube information acquisition unit 203 identifies the region of the colored label 118 based on the color distribution of the developed view output in S1002.
- Step S1003 Colored label extraction: Specific example 1
- a developed view reference image created from an image of an empty biological sample tube 116 to which the colored label 118 is not attached is compared with a color distribution of the developed view of the calibrator.
- Step S1003 Colored label extraction: Specific example 2
- the user inputs the color information of the colored label 118 on the touch panel or the like using the input / output interface 109 or the like and extracts the corresponding color from the developed view of the calibrator.
- a color palette of a plurality of colors is displayed on a screen such as a touch panel, and the user selects the color of the colored label 118.
- the biological sample tube information acquisition unit 203 acquires information on the color threshold corresponding to the color palette stored in the memory 107 or the storage device 108 in advance, and the colored label 118 is based on the color palette selected by the user. Set the color threshold.
- the color corresponding to the acquired color threshold value is extracted from the developed view and specified as a colored label area.
- the developed view of the calibrator may be displayed on a screen such as a touch panel, and the user may select and specify the area of the colored label 118 directly or by using a cursor on the screen or the like.
- Step S1004 Acquisition of colored label color information
- the biological sample tube information acquisition unit 203 acquires the color distribution of the region of the colored label 118 specified in step 902, sets a color threshold that defines the label color of the colored label 118 based on the acquired color information, and sets the memory 107. Alternatively, it is stored in a storage device 108 or the like.
- Step S1004 Colored label color information acquisition: specific example
- the threshold setting method in this step include the following procedures.
- the biological sample tube information acquisition unit 203 acquires histograms of hue, saturation, brightness, etc. in the color distribution of the region of the colored label 118 specified in step 902, and for example, focusing on the mode value and the average value of each.
- the range of ⁇ 5% can be set as the threshold.
- the biological sample analysis device 100 acquires a two-dimensional color image of the biological sample tube while rotating the biological sample tube by the biological sample tube rotation mechanism, and draws one developed view from the plurality of two-dimensional color images.
- the process of synthesizing and the process of analyzing sample information are executed.
- a predetermined area setting process, a two-dimensional color image cutout process, a two-dimensional color image cutout process, and a cutout image concatenation process are executed, and in the sample information analysis process, a label area identification process is performed.
- Horizontal detection position identification process and vertical direction detection position identification process are executed.
- the label region by removing the label region and extracting the detection target region (for example, the serum region) based on the developed view synthesized from the plurality of two-dimensional color images, the colored label and the detection target region can be separated with high accuracy. Therefore, it becomes possible to analyze the liquid contained in the detection target region.
- the detection target region for example, the serum region
- the biological sample analyzer 100 performs label calibration by comparing an unlabeled biological sample tube and a labeled biological sample tube. Label information is acquired in advance by label calibration, and the area of the colored label is identified and removed from the acquired information. By performing label calibration in advance, it is not possible to confuse the colored label with the detection target area, so it is possible to avoid erroneous analysis in which the color of the colored label is erroneously extracted from the detection target color, and more accurate analysis results can be obtained. You can expect to be.
- FIG. 11 is a flow chart showing a development diagram synthesis process according to the second embodiment of the present disclosure.
- the captured image is not cut out based on a predetermined region determined in advance, but the inclination of the biological sample tube 116 in the captured image and the deviation from the center of the image are detected and detected for each captured image.
- the deviation is taken as the rotation axis of the biological sample tube 116 (S1101).
- a predetermined area is set for each image with the detected rotation axis as a reference (S1102 to S1104).
- the configuration other than the development drawing composition processing is the same as that of the first embodiment.
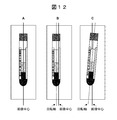
- FIG. 12 is a diagram showing an example of the rotation axis of the biological sample tube 116.
- the biological sample tube 116 gripped by the gripping mechanism 111 and rotated by the biological sample tube rotating mechanism 114 may have the image center and the rotation axis coincided with each other as shown on the left in FIG. 12, but should be laterally displaced as shown in the center of FIG. Or, as shown on the right in FIG. 12, the image may be taken with the rotation axis tilted. If the characteristics of the rotation axis are not constant between measurements or between devices, instead of setting a predetermined area with a fixed value in advance, by dynamically setting a predetermined area based on the rotation axis of the biological sample tube 116, It has the effect of improving the composition accuracy of the developed view.
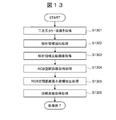
- FIG. 13 is a flow chart showing an example of the rotation axis detection process (S1101) of the biological sample tube 116.
- the region setting unit 202 executes the rotation axis (regression straight line) detection process of the biological sample tube 116 according to this flowchart.
- This flowchart utilizes the left-right symmetry of the biological sample tube 116 to detect the inclination of the biological sample tube 116 and the positional deviation of the central axis from the distance between the captured image and the inverted image of the captured image in the RGB space.
- Step S1301 Two-dimensional color image acquisition
- the area setting unit 202 acquires a two-dimensional color image of the biological sample tube 116 captured by the fixed camera 101.
- the image acquisition method is the same as that of S401.
- the area setting unit 202 extracts an analysis area from the two-dimensional color image acquired in step 1301. Since the analysis is performed on the premise of the left-right symmetry of the biological sample tube 116, the unlabeled region of the captured image of the biological sample tube 116 is extracted as the analysis region. For example, in the case of a blood sample after centrifugation, the region where the blood clot is imaged near the bottom of the biological sample tube 116 is selected.
- the horizontal width is set to about the diameter of the biological sample tube 116
- the vertical width is set to 50 pixels, and the like.
- the set value of the analysis area does not need to be changed for each captured image as long as the same sample is imaged, and may be a fixed value. It is necessary to set the analysis area accordingly.
- a plurality of set values are stored in the memory 107 or the storage device 108, and the set values can be changed from the length information of the biological sample tube 116 acquired by the biological sample tube information acquisition unit 203. do.
- Step S1304 RGB spatial distance acquisition
- the area setting unit 202 acquires the distance in the RGB color space between the image in the analysis area and the inverted image for each pixel in the analysis area.
- Step S1305 RGB color space distance minimum coordinate extraction process
- the area setting unit 202 compares the distances in the RGB color space acquired in S1304 for each vertical coordinate of the analysis area, and acquires the minimum value for each vertical coordinate and the coordinates for which the minimum value is obtained.
- Step S1306 Regression straight line acquisition process
- the area setting unit 202 extracts the coordinates of the minimum value detected in S1305 as the center coordinates of the analysis area by connecting them in the vertical direction, and sets a linear regression line based on the extracted coordinates.
- the biological sample analysis device 100 cuts out a predetermined region set based on the rotation speed information of the biological sample tube rotation mechanism and the information on the inclination and lateral displacement of the biological sample tube in the development drawing synthesis process. Synthesize. As a result, improvement in the synthesis accuracy of the development drawing used for the analysis of sample information can be expected.
- FIG. 14 is a flow chart showing a development diagram synthesis process according to the third embodiment of the present disclosure.
- the curvature correction process for example, when the reference coordinates of the predetermined region are deviated from the center of the biological sample tube 116 as shown in FIG. 8, there is an effect of reducing the distortion of the developed view after synthesis. Further, even when there is noise such as a reflection region in the central region of the biological sample tube 116 as in the example of FIG. 8, it is possible to obtain a development view without distortion by shifting the predetermined region, so that the detection target region 117 can be obtained. It has the effect of improving analysis accuracy.
- the configuration other than the development drawing composition processing is the same as that of the first embodiment.
- S1401 corresponds to S501
- S1402 corresponds to S502
- S1404 corresponds to S504.
- the area setting unit 202 is used for correction in consideration of the curvature of the biological sample tube 116 from the information on the diameter of the biological sample tube 116 acquired by the biological sample tube information acquisition unit 203 and the information on the predetermined region set in S1401.
- the coefficient of is calculated, and the cutout image is corrected by, for example, affine conversion.
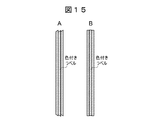
- FIG. 15 is an example in which the cut-out image is distorted due to the curvature of the biological sample tube 116.
- the colored label 118 may be distorted as shown on the left in FIG.
- the image after composition is distorted as shown on the left of FIG.
- the right side of FIG. 15 shows a colored label 118 when the image of a predetermined region cut out is combined after distortion correction according to the flowchart of FIG.
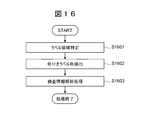
- FIG. 16 is a flow chart showing the detailed processing of S403 according to the fourth embodiment of the present disclosure.
- S403 of the first embodiment it has been described that the state of the detection target is determined and the liquid amount is measured from the information of the color of the detection target region 117 and the size of the region.
- test information such as a subject or a sample is acquired from the information of the detected label or the colored label 118.
- Other configurations are the same as those in the first embodiment.
- Information acquired from labels and colored labels 118 includes barcodes and color information of colored parts.
- the barcode information is analyzed by the biological sample according to the present embodiment by accessing the database associated with the read contents (for example, ID number) and the subject information stored in an external host server or the like. It can be obtained with a device.
- a database in which information such as the type of biochemical analysis and the type of sample (serum, whole blood, urine, etc.) and the color of the colored label 118 are linked is stored in an external server, memory 107, or storage device 108. By doing so, it is possible to acquire the analysis content and the type of sample from the acquired color information of the colored label 118.
- the biological sample analysis device 100 stores the color information corresponding to the type of the biological sample in the memory 107 or the storage device 108 in advance, and stores the acquired color information in the detection target area 117 and the memory 705 in advance.
- the type of the biological sample is determined by collating the stored color information with the analysis unit 304. At this time, by storing the data to be collated for each sample type and selecting the data to be collated from the types of samples acquired based on the color information of the colored label 118, it is possible to analyze a plurality of types of biological samples. become.
- the coordinates and size of the cutout area may be changed according to the user's specification. Specifically, the user specifies the coordinates and size of the cutout area via the user interface, and the controller 106 sets the cutout area according to the designation.
- the OS operating system
- the processing enables the functions of the above-described embodiment to be realized. You may. Further, after the program code read from the storage medium is written in the memory on the computer, the CPU of the computer or the like performs a part or all of the actual processing based on the instruction of the program code, and the processing is performed. May realize the function of the above-described embodiment.
- the program code of the software that realizes the functions of the embodiment via the network, it is distributed as a storage means such as a hard disk or a memory of a system or an apparatus or a storage medium such as a CD-RW or a CD-R.
- the computer (or CPU or MPU) of the system or device may read and execute the program code stored in the storage means or the storage medium at the time of use.
- Biospecimen analyzer 101 Fixed camera 102 Background plates 103a and 103b Light sources 104a and 104b Light source driver 105 Biosample tube holder 106 Controller 107 Memory 108 Storage device 109 Input / output interface 110 Data bus 111 Gripping mechanism 112 Moving mechanism 113 Vertical control driver 114 Biological sample tube rotation mechanism 115 Rotation control driver 116 Biological sample tube 117 Detection target area 118 Colored label 201 Image processing unit 202 Area setting unit 203 Biological sample tube information acquisition unit 301 Area cutting unit 302 Expanded view synthesis unit 303 Detection target area extraction Part 304 Analysis part
Landscapes
- Engineering & Computer Science (AREA)
- Physics & Mathematics (AREA)
- General Physics & Mathematics (AREA)
- Theoretical Computer Science (AREA)
- Computer Vision & Pattern Recognition (AREA)
- General Health & Medical Sciences (AREA)
- Health & Medical Sciences (AREA)
- Multimedia (AREA)
- Pathology (AREA)
- Immunology (AREA)
- Biochemistry (AREA)
- Analytical Chemistry (AREA)
- Chemical & Material Sciences (AREA)
- Life Sciences & Earth Sciences (AREA)
- Software Systems (AREA)
- Medical Informatics (AREA)
- Evolutionary Computation (AREA)
- Databases & Information Systems (AREA)
- Computing Systems (AREA)
- Artificial Intelligence (AREA)
- Spectroscopy & Molecular Physics (AREA)
- Mathematical Physics (AREA)
- Nuclear Medicine, Radiotherapy & Molecular Imaging (AREA)
- Radiology & Medical Imaging (AREA)
- Quality & Reliability (AREA)
- Image Analysis (AREA)
- Automatic Analysis And Handling Materials Therefor (AREA)
- Geometry (AREA)
- Investigating Or Analysing Biological Materials (AREA)
- Investigating Or Analysing Materials By Optical Means (AREA)
Abstract
本開示は、色付ラベルの色の誤抽出による分析対象領域の抽出精度の低下を起こさせず、分析対象の領域と色情報を取得し、検体の液量の測定と検体種別を判別することを可能とする技術について提案することを目的とする。本開示に係る生体検体解析装置は、生体試料管のカラー画像から部分領域を切り出し、前記部分領域を前記生体試料管の周方向に沿って連結することにより展開図を作成し、前記展開図から検出対象領域を抽出する(図6B参照)。
Description
本開示は、複ラベルが貼付された生体試料管に収容された生体検体を分析する生体検体解析装置に関する。
血液検査など臨床検査の効率化を目的に、従来目視確認で行われていた生体検体の確認作業を自動化する技術が提案されている。そのうち生化学分析前の検体確認作業においては、採血管などの容器に格納された試料の液量測定や血液検体における血清種別(正常、溶血、黄疸、乳びなど)などの検体状態を判別する解析技術が求められている。
このような検体状態の判別技術として、例えば、特許文献1は、ラベルが貼付された生体試料管内の生体試料の情報を検出する検出装置について開示する。より詳細には、当該検出装置は、生体試料管を撮像する撮像部と、撮像部によって撮像された画像から検出対象領域を抽出する検出対象領域抽出部と、撮像部によって撮像された画像から撮像部の撮像面側に位置するラベルを抽出するラベル抽出部と、ラベル抽出部により抽出されたラベルの境界位置に基づいて、検出対象領域抽出部により抽出された検出対象領域内の前記ラベルの境界位置を特定する解析部と、を備え、液量の測定と検体の画像から抽出した検出対象領域の色情報から検体種別の情報を取得するものである。
また、例えば、特許文献2は、採血管に赤外光を当て透過光を検出しその一次微分値に基づいてラベルの境界を求め、採血管の血清量を推定する液体検出装置について開示する。
特許文献1記載の技術は、抽出されたラベルの境界位置に基づいて抽出された検出対象領域内のラベルの境界位置を特定することによって検出領域の色情報を抽出する方式に関するものである。しかしながら、特許文献1においては、検出対象の色と類似した色付ラベルが貼付された検体について、色付ラベルの色と検出対象領域の色を識別し、色付ラベル領域と検出対象領域を分離することが考慮されておらず、色付ラベルの色を誤抽出することによって色抽出精度が低下してしまうという課題がある。
特許文献2は、ラベルの境界を求めて血清量を測定するが、分析対象の色情報を取得し、検体種別を判別することはできない。
本開示はこのような状況に鑑みてなされたものであり、色付ラベルの色の誤抽出による分析対象領域の抽出精度の低下を起こさせず、分析対象の領域と色情報を取得し、検体の液量の測定と検体種別を判別することを可能とする技術について提案する。
本開示に係る生体検体解析装置は、生体試料管のカラー画像から部分領域を切り出し、前記部分領域を前記生体試料管の周方向に沿って連結することにより展開図を作成し、前記展開図から検出対象領域を抽出する。
本開示に係る生体検体解析装置によれば、色付ラベルが貼付された検体において複数の成分により構成される試料の色、量を高精度に検出することができる。本開示に関連するさらなる特徴は、本明細書の記述、添付図面から明らかになる。本開示の態様は、要素及び多様な要素の組み合わせ及び以降の詳細な記述と添付される特許請求の範囲の様態により達成され実現される。本明細書の記述は典型的な例示に過ぎず、本開示の特許請求の範囲又は適用例を如何なる意味においても限定するものではないことを理解する必要がある。
以下、添付図面を参照して本開示の実施形態について説明する。添付図面では、機能的に同じ要素は同じ番号で表示される場合もある。なお、添付図面は本開示の原理に則った具体的な実施形態と実装例を示しているが、これらは本開示の理解のためのものであり、決して本開示を限定的に解釈するために用いられるものではない。
本実施形態では、当業者が本開示を実施するのに十分詳細にその説明がなされているが、他の実装・形態も可能で、本開示の技術的思想の範囲と精神を逸脱することなく構成・構造の変更や多様な要素の置き換えが可能であることを理解する必要がある。したがって、以降の記述をこれに限定して解釈してはならない。
本実施形態においては、便宜上その必要があるときは、複数のセクションまたは実施の形態に分割して説明するが、特に明示した場合を除き、それらはお互いに無関係なものではなく、一方は他方の一部または全部の変形例、詳細、補足説明等の関係にある。要素の数等(個数、数値、量、範囲等を含む)に言及する場合、特に明示した場合および原理的に明らかに特定の数に限定される場合等を除き、その特定の数に限定されるものではなく、特定の数以上でも以下でもよい。
以下の実施の形態において、その構成要素(要素ステップ等も含む)は、特に明示した場合および原理的に明らかに必須であると考えられる場合等を除き、必ずしも必須のものではないことは言うまでもない。
同様に、以下の実施形態において、構成要素等の形状、位置関係等に言及するときは特に明示した場合および原理的に明らかにそうではないと考えられる場合等を除き、実質的にその形状等に近似または類似するもの等を含むものとする。このことは、上記数値および範囲についても同様である。
実施形態を説明するための全図において、同一の部材には原則として同一の符号を付し、その繰り返しの説明は省略する場合がある。
<実施の形態1>
<生体検体解析装置の装置構成>
図1は、本開示の実施形態1に係る生体検体解析装置100の概略構成例を示す図である。生体検体解析装置100は、固定カメラ101、背景版102、光源103aおよび103b、光源用ドライバ104аおよび104b、生体試料管ホルダ105、コントローラ106、メモリ107、記憶装置108、入出力インターフェース109、データバス110、把持機構111、移動機構112、上下制御ドライバ113、生体試料管回転機構114、回転制御ドライバ115、を備えている。
<生体検体解析装置の装置構成>
図1は、本開示の実施形態1に係る生体検体解析装置100の概略構成例を示す図である。生体検体解析装置100は、固定カメラ101、背景版102、光源103aおよび103b、光源用ドライバ104аおよび104b、生体試料管ホルダ105、コントローラ106、メモリ107、記憶装置108、入出力インターフェース109、データバス110、把持機構111、移動機構112、上下制御ドライバ113、生体試料管回転機構114、回転制御ドライバ115、を備えている。
コントローラ106は、例えばプロセッサ(Central Processing Unit:CPUなど)によって構成され、メモリ107あるいは記憶装置108に格納されている各種プログラムを読み込み、それを内部メモリ(図示せず)に展開して後述の画像処理部を生成し、所定のタイミングで実行する。
入出力インターフェース109は、キーボード、タッチパネル、マイクやスイッチ、および表示装置、プリンタ、スピーカなどで構成され、検出された生体検体の解析結果(生体検体の種別や量など)の表示や解析前の生体検体の状態チェックなどに用いられる。また、入出力インターフェース109は、後述の所定領域切り出し条件の設定や、データの伝送、生体試料種別、および/または生体試料量などの解析に用いるパラメータの入力を受け付ける。
把持機構111は、生体試料管ホルダ105に設置された生体試料管116を把持する。 上下制御ドライバ113は、移動機構112を制御することにより、把持機構111を上下方向に移動させる。
生体試料管ホルダ105に設置された生体試料管116は搬送ラインにより搬送され、停止機構(不図示)等により停止される。移動機構112は、把持機構111により把持された生体試料管116を、生体試料管116全体が固定カメラ101により撮像される位置まで移動させる。
把持機構111が、生体試料管116を上方に移動させることによって、生体試料管116全体に対して光源103аおよび光源103bの光が照射されるようになる。より具体的には、生体試料管ホルダ105に設定された生体試料管116は、把持機構111によって把持され、移動機構112によって固定カメラ101の視野内に移動する。このとき、上下制御ドライバ113が移動機構112の移動量を制御することによって生体試料管116の上下位置を調整する。固定カメラ101は、生体試料管116の少なくとも検出対象領域117の2次元カラー画像を取得する必要がある。そこで、上下制御ドライバ113が生体試料管116の長さに応じて移動機構112の移動量を決定することにより、生体試料管116の長さによらず、検出対象領域117を固定カメラ101の視野内に移動し、検出対象領域117を光源103aおよび光源103bで照明した状態において撮像することができる。
回転制御ドライバ115は、生体試料管回転機構114を制御することにより、把持機構111が把持している生体試料管116を回転させる。固定カメラ101は、生体試料管116を回転させながら撮像することにより、生体試料管116の全周囲を撮像できる。回転制御ドライバ115による生体試料管回転機構114の回転の制御と、固定カメラ101の撮像の同期方法については後述する。
固定カメラ101は、例えばCCD(Charge Coupled Device)イメージセンサやCMOS(Complementary Metal-Oxide Semiconductor)イメージセンサなどの撮像デバイスである。固定カメラ101は、背景版102を背景として光源103aおよび光源103bによって証明された生体試料管116の2次元カラー画像を取得し、その画像をコントローラ106に入力する。自然光ではなく、光源103аおよび光源103bなどの照明を利用する点と、背景版102を利用することによって、例えば血清のように、検出対象領域117が透明色の場合においても、解析用に抽出する検出対象領域117の色の測定間のばらつきや外光の影響によるばらつきを低減し、解析精度を高めることができる。
光源103аおよび光源103bは、例えば白色LEDで構成され、光源用ドライバ104аおよび光源用ドライバ104bによって制御される。光源103аと光源103bの輝度は、固定カメラ101が取得する生体試料管116のカラー画像の色(画素値)に影響する。光源の輝度のばらつきは解析結果に影響するので、例えば、色の退色がない校正用治具の撮像評価や、生体試料管116の背景画像の色の解析を実施し、光源103аおよび103bの輝度を調整するキャリブレーションを測定前に実施することによって、照明による解析結果のばらつきを低減することができる。
以上の構成によって取得するカラー画像は、コントローラ106によって後述する画像処理と解析処理に利用され、コントローラ106は検出対象領域117の色と量を算出(検知)する。メモリ107あるいは記憶装置108は、検出対象領域117の色を解析するのに必要な、例えば血清の色特徴量などを記憶しており、検出対象領域117の色の情報や解析結果などの情報は、データバス110を通じてコントローラ106に渡され、入出力インターフェース109から出力される(例えば、表示装置の表示画面上に表示される)。
<コントローラ106内で実現される機能>
図2は、メモリ107あるいは記憶装置108に格納されたプログラムがコントローラ(プロセッサ)106内で展開され実現される概略機能を示す図である。図2に示されるように、コントローラ106は、ソフトウェア的に実現される機能として、画像処理部201と領域設定部202と生体試料管情報取得部203を備える。
図2は、メモリ107あるいは記憶装置108に格納されたプログラムがコントローラ(プロセッサ)106内で展開され実現される概略機能を示す図である。図2に示されるように、コントローラ106は、ソフトウェア的に実現される機能として、画像処理部201と領域設定部202と生体試料管情報取得部203を備える。
画像処理部201は、固定カメラ101によって取得する複数の2次元カラー画像をもとに後述する処理によって展開図を生成し、展開図から検出対象領域(例えば、血清領域)117を抽出して、検出対象の色および検体種別の特定や溶液量の算出などの処理を実行する。
領域設定部202は、後述の展開図を生成するための2次元カラー画像の切り出し処理において所定領域(切り出し領域)をユーザ(オペレータ)が設定・変更することを可能にする機能を実現する処理部である。
例えば、ユーザが入出力インターフェース109であるタッチパネルを用いて所定領域の撮像画像内の基準座標値、幅、高さ等を指定すると、領域設定部202は対象の2次元カラー画像について所定領域を設定する。または、メモリ107あるいは記憶装置108に所定領域の撮像画像内の基準座標値、幅、高さなどを記述した設定ファイルを格納し、設定ファイルの情報をプログラムから読み込むことによって所定領域を設定・変更することを可能にする。
生体試料管情報取得部203は、後述の検出対象領域117抽出処理によって抽出する色付きラベル118の色情報(ラベル色分布の範囲)および/またはサイズの情報および/または解析対象の生体試料管116のサイズ(径および長軸方向の長さ)情報を取得し設定・変更することを可能にする機能を実現する処理部である。
例えば、ユーザが入出力インターフェース109であるタッチパネルを用いて色付きラベル118の色情報(ラベル色分布の範囲)および/またはサイズの情報と生体試料管116のサイズ情報を入力すると、生体試料管情報取得部203は、後述の検出対象領域117抽出処理において抽出する色付きラベル118の色または/サイズの情報と生体試料管116のサイズ情報を設定・変更する。または、メモリ107あるいは記憶装置108にラベル色の情報を記述した設定ファイルを格納しておき、設定ファイルの情報をプログラムから読み込むことによって色付きラベル118の色またはサイズの情報と生体試料管116のサイズ情報を設定・変更することを可能にする。
<画像処理部の内部構成>
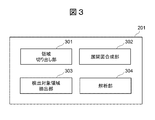
図3は、画像処理部201の内部構成例を示す図である。図3に示されるように、画像処理部201は、領域切り出し部301、展開図合成部302、検出対象領域抽出部303、解析部304、を含んでいる。各処理部の動作の詳細については後述するが、簡単に説明すると、それぞれ以下のような処理を実行する。
図3は、画像処理部201の内部構成例を示す図である。図3に示されるように、画像処理部201は、領域切り出し部301、展開図合成部302、検出対象領域抽出部303、解析部304、を含んでいる。各処理部の動作の詳細については後述するが、簡単に説明すると、それぞれ以下のような処理を実行する。
領域切り出し部301は、領域設定部202が設定する領域を各2次元カラー画像から切り出す処理を実行する。
展開図合成部302は、領域切り出し部301が切り出した複数の画像を、生体試料管116の周方向に沿って連結することにより、1枚の展開図を生成する処理を実行する。
検出対象領域抽出部303は、事前に取得する検出対象(例えば血清領域)の色情報または、生体試料管情報取得部203で取得する生体試料管に貼付するラベルの色情報をもとに検出対象領域(例えば血清領域)117を抽出する処理を実行する。
解析部304は、検出対象領域抽出部303が抽出した検出対象領域117の色を特定し、その色情報から生体検体の種別を判定する処理と、検出対象領域抽出部303が抽出した検出対象領域117から生体検体の液量を計算する処理を実施する。
<生体試料分析処理概要>
図4は、本実施形態による生体検体解析装置100が実行する生体検体分析処理の概要を説明するためのフローチャートである。以下の説明において、各ステップの動作主体を、対応する各処理部としているが、各処理部はメモリ107あるいは記憶装置108に格納されたプログラムによって実現されているので、当該プログラムの実行主体であるコントローラ106を各ステップの動作主体として説明を読み替えてもよい。
図4は、本実施形態による生体検体解析装置100が実行する生体検体分析処理の概要を説明するためのフローチャートである。以下の説明において、各ステップの動作主体を、対応する各処理部としているが、各処理部はメモリ107あるいは記憶装置108に格納されたプログラムによって実現されているので、当該プログラムの実行主体であるコントローラ106を各ステップの動作主体として説明を読み替えてもよい。
本実施形態による生体検体解析処理によれば、生体試料管116に色付きラベル118が貼付された生体試料管116において、検出対象領域117に類似した色の色付きラベル118を検出対象領域117の一部として誤抽出することを回避し、検出対象領域117の色と量の解析精度を向上する効果がある。
(図4:ステップS401:複数の2次元カラー画像を取得)
画像処理部201は、固定カメラ101によって撮像された生体試料管116の複数の2次元カラー画像を取得する。
画像処理部201は、固定カメラ101によって撮像された生体試料管116の複数の2次元カラー画像を取得する。
(図4:ステップS401:撮像方法について)
生体試料管116の撮像方法について説明する。2次元のカラー画像から検出対象領域117の色と量を解析するためには、ラベルが貼付された生体試料管116のうち、検出対象領域117が露出している領域の2次元カラー画像が必要である。後述する展開図合成部302による展開図生成処理を実施するためには、生体試料管116を回転させながら取得する複数枚の2次元カラー画像が必要である。そこで、コントローラ106の指令に基づいて生体試料管回転機構114および回転制御ドライバ115が生体試料管116の回転を制御することにより、生体試料管116を回転させながら複数枚の2次元カラー画像を撮像する。例えば、生体試料管回転機構114は、生体試料管116を回転させ、回転制御ドライバ115によって回転の速度または加速度、回転角度、回転数、および回転開始のタイミングを制御する。以上によって、生体試料管116の全周囲の情報をもつ複数枚の画像を取得することができる。
生体試料管116の撮像方法について説明する。2次元のカラー画像から検出対象領域117の色と量を解析するためには、ラベルが貼付された生体試料管116のうち、検出対象領域117が露出している領域の2次元カラー画像が必要である。後述する展開図合成部302による展開図生成処理を実施するためには、生体試料管116を回転させながら取得する複数枚の2次元カラー画像が必要である。そこで、コントローラ106の指令に基づいて生体試料管回転機構114および回転制御ドライバ115が生体試料管116の回転を制御することにより、生体試料管116を回転させながら複数枚の2次元カラー画像を撮像する。例えば、生体試料管回転機構114は、生体試料管116を回転させ、回転制御ドライバ115によって回転の速度または加速度、回転角度、回転数、および回転開始のタイミングを制御する。以上によって、生体試料管116の全周囲の情報をもつ複数枚の画像を取得することができる。
(図4:ステップS401:撮像方法について:補足その1)
把持機構111によって把持される生体試料管116の向きが揃うようにユーザ(オペレータ)が生体試料管116を生体検体解析装置100へ投入する場合には、生体試料管116の全周囲を撮像する必要はなく、生体試料管116を回転させながら検出対象領域117の領域が撮像された2次元カラー画像を複数枚取得できればよい。
把持機構111によって把持される生体試料管116の向きが揃うようにユーザ(オペレータ)が生体試料管116を生体検体解析装置100へ投入する場合には、生体試料管116の全周囲を撮像する必要はなく、生体試料管116を回転させながら検出対象領域117の領域が撮像された2次元カラー画像を複数枚取得できればよい。
(図4:ステップS401:撮像方法について:補足その2)
一方で、把持機構111によって把持される生体試料管116の向きをユーザ(オペレータ)が揃えることなく生体試料管116を生体検体解析装置に投入する場合には、生体試料管116の全周囲の情報が取得できるように生体試料管116を回転させながら複数枚の2次元カラー画像を取得することにより、確実に検出対象領域117の撮像画像を取得できる。例えば、10度回転させるごとに固定カメラ101で画像を取得することを繰り返して36枚(36フレーム)の画像を取得すれば、生体試料管116の全周囲の情報を取得できる。
一方で、把持機構111によって把持される生体試料管116の向きをユーザ(オペレータ)が揃えることなく生体試料管116を生体検体解析装置に投入する場合には、生体試料管116の全周囲の情報が取得できるように生体試料管116を回転させながら複数枚の2次元カラー画像を取得することにより、確実に検出対象領域117の撮像画像を取得できる。例えば、10度回転させるごとに固定カメラ101で画像を取得することを繰り返して36枚(36フレーム)の画像を取得すれば、生体試料管116の全周囲の情報を取得できる。
(図4:ステップS401:撮像方法について:補足その3)
回転角度および回転の速度または加速度は一定で無くてもよく、例えば、1フレームと2フレームとの間は低速度から加速させ、31フレームと32フレームとの間は減速させるなどして計32枚のフレームで生体試料管116の全周を撮像してもよい。また、回転制御信号に基づきカメラのシャッタースピードや撮像タイミングを変えてもよい。
回転角度および回転の速度または加速度は一定で無くてもよく、例えば、1フレームと2フレームとの間は低速度から加速させ、31フレームと32フレームとの間は減速させるなどして計32枚のフレームで生体試料管116の全周を撮像してもよい。また、回転制御信号に基づきカメラのシャッタースピードや撮像タイミングを変えてもよい。
(図4:ステップS402:展開図合成処理)
画像処理部201は、領域切り出し部301と展開図合成部302における各画像処理を実行し、S401で取得した2次元カラー画像をもとに1枚の展開図を作成する。本ステップの詳細については後述の図5で説明する。
画像処理部201は、領域切り出し部301と展開図合成部302における各画像処理を実行し、S401で取得した2次元カラー画像をもとに1枚の展開図を作成する。本ステップの詳細については後述の図5で説明する。
(図4:ステップS403:検体情報解析)
画像処理部201は、検出対象領域抽出部303と解析部304の処理を実行し、S402で取得した展開図から検出対象領域117を抽出し(詳細については後述する)、検出対象領域117で取得する検出対象の色と量などの情報を取得(演算で求める)する。例えば、メモリ107あるいは記憶装置108に生体検体の種別に対応する色情報を事前に格納しておき、取得した色情報とメモリ107等にあらかじめ格納している色情報を解析部304が照合することにより、検出対象領域117の色情報から生体試料の種別を判別することができる。例えば、検出対象領域117が血清の場合、血清状態(正常、溶血、黄疸、乳び)によって血清色に特徴がある。そこで、色特徴量と分類に使用する色空間の範囲と閾値をメモリ107に格納し、解析部304で取得した色情報を照合することにより、検体の血清状態を判別することができる。また、検出対象領域117の高さ方向(2次元カラー画像の鉛直方向)の画素数の情報と、生体試料管116の直径の情報から、検出対象の溶液量を算出することができる。生体試料管116の直径は、例えば、ユーザが入出力インターフェース109であるタッチパネルを用いて使用する生体試料管116の型番または生体試料管116の直径などの情報を直接入力するなどによって取得する。
画像処理部201は、検出対象領域抽出部303と解析部304の処理を実行し、S402で取得した展開図から検出対象領域117を抽出し(詳細については後述する)、検出対象領域117で取得する検出対象の色と量などの情報を取得(演算で求める)する。例えば、メモリ107あるいは記憶装置108に生体検体の種別に対応する色情報を事前に格納しておき、取得した色情報とメモリ107等にあらかじめ格納している色情報を解析部304が照合することにより、検出対象領域117の色情報から生体試料の種別を判別することができる。例えば、検出対象領域117が血清の場合、血清状態(正常、溶血、黄疸、乳び)によって血清色に特徴がある。そこで、色特徴量と分類に使用する色空間の範囲と閾値をメモリ107に格納し、解析部304で取得した色情報を照合することにより、検体の血清状態を判別することができる。また、検出対象領域117の高さ方向(2次元カラー画像の鉛直方向)の画素数の情報と、生体試料管116の直径の情報から、検出対象の溶液量を算出することができる。生体試料管116の直径は、例えば、ユーザが入出力インターフェース109であるタッチパネルを用いて使用する生体試料管116の型番または生体試料管116の直径などの情報を直接入力するなどによって取得する。
(図4:ステップS403:検体情報解析:補足その1)
このような検体種別の判別を、例えば生化学分析前に実施することにより、異常血清(溶血、黄疸、乳び)などのように生化学分析の精度に影響がある検体については事前にフラグを立てることが可能になる。また、解析部304において検出対象領域117の溶液量を算出することにより、分析に十分な溶液量が確保できるかを事前に確認することができる。これにより、溶液量が不足する場合には例えば再採血するなどの対応が可能となり、生化学分析の効率を向上する効果がある。
このような検体種別の判別を、例えば生化学分析前に実施することにより、異常血清(溶血、黄疸、乳び)などのように生化学分析の精度に影響がある検体については事前にフラグを立てることが可能になる。また、解析部304において検出対象領域117の溶液量を算出することにより、分析に十分な溶液量が確保できるかを事前に確認することができる。これにより、溶液量が不足する場合には例えば再採血するなどの対応が可能となり、生化学分析の効率を向上する効果がある。
(図4:ステップS403:検体情報解析:補足その2)
例えば、血清色の黄色や赤色のように、検出対象領域117の色と類似した色付きラベル118が貼付された生体試料管116については、色付きラベル118の色を検出対象として誤抽出し検体種別の誤判別する可能性がある。また、色付きラベル118の領域を検出対象領域117として誤抽出することにより、溶液量を誤算出する可能性がある。そこで、検出対象領域抽出部303において後述の処理によりラベル色と検出対象の色を識別し、色付きラベル118を除去して検出対象領域117のみを抽出することにより、色付きラベル118による誤判別と溶液量の誤算出を回避し、検体種別の判別精度と溶液量の測定精度を向上することができる。
例えば、血清色の黄色や赤色のように、検出対象領域117の色と類似した色付きラベル118が貼付された生体試料管116については、色付きラベル118の色を検出対象として誤抽出し検体種別の誤判別する可能性がある。また、色付きラベル118の領域を検出対象領域117として誤抽出することにより、溶液量を誤算出する可能性がある。そこで、検出対象領域抽出部303において後述の処理によりラベル色と検出対象の色を識別し、色付きラベル118を除去して検出対象領域117のみを抽出することにより、色付きラベル118による誤判別と溶液量の誤算出を回避し、検体種別の判別精度と溶液量の測定精度を向上することができる。
(図4:ステップS403:検体情報解析:補足その3)
本ステップにおいて、色付きラベル118と検出対象領域117は、例えば以下のような手順で区別できる。生体試料管情報取得部203が実行する後述のラベルキャリブレーション処理によって、使用するラベル色の情報(色相、彩度、明度値の分布および/または閾値)をあらかじめ取得し、メモリ107あるいは記憶装置108に使用するラベル色の情報を格納しておく。S402で取得する展開図からあらかじめ格納しているラベル色の情報をもとに色付きラベル118の領域のみを抽出するマスクを生成することにより、展開図から色付きラベル118の領域のみを除去する。
本ステップにおいて、色付きラベル118と検出対象領域117は、例えば以下のような手順で区別できる。生体試料管情報取得部203が実行する後述のラベルキャリブレーション処理によって、使用するラベル色の情報(色相、彩度、明度値の分布および/または閾値)をあらかじめ取得し、メモリ107あるいは記憶装置108に使用するラベル色の情報を格納しておく。S402で取得する展開図からあらかじめ格納しているラベル色の情報をもとに色付きラベル118の領域のみを抽出するマスクを生成することにより、展開図から色付きラベル118の領域のみを除去する。
<展開図合成処理の詳細内容>
図5は、図4のS402(展開図合成処理)の詳細内容を説明するためのフローチャートである。以下の説明において、各ステップの動作主体を、対応する各処理部としているが、各処理部はメモリ107あるいは記憶装置108に格納されたプログラムによって実行されているため、当該プログラムの実行主体であるコントローラ(プロセッサ)106を各ステップの動作主体として説明を読み替えてもよい。
図5は、図4のS402(展開図合成処理)の詳細内容を説明するためのフローチャートである。以下の説明において、各ステップの動作主体を、対応する各処理部としているが、各処理部はメモリ107あるいは記憶装置108に格納されたプログラムによって実行されているため、当該プログラムの実行主体であるコントローラ(プロセッサ)106を各ステップの動作主体として説明を読み替えてもよい。
2次元カラー画像をもとに一枚の展開図を取得するため、領域設定部202は2次元カラー画像の所定領域を設定し、領域切り出し部301は2次元カラー画像から領域設定部202が設定した領域を切り出す。展開図合成部302は、領域切り出し部301が切り出した複数の2次元カラー画像の切り出し画像を連結して1枚の展開図を合成する。
(図5:ステップS501:所定領域設定)
領域設定部202は、ユーザによる所定領域(2次元カラー画像の切り出し領域)の設定入力またはメモリ107あるいは記憶装置108に格納してある設定ファイルに応答して、S401で取得した複数の2次元カラー画像のそれぞれに対して所定領域を設定する。ユーザによる設定入力または設定ファイルの記述内容は、例えば、所定領域の幅、高さ、撮像画像内の基準座標値である。本ステップの詳細については図6A~図7を用いて後述する。
領域設定部202は、ユーザによる所定領域(2次元カラー画像の切り出し領域)の設定入力またはメモリ107あるいは記憶装置108に格納してある設定ファイルに応答して、S401で取得した複数の2次元カラー画像のそれぞれに対して所定領域を設定する。ユーザによる設定入力または設定ファイルの記述内容は、例えば、所定領域の幅、高さ、撮像画像内の基準座標値である。本ステップの詳細については図6A~図7を用いて後述する。
(図5:ステップS502:2次元カラー画像切り出し)
領域切り出し部301は、S401で取得する複数の2次元カラー画像それぞれから、S501で設定された所定領域(切り出し領域)を切り出す。
領域切り出し部301は、S401で取得する複数の2次元カラー画像それぞれから、S501で設定された所定領域(切り出し領域)を切り出す。
(図5:ステップS503:切り出し画像連結処理)
展開図合成部302は、S502で出力する複数の2次元カラー画像の切り出し画像を連結することにより、1枚の展開図を合成する。展開図は、ガウシアンフィルタなどの平滑化フィルタを適用することによって連結部を滑らかにすることができる。
展開図合成部302は、S502で出力する複数の2次元カラー画像の切り出し画像を連結することにより、1枚の展開図を合成する。展開図は、ガウシアンフィルタなどの平滑化フィルタを適用することによって連結部を滑らかにすることができる。
図6Aは、S501において画像中心を所定領域とする設定例を示す図である。生体試料管116を回転させながら固定カメラ101で撮像すると図6Aのように向きの異なる生体試料管116の複数の2次元カラー画像が取得される。領域設定部202は、それぞれの画像に対して所定領域を設定する。図6Aは取得された各撮像画像の中心を基準座標として左右対称になるように所定領域を設定した例を示しているが、切り出し領域はこれに限定されるものではない。また、生体試料管回転機構114の回転速度または回転加速度などの情報をもとに画像ごとに所定領域の座標や幅を変えてもよい。
図6Bは、S502以降の処理で作成する展開図の例である。S502ではS501で設定する所定領域を画像から切り出し、S503では切り出した画像を連結して一枚の展開図に合成する。
所定領域(切り出し領域)の設定方法について説明する。所定領域の設定内容によって、S503以降の処理で取得する展開図の合成精度や検出対象領域抽出部303により取得される検出対象領域117の色分布のばらつきが変わる。まず、所定領域の座標と幅の設定による展開図の合成精度への影響について説明する。
採血管のように円筒状の生体試料管116を撮像し展開図を合成する際には、生体試料管116の曲率を考慮して所定領域の座標と幅を設定することにより、合成後の展開図の歪みを低減し検出対象領域117の抽出精度を向上する効果がある。例えば、撮像画像の水平方向の中心座標を所定領域の基準座標として設定し、生体試料管116の幅の8%程度(生体試料管116の領域が128ピクセルの場合は、10ピクセル)が所定領域の幅となるように、基準座標から左右対称となる領域を所定領域として設定する。これにより、生体試料管116の曲率の影響を低減できる。所定領域の幅を狭くするほど曲率の影響は小さくなるが、生体試料管116全周の情報が含まれた展開図を取得するためには、所定領域の幅を狭くする分、生体試料管116の撮像枚数を増やす必要がある。
図7は、固定カメラ101で撮像した検出対象領域117の明度分布の例を示す図である。図7を用いて、所定領域の座標と幅の設定による検出対象領域117の色分布への影響について説明する。生体試料管116を光源103aおよび光源103bで照明した状態で画像を取得すると、検出対象領域が均一な溶液である場合であっても、検出対象領域117の中心は明度が高く、端部は明度が低くなる。そのため例えば、周方向に沿った明度値の変動幅が許容範囲内に収まっている(例えば一定)中心領域を所定領域として設定することにより、各画像それぞれから明度値が均一な領域のみを切り出して展開図を合成することになる。これにより、合成後の検出対象領域117の明度値のばらつきを低減し、検出対象領域117の色の解析精度を向上する効果がある。すなわち、領域設定部202は、2次元カラー画像の明度分布に基づき合成後の明度値の分散が小さくなるように所定領域を決定する。
切り出し領域の明度ばらつきを抑えることにより、色付きラベル118の色についても同様に展開図合成後の色付きラベル118領域の明度値ばらつきを低減することができる。すなわち、合成された展開図において検出対象領域117と色付きラベル118の色分布の重なりを低減することができ、検出対象領域抽出部303で実行する処理において検出対象領域117と色付きラベル118の色を分離する解析精度を向上できる。色付きラベル118の分離・除去精度が向上すると、色付きラベル118の誤抽出を回避でき、検出対象の色と量の解析精度を向上できる。
図8は、生体試料管116の中心に2本線状の反射領域が出現した例を示す図である。所定領域のなかの光源103aおよび光源103bで照明した状態で撮像すると、生体試料管116の表面に光源103aおよび光源103bからの光の反射成分が映り込む場合がある。反射成分の領域は、通常は明度値が高く白色になること多いので、検出対象領域117に反射成分がある場合には検体情報の解析処理においてノイズとなる。そこで領域設定部202は、所定領域の設定座標を反射光ノイズの映り込みのない領域に設定することにより、展開図合成後の検出対象領域117から反射成分の領域を除去でき、検出対象領域117の色の解析精度を向上できる。
また、反射成分の領域を除去することにより、白色の反射成分を白色のラベルと検出対象領域117との間の境界として認識する誤検出を回避でき、検出対象領域117の抽出精度を向上し、検出対象の量の解析精度を向上する効果がある。例えば、図8のような2本線状の反射領域が出現する場合には、反射領域の間(生体試料管116の中心)を所定領域とする、もしくは、反射領域の外側を所定領域とすることにより、反射成分の映り込みを回避できる。
固定カメラ101による生体試料管116の撮像枚数と生体試料管回転機構114の回転速度を考慮した所定領域の幅の設定方法について説明する。上述のように、所定領域の座標と幅の設定によって展開図の合成精度の向上と検出対象領域117の色分布のばらつき低減の効果が得られるが、生体試料管116全周の情報が含まれた展開図を取得するためには、生体試料管回転機構114の回転速度と固定カメラ101の撮像ピッチを考慮して、展開図合成後に欠けた領域がないように所定領域の幅を設定する必要がある。
例えば、生体試料管回転機構114の回転速度が一定の状態で生体試料管116(採血管)を一周回転させて撮像間隔一定で36枚の画像を取得すると、生体試料管116はフレーム間で10°回転することになるが、36枚の撮像画像から生体試料管116全周囲の展開図を取得する場合には、生体試料管116の半径をr[mm]として、所定領域の幅は最低でも(2πr/36)[mm]程度必要となる。
また、生体試料管回転機構114の回転速度が一定ではなく、回転初めに加速し一定速度になった後で減速して回転終了となるように回転制御ドライバ115で制御する場合は、生体試料管回転機構114の加速度に応じた所定領域の幅を撮像ごとに設定することにより、生体試料管116の全周の展開図を欠けや領域の重なりなく効率よく取得できる。
また、回転制御ドライバ115の制御信号に基づき、固定カメラ101の撮像タイミングを制御し、生体試料管回転機構114の回転速度と固定カメラ101の撮像タイミングに応じた所定領域の幅を設定してもよい。
上述の効果のほかにも、所定領域の鉛直方向の座標と幅の設定の設定によって、注目する領域(例えば、検出対象領域117)のみの展開図を取得することにより、以降の処理で出力する展開図の画像サイズを縮小し、演算処理を低減できる効果がある。また、撮像画像のうち、例えば、背景板のみが撮像されている領域など解析に不要な領域を所定領域の設定によって排除することにより、検体情報解析処理におけるノイズを除去し解析精度を向上する効果がある。
<検体情報解析処理の詳細内容>
図9は、S403(検体情報解析処理)の詳細内容を説明するためのフローチャートである。以下の説明において、各ステップの動作主体を対応する各処理部としているが、各処理部はメモリ107あるいは記憶装置108に格納されたプログラムによって実現されているため、当該プログラムの実行主体であるコントローラ(プロセッサ)106を各ステップの動作主体として説明を読み替えてもよい。
図9は、S403(検体情報解析処理)の詳細内容を説明するためのフローチャートである。以下の説明において、各ステップの動作主体を対応する各処理部としているが、各処理部はメモリ107あるいは記憶装置108に格納されたプログラムによって実現されているため、当該プログラムの実行主体であるコントローラ(プロセッサ)106を各ステップの動作主体として説明を読み替えてもよい。
本実施形態の検体情報解析処理は、検出対象領域抽出部303と解析部304において、展開図合成部302によって生成する展開図をもとに検出対象領域117を抽出し、抽出した領域の色と領域のサイズから検出対象の状態の判別と液量の計測処理を実行する。
(図9:ステップS901:ラベル領域特定・除去)
検出対象領域抽出部303は、S402で出力する展開図から、検体情報の解析に不要なラベル領域を特定する処理を実行する。本ステップの具体的処理については後述する。
検出対象領域抽出部303は、S402で出力する展開図から、検体情報の解析に不要なラベル領域を特定する処理を実行する。本ステップの具体的処理については後述する。
(図9:ステップS902:水平方向位置特定)
検出対象領域抽出部303は、S402における展開図合成処理で出力される展開図から、S901で特定したラベル領域を、検体情報の解析に不要な領域として除去する。検出対象領域抽出部303はさらに、S903以降の処理で解析する水平方向の領域を特定するマスクを生成する。もしくは、展開図から解析に必要な水平方向の領域のみを切り出した画像を生成する処理を実行する。水平方向の領域は、例えばS901で特定したラベル領域の両端の座標を基準に設定する。
検出対象領域抽出部303は、S402における展開図合成処理で出力される展開図から、S901で特定したラベル領域を、検体情報の解析に不要な領域として除去する。検出対象領域抽出部303はさらに、S903以降の処理で解析する水平方向の領域を特定するマスクを生成する。もしくは、展開図から解析に必要な水平方向の領域のみを切り出した画像を生成する処理を実行する。水平方向の領域は、例えばS901で特定したラベル領域の両端の座標を基準に設定する。
(図9:ステップS903:鉛直方向位置特定)
検出対象領域抽出部303は、S902で出力する水平方向の領域を特定するマスクまたは、水平方向の領域のみを切り出した画像に対してエッジ検出処理などを実行する。例えば、検体の各領域のエッジを識別することにより、検出対象領域117と分離剤などの領域とを分離し、検出対象領域117を抽出する。
検出対象領域抽出部303は、S902で出力する水平方向の領域を特定するマスクまたは、水平方向の領域のみを切り出した画像に対してエッジ検出処理などを実行する。例えば、検体の各領域のエッジを識別することにより、検出対象領域117と分離剤などの領域とを分離し、検出対象領域117を抽出する。
(図9:ステップS904:検体情報解析処理)
解析部304は、S903の処理で特定する検出対象領域117の色情報と領域(座標および画素数)の情報から、検体状態の判別と液量の算出処理を実施する。例えば、検出対象が血清の場合は、血清状態(正常、溶血、黄疸、乳び)に応じて血清色が変わる特徴があるので、色特徴量と分類に使用する色空間の範囲と閾値をメモリ107に格納し、検出対象領域117で取得した色情報を照合することで、検体の血清状態を判別することができる。また、検出対象領域117の領域(座標および画素数)の情報と生体試料管情報取得部203で取得する生体試料管116の径情報から、検出対象の溶液量を算出する。
解析部304は、S903の処理で特定する検出対象領域117の色情報と領域(座標および画素数)の情報から、検体状態の判別と液量の算出処理を実施する。例えば、検出対象が血清の場合は、血清状態(正常、溶血、黄疸、乳び)に応じて血清色が変わる特徴があるので、色特徴量と分類に使用する色空間の範囲と閾値をメモリ107に格納し、検出対象領域117で取得した色情報を照合することで、検体の血清状態を判別することができる。また、検出対象領域117の領域(座標および画素数)の情報と生体試料管情報取得部203で取得する生体試料管116の径情報から、検出対象の溶液量を算出する。
(図9:ステップS904:検体情報解析処理:補足)
S904の検体情報解析処理において、生体試料管116の一枚の撮像画像ではなく展開図から検出対象領域117を抽出することの利点としては、以下が挙げられる:(a)S402における所定領域の設定方法によって、検出対象領域117の色のばらつきを低減し状態の判別精度を向上できる。(b)色付きラベル118が貼付された生体試料管116において、色付きラベル118の除去精度を向上し色付きラベル118による検出対象領域117の誤抽出を回避できる。また、所定領域の設定方法によっては、生体試料管116の撮像画像のうち反射成分など不要な領域を展開図から除去したうえで検出対象領域117の抽出処理を実行できるので、ノイズによる検出対象領域117の誤抽出や検出対象の色の誤解析と誤判別を回避することができる。
S904の検体情報解析処理において、生体試料管116の一枚の撮像画像ではなく展開図から検出対象領域117を抽出することの利点としては、以下が挙げられる:(a)S402における所定領域の設定方法によって、検出対象領域117の色のばらつきを低減し状態の判別精度を向上できる。(b)色付きラベル118が貼付された生体試料管116において、色付きラベル118の除去精度を向上し色付きラベル118による検出対象領域117の誤抽出を回避できる。また、所定領域の設定方法によっては、生体試料管116の撮像画像のうち反射成分など不要な領域を展開図から除去したうえで検出対象領域117の抽出処理を実行できるので、ノイズによる検出対象領域117の誤抽出や検出対象の色の誤解析と誤判別を回避することができる。
S901において、色付き部のないラベル(例えば、白色のラベルとバーコードおよび印字の黒色のみのラベル)領域を特定する方法の例を説明する。色付き部のないラベル領域の特定は、バーコード領域の検出および/または白色の検出処理などの画像処理により特定する。バーコード領域の検出は、例えば、黒色の色閾値による抽出方法や、エッジ抽出などの画像処理による抽出方法がある。エッジ抽出による検出の場合は、モルフォロジー処理を組み合わせることによってバーコードの細いラインも検出可能である。白色領域の検出は、色(例えば、色相、彩度、明度)の閾値を設定して閾値の範囲内に該当する領域をラベル領域として抽出する。また、はじめにバーコード領域を特定し、検出したバーコード領域を基準座標として、生体試料管情報取得部203で取得するラベルのサイズなどの情報をもとにラベルの範囲を特定し除去してもよい。
S901において、検出対象の色と類似した色付きラベル118の領域特定方法の例を説明する。該当する検出対象と色付きラベル118の組み合わせとしては、例えば、黄色の血清と黄色の色付きラベル118や、赤色の血清と赤色の色付きラベル118などがある。また、検出対象の色が赤色や黄色など測定(検体)ごとに異なる場合には、黄色の血清と赤色の色付きラベル118や赤色の血清と黄色の色付きラベル118の組み合わせも該当する。
色付きラベル118は、図6の展開図に示すように、白色ラベルの端の一部に色付き部があるものや、バーコード領域の上下位置に色付き部があるものなどがある。検出対象領域117の色と近い色付き部の場合は、色付き部を検出対象領域117として誤抽出し検体情報の解析精度を低下させる可能性がある。検出対象領域117の抽出前に展開図から色付きラベル118の領域を特定し除去することにより、色付き部を検出対象とする誤抽出を回避し解析精度を向上させる効果がある。
後述するラベルキャリブレーションにおいて、検出対象領域の色と類似した色付きラベル118の領域を特定する方法としては、(方法1)生体試料管情報取得部203で取得する色付きラベル118の色情報をもとに色付部を特定する方法、(方法2)生体試料管情報取得部203で取得する色付き部のサイズおよび/またはラベル中の色付き部の位置(ラベル中の右端、左端、上下などの位置)の情報から特定する方法、がある。
(方法1)色情報をもとに色付き部を特定する方法について説明する。生体試料管情報取得部203は、例えば、後述するラベルキャリブレーション処理を実行することにより、使用するラベル色の情報(色相、彩度、明度値の分布および/または閾値)を事前に取得し、メモリ107あるいは記憶装置108に使用するラベル色の情報を格納する。S901では、メモリ107あるいは記憶装置108に格納された色付きラベル118の色情報を取得し、色付きラベル118の色閾値(色相、彩度、明度など)を設定して、展開図から色付きラベル118の色付き部のみを抽出するためのマスクを作成し色付き部の領域を特定する。
(方法1:補足)使用する色付きラベル118の色情報は、ユーザが、例えば入出力インターフェース109であるタッチパネルなどを用いて入力しメモリ107あるいは記憶装置108に格納しておいてもよい。生体試料管情報取得部203は、ユーザが指定した色を基準として色空間内を探索することにより、色付きラベル118の領域を特定する。これにより、色付きラベル118と合致する色を速やかに発見できる。
(方法2)生体試料管情報取得部203で取得する色付き部のサイズおよび/またはラベル中の色付き部の位置(ラベル中の右端、左端、上下などの位置)の情報から色付き部を特定する方法について説明する。生体試料管情報取得部203は、例えば、後述するラベルキャリブレーション処理を実行することにより、色付きラベル118のサイズおよび/またはラベル中の色付き部の位置を取得し、メモリ107あるいは記憶装置108に格納しておく。または、ユーザが例えば入出力インターフェース109であるタッチパネルなどを用いて入力しメモリ107などに格納しておいてもよい。
(方法2:具体的手順)生体試料管情報取得部203は、上述の、色付き部のないラベル領域の特定方法の例などにより、バーコード領域と白色ラベル領域を特定する。特定したバーコードの領域または白色の領域の座標を基準として、色付きラベル118のサイズおよび/またはラベル中の色付き部の配置情報をもとに色付き部の領域を特定する。例えば、図6の展開図のようにラベルの端に色付き部があるラベルにおいては、白色のラベル領域または、バーコード領域のエッジ座標を検出後に、エッジの座標から色付き部のサイズ分外側の領域(図6ではバーコード領域の左側)を色付きラベル118の領域を特定する。
<ラベルキャリブレーション処理の詳細内容>
図10は、ラベルキャリブレーションの詳細内容を説明するためのフローチャートである。以下の説明において、各ステップの動作主体を、対応する各処理部としているが、各処理部はメモリ107あるいは記憶装置108に格納されたプログラムによって実現されているため、当該プログラムの実行主体であるコントローラ(プロセッサ)106を各ステップの動作主体として説明を読み替えてもよい。
図10は、ラベルキャリブレーションの詳細内容を説明するためのフローチャートである。以下の説明において、各ステップの動作主体を、対応する各処理部としているが、各処理部はメモリ107あるいは記憶装置108に格納されたプログラムによって実現されているため、当該プログラムの実行主体であるコントローラ(プロセッサ)106を各ステップの動作主体として説明を読み替えてもよい。
生体試料管情報取得部203が実行するラベルキャリブレーション処理は、検体解析処理に先立ち、使用する色付きラベル118を貼付した空の生体試料管116(以下キャリブレータと呼ぶ)の撮像画像から色付きラベル118の色情報およびサイズなどの情報を取得するためのものである。本フローチャートは、S901の一部として実施することができる。
色付きラベル118の色の分離方法としては、生体試料管116の撮像画像または展開図から色相、彩度、明度などの色分布を取得し両者を分離できる閾値を設定する方法が考えられるが、検出対象領域117の色は均一な溶液の場合にも、背面のラベル有無や生体試料管116表面の反射成分によって色差が生じることがあり、検出対象領域117の色差を色付きラベル118による色差として検出する誤検出が発生する。そこで、本フローチャートのラベルキャリブレーション処理やユーザ入力によって使用するラベルの情報をあらかじめ入力しておくことにより、検出対象領域117の色差を色付きラベル118として誤抽出することを回避し、色付きラベル118の除去精度を向上する効果がある。
(図10:ステップS1001:キャリブレータ2次元画像取得)
生体試料管情報取得部203は、固定カメラ101によって撮像されたキャリブレータの複数の2次元カラー画像を取得する。画像の取得方法はS401と同様である。
生体試料管情報取得部203は、固定カメラ101によって撮像されたキャリブレータの複数の2次元カラー画像を取得する。画像の取得方法はS401と同様である。
(図10:ステップS1002:展開図合成処理)
生体試料管情報取得部203は、図4の展開図合成処理と同じ処理を実行し、S1001で取得したキャリブレータの2次元カラー画像をもとに一枚の展開図を作成する。
生体試料管情報取得部203は、図4の展開図合成処理と同じ処理を実行し、S1001で取得したキャリブレータの2次元カラー画像をもとに一枚の展開図を作成する。
(図10:ステップS1003:色付きラベル抽出)
生体試料管情報取得部203は、S1002で出力する展開図の色分布をもとに色付きラベル118の領域を特定する。
生体試料管情報取得部203は、S1002で出力する展開図の色分布をもとに色付きラベル118の領域を特定する。
(図10:ステップS1003:色付きラベル抽出:具体例その1)
色付きラベル118領域の特定方法としては、色付きラベル118が貼付されていない空の生体試料管116の撮像画像から作成する展開図(リファレンス画像)と、キャリブレータの展開図の色分布とを比較し、両者の色差を色付きラベル118の色として抽出し、展開図から該当する色の領域を色付きラベル領域として特定する方法がある。
色付きラベル118領域の特定方法としては、色付きラベル118が貼付されていない空の生体試料管116の撮像画像から作成する展開図(リファレンス画像)と、キャリブレータの展開図の色分布とを比較し、両者の色差を色付きラベル118の色として抽出し、展開図から該当する色の領域を色付きラベル領域として特定する方法がある。
(図10:ステップS1003:色付きラベル抽出:具体例その2)
入出力インターフェース109などによってユーザがタッチパネルなどで色付きラベル118の色情報を入力し、該当する色をキャリブレータの展開図から抽出する方法もある。例えば、タッチパネルなどの画面に複数色のカラーパレットを表示し、ユーザが色付きラベル118の色を選択する。生体試料管情報取得部203は、事前にメモリ107あるいは記憶装置108などに格納しておくカラーパレットと対応する色閾値の情報を取得し、ユーザが選択したカラーパレットをもとに色付きラベル118の色閾値を設定する。取得した色閾値に該当する色を展開図から抽出し色付きラベル領域として特定する。あるいは、タッチパネルなどの画面にキャリブレータの展開図を表示し、ユーザが直接または画面上のカーソルなどを用いて色付きラベル118の領域を選択し特定してもよい。
入出力インターフェース109などによってユーザがタッチパネルなどで色付きラベル118の色情報を入力し、該当する色をキャリブレータの展開図から抽出する方法もある。例えば、タッチパネルなどの画面に複数色のカラーパレットを表示し、ユーザが色付きラベル118の色を選択する。生体試料管情報取得部203は、事前にメモリ107あるいは記憶装置108などに格納しておくカラーパレットと対応する色閾値の情報を取得し、ユーザが選択したカラーパレットをもとに色付きラベル118の色閾値を設定する。取得した色閾値に該当する色を展開図から抽出し色付きラベル領域として特定する。あるいは、タッチパネルなどの画面にキャリブレータの展開図を表示し、ユーザが直接または画面上のカーソルなどを用いて色付きラベル118の領域を選択し特定してもよい。
(図10:ステップS1004:色付きラベル色情報取得)
生体試料管情報取得部203は、ステップ902で特定した色付きラベル118の領域の色分布を取得し、取得した色情報をもとに色付きラベル118のラベル色を定義する色閾値を設定しメモリ107あるいは記憶装置108などに格納する。
生体試料管情報取得部203は、ステップ902で特定した色付きラベル118の領域の色分布を取得し、取得した色情報をもとに色付きラベル118のラベル色を定義する色閾値を設定しメモリ107あるいは記憶装置108などに格納する。
(図10:ステップS1004:色付きラベル色情報取得:具体例)
本ステップにおける閾値の設定方法としては、以下のような手順が挙げられる。例えば生体試料管情報取得部203は、ステップ902で特定した色付きラベル118の領域の色分布における色相、彩度、明度などのヒストグラムを取得し、それぞれの最頻値や平均値などを中心として例えば±5%の範囲を閾値として設定することができる。
本ステップにおける閾値の設定方法としては、以下のような手順が挙げられる。例えば生体試料管情報取得部203は、ステップ902で特定した色付きラベル118の領域の色分布における色相、彩度、明度などのヒストグラムを取得し、それぞれの最頻値や平均値などを中心として例えば±5%の範囲を閾値として設定することができる。
<実施の形態1:まとめ>
本実施形態1による生体検体解析装置100は、生体試料管回転機構によって生体試料管を回転させながら生体試料管の2次元カラー画像を取得し、複数の2次元カラー画像から一枚の展開図を合成する処理と、検体情報解析処理を実行する。展開図を合成する処理においては、所定領域設定処理と、2次元カラー画像切り出し処理と、2次元カラー画像切り出し処理と、切り出し画像連結処理を実行し、検体情報解析処理では、ラベル領域特定処理と、水平方向検出位置特定処理と、鉛直方向検出位置特定処理を実行する。このように、複数の2次元カラー画像から合成する展開図をもとにラベル領域を除去し検出対象領域(例えば血清領域)を抽出することにより、色付きラベルと検出対象領域とを高精度に分離して検出対象領域に含まれる液体を解析することが可能となる。
本実施形態1による生体検体解析装置100は、生体試料管回転機構によって生体試料管を回転させながら生体試料管の2次元カラー画像を取得し、複数の2次元カラー画像から一枚の展開図を合成する処理と、検体情報解析処理を実行する。展開図を合成する処理においては、所定領域設定処理と、2次元カラー画像切り出し処理と、2次元カラー画像切り出し処理と、切り出し画像連結処理を実行し、検体情報解析処理では、ラベル領域特定処理と、水平方向検出位置特定処理と、鉛直方向検出位置特定処理を実行する。このように、複数の2次元カラー画像から合成する展開図をもとにラベル領域を除去し検出対象領域(例えば血清領域)を抽出することにより、色付きラベルと検出対象領域とを高精度に分離して検出対象領域に含まれる液体を解析することが可能となる。
本実施形態1に係る生体検体解析装置100は、撮像画像に映り込む反射成分などのノイズを除去するように所定領域を切り出して合成する(図8参照)。さらには、生体試料管116の周方向に沿った明度値の変動が許容範囲内に収まっている部分を切り出し、その切り出し画像を連結することによって展開図を作成する(図7参照)。これにより、検体情報の解析精度の向上が期待できる。
本実施形態1に係る生体検体解析装置100は、ラベルなし生体試料管とラベル付き生体試料管を比較することにより、ラベルキャリブレーションを実施する。ラベルキャリブレーションによってあらかじめラベルの情報を取得し、取得した情報から色付きラベルの領域を特定し除去する。あらかじめラベルキャリブレーションを実施することにより、色付きラベルと検出対象領域を混同することがなくなるので、色付きラベルの色を検出対象の色と誤抽出する誤解析を回避でき、より正確な解析結果が得られることを期待することができる。
<実施の形態2>
図11は、本開示の実施形態2における展開図合成処理を示すフロー図である。本実施形態2においては、あらかじめ定めた所定領域をもとに撮像画像を切り出すのではなく、撮像画像ごとに撮像画像内の生体試料管116の傾きや画像中心からのずれを検出し、検出したずれを生体試料管116の回転軸とする(S1101)。検出した回転軸を基準として、所定領域を画像ごとに設定する(S1102~S1104)。展開図合成処理以外の構成は実施形態1と同様である。
図11は、本開示の実施形態2における展開図合成処理を示すフロー図である。本実施形態2においては、あらかじめ定めた所定領域をもとに撮像画像を切り出すのではなく、撮像画像ごとに撮像画像内の生体試料管116の傾きや画像中心からのずれを検出し、検出したずれを生体試料管116の回転軸とする(S1101)。検出した回転軸を基準として、所定領域を画像ごとに設定する(S1102~S1104)。展開図合成処理以外の構成は実施形態1と同様である。
図12は、生体試料管116の回転軸の例を示した図である。把持機構111によって把持され生体試料管回転機構114により回転される生体試料管116は、図12左のように画像中心と回転軸が一致する場合もあるが、図12中央のように横ずれすることや図12右のように回転軸が傾いたまま撮像されることがある。回転軸の特徴が測定間や装置間で一定にならない場合は、あらかじめ固定値により所定領域を設定するのではなく、生体試料管116の回転軸に基づき動的に所定領域を設定することにより、展開図の合成精度を向上する効果がある。
図13は、生体試料管116の回転軸検出処理(S1101)の例を示すフロー図である。領域設定部202は、本フローチャートにしたがって、生体試料管116の回転軸(回帰直線)検出処理を実行する。本フローチャートは、生体試料管116の左右対称性を利用し、撮像画像と撮像画像の反転画像のRGB空間における距離から生体試料管116の傾きと中心軸の位置ずれを検出する。
(図13:ステップS1301:2次元カラー画像取得)
領域設定部202は、固定カメラ101によって撮像された生体試料管116の2次元カラー画像を取得する。画像の取得方法はS401と同様である。
領域設定部202は、固定カメラ101によって撮像された生体試料管116の2次元カラー画像を取得する。画像の取得方法はS401と同様である。
(図13:ステップS1302:解析領域抽出処理)
領域設定部202は、ステップ1301で取得する2次元カラー画像から、解析領域を抽出する。生体試料管116の左右対称性を前提として解析するので、生体試料管116の撮像画像のうち、ラベルが貼付されていない領域を解析領域として抽出する。例えば、遠心分離後の血液検体であれば、生体試料管116の底付近の血餅が撮像された領域を選択する。解析領域サイズは例えば、水平方向幅を生体試料管116の径程度、鉛直方向の幅を50ピクセルなどと設定する。解析領域の設定値は、同じ検体の撮像であれば撮像画像ごとに変える必要はなく固定値でよいが、異なる長さの生体試料管116を測定する場合は、生体試料管116の長さに応じて解析領域を設定する必要がある。その際には、メモリ107あるいは記憶装置108などに複数の設定値を格納しておき、生体試料管情報取得部203で取得する生体試料管116の長さ情報などから設定値を変更できるようにする。
領域設定部202は、ステップ1301で取得する2次元カラー画像から、解析領域を抽出する。生体試料管116の左右対称性を前提として解析するので、生体試料管116の撮像画像のうち、ラベルが貼付されていない領域を解析領域として抽出する。例えば、遠心分離後の血液検体であれば、生体試料管116の底付近の血餅が撮像された領域を選択する。解析領域サイズは例えば、水平方向幅を生体試料管116の径程度、鉛直方向の幅を50ピクセルなどと設定する。解析領域の設定値は、同じ検体の撮像であれば撮像画像ごとに変える必要はなく固定値でよいが、異なる長さの生体試料管116を測定する場合は、生体試料管116の長さに応じて解析領域を設定する必要がある。その際には、メモリ107あるいは記憶装置108などに複数の設定値を格納しておき、生体試料管情報取得部203で取得する生体試料管116の長さ情報などから設定値を変更できるようにする。
(図13:ステップS1303:解析領域反転画像取得)
領域設定部202は、2次元カラー画像に設定する解析領域の左右反転画像を取得または生成する。
領域設定部202は、2次元カラー画像に設定する解析領域の左右反転画像を取得または生成する。
(図13:ステップS1304:RGB空間距離取得)
領域設定部202は、解析領域の画像と反転画像との間のRGB色空間の距離を解析領域の画素ごとに取得する。
領域設定部202は、解析領域の画像と反転画像との間のRGB色空間の距離を解析領域の画素ごとに取得する。
(図13:ステップS1305:RGB色空間距離最小座標抽出処理)
領域設定部202は、解析領域の鉛直方向座標ごとに、S1304で取得したRGB色空間の距離を比較し、鉛直方向座標ごとの最小値とその最小値が得られる座標を取得する。
領域設定部202は、解析領域の鉛直方向座標ごとに、S1304で取得したRGB色空間の距離を比較し、鉛直方向座標ごとの最小値とその最小値が得られる座標を取得する。
(図13:ステップS1306:回帰直線取得処理)
領域設定部202は、S1305で検出した最小値の座標を鉛直方向に連結することにより、解析領域の中心座標として抽出し、抽出した座標をもとに一次回帰直線を設定する。
領域設定部202は、S1305で検出した最小値の座標を鉛直方向に連結することにより、解析領域の中心座標として抽出し、抽出した座標をもとに一次回帰直線を設定する。
領域設定部202は、本フローチャートによって検出した回転軸をもとに所定領域を設定することにより、測定時に生体試料管116の回転軸が傾く場合や、横ずれする場合にも所望の領域を所定領域として設定できるので、展開図合成精度が向上する。
<実施の形態2:まとめ>
本実施形態2に係る生体検体解析装置100は、展開図合成処理において、生体試料管回転機構の回転速度情報や、生体試料管の傾きや横ずれの情報をもとに設定した所定領域を切り出して合成する。これにより、検体情報の解析に使用する展開図の合成精度の向上の向上が期待できる。
本実施形態2に係る生体検体解析装置100は、展開図合成処理において、生体試料管回転機構の回転速度情報や、生体試料管の傾きや横ずれの情報をもとに設定した所定領域を切り出して合成する。これにより、検体情報の解析に使用する展開図の合成精度の向上の向上が期待できる。
<実施の形態3>
図14は、本開示の実施形態3における展開図合成処理を示すフロー図である。本実施形態3は、展開図合成処理において、切り出した2次元カラー画像に対して曲率補正処理を実行後に画像を連結し展開図を出力する。曲率補正処理を実行することにより、例えば、図8のように所定領域の基準座標を生体試料管116の中心からずらした場合などにおいて、合成後の展開図の歪みを低減する効果がある。また、図8の例のように生体試料管116の中心領域に反射領域などのノイズがある場合にも、所定領域をずらして歪みのない展開図を取得可能になるので、検出対象領域117の解析精度を向上する効果がある。展開図合成処理以外の構成は実施形態1と同様である。
図14は、本開示の実施形態3における展開図合成処理を示すフロー図である。本実施形態3は、展開図合成処理において、切り出した2次元カラー画像に対して曲率補正処理を実行後に画像を連結し展開図を出力する。曲率補正処理を実行することにより、例えば、図8のように所定領域の基準座標を生体試料管116の中心からずらした場合などにおいて、合成後の展開図の歪みを低減する効果がある。また、図8の例のように生体試料管116の中心領域に反射領域などのノイズがある場合にも、所定領域をずらして歪みのない展開図を取得可能になるので、検出対象領域117の解析精度を向上する効果がある。展開図合成処理以外の構成は実施形態1と同様である。
S1401はS501に該当し、S1402はS502に該当し、S1404はS504に該当する。S1403において、領域設定部202は、生体試料管情報取得部203が取得する生体試料管116の径の情報とS1401で設定する所定領域の情報から、生体試料管116の曲率を考慮して補正用の係数を計算し、例えばアフィン変換などにより切り出し画像を補正する。
図15は、生体試料管116の曲率に起因して切り出し画像が歪んでいる例である。例えば図8において生体試料管116の中心からずらした領域に所定領域を設定し展開図を合成すると、色付きラベル118は図15左のように歪む場合がある。具体的には、生体試料管116の曲率を考慮せず長方形(短冊型)の領域を所定領域として切り出すと図15左のように合成後の画像に歪みが生じる。図15右は、図14のフローチャートにしたがって、切り出した所定領域の画像の歪み補正後に合成処した場合の色付きラベル118を示す。生体試料管116のサイズと形状(曲率)を考慮し、切り出した画像ごとに歪みを補正しておくことにより、合成後の展開図の歪みを低減する効果がある。
<実施の形態4>
図16は、本開示の実施形態4におけるS403の詳細処理を示すフロー図である。実施形態1のS403においては、検出対象領域117の色と領域のサイズの情報から検出対象の状態判別と液量測定をすることを説明した。本実施形態4においては、検出したラベルや色付きラベル118の情報から被験者や検体などの検査情報を取得する。その他の構成は実施形態1と同様である。
図16は、本開示の実施形態4におけるS403の詳細処理を示すフロー図である。実施形態1のS403においては、検出対象領域117の色と領域のサイズの情報から検出対象の状態判別と液量測定をすることを説明した。本実施形態4においては、検出したラベルや色付きラベル118の情報から被験者や検体などの検査情報を取得する。その他の構成は実施形態1と同様である。
ラベルや色付きラベル118から取得する情報としては、バーコードおよび色付き部の色情報がある。バーコードの情報は読み取り内容(例えばID番号など)と外部のホストサーバなどに格納してある被験者の情報と紐づけたデータベースにアクセスすることにより、被験者の情報等を本実施形態による生体検体解析装置で取得することが可能である。
また、例えば、生化学分析の種類や検体の種類(血清、全血、尿など)の情報などと色付きラベル118の色とを紐づけたデータベースを外部サーバもしくはメモリ107あるいは記憶装置108に格納しておくことで、取得した色付きラベル118の色情報から分析内容や検体の種類を取得することが可能である。
本実施形態による生体検体解析装置100は、メモリ107あるいは記憶装置108に生体試料の種別に対応する色情報を事前に格納しておき、取得した検出対象領域117の色情報とメモリ705等にあらかじめ格納している色情報とを解析部304によって照合することにより、生体試料の種別を判別する。このとき、検体種類ごとに照合するデータを格納しておき、色付きラベル118の色情報をもとに取得した検体の種類から照合するデータを選択することにより、複数種類の生体試料の解析が可能になる。
<本開示の変形例について>
本開示は、前述した実施形態に限定されるものではなく、様々な変形例が含まれる。例えば、上記した実施形態は本発明を分かりやすく説明するために詳細に説明したものであり、必ずしも説明した全ての構成を備えるものに限定されるものではない。また、ある実施形態の構成の一部を他の実施形態の構成に置き換えることが可能であり、また、ある実施形態の構成に他の実施形態の構成を加えることも可能である。また、各実施形態の構成の一部について、他の構成の追加・削除・置換をすることが可能である。
本開示は、前述した実施形態に限定されるものではなく、様々な変形例が含まれる。例えば、上記した実施形態は本発明を分かりやすく説明するために詳細に説明したものであり、必ずしも説明した全ての構成を備えるものに限定されるものではない。また、ある実施形態の構成の一部を他の実施形態の構成に置き換えることが可能であり、また、ある実施形態の構成に他の実施形態の構成を加えることも可能である。また、各実施形態の構成の一部について、他の構成の追加・削除・置換をすることが可能である。
以上の実施形態において、S501によって切り出し領域を決定した後、ユーザ指定によって切り出し領域の座標やサイズを変更してもよい。具体的には、ユーザインターフェースを介してユーザが切り出し領域の座標やサイズを指定し、コントローラ106はその指定にしたがって切り出し領域を設定する。
本開示の実施形態の機能は、ソフトウェアのプログラムコードによっても実現できる。この場合、プログラムコードを記録した記憶媒体をシステム或は装置に提供し、そのシステム或は装置のコンピュータ(又はCPUやMPU)が記憶媒体に格納されたプログラムコードを読み出す。この場合、記憶媒体から読み出されたプログラムコード自体が前述した実施形態の機能を実現することになり、そのプログラムコード自体、及びそれを記憶した記憶媒体は本開示を構成することになる。このようなプログラムコードを供給するための記憶媒体としては、例えば、フレキシブルディスク、CD-ROM、DVD-ROM、ハードディスク、光ディスク、光磁気ディスク、CD-R、磁気テープ、不揮発性のメモリカード、ROMなどが用いられる。
また、プログラムコードの指示に基づき、コンピュータ上で稼動しているOS(オペレーティングシステム)などが実際の処理の一部又は全部を行い、その処理によって前述した実施の形態の機能が実現されるようにしてもよい。さらに、記憶媒体から読み出されたプログラムコードが、コンピュータ上のメモリに書きこまれた後、そのプログラムコードの指示に基づき、コンピュータのCPUなどが実際の処理の一部又は全部を行い、その処理によって前述した実施の形態の機能が実現されるようにしてもよい。
さらに、実施の形態の機能を実現するソフトウェアのプログラムコードを、ネットワークを介して配信することにより、それをシステム又は装置のハードディスクやメモリ等の記憶手段又はCD-RW、CD-R等の記憶媒体に格納し、使用時にそのシステム又は装置のコンピュータ(又はCPUやMPU)が当該記憶手段や当該記憶媒体に格納されたプログラムコードを読み出して実行するようにしてもよい。
上述の実施形態において、制御線や情報線は説明上必要と考えられるものを示しており、製品上必ずしも全ての制御線や情報線を示しているとは限らない。全ての構成が相互に接続されていてもよい。
100 生体検体解析装置
101 固定カメラ
102 背景版
103aおよび103b 光源
104aおよび104b 光源用ドライバ
105 生体試料管ホルダ
106 コントローラ
107 メモリ
108 記憶装置
109 入出力インターフェース
110 データバス
111 把持機構
112 移動機構
113 上下制御ドライバ
114 生体試料管回転機構
115 回転制御ドライバ
116 生体試料管
117 検出対象領域
118 色付きラベル
201 画像処理部
202 領域設定部
203 生体試料管情報取得部
301 領域切り出し部
302 展開図合成部
303 検出対象領域抽出部
304 解析部
101 固定カメラ
102 背景版
103aおよび103b 光源
104aおよび104b 光源用ドライバ
105 生体試料管ホルダ
106 コントローラ
107 メモリ
108 記憶装置
109 入出力インターフェース
110 データバス
111 把持機構
112 移動機構
113 上下制御ドライバ
114 生体試料管回転機構
115 回転制御ドライバ
116 生体試料管
117 検出対象領域
118 色付きラベル
201 画像処理部
202 領域設定部
203 生体試料管情報取得部
301 領域切り出し部
302 展開図合成部
303 検出対象領域抽出部
304 解析部
Claims (15)
- ラベルが貼付された生体試料管に収容された生体検体を分析する生体検体解析装置であって、
前記生体試料管を把持して回転させる回転機構、
前記生体試料管を撮像することにより2次元カラー画像を取得するカメラ、
前記2次元カラー画像を処理するプロセッサ、
を備え、
前記プロセッサは、前記2次元カラー画像のなかの部分領域を切り出し、
前記プロセッサは、前記切り出した部分領域の画像を、前記生体試料管の周方向に沿って連結することにより、前記生体試料管の展開図を合成し、
前記プロセッサは、前記2次元カラー画像のうち検出対象とする検出対象領域を、前記展開図から抽出する
ことを特徴とする生体検体解析装置。 - 前記プロセッサは、前記ラベルの画像の特徴を表す情報に基づき、前記2次元カラー画像のなかに含まれる前記ラベルの画像を識別し、
前記プロセッサは、前記2次元カラー画像のうち前記識別した前記ラベルの画像を除いた部分から、前記検出対象領域を抽出する
ことを特徴とする請求項1記載の生体検体解析装置。 - 前記プロセッサは、前記ラベルの画像の特徴を表す情報として、前記ラベルを貼付した前記生体試料管の前記2次元カラー画像と前記ラベルを貼付していない前記生体試料管の前記2次元カラー画像とを比較することにより得られる情報を用いる
ことを特徴とする請求項2記載の生体検体解析装置。 - 前記生体検体解析装置はさらに、前記ラベルの色、前記ラベルの位置、前記ラベルの形状、または前記ラベルのサイズのうち少なくともいずれかを指定する指示入力を受け取るインターフェースを備え、
前記プロセッサは、前記インターフェースが受け取った前記指示入力にしたがって、前記ラベルの画像の特徴を表す情報を決定する
ことを特徴とする請求項2記載の生体検体解析装置。 - 前記生体検体解析装置はさらに、前記ラベルの色、前記ラベルの位置、前記ラベルの形状、または前記ラベルのサイズのうち少なくともいずれかを記述したデータを格納する記憶装置を備え、
前記プロセッサは、前記ラベルの画像の特徴を表す情報として、前記記憶装置が格納している前記データが記述している情報を用いる
ことを特徴とする請求項2記載の生体検体解析装置。 - 前記プロセッサは、前記2次元カラー画像のうち、前記生体試料管の周方向に沿った明度値の変動が所定範囲内に収まっている部位を、前記部分領域として切り出すことにより、前記展開図における明度値の分散を許容範囲内に収める
ことを特徴とする請求項1記載の生体検体解析装置。 - 前記生体検体解析装置はさらに、前記生体試料管に対して光を照射する光源を備え、
前記プロセッサは、前記光源が照射した光が前記生体試料管の表面において反射することにより生じた反射光ノイズのノイズ量が許容閾値以下である部位を、前記部分領域として切り出す
ことを特徴とする請求項1記載の生体検体解析装置。 - 前記プロセッサは、前記回転機構の回転速度、前記2次元カラー画像の撮像タイミング、および前記2次元カラー画像の撮像枚数を制御する
ことを特徴とする請求項1記載の生体検体解析装置。 - 前記プロセッサは、前記検出対象領域の色を前記展開図から取得し、
前記プロセッサは、前記取得した前記検出対象領域の色と、前記生体検体の色を記述したデータとを比較することにより、前記検出対象領域に含まれる前記生体検体の種別を特定し、その特定した種別を出力する
ことを特徴とする請求項1記載の生体検体解析装置。 - 前記プロセッサは、前記検出対象領域の座標、前記検出対象領域の画素数、および前記生体試料管のサイズを記述した情報を用いて、前記検出対象領域に含まれる前記生体検体の量を算出する
ことを特徴とする請求項1記載の生体検体解析装置。 - 前記プロセッサは、前記回転機構が前記生体試料管を回転させるときの回転軸の位置を、前記2次元カラー画像において検出し、
前記プロセッサは、前記検出した回転軸に対して直交する方向を、前記生体試料管の周方向として用いることにより、前記部分領域として切り出す領域を特定する
ことを特徴とする請求項1記載の生体検体解析装置。 - 前記プロセッサは、前記2次元カラー画像を左右反転させた反転画像を生成し、
前記プロセッサは、前記2次元カラー画像と前記反転画像との間の色空間における距離を算出し、
前記プロセッサは、前記距離が最小である座標を鉛直方向に沿って連結することにより、前記回転軸を特定する
ことを特徴とする請求項11記載の生体検体解析装置。 - 前記プロセッサは、前記生体試料管の曲率を用いて前記2次元カラー画像の歪みを補正し、
前記プロセッサは、前記歪みを補正した前記2次元カラー画像を用いて、前記展開図を合成する
ことを特徴とする請求項1記載の生体検体解析装置。 - 前記生体検体解析装置はさらに、前記部分領域の位置とサイズを指定する指示入力を受け取るインターフェースを備え、
前記プロセッサは、前記インターフェースが受け取った前記指示入力にしたがって、前記部分領域の位置とサイズを決定する
ことを特徴とする請求項1記載の生体検体解析装置。 - 前記プロセッサは、前記2次元カラー画像のなかに含まれる前記ラベルの画像を識別し、
前記プロセッサは、前記生体検体の属性を記述した情報を、前記識別したラベルの画像から抽出することにより、前記生体検体の属性を特定し、その特定した属性にしたがって前記生体検体を解析する
ことを特徴とする請求項1記載の生体検体解析装置。
Priority Applications (3)
| Application Number | Priority Date | Filing Date | Title |
|---|---|---|---|
| CN202180019979.5A CN115280158B (zh) | 2020-04-09 | 2021-02-08 | 生物体检体解析装置 |
| US17/913,565 US12299947B2 (en) | 2020-04-09 | 2021-02-08 | Biological sample analysis device |
| EP21784514.8A EP4134677B1 (en) | 2020-04-09 | 2021-02-08 | Biological sample analysis device |
Applications Claiming Priority (2)
| Application Number | Priority Date | Filing Date | Title |
|---|---|---|---|
| JP2020-070213 | 2020-04-09 | ||
| JP2020070213A JP7436270B2 (ja) | 2020-04-09 | 2020-04-09 | 生体検体解析装置 |
Publications (1)
| Publication Number | Publication Date |
|---|---|
| WO2021205737A1 true WO2021205737A1 (ja) | 2021-10-14 |
Family
ID=78023638
Family Applications (1)
| Application Number | Title | Priority Date | Filing Date |
|---|---|---|---|
| PCT/JP2021/004491 Ceased WO2021205737A1 (ja) | 2020-04-09 | 2021-02-08 | 生体検体解析装置 |
Country Status (5)
| Country | Link |
|---|---|
| US (1) | US12299947B2 (ja) |
| EP (1) | EP4134677B1 (ja) |
| JP (1) | JP7436270B2 (ja) |
| CN (1) | CN115280158B (ja) |
| WO (1) | WO2021205737A1 (ja) |
Cited By (1)
| Publication number | Priority date | Publication date | Assignee | Title |
|---|---|---|---|---|
| WO2025062968A1 (ja) * | 2023-09-22 | 2025-03-27 | 株式会社日立ハイテク | 試料状態判定装置、試料状態判定方法、および試料分析システム |
Families Citing this family (3)
| Publication number | Priority date | Publication date | Assignee | Title |
|---|---|---|---|---|
| CN113933294B (zh) * | 2021-11-08 | 2023-07-18 | 中国联合网络通信集团有限公司 | 浓度检测方法及装置 |
| JP2024002211A (ja) * | 2022-06-23 | 2024-01-11 | 株式会社日立ハイテク | 試料状態判定装置、試料状態判定方法及び試料検査装置 |
| CN120214346A (zh) * | 2023-12-25 | 2025-06-27 | 深圳迈瑞生物医疗电子股份有限公司 | 样本分析系统和样本信息显示方法 |
Citations (3)
| Publication number | Priority date | Publication date | Assignee | Title |
|---|---|---|---|---|
| US20110102542A1 (en) * | 2009-11-03 | 2011-05-05 | Jadak, Llc | System and Method For Panoramic Image Stitching |
| JP2015014506A (ja) * | 2013-07-04 | 2015-01-22 | 株式会社日立ハイテクノロジーズ | 検出装置および生体試料分析装置 |
| WO2018202804A1 (en) * | 2017-05-05 | 2018-11-08 | Ares Trading S.A. | Method and apparatus for determining information about a drug-containing vessel |
Family Cites Families (19)
| Publication number | Priority date | Publication date | Assignee | Title |
|---|---|---|---|---|
| DE19518409C1 (de) * | 1995-05-19 | 1996-10-02 | Bosch Gmbh Robert | Verfahren zur akustischen Fehlererkennung |
| JP2000162045A (ja) * | 1998-11-26 | 2000-06-16 | Niigata Eng Co Ltd | 光透過性物体の色識別方法 |
| CA2325263A1 (en) * | 1999-11-11 | 2001-05-11 | Gretag Imaging Trading Ag | Optimization apparatus for photographic image data |
| JP3733087B2 (ja) * | 2002-07-04 | 2006-01-11 | アロカ株式会社 | 検体分析装置 |
| CN101057135B (zh) * | 2004-11-12 | 2011-01-12 | 株式会社岛津制作所 | X射线ct系统及x射线ct方法 |
| US8075853B2 (en) * | 2007-11-16 | 2011-12-13 | Rohm Co., Ltd. | Microchip |
| US8170271B2 (en) * | 2008-06-25 | 2012-05-01 | Jadak Llc | System and method for test tube and cap identification |
| US7982201B2 (en) * | 2009-09-08 | 2011-07-19 | Jadak, Llc | System and method for detection of liquid level in a vessel |
| JP5330313B2 (ja) * | 2010-05-24 | 2013-10-30 | 株式会社日立ハイテクノロジーズ | 生体試料の分析装置 |
| JP5474903B2 (ja) * | 2011-09-28 | 2014-04-16 | あおい精機株式会社 | 検査前処理装置、検査前処理方法、及び検体処理装置 |
| KR101325054B1 (ko) * | 2011-10-19 | 2013-11-20 | 유인성 | 형광 영상을 촬영하는 장치 및 방법 |
| WO2013070755A2 (en) * | 2011-11-07 | 2013-05-16 | Beckman Coulter, Inc. | Centrifuge system and workflow |
| WO2014160275A2 (en) * | 2013-03-14 | 2014-10-02 | Battell Memorial Institute | Biomarkers for liver fibrosis |
| JP6282060B2 (ja) | 2013-08-20 | 2018-02-21 | 株式会社日立ハイテクノロジーズ | 検体検査自動化システム |
| US9313371B2 (en) * | 2014-03-24 | 2016-04-12 | Fuji Xerox Co., Ltd. | Image processing apparatus, image processing method and non-transitory computer readable medium for eliminating a specific color in an image |
| JP6453564B2 (ja) * | 2014-06-25 | 2019-01-16 | 株式会社日立ハイテクノロジーズ | 検出装置 |
| JP6628612B2 (ja) * | 2016-01-13 | 2020-01-15 | 株式会社日立ソリューションズ | 画像処理システム、及び画像処理方法 |
| WO2017205778A1 (en) * | 2016-05-27 | 2017-11-30 | Biomerieux, Inc. | Method and apparatus for detection of foam in specimen containers |
| JP2018096740A (ja) * | 2016-12-09 | 2018-06-21 | 株式会社日立ハイテクノロジーズ | 生体試料分析装置 |
-
2020
- 2020-04-09 JP JP2020070213A patent/JP7436270B2/ja active Active
-
2021
- 2021-02-08 US US17/913,565 patent/US12299947B2/en active Active
- 2021-02-08 CN CN202180019979.5A patent/CN115280158B/zh active Active
- 2021-02-08 EP EP21784514.8A patent/EP4134677B1/en active Active
- 2021-02-08 WO PCT/JP2021/004491 patent/WO2021205737A1/ja not_active Ceased
Patent Citations (3)
| Publication number | Priority date | Publication date | Assignee | Title |
|---|---|---|---|---|
| US20110102542A1 (en) * | 2009-11-03 | 2011-05-05 | Jadak, Llc | System and Method For Panoramic Image Stitching |
| JP2015014506A (ja) * | 2013-07-04 | 2015-01-22 | 株式会社日立ハイテクノロジーズ | 検出装置および生体試料分析装置 |
| WO2018202804A1 (en) * | 2017-05-05 | 2018-11-08 | Ares Trading S.A. | Method and apparatus for determining information about a drug-containing vessel |
Non-Patent Citations (1)
| Title |
|---|
| See also references of EP4134677A4 * |
Cited By (1)
| Publication number | Priority date | Publication date | Assignee | Title |
|---|---|---|---|---|
| WO2025062968A1 (ja) * | 2023-09-22 | 2025-03-27 | 株式会社日立ハイテク | 試料状態判定装置、試料状態判定方法、および試料分析システム |
Also Published As
| Publication number | Publication date |
|---|---|
| JP2021167733A (ja) | 2021-10-21 |
| CN115280158B (zh) | 2025-12-23 |
| EP4134677A1 (en) | 2023-02-15 |
| JP7436270B2 (ja) | 2024-02-21 |
| CN115280158A (zh) | 2022-11-01 |
| EP4134677B1 (en) | 2026-05-06 |
| EP4134677A4 (en) | 2024-03-20 |
| US12299947B2 (en) | 2025-05-13 |
| US20230097384A1 (en) | 2023-03-30 |
Similar Documents
| Publication | Publication Date | Title |
|---|---|---|
| WO2021205737A1 (ja) | 生体検体解析装置 | |
| JP7071301B2 (ja) | 生体試料検出装置 | |
| CN111985292A (zh) | 用于图像处理结果的显微镜方法、显微镜和具有验证算法的计算机程序 | |
| JP6453564B2 (ja) | 検出装置 | |
| JP4633712B2 (ja) | 画像形成装置 | |
| JP6422824B2 (ja) | 検体前処理方法及び検体前処理装置 | |
| US12481146B2 (en) | Sample image capturing system and method, and computer-readable storage medium | |
| EP2898449B1 (en) | Method and system for detecting 2d barcode in a circular label | |
| JP4271054B2 (ja) | 細胞画像解析装置 | |
| CN114585926B (zh) | 标识管组件类型的设备和方法 | |
| JP2007298444A (ja) | 分析装置 | |
| CN116824236A (zh) | 多形态免疫标记产品的检测结果识别方法、装置及介质 | |
| WO2023248789A1 (ja) | 試料状態判定装置、試料状態判定方法及び試料検査装置 | |
| CN113406042A (zh) | 用于确定体外诊断系统中样品容器的特性的方法、分析装置和体外诊断系统 | |
| EP4579680A1 (en) | Sample analysis system and sample information display method | |
| CN114858795A (zh) | 样本图像获取系统、样本图像获取方法及可读存储介质 | |
| JP2009103492A (ja) | 血液分析装置およびプログラム | |
| WO2025117967A1 (en) | Generating quantitative ground truth for ihc stained slides | |
| HK40068330A (en) | Apparatus and methods of identifying tube assembly type |
Legal Events
| Date | Code | Title | Description |
|---|---|---|---|
| 121 | Ep: the epo has been informed by wipo that ep was designated in this application |
Ref document number: 21784514 Country of ref document: EP Kind code of ref document: A1 |
|
| NENP | Non-entry into the national phase |
Ref country code: DE |
|
| ENP | Entry into the national phase |
Ref document number: 2021784514 Country of ref document: EP Effective date: 20221109 |
|
| WWG | Wipo information: grant in national office |
Ref document number: 17913565 Country of ref document: US |