WO2021215151A1 - 検出装置および検出方法 - Google Patents
検出装置および検出方法 Download PDFInfo
- Publication number
- WO2021215151A1 WO2021215151A1 PCT/JP2021/010948 JP2021010948W WO2021215151A1 WO 2021215151 A1 WO2021215151 A1 WO 2021215151A1 JP 2021010948 W JP2021010948 W JP 2021010948W WO 2021215151 A1 WO2021215151 A1 WO 2021215151A1
- Authority
- WO
- WIPO (PCT)
- Prior art keywords
- frequency band
- delay time
- measurement signal
- mode
- frequency
- Prior art date
- Legal status (The legal status is an assumption and is not a legal conclusion. Google has not performed a legal analysis and makes no representation as to the accuracy of the status listed.)
- Ceased
Links
Images


Classifications
-
- G—PHYSICS
- G01—MEASURING; TESTING
- G01N—INVESTIGATING OR ANALYSING MATERIALS BY DETERMINING THEIR CHEMICAL OR PHYSICAL PROPERTIES
- G01N22/00—Investigating or analysing materials by the use of microwaves or radio waves, i.e. electromagnetic waves with a wavelength of one millimetre or more
- G01N22/04—Investigating moisture content
-
- G—PHYSICS
- G01—MEASURING; TESTING
- G01N—INVESTIGATING OR ANALYSING MATERIALS BY DETERMINING THEIR CHEMICAL OR PHYSICAL PROPERTIES
- G01N33/00—Investigating or analysing materials by specific methods not covered by groups G01N1/00 - G01N31/00
- G01N33/24—Earth materials
- G01N33/245—Earth materials for agricultural purposes
-
- G—PHYSICS
- G01—MEASURING; TESTING
- G01R—MEASURING ELECTRIC VARIABLES; MEASURING MAGNETIC VARIABLES
- G01R27/00—Arrangements for measuring resistance, reactance, impedance, or electric characteristics derived therefrom
- G01R27/02—Measuring real or complex resistance, reactance, impedance, or other two-pole characteristics derived therefrom, e.g. time constant
- G01R27/26—Measuring inductance or capacitance; Measuring quality factor, e.g. by using the resonance method; Measuring loss factor; Measuring dielectric constants ; Measuring impedance or related variables
- G01R27/2617—Measuring dielectric properties, e.g. constants
- G01R27/2623—Measuring-systems or electronic circuits
-
- G—PHYSICS
- G01—MEASURING; TESTING
- G01R—MEASURING ELECTRIC VARIABLES; MEASURING MAGNETIC VARIABLES
- G01R27/00—Arrangements for measuring resistance, reactance, impedance, or electric characteristics derived therefrom
- G01R27/02—Measuring real or complex resistance, reactance, impedance, or other two-pole characteristics derived therefrom, e.g. time constant
- G01R27/26—Measuring inductance or capacitance; Measuring quality factor, e.g. by using the resonance method; Measuring loss factor; Measuring dielectric constants ; Measuring impedance or related variables
- G01R27/2617—Measuring dielectric properties, e.g. constants
- G01R27/2635—Sample holders, electrodes or excitation arrangements, e.g. sensors or measuring cells
- G01R27/2676—Probes
-
- G—PHYSICS
- G01—MEASURING; TESTING
- G01R—MEASURING ELECTRIC VARIABLES; MEASURING MAGNETIC VARIABLES
- G01R29/00—Arrangements for measuring or indicating electric quantities not covered by groups G01R19/00 - G01R27/00
- G01R29/08—Measuring electromagnetic field characteristics
- G01R29/0864—Measuring electromagnetic field characteristics characterised by constructional or functional features
- G01R29/0878—Sensors; antennas; probes; detectors
-
- G—PHYSICS
- G01—MEASURING; TESTING
- G01S—RADIO DIRECTION-FINDING; RADIO NAVIGATION; DETERMINING DISTANCE OR VELOCITY BY USE OF RADIO WAVES; LOCATING OR PRESENCE-DETECTING BY USE OF THE REFLECTION OR RERADIATION OF RADIO WAVES; ANALOGOUS ARRANGEMENTS USING OTHER WAVES
- G01S7/00—Details of systems according to groups G01S13/00, G01S15/00, G01S17/00
- G01S7/48—Details of systems according to groups G01S13/00, G01S15/00, G01S17/00 of systems according to group G01S17/00
- G01S7/491—Details of non-pulse systems
- G01S7/4912—Receivers
- G01S7/4915—Time delay measurement, e.g. operational details for pixel components; Phase measurement
-
- G—PHYSICS
- G01—MEASURING; TESTING
- G01N—INVESTIGATING OR ANALYSING MATERIALS BY DETERMINING THEIR CHEMICAL OR PHYSICAL PROPERTIES
- G01N2223/00—Investigating materials by wave or particle radiation
- G01N2223/60—Specific applications or type of materials
- G01N2223/66—Specific applications or type of materials multiple steps inspection, e.g. coarse/fine
Definitions
- This disclosure relates to a detection device and a detection method.
- the moisture sensor that measures the amount of moisture in the medium may use the FDR (Frequency Domain Refractometry) method.
- the FDR method is a method of transmitting an electromagnetic wave along a metal probe embedded in a medium and calculating the amount of water in the medium from the relative permittivity measured based on the reflection response thereof.
- the moisture sensor using the FDR method sweeps over a wide band frequency in order to measure the accurate moisture content. Therefore, the conventional moisture sensor requires a long measurement time and a large power consumption.
- a battery-powered device such as a mobile terminal or an IoT (internet of Things) device
- the measurement time and power consumption are directly linked to the battery life. Therefore, it is desired to reduce the measurement time and the power consumption.
- the purpose of this technique is to provide an inspection device and an inspection method capable of suppressing measurement time and power consumption.
- the inspection device on one aspect of the present disclosure includes a first probe having a first antenna portion for transmission, a second probe having a second antenna portion for reception facing the first probe at a predetermined distance, and the like.
- a measurement unit that measures a measurement signal including information on the propagation characteristics of electromagnetic waves in the medium between the first and second antenna units, and a calculation unit that calculates the characteristic information of the medium based on the feature amount obtained from the measurement signal.
- the measuring unit measures the measurement signal in the first frequency band of the electromagnetic wave propagating in the medium, and the calculation unit is based on the first feature quantity obtained from the measurement signal in the first frequency band.
- the measuring unit measures the measurement signal in the second frequency band, which is a part of the first frequency band of the electromagnetic wave, and the arithmetic unit obtains it from the measurement signal in the second frequency band.
- the characteristic information of the medium is calculated based on the second feature amount to be obtained.
- the calculation unit In the first mode, the calculation unit generates information on the relationship between the first feature amount and the partial feature amount based on the partial feature amount obtained from the measurement signal in the second frequency band among the measurement signals in the first frequency band. , In the second mode, the calculation unit may calculate the characteristic information of the medium by applying the second feature amount to the relational information.
- the second frequency band may be a band including the peak frequency at which the intensity of the measurement signal is maximized in the first frequency band.
- the measuring unit may measure the electromagnetic wave at the first frequency interval, and in the second mode, the measuring unit may measure the electromagnetic wave at the second frequency interval wider than the first frequency interval.
- the width of the second frequency band may be substantially equal to the width of the first frequency band.
- the second frequency band may be a specific frequency within the first frequency band.
- the feature amount may be the propagation delay time of the electromagnetic wave between the first and second antenna portions, the shape of the frequency characteristic of the electromagnetic wave, or the waveform of the propagation delay time obtained based on the frequency characteristic of the electromagnetic wave.
- the feature amount may be the phase or amplitude of the electromagnetic wave at a specific frequency.
- the calculation unit is a delay time calculation unit that calculates the propagation delay time of electromagnetic waves between the first and second probes as a feature amount based on the measurement signal, and the relative permittivity of the medium as characteristic information based on the propagation delay time.
- a relative permittivity calculation unit for calculation, a water content calculation unit for calculating the water content in the medium based on the relative permittivity, and a relational information generation unit for generating relational information may be provided.
- the arithmetic unit calculates the first propagation delay time based on the measurement signal in the first frequency band, and the partial delay time obtained from the measurement signal in the second frequency band among the measurement signals in the first frequency band. Is calculated, the relational information is generated using the first propagation delay time and the partial delay time, and in the second mode, the calculation unit calculates the second propagation delay time based on the measurement signal in the second frequency band.
- a correction delay time is generated by converting the second propagation delay time into the propagation delay time of the first frequency band, and the correction delay time is used to generate the relative dielectric constant of the medium and the relative dielectric constant of the medium. The amount of water in the medium may be calculated.
- a mode switching unit for switching between the first mode and the second mode may be further provided.
- the upper limit of the measurement signal level in the first frequency band is higher than the upper limit of the measurement signal level in the measurement signals in the other frequency bands, and the first antenna portion is the second frequency band in the second frequency band.
- the level of the measurement signal may be higher than that of the other frequency bands in one frequency band.
- the inspection method of one aspect of the present disclosure includes a first probe having a first antenna portion for transmission, a second probe having a second antenna portion for reception facing the first probe at a predetermined distance, and a second probe.
- a measurement unit that measures a measurement signal that includes information about the propagation characteristics of electromagnetic waves in the medium between the first and second antenna units, and a calculation unit that calculates the characteristic information of the medium based on the feature amount obtained from the measurement signal.
- the measurement signal of the electromagnetic wave propagating in the medium in the first frequency band is measured, and the arithmetic unit uses the measurement signal in the first frequency band to measure the measurement signal.
- the characteristic information of the medium is calculated based on the obtained first feature amount, and in the second mode, the measurement signal in the second frequency band, which is a part of the first frequency band of the electromagnetic wave, is measured, and the calculation unit uses the second frequency band. It is provided to calculate the characteristic information of the medium based on the second feature amount obtained from the measurement signal of.
- the calculation unit In the first mode, the calculation unit generates information on the relationship between the first feature amount and the partial feature amount based on the partial feature amount obtained from the measurement signal in the second frequency band among the measurement signals in the first frequency band. , In the second mode, the calculation unit may calculate the characteristic information of the medium by applying the second feature amount to the relational information.
- the second frequency band may be a band including the peak frequency at which the intensity of the measurement signal is maximized in the first frequency band.
- the measuring unit may measure the electromagnetic wave at the first frequency interval, and in the second mode, the measuring unit may measure the electromagnetic wave at the second frequency interval wider than the first frequency interval.
- the width of the second frequency band may be substantially equal to the width of the first frequency band.
- the second frequency band may be a specific frequency within the first frequency band.
- the feature amount may be the propagation delay time of the electromagnetic wave between the first and second antenna portions, the shape of the frequency characteristic of the electromagnetic wave, or the waveform of the propagation delay time obtained based on the frequency characteristic of the electromagnetic wave.
- the feature amount may be the phase or amplitude of the electromagnetic wave at a specific frequency.
- the arithmetic unit calculates the first propagation delay time based on the measurement signal in the first frequency band, and the partial delay time obtained from the measurement signal in the second frequency band among the measurement signals in the first frequency band. Is calculated, the relational information is generated using the first propagation delay time and the partial delay time, and in the second mode, the calculation unit calculates the second propagation delay time based on the measurement signal in the second frequency band.
- a correction delay time is generated by converting the second propagation delay time into the propagation delay time of the first frequency band, and the correction delay time is used to generate the relative dielectric constant of the medium and the relative dielectric constant of the medium. The amount of water in the medium may be calculated.
- the upper limit of the measurement signal level in the first frequency band is higher than the upper limit of the measurement signal level in the other frequency bands, and the first antenna portion is the first frequency band in the second frequency band.
- the level of the measurement signal may be higher than that of other frequency bands.
- the schematic block diagram of the measuring apparatus provided with the moisture content measuring sensor which concerns on embodiment.
- the block diagram which shows the structure of the water content measurement sensor.
- the block diagram which shows the structure of the measuring unit.
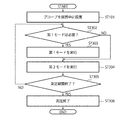
- the flowchart explaining the method of measuring the water content of the 1st mode and the method of generating the relational information.
- the figure which shows the 1st propagation delay time The figure which shows the level of the measurement signal of the electromagnetic wave in the 2nd frequency band.
- the figure which shows the partial delay time The graph which shows the relationship between the 1st propagation delay time and a partial delay time.
- the flowchart explaining the water content measuring method of the 2nd mode The figure which shows the signal level at the time of transmission of the electromagnetic wave in the 2nd frequency band.
- the graph which shows the other modification of the 2nd frequency band. The graph which shows the further modification example of the 2nd frequency band.
- the graph which shows the further modification example of the 2nd frequency band. The graph which shows the further modification example of the 2nd frequency band.
- the figure which shows the further modification example of the 2nd frequency band. The figure which shows the shape of the frequency characteristic of a measurement signal.
- the schematic diagram which shows the modification of the probe The schematic diagram which shows the structural example of the tip part of the probe of this modification.
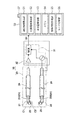
- FIG. 1 is a schematic configuration diagram of a measuring device including a water content measuring sensor according to an embodiment.
- FIG. 2 is a block diagram showing a configuration of a water content measurement sensor.
- the measuring device 100 of the present embodiment includes a water content measuring sensor device (hereinafter, sensor device) 10 and a signal processing unit 50.
- sensor device a water content measuring sensor device
- signal processing unit 50 a signal processing unit 50.
- the sensor device 10 acquires the electromagnetic wave propagation characteristics of the medium (soil) M and generates the measurement signal S1 used for calculating the relative permittivity of the medium M.
- the signal processing unit 50 receives the measurement signal S1 from the sensor device 10 and calculates the amount of water in the medium M based on the measurement signal S1.
- the sensor device 10 has a sensor head 20 and a measurement unit 30.
- the sensor head 20 has a transmitting probe 21 (first probe) and a receiving probe 22 (second probe).
- the sensor head 20 is arranged in a medium M such as soil, and antenna units 210 and 220 (first antenna unit, capable of transmitting and receiving electromagnetic wave EW of a predetermined frequency between transmission and reception probes 21 and 22). It has a second antenna unit).
- the transmitting probe 21 and the receiving probe 22 are embedded in the medium M in a substantially vertical posture so as to face each other at a distance D.
- the transmitting probe 21 and the receiving probe 22 are composed of a coaxial cable having a core wire portion C1 and a shield portion C2.
- the thickness and length of the cable are not particularly limited, and may be any thickness and length. For example, by setting the thickness (diameter) of the cable to 2 mm to 6 mm, it becomes easy to insert the cable into the soil.
- the core wire portion C1 is made of a copper wire and the shield portion C2 is made of a copper pipe, but the shield portion C2 may be made of a mesh body of a copper wire.
- the outer surface of the shield portion C2 is covered with a protective layer made of an insulating material, although not shown.
- the transmission probe 21 is connected to the output terminal 34 (see FIG. 3) of the measurement unit 30 and transmits a transmission signal from the measurement unit 30 to the antenna unit 210.
- the antenna portion 210 is provided at or near the tip end portion (termination portion) of the transmission probe 21 and transmits the electromagnetic wave EW corresponding to the transmission signal to the reception probe 22.
- the receiving probe 22 is connected to the input terminal 35 (see FIG. 3) of the measuring unit 30, receives the electromagnetic wave EW at the antenna unit 220, and inputs the received signal to the measuring unit 30.
- the antenna portion 220 is provided at or near the tip portion (terminal portion) of the receiving probe 22 so as to face the antenna portion 210 of the transmitting probe 21.
- the antenna portions 210 and 220 are not limited to the case where they are provided at the tip portions of the probes 21 and 22, and may be provided at any position such as the central position of the probes 21 and 22.
- the antenna portions 210 and 220 are for locally transmitting and receiving electromagnetic wave EW at predetermined positions of the probes 21 and 22, and are typically small antennas formed in a size that does not resonate the probes 21 and 22. It is composed. As a result, it is possible to suppress a decrease in measurement accuracy due to resonance of the probes 21 and 22.
- the antenna portions 210 and 220 include an opening H provided in a part of the shield portion C2. That is, the probes 21 and 22 are composed of a leaky coaxial antenna having antenna portions 210 and 220 as radio wave leakage portions.
- the opening H has an opening shape such as a rectangle, a circle, an ellipse, or an oval, and in the present embodiment, the opening H is formed in an oval shape having a long axis in the longitudinal direction of the probes 21 and 22.
- the long axis of the opening H can be appropriately set according to the wavelength of the electromagnetic wave EW used. For example, when the wavelength of the electromagnetic wave EW is 1 GHz to 9 GHz, the length of the long axis of the opening H is about 5 mm to 15 mm.
- the transmitting probe 21 and the receiving probe 22 each have a terminating resistor 23.
- the terminating resistor 23 is electrically connected between the terminal portion of the core wire portion C1 and the shield portion C2. This prevents unwanted reflection of transmitted and received signals at the probe termination.
- the tips of the transmitting probe 21 and the receiving probe 22 are covered with an electromagnetic wave transmitting protective member (not shown) that covers the antenna portions 210 and 220.
- the transmitting probe 21 and the receiving probe 22 further have a sleeve 24 containing an electromagnetic wave absorber.
- the sleeve 24 covers the outer peripheral surfaces of the probes 21 and 22 around the antenna portions 210 and 220 (openings H) to suppress leakage of transmitted / received signals from regions other than the openings H.
- Ferrite is mainly used as the electromagnetic wave absorber constituting the sleeve 24, but the present invention is not limited to this, and other high magnetic permeability materials such as sendust and permalloy may be used depending on the frequency of the electromagnetic wave EW and the like.
- the sleeve 24 may be omitted if necessary, or may be provided only on one of the probes 21 and 22.
- the size of the distance D between the transmitting probe 21 and the receiving probe 22 is not particularly limited, and is, for example, 20 mm to 100 mm. If the distance D is larger than 100 mm, the attenuation of the electromagnetic wave EW propagating in the medium M becomes large, and there is a possibility that sufficient reception intensity cannot be obtained. On the other hand, if the distance D is smaller than 20 mm, it is technically difficult to observe. Further, when the distance D becomes short, it is greatly affected by the voids formed in the vicinity of the probes 21 and 22, and there is a possibility that the correct relative permittivity or water content cannot be measured.
- the void is an air layer formed between the medium M and the periphery of the probes 21 and 22, and when the probes 21 and 22 are embedded in the medium M from the surface thereof, or when the probes 21 and 22 are embedded in the medium M. It is formed when you move it with. As will be described later, in order to accurately measure the relative permittivity or the amount of water in the medium M, it is preferable that the size of the gap (thickness of the air layer) is small, but typically, a gap of about 1 mm is formed. May occur.
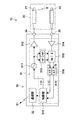
- FIG. 3 is a block diagram showing the configuration of the measurement unit.
- the measurement unit 30 has a signal generation unit 31 and a communication unit 32.
- the measuring unit 30 typically comprises a network analyzer.
- the signal generation unit 31 includes a control unit 310, a signal generator 311, a phase shifter 313, a mixer 315, and the like.
- the signal generation unit 31 generates the measurement signal S1 including information on the propagation characteristics of the electromagnetic wave EW in the medium M between the antenna unit 210 of the transmission probe 21 and the antenna unit 220 of the reception probe 22.
- the control unit 310 is composed of a computer having a CPU (Central Processing Unit), a memory, and the like, and controls each unit of the measurement unit 30 including the signal generator 311 and the communication unit 32.
- CPU Central Processing Unit
- the control unit 310 controls each unit of the measurement unit 30 including the signal generator 311 and the communication unit 32.
- the signal generator 311 generates a transmission signal F having a predetermined frequency and inputs it to the transmission probe 21 via the amplifier 312 and the output terminal 34. Although the signal generator 311 generates a pulse wave (pulse signal) as the transmission signal F, the signal generator 311 may be configured to generate a continuous wave as the transmission signal F.
- the signal generator 311 may have a frequency sweep function of the transmission signal F. In this case, the signal generator 311 generates, for example, a transmission signal F of 1 GHz to 9 GHz based on the command of the control unit 310.
- the phase shifter 313 separates the transmission signal F into two signals having 90 degrees out of phase and inputs them to the mixer 315.
- the mixer 315 mixes the received signal input from the receiving probe 22 via the input terminal 35 and the amplifier 314 with the two signals output from the phase shifter 313, and mixes the two response signals (I) orthogonal to each other. Signal / Q signal). These response signals are converted from analog signals to digital signals via the AD converter 316 and generated as the measurement signal S1 by the control unit 310.
- the phase shifter 313 and the mixer 315 constitute a detector that orthogonally detects (IQ detection) the output of the receiving probe 22.
- the sum of squares of the I and Q signals corresponds to the strength of the received signal
- the square root of the sum of squares of the I and Q signals corresponds to the amplitude of the received signal
- the inverse tangent of the I and Q signals corresponds to the phase.
- the communication unit 32 is composed of a communication module including a communication antenna and the like.
- the communication unit 32 is for wirelessly transmitting the measurement signal S1 from the sensor device 10 to the signal processing unit 50.
- the measurement signal S1 can be provided to the signal processing unit 50 arranged at a location different from the observation location.
- the sensor device 10 may be connected to the signal processing unit 50 via a wiring cable or the like.
- the signal processing unit 50 as a calculation unit includes a delay time calculation unit 51, a relative permittivity calculation unit 52, a water content calculation unit 53, a memory 54, a relationship information generation unit 55, and a mode switching unit 56.
- the signal processing unit 50 obtains a feature amount such as a propagation delay time of the electromagnetic wave EW based on the measurement signal S1 transmitted from the sensor device 10 (measurement unit 30), and further, the moisture content in the medium M is obtained from the feature amount. It consists of an information processing device that calculates characteristic information such as quantity.
- the information processing device can be realized by hardware elements used in a computer such as a CPU, RAM (RandomAccessMemory), ROM (ReadOnlyMemory), and necessary software. Even if PLD (Programmable Logic Device) such as FPGA (Field Programmable Gate Array), DSP (Digital Signal Processor), or other ASIC (Application Specific Integrated Circuit) is used in place of or in addition to the CPU. good.
- PLD Programmable Logic Device
- FPGA Field Programmable Gate Array
- DSP Digital Signal Processor
- ASIC Application Specific Integrated Circuit
- the delay time calculation unit 51, the relative permittivity calculation unit 52, the water content calculation unit 53, the relationship information generation unit 55, and the mode switching unit 56 as functional blocks It is composed.
- the memory 54 is configured by the RAM or the like of the signal processing unit 50.
- dedicated hardware such as an IC (integrated circuit) may be used.
- the program is installed in the signal processing unit 50, for example, via various recording media. Alternatively, the program may be installed via the Internet or the like.
- the delay time calculation unit 51 calculates the propagation delay time of the electromagnetic wave EW between the transmission probe 21 (antenna unit 210) and the reception probe 22 (antenna unit 220) as a feature amount based on the measurement signal S1. It is composed.
- the propagation delay time of the electromagnetic wave EW means the difference between the propagation time of the electromagnetic wave EW in the air and the propagation time of the electromagnetic wave in the medium M.
- the propagation delay time of an electromagnetic wave depends on the relative permittivity of the transmission path, and the propagation delay time is proportional to the square root of the relative permittivity of the medium.
- the relative permittivity of the soil itself is about 1 to 10, and changes depending on the water content. Therefore, if the propagation delay time can be measured, the amount of water in the medium M can be indirectly measured.
- the method of calculating the propagation delay time is not particularly limited, and in the present embodiment, the measurement signal S1 is subjected to an inverse Fourier transform (inverse FFT) to obtain an impulse response, and the pulse delay time is calculated from the peak position. By subtracting the transmission time (cable transmission time) of the probes 21 and 22 from the pulse delay time, the propagation delay time of the electromagnetic wave EW is calculated.
- inverse FFT inverse Fourier transform
- the relative permittivity calculation unit 52 is configured to calculate the relative permittivity of the medium M as characteristic information of the medium M based on the propagation delay time of the electromagnetic wave EW calculated by the delay time calculation unit 51.
- the relative permittivity of water is typically 80.
- the water content calculation unit 53 is configured to calculate the water content in the medium M based on the relative permittivity calculated by the relative permittivity calculation unit 52. For the calculation of the water content, for example, Topp's formula is used (described later), and the volume water content [%] of the medium M is calculated as the water content. Alternatively, the water content calculation unit 53 may directly calculate the water content from the propagation delay time of the electromagnetic wave EW without obtaining the relative permittivity.
- the relational information generation unit 55 uses the measurement signal of a certain frequency band (first frequency band) to obtain the propagation delay time DL11 and the measurement signal of a part of the frequency band (second frequency band) of the first frequency band.
- the relationship information with the partial delay time DL12 obtained by using is generated.
- the relationship information may be a function or a correspondence table showing the relationship between the propagation delay time DL11 and the partial delay time DL12. This relationship information is stored in the memory 54.
- the mode switching units 56 and 57 switch between the first mode and the second mode, which will be described later.
- the measurement unit 30 measures the measurement signal in the first frequency band of the electromagnetic wave EW propagating in the medium M. That is, the measurement unit 30 measures the measurement signal of the electromagnetic wave EW propagating in the medium M while changing the frequency of the electromagnetic wave EW at predetermined intervals (first frequency intervals) within the first frequency band.
- the signal processing unit 50 calculates the relative permittivity and the water content of the medium M based on the first propagation delay time (first feature amount) DL11 obtained from the measurement signal in the first frequency band.
- the signal processing unit 50 extracts a portion of the measurement signal in the second frequency band used in the second mode from the measurement signals obtained in the first mode, and a partial delay time (part) from the portion of the measurement signal.
- Feature amount) DL12 is obtained.
- the second frequency band is a part of the frequency band in the first frequency band or a specific frequency in the first frequency band.
- the second frequency band may be a band including the peak frequency at which the measurement signal has the maximum intensity in the first frequency band in order to accurately detect the measurement signal.
- the signal processing unit 50 obtains the relational information (for example, the relational expression or the correspondence table) between the first propagation delay time DL11 and the partial delay time DL12. The generation of related information will be described later. Further, as will be described later, the feature amount is not limited to the propagation delay time.
- the measurement unit 30 measures the measurement signal in the second frequency band of the electromagnetic wave EW propagating in the medium M.
- the signal processing unit 50 calculates the relative permittivity and the water content of the medium M based on the second propagation delay time DL22 obtained from the measurement signal in the second frequency band.
- the signal processing unit 50 calculates the correction delay time DL 21 by applying the second propagation delay time DL 22 obtained in the second mode to the relational information calculated in the first mode. For example, when the relational information is a relational expression showing the relationship between the first propagation delay time DL11 and the partial delay time DL12, the signal processing unit 50 uses the second propagation delay time DL22 obtained in the second mode.
- the first propagation delay time DL11 obtained in this way is referred to as the correction delay time DL21.
- This correction delay time DL21 corresponds to the propagation delay time obtained by using the first frequency band. That is, the signal processing unit 50 can convert (correct) to the propagation delay time (DL21) of the first frequency band by applying the second propagation delay time DL22 to the above relational expression. The signal processing unit 50 calculates the relative permittivity or the water content using the correction delay time DL21 corrected in this way.
- the signal processing unit 50 refers to the correspondence table and obtains the second propagation in the second mode.
- the delay time DL22 may be converted to the correction delay time DL21.
- the signal processing unit 50 searches the correspondence table for the partial delay time DL12 equal to or closest to the second propagation delay time DL22, and corrects the first propagation delay time DL11 corresponding to the partial delay time DL12. And it is sufficient.
- the signal processing unit 50 may perform interpolation using a plurality of partial delay times DL12 adjacent to the second propagation delay time DL22, and use the first propagation delay time DL11 corresponding to the interpolated value as the correction delay time DL21. good.
- the signal processing unit 50 generates the relationship information between the first propagation delay time DL11 in the first frequency band and the partial delay time DL12 in the second frequency band in the first mode.
- the signal processing unit 50 converts the second propagation delay time DL22 in the second frequency band into the propagation delay time (correction delay time DL21) in the first frequency band by applying the second propagation delay time DL22 to the above-mentioned related information.
- the propagation delay time of the first frequency band can be estimated while using the second frequency band which is a part of the first frequency band.
- the signal processing unit 50 calculates the relative permittivity or the water content using the correction delay time DL21.
- the mode switching units 56 and 57 are switches for switching between the first mode and the second mode.
- the mode switching unit 56 is, for example, a switch function (software) provided in the signal processing unit 50.
- the mode switching unit 57 is, for example, a physical switch provided in the housing of the sensor device 10.
- the mode switching unit 56 is used when the mode switching is automatically executed inside the signal processing unit 50.
- the mode switching unit 57 is used when the user arbitrarily executes mode switching.
- the sensor device 10 may include both mode switching units 56 and 57, or may include either one.
- the signal processing unit 50 further includes a communication unit configured to be able to communicate with the communication unit 32 of the measurement unit 30, and a display unit capable of displaying information on the propagation delay time, relative permittivity, water content, etc. calculated by each functional block. Etc. may be provided.
- the measurement unit 30 measures the electromagnetic wave EW in a relatively wide first frequency band, so that the resolution is high and the water content can be calculated accurately.
- the measurement unit 30 measures the electromagnetic wave EW in the second frequency band, which is a part of the first frequency band, so that the time required is relatively short and the power consumption is small.
- the resolution is low and it is difficult to calculate the accurate water content.
- the relational information is generated in the first mode in order to obtain the relational information, and then the measurement is executed using the relational information in the second mode.
- the first mode requires a relatively long time and a large amount of power consumption, but in the subsequent second mode, the measurement can be repeated in a short time and with low power consumption.
- the signal processing unit 50 uses the relational information obtained in the first frequency band of the wide band to correct the second propagation delay time DL22, which corresponds to the propagation delay time of the first frequency band. Converting to time DL21. Therefore, the measurement by the inspection device according to the present embodiment can be performed in a short time and with low power consumption, and a relatively accurate water content comparable to the measurement in the first frequency band can be obtained.
- FIG. 4 is a flowchart illustrating a method of measuring the amount of water in the first mode and a method of generating related information.
- FIG. 5A is a diagram showing a signal level at the time of transmission of the electromagnetic wave EW in the first frequency band.
- FIG. 5B is a diagram showing the level of the measurement signal of the electromagnetic wave EW in the first frequency band.
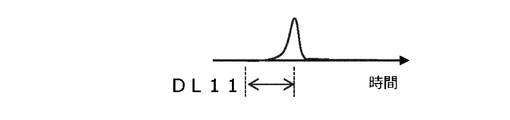
- FIG. 5C is a diagram showing the first propagation delay time DL11.
- FIG. 5D is a diagram showing the level of the measurement signal of the electromagnetic wave EW in the second frequency band.
- FIG. 5E is a diagram showing a partial delay time DL12.
- the transmitting probe 21 and the receiving probe 22 are embedded in the soil M (step 101).
- the facing distance D between the transmitting probe 21 and the receiving probe 22 is, for example, 50 mm.
- the electromagnetic wave EW is transmitted and received between the transmitting probe 21 (antenna unit 210) and the receiving antenna (antenna unit 220) (step 102).
- the measurement unit 30 changes the frequency of the transmission signal F (n) input to the transmission probe 21 in 50 MHz steps, and changes the frequency of the reception signal output from the reception probe 22 to the orthogonal frequency response signal (I (I).
- the measurement signal S1 including the n) signal and the Q (n) signal) is generated.
- the measurement unit 30 sweeps by changing the frequency of the electromagnetic wave EW in the first frequency band FB1 every 10 MHz step.
- the measurement signal S1 in the first frequency band FB1 is obtained.
- the measurement signal S1 is transmitted to the signal processing unit 50.
- the signal processing unit 50 calculates the first propagation delay time DL11 of the electromagnetic wave EW between the transmission probe 21 and the reception probe 22 based on the measurement signal S1 (step). 103).
- the delay time calculation unit 51 calculates the first propagation delay time DL11 using the measurement signal S1 of the first frequency band FB1.
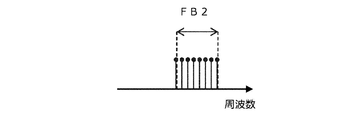
- the delay time calculation unit 51 extracts the measurement signal of the second frequency band FB2, which is a part of the first frequency band FB1, as shown in FIG. 5D, and as shown in FIG. 5E, the second frequency band FB2.
- the partial delay time DL12 is calculated using the measurement signal of.
- the delay time calculation unit 51 uses the measurement signal S1 in the first mode to generate the first propagation delay time DL11 and the partial delay time DL12.
- the second frequency band FB2 may be a partial frequency band of the measurement signal S1 in the first mode, which has a small propagation loss and can obtain a large signal strength. Since the second frequency band FB2 is set to a frequency band with less propagation loss, the measurement unit 30 can reliably detect the measurement signal S2 of the second frequency band FB2 in the second mode. Further, the SN ratio (Signal-to-Noise ratio) of the measurement signal S2 in the second mode is improved. Therefore, it also leads to suppressing the power of the transmission signal in the second mode.
- the calculation method of the propagation delay time, the relative permittivity of the medium M, and the water content is as follows.
- the first propagation delay time DL11 is calculated using the first frequency band FB1 of the measurement signal S1
- the partial delay time DL12 is calculated using the second frequency band FB2 of the measurement signal S1.
- the delay time calculation unit 51 performs an inverse Fourier transform (IFFT) on the received signal by fast Fourier transform, using the I (n) signal as the real part and the Q (n) signal as the imaginary part, and obtains the impulse response h ( ⁇ ).
- IFFT inverse Fourier transform
- the signal processing unit 50 sets the propagation delay time DL11 or DL12 to ⁇ delay [s], the speed of light to c [m / s], and the distance between probes (D) to d [m].
- the relative permittivity ⁇ r of the medium M is calculated (step 104).
- ⁇ delay d ⁇ ⁇ ( ⁇ r ) / c (Equation 3)
- the signal processing unit 50 calculates the water content (volume water content) ⁇ [%] in the medium M from the Topp equation (step 105).
- ⁇ -5.3 x 10 -2 +2.92 x 10 -2 ⁇ r -5.5 x 10 -4 ⁇ r 2 +4.3 x 10⁻⁶ ⁇ r 3 (Equation 4)
- the relative permittivity and the water content of the propagation delay times DL11, DL12 and the medium M can be calculated using the above equations 1 to 4.
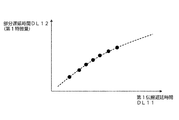
- the signal processing unit 50 (relationship information generation unit 55) generates relational information between the first propagation delay time DL11 and the partial delay time DL12 (step 106).
- FIG. 6 is a graph showing the relationship between the first propagation delay time DL11 and the partial delay time DL12.
- a graph as shown in FIG. 6 is obtained.
- the relational expression may be a linear function or a quadratic or higher function.
- the relational expression is stored in the memory 54.
- the relationship information may be a correspondence table showing the relationship between the first propagation delay time DL11 and the partial delay time DL12.
- the first propagation delay time DL11 is calculated using the measurement signal of the wideband first frequency band FB1, and the relative permittivity of the medium M and the medium M are calculated using the first propagation delay time DL11.
- the volume moisture content (moisture content) inside is calculated.
- the relationship information between the first propagation delay time DL11 of the first frequency band FB1 and the partial delay time DL12 of the second frequency band FB2 is generated.
- FIG. 7 is a flowchart illustrating a method for measuring the amount of water in the second mode.
- FIG. 8A is a diagram showing a signal level at the time of transmission of the electromagnetic wave EW in the second frequency band.
- FIG. 8B is a diagram showing the level of the measurement signal of the electromagnetic wave EW in the second frequency band.
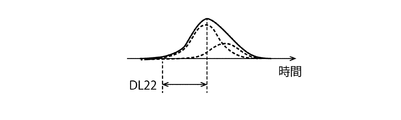
- FIG. 8C is a diagram showing the second propagation delay time DL22.
- FIG. 8D is a diagram showing a correction delay time DL21.
- step 101 is executed.
- the transmitting probe 21 and the receiving probe 22 are embedded in the soil M.
- the electromagnetic wave EW is transmitted / received between the transmitting probe 21 (antenna unit 210) and the receiving antenna (antenna unit 220) (step 202).
- the measurement unit 30 sweeps by changing the frequency of the electromagnetic wave EW in the second frequency band FB2 every 50 MHz step.
- the measurement signal S2 of the second frequency band FB2 is obtained.
- the measurement signal S2 is transmitted to the signal processing unit 50.
- the delay time calculation unit 51 calculates the second propagation delay time DL22 of the electromagnetic wave EW between the transmission probe 21 and the reception probe 22 based on the measurement signal S2 ((). Step 203).
- the second propagation delay time DL22 may be calculated using the above equations 1 and 2 in the same manner as the propagation delay times DL11 and DL12.
- the second propagation delay time DL22 is calculated using the measurement signal S2 of the second frequency band FB2.
- the delay time calculation unit 51 calculates the correction delay time DL21 by applying the second propagation delay time DL22 to the relational information obtained in the first mode (step 204). For example, the delay time calculation unit 51 calculates the correction delay time DL 21 by substituting the second propagation delay time DL 22 into the partial delay time DL 12 of the above relational expression.
- the correction delay time DL 21 corresponds to the first propagation delay time DL 11 when the second propagation delay time DL 22 is substituted for the partial delay time DL 12. Therefore, the correction delay time DL 21 is a propagation delay time obtained by correcting the second propagation delay time DL 22 so as to correspond to the propagation delay time of the first frequency band. Therefore, although the correction delay time DL21 is calculated using the measurement signal S2 in the second frequency band, it is corrected to a relatively accurate propagation delay time.
- the delay time calculation unit 51 obtains the partial delay time DL12 equal to or closest to the second propagation delay time DL22 from the correspondence table. Search for. Then, the delay time calculation unit 51 may set the first propagation delay time DL11 corresponding to the partial delay time DL12 hit in the search as the correction delay time DL21. Alternatively, the delay time calculation unit 51 interpolates using a plurality of partial delay times DL12 adjacent to the second propagation delay time DL 22, and sets the first propagation delay time DL 11 corresponding to the interpolated value as the correction delay time DL 21. May be good. In this way, the delay time calculation unit 51 converts the second propagation delay time DL 22 into the correction delay time DL 21 by using the relational information.
- the signal processing unit 50 executes steps 104 and 105 using the correction delay time DL21.
- the water content ⁇ [%] in the medium M is calculated.
- the sensor device 10 in the first mode, the sensor device 10 according to the present embodiment generates the relationship information between the first propagation delay time DL11 and the partial delay time DL12 by using the electromagnetic wave EW of the first frequency band in a relatively wide area. After that, in the second mode, the sensor device 10 measures the second propagation delay time DL22 using the electromagnetic wave EW of the second frequency band, which is a part of the first frequency band, and obtains the relational information obtained in the first mode. The second propagation delay time DL22 is corrected to the correction delay time DL21.
- the first mode initially requires a relatively long time and a large amount of power consumption, but in the subsequent second mode, the measurement can be repeated in a short time and with low power consumption.
- the signal processing unit 50 uses the relational information obtained in the first frequency band of the wide band to correct the second propagation delay time DL22, which corresponds to the propagation delay time of the first frequency band. Converting to time DL21. Therefore, the measurement by the inspection device according to the present embodiment can be performed in a short time and with low power consumption, and a relatively accurate water content comparable to the measurement in the first frequency band can be obtained.
- FIG. 9 is a flow chart showing an example of the overall operation of the sensor device in actual measurement.
- the transmitting probe 21 and the receiving probe 22 are embedded in the soil M (step 101).
- the signal processing unit 50 determines whether or not it is necessary to execute the first mode (step 302). For example, when the relational information has not been set yet, the second mode is executed a predetermined number of times after the relational information is set, or a predetermined time has elapsed since the relational information was set, the signal processing unit 50 may perform the signal processing unit 50. , It is determined that the execution of the first mode is necessary (YES in step 302). In this case, the sensor device 10 executes the measurement in the first mode (step 303). As a result, related information can be obtained. Further, the relative permittivity and the water content of the medium M according to the first mode can be obtained.
- the sensor device 10 executes the measurement in the second mode (step 304). Thereby, the relative permittivity and the water content of the medium M according to the second mode can also be obtained.
- Steps 302 to 304 are repeatedly executed during a predetermined measurement period (NO in step 305). When the measurement period ends (YES in step 305), the measurement ends (step 306). When the measurement is completed, the user removes the probes 21 and 22 of the sensor device 10 from the medium M.
- the relational information once set in the first mode may be used repeatedly in the second mode thereafter. Therefore, after the relational information is generated in the first mode, the sensor device 10 can detect the water content in the second mode in a short time and with low power consumption with relatively high accuracy.
- the related information may be updated periodically or arbitrarily as needed.
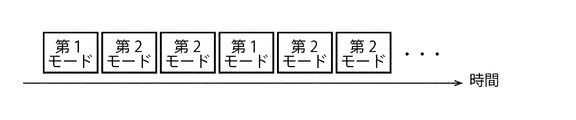
- the sensor device 10 may execute the first mode once for every n (n ⁇ 1) times of executing the second mode.
- 10A and 10B are diagrams showing an example of execution cycles of the first and second modes.
- the execution frequency of the first mode may be set by the software of the mode switching unit 56.
- the first mode may be executed periodically at predetermined intervals.
- the signal processing unit 50 may measure the time after the execution of the first mode with a timer (not shown).
- the user may optionally switch between the first mode and the second mode. In this case, the user may arbitrarily set the mode with the mode switching unit 57, that is, the physical switch.
- the first mode may be executed only at the time of manufacturing the sensor device 10.
- the sensor device 10 measures only in the second mode.
- the sensor device 10 may execute the first mode in the first measurement, and after setting the relational information, measure only in the second mode.
- the first mode needs to be performed first, but if there is no change in the environment after that, it may be hardly performed. However, it is preferable that the first mode is periodically performed at regular intervals in order to improve the measurement accuracy.
- the measurement unit 30 may be provided with an environment sensor 39 such as a temperature sensor, and the first mode may be executed in response to a change in the environment. For example, when the environment sensor 39 measures the temperature or air temperature of the medium M and the temperature changes by 3 ° C. or more, the sensor device 10 may execute the first mode and update the related information.
- the second frequency band FB2 is a band including a peak frequency at which the intensity of the measurement signal S1 of the first frequency band FB1 is maximized, and is narrower than the first frequency band FB1.
- the level of the transmission signal F of the electromagnetic wave EW may have an upper limit set depending on the frequency.
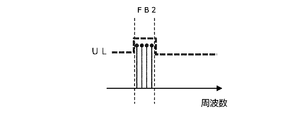
- FIGS. 11A to 11C are graphs showing a modification of the second frequency band.
- FIG. 11A shows the transmission signal F in the second mode.
- An upper limit UL is set for the transmission signal level.
- the upper limit UL for example, an ISM (Industry Science and Medical) band (2.4 GHz band) may be set.
- the second frequency band FB2 may be set to a frequency band in which the upper limit UL of the transmission signal level is higher than the upper limit UL of other frequency bands.
- the antenna unit 210 can transmit a transmission signal at a level (output) higher than the upper limit UL of the other frequency band in the second frequency band FB2.
- the measurement unit 30 can receive the measurement signal S2 at a higher level than the measurement signals in the other frequency bands in the second frequency band FB2.
- the measurement unit 30 can accurately detect the measurement signal S2 even in a noisy environment. Since the signal processing unit 50 calculates the second propagation delay time DL22 and the correction delay time DL21 using the frequency band having a high signal level, it is less susceptible to noise and can accurately detect the water content.
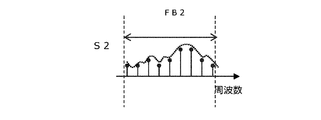
- FIG. 12A to 12C are graphs showing other variations of the second frequency band.
- a measurement frequency is intermittently selected from the first frequency band FB1, and the selected measurement frequency is designated as the second frequency band FB2. That is, the width of the second frequency band FB2 is substantially equal to the width of the first frequency band FB1, but has a measurement frequency intermittently with respect to the first frequency band FB1.
- the measurement unit 30 executes the measurement in the second mode at a measurement interval (second frequency interval) wider than the measurement interval (first frequency interval) in the first mode.
- the sensor device 10 can detect the amount of water in a short time and with low power consumption.
- the width of the second frequency band FB2 is substantially equal to the width of the first frequency band FB1, the water content can be detected relatively accurately even in the second mode.
- FIG. 13A to 13C are graphs showing still other variations of the second frequency band.
- the second frequency band FB2 is one specific frequency in the first frequency band FB1.
- the measurement unit 30 executes the measurement at a specific frequency in the second mode.
- the sensor device 10 can detect the amount of water in a very short time and with very low power consumption.
- the amplitude difference ⁇ W or the phase difference ⁇ shown in FIG. 13C may be used as the feature amount.
- the amplitude difference ⁇ W indicates the difference (amplitude attenuation width) between the level of the transmission signal F in FIG. 13A and the level of the measurement signal S2 shown in FIG. 13B.
- the phase difference ⁇ indicates the phase delay of the level of the measurement signal S2 with respect to the transmission signal F.
- the relational information generation unit 55 may generate the relational information using the amplitude difference or the phase difference at the specific frequency of the measurement signal S1 as the first feature amount instead of the partial delay time DL12. Therefore, the vertical axis of FIG. 6 is the amplitude difference or phase difference of the measurement signal S1 at a specific frequency. That is, in this modification, the relational information is a relational expression or a correspondence table between the amplitude difference or the phase difference and the first propagation delay time DL11.
- the signal processing unit 50 calculates the propagation delay time DL21 of the medium M by applying the amplitude difference ⁇ W or the phase difference ⁇ of the measurement signal of the specific frequency as the second feature amount to this relational information. ..
- the feature amount may be the amplitude difference or the phase difference of the measurement signal at a specific frequency.
- the specific frequency As for the specific frequency, the higher the frequency, the larger the phase difference ⁇ with respect to the propagation delay time. Therefore, in order to improve the measurement accuracy, it is preferable that the specific frequency is a high frequency. On the other hand, since the phase difference ⁇ may rotate by 360 degrees or more, if the specific frequency is high, measurement may not be possible. Therefore, it is preferable to use a plurality of specific frequencies for the second frequency band FB2. As a result, it is possible to suppress a situation in which measurement becomes impossible due to phase rotation. Alternatively, both the amplitude difference and the phase difference of the measurement signal at a specific frequency may be used as the feature amount.
- the feature amount is not limited to the propagation delay time, and may be an amplitude difference or a phase difference. Further, the feature amount may be the shape of the frequency characteristic of the measurement signal S2 and the time waveform of the propagation delay time.
- FIG. 14A is a diagram showing the frequency characteristics of the measurement signal S1.
- FIG. 14B is a diagram showing a first propagation delay time DL11 obtained from the measurement signal S1.
- the signal processing unit 50 extracts the characteristic of the second frequency band FB2 from the frequency characteristics of FIG. 14A, associates it with the first propagation delay time DL11, and stores it in the memory 54.
- each time steps 102 to 105 are repeated, the relationship information between the characteristics of the second frequency band FB2 and the first propagation delay time DL11 is stored.
- a plurality of relationship information is stored in the memory 54.
- the signal processing unit 50 In the second mode, when the signal processing unit 50 acquires the measurement signal S2 in the second frequency band FB2, the signal processing unit 50 searches for related information having characteristics close to the waveform of the measurement signal S2. Then, the signal processing unit 50 obtains the first propagation delay time DL11 from the relational information hit by the search. The signal processing unit 50 may calculate the relative permittivity and the water content of the medium M using the first propagation delay time DL11 obtained from the related information as the correction delay time DL21. In this modification, in the second mode, the signal processing unit 50 does not need to calculate the second propagation delay time DL22. Therefore, the load on the signal processing unit 50 can be reduced.
- FIG. 15A is a diagram showing a time waveform of a partial delay time DL12, as in FIG. 5E.
- FIG. 15B is a diagram showing a time waveform of the first propagation delay time DL11, similarly to FIG. 5C.
- the signal processing unit 50 stores the time waveform of the partial delay time DL12 of FIG. 15A in the memory 54 in association with the first propagation delay time DL11.
- each time steps 102 to 105 are repeated, the relationship information between the waveform of the partial delay time DL12 and the first propagation delay time DL11 is stored.
- a plurality of relationship information is stored in the memory 54.
- the signal processing unit 50 obtains the time waveform of the partial delay time DL22 from the measurement signal S2 of the second frequency band FB2, and searches for the relational information having a waveform close to the time waveform of the partial delay time DL22. .. Then, the signal processing unit 50 obtains the first propagation delay time DL11 from the relational information hit by the search.
- the signal processing unit 50 may calculate the relative permittivity and the water content of the medium M using the first propagation delay time DL11 obtained from the related information as the correction delay time DL21.
- the sensor device 10 may use the shape of the frequency characteristic of the measurement signal S2 or the time waveform of the propagation delay time as the feature quantity.
- FIG. 16A is a graph showing an example of the first propagation delay time DL11 in the first mode.
- FIG. 16B is a graph showing an example of the second propagation delay time DL22 in the second mode.
- the resolution of the first mode is relatively high. Therefore, as shown in FIG. 16A, a plurality of peaks appear in the first propagation delay time DL11. In this case, the multipath can be clearly discriminated, and the waveforms of each path can be easily separated.
- the second propagation delay time DL22 deviates to some extent from the propagation delay time of the main path.
- the signal processing unit 50 calculates the first propagation delay time DL11 of the main path in the multipath.
- the signal processing unit 50 extracts the portion of the measurement signal in the second frequency band from the measurement signal S1 in a state including the influence of multipath, and calculates the partial delay time DL12.
- the relationship information is derived by executing step 106.
- the relational information indicates the relationship between the first propagation delay time DL11 including the influence of only the main system path and the partial delay time DL12 including the influence of the multipath.
- the signal processing unit 50 calculates the correction delay time DL21 in consideration of only the main system path by using the relational information even if the second propagation delay time DL22 includes the influence of multipath. Can be done.
- the sensor device 10 according to the present embodiment can eliminate the influence of multipath and separately obtain the correction delay time DL21 of the main path.
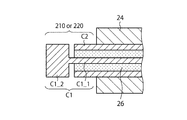
- FIG. 17 is a schematic view showing a modified example of the probes 21 and 22.
- FIG. 18 is a schematic view showing a configuration example of the tip portion of the probe 21 or 22 of this modified example.
- the transmitting probe 21 and the receiving probe 22 are composed of a coaxial cable having a core wire portion C1 and a shield portion C2.
- the core wire portion C1 is made of a copper wire and the shield portion C2 is made of a copper pipe, but the shield portion C2 may be made of a mesh body of a copper wire.
- the outer surface of the shield portion C2 is covered with a protective layer (not shown) made of an insulating material, and a sleeve 24 containing an electromagnetic wave absorber is provided on the outside thereof. Further, a cover 25 having a sharp tip is provided on the outside of the sleeve 24.
- the cover 25 is provided so that the transmitting probe 21 and the receiving probe 22 can be easily inserted into the medium M, and the core wire portion C1 and the shield portion C2 are protected.
- the tip portions of the core wire portion C1 and the shield portion C2 are exposed from the sleeve 24 and form the antenna portions 210 and 220.
- the core wire portion C1 is provided between the inner portion C1_1 provided inside the shield portion C2, the tip portion C1-2 protruding from the tip of the shield portion C2, and the inner portion C1-1 and the shield portion C2.
- the insulator 26 is provided.
- a conductor such as copper is used.
- Teflon, polyethylene, or the like having a predetermined relative permittivity is used.
- the inner portion C1-1 has an outer diameter smaller than the inner diameter of the shield portion C2, and is separated from the shield portion C2 and insulated. Further, the tip portion C1-2 is larger than the inner diameter of the shield portion C2, but protrudes to the outside of the shield portion C2, and is provided so as to be separated from the shield portion C2. Therefore, the core wire portion C1 is electrically insulated from the shield portion C2.
- the radiation efficiency can be increased.
- a first probe having a first antenna part for transmission and A second probe having a second antenna portion for reception facing the first probe at a predetermined distance,
- a measuring unit that measures a measurement signal including information on the propagation characteristics of electromagnetic waves in the medium between the first and second antenna units, and a measuring unit.
- a calculation unit that calculates characteristic information of the medium based on a feature amount obtained from the measurement signal is provided.
- the measuring unit measures the measurement signal in the first frequency band of the electromagnetic wave propagating in the medium, and the calculation unit is based on the first feature quantity obtained from the measurement signal in the first frequency band.
- the measuring unit measures the measurement signal in the second frequency band which is a part of the first frequency band of the electromagnetic wave, and the calculation unit measures the measurement signal in the second frequency band.
- a detection device that calculates characteristic information of the medium based on a feature amount.
- the calculation unit performs the first feature amount and the partial feature amount based on the partial feature amount obtained from the measurement signal in the second frequency band among the measurement signals in the first frequency band. Generate relationship information with The detection device according to (1), wherein in the second mode, the calculation unit calculates the characteristic information of the medium by applying the second feature amount to the relational information.
- the second frequency band is a band including a peak frequency having the maximum intensity of the measurement signal in the first frequency band.
- the measuring unit measures the electromagnetic wave at the first frequency interval.
- the width of the second frequency band is substantially equal to the width of the first frequency band.
- the second frequency band is a specific frequency within the first frequency band.
- the feature amount is a waveform of the propagation delay time of the electromagnetic wave between the first and second antenna portions, the shape of the frequency characteristic of the electromagnetic wave, or the propagation delay time obtained based on the frequency characteristic of the electromagnetic wave.
- the detection device according to any one of (1) to (5).
- the detection device (8)
- the detection device wherein the feature amount is the phase or amplitude of the electromagnetic wave at the specific frequency.
- the arithmetic unit A delay time calculation unit that calculates the propagation delay time of an electromagnetic wave between the first and second probes as the feature amount based on the measurement signal, and a delay time calculation unit.
- a relative permittivity calculation unit that calculates the relative permittivity of the medium as the characteristic information based on the propagation delay time
- a water content calculation unit that calculates the water content in the medium based on the relative permittivity
- the detection device according to any one of (2) to (8), comprising a relationship information generation unit (55) that generates the relationship information.
- the calculation unit calculates the first propagation delay time based on the measurement signal in the first frequency band, and measures the second frequency band of the measurement signals in the first frequency band. The partial delay time obtained from the signal is calculated, and the relational information is generated using the first propagation delay time and the partial delay time.
- the calculation unit calculates the second propagation delay time based on the measurement signal in the second frequency band, and applies the second propagation delay time to the related information to obtain the second propagation delay time.
- a correction delay time obtained by converting the propagation delay time into the propagation delay time of the first frequency band is generated, and the relative dielectric constant of the medium and the amount of water in the medium are calculated using the correction delay time (9).
- the detection device described in. (11) The detection device according to any one of (1) to (10), further comprising a mode switching unit for switching between the first mode and the second mode. (12) In the second frequency band, the upper limit of the level of the measurement signal in the first frequency band is higher than the upper limit of the level of the other frequency band.
- Detection device (13) A first probe having a first antenna portion for transmission, a second probe having a second antenna portion for reception facing the first probe at a predetermined distance, and the first and second antenna portions.
- Detection including a measuring unit that measures a measurement signal including information on the propagation characteristics of electromagnetic waves in the medium in between, and a calculation unit that calculates characteristic information of the medium based on a feature amount obtained from the measurement signal.
- a detection method comprising calculating characteristic information of the medium. (14) In the first mode, the calculation unit performs the first feature amount and the partial feature amount based on the partial feature amount obtained from the measurement signal in the second frequency band among the measurement signals in the first frequency band.
- the calculation unit calculates the characteristic information of the medium by applying the second feature amount to the relational information.
- the second frequency band is a band among the first frequency bands including a peak frequency at which the intensity of the measurement signal is maximized.
- the measuring unit measures the electromagnetic wave at the first frequency interval.
- the width of the second frequency band is substantially equal to the width of the first frequency band.
- the feature amount is a waveform of the propagation delay time of the electromagnetic wave between the first and second antenna portions, the shape of the frequency characteristic of the electromagnetic wave, or the propagation delay time obtained based on the frequency characteristic of the electromagnetic wave.
- the calculation unit calculates the first propagation delay time based on the measurement signal in the first frequency band, and measures the second frequency band of the measurement signals in the first frequency band.
- the partial delay time obtained from the signal is calculated, and the relational information is generated using the first propagation delay time and the partial delay time.
- the calculation unit calculates the second propagation delay time based on the measurement signal in the second frequency band, and applies the second propagation delay time to the related information to obtain the second propagation delay time.
- a correction delay time is generated by converting the propagation delay time into the propagation delay time of the first frequency band, and the relative dielectric constant of the medium and the amount of water in the medium are calculated using the correction delay time (14).
- the detection method according to any one of (20). (22) In the second frequency band, the upper limit of the level of the measurement signal in the first frequency band is higher than the upper limit of the level of the other frequency band.
Landscapes
- Physics & Mathematics (AREA)
- General Physics & Mathematics (AREA)
- Life Sciences & Earth Sciences (AREA)
- Engineering & Computer Science (AREA)
- Health & Medical Sciences (AREA)
- Chemical & Material Sciences (AREA)
- Pathology (AREA)
- General Health & Medical Sciences (AREA)
- Biochemistry (AREA)
- Immunology (AREA)
- Analytical Chemistry (AREA)
- Electromagnetism (AREA)
- Remote Sensing (AREA)
- Radar, Positioning & Navigation (AREA)
- Computer Networks & Wireless Communication (AREA)
- Environmental & Geological Engineering (AREA)
- General Life Sciences & Earth Sciences (AREA)
- Geology (AREA)
- Food Science & Technology (AREA)
- Medicinal Chemistry (AREA)
- Geophysics And Detection Of Objects (AREA)
- Measurement Of Resistance Or Impedance (AREA)
Abstract
[課題]測定時間および消費電力を抑制する検査装置、検査方法を提供する。 [解決手段]本開示の検出装置は、送信用の第1アンテナ部を有する第1プローブと、第1プローブと所定の距離をおいて対向する受信用の第2アンテナ部を有する第2プローブと、第1および第2アンテナ部の間の媒質中での電磁波の伝搬特性に関する情報を含む測定信号を測定する測定部と、測定信号から得られる特徴量に基づいて媒質の特性情報を算出する演算部と、を備え、第1モードにおいて、測定部は媒質中を伝搬する電磁波の第1周波数帯域における測定信号を測定し、演算部は第1周波数帯域の測定信号から得られる第1特徴量に基づいて媒質の特性情報を算出し、第2モードにおいて、測定部は電磁波の第1周波数帯域の一部分である第2周波数帯域における測定信号を測定し、演算部は第2周波数帯域の測定信号から得られる第2特徴量に基づいて媒質の特性情報を算出する。
Description
本開示は、検出装置および検出方法に関する。
媒質中の水分量を測定する水分センサは、FDR(Frequency Domain Refractometry)法を用いていることがある。FDR法は、媒質中に埋め込んだ金属プローブに沿って電磁波を送り、その反射応答をもとに測定された比誘電率から媒質中の水分量を算出する方法である。
しかし、FDR法を用いた水分センサは、正確な水分量を測定するために、広帯域の周波数に渡ってスイープする。このため、従来の水分センサは、長い測定時間を必要とし、かつ、大きな消費電力を必要としていた。携帯端末やIoT(internet of Things)機器のようにバッテリで駆動する装置では、測定時間および消費電力は、バッテリの持続時間に直結する。このため、測定時間および消費電力の削減が所望されている。
以上のような事情に鑑み、本技術の目的は、測定時間および消費電力を抑制することができる検査装置および検査方法を提供することにある。
本開示の一側面の検査装置は、送信用の第1アンテナ部を有する第1プローブと、第1プローブと所定の距離をおいて対向する受信用の第2アンテナ部を有する第2プローブと、第1および第2アンテナ部の間の媒質中での電磁波の伝搬特性に関する情報を含む測定信号を測定する測定部と、測定信号から得られる特徴量に基づいて媒質の特性情報を算出する演算部と、を備え、第1モードにおいて、測定部は媒質中を伝搬する電磁波の第1周波数帯域における測定信号を測定し、演算部は第1周波数帯域の測定信号から得られる第1特徴量に基づいて媒質の特性情報を算出し、第2モードにおいて、測定部は電磁波の第1周波数帯域の一部分である第2周波数帯域における測定信号を測定し、演算部は第2周波数帯域の測定信号から得られる第2特徴量に基づいて媒質の特性情報を算出する。
第1モードにおいて、演算部は、第1周波数帯域における測定信号のうち第2周波数帯域の測定信号から得られる部分特徴量に基づいて、第1特徴量と部分特徴量との関係情報を生成し、第2モードにおいて、演算部は、関係情報に第2特徴量を適用することによって、媒質の特性情報を算出してよい。
第2周波数帯域は、第1周波数帯域のうち測定信号の強度が最大となるピーク周波数を含む帯域でよい。
第1モードにおいて、測定部は、電磁波を第1周波数間隔で測定し、第2モードにおいて、測定部は、電磁波を第1周波数間隔よりも広い第2周波数間隔で測定してよい。
第2周波数帯域の広さは、第1周波数帯域の広さとほぼ等しくてよい。
第2周波数帯域は、第1周波数帯域内の特定周波数でよい。
第2周波数帯域は、第1周波数帯域内の特定周波数でよい。
特徴量は、第1および第2アンテナ部間の電磁波の伝搬遅延時間、該電磁波の周波数特性の形状、または、該電磁波の周波数特性に基づいて得られた伝搬遅延時間の波形でよい。
特徴量は、特定周波数における電磁波の位相または振幅でよい。
演算部は、測定信号に基づいて第1及び第2のプローブ間における電磁波の伝搬遅延時間を特徴量として算出する遅延時間算出部と、伝搬遅延時間に基づいて媒質の比誘電率を特性情報として算出する比誘電率算出部と、比誘電率に基づいて媒質中の水分量を算出する水分量算出部と、関係情報を生成する関係情報生成部と、を備えてよい。
第1モードにおいて、演算部は、第1周波数帯域における測定信号に基づいて第1伝搬遅延時間を算出し、第1周波数帯域における測定信号のうち第2周波数帯域の測定信号から得られる部分遅延時間を算出し、第1伝搬遅延時間および部分遅延時間を用いて関係情報を生成し、第2モードにおいて、演算部は、第2周波数帯域における測定信号に基づいて第2伝搬遅延時間を算出し、第2伝搬遅延時間を関係情報に適用することによって該第2伝搬遅延時間を第1周波数帯域の伝搬遅延時間へ換算した補正遅延時間を生成し、補正遅延時間を用いて媒質の比誘電率および該媒質中の水分量を算出してよい。
第1モードと第2モードとを切り替えるモード切替部をさらに備えてよい。
第2周波数帯域は、第1周波数帯域のうち測定信号のレベルの上限が他の周波数帯域の測定信号における測定信号のレベルの上限よりも高く、第1アンテナ部は、第2周波数帯域において、第1周波数帯域の他の周波数帯域よりも測定信号のレベルを高くしてもよい。
本開示の一側面の検査方法は、送信用の第1アンテナ部を有する第1プローブと、第1プローブと所定の距離をおいて対向する受信用の第2アンテナ部を有する第2プローブと、第1および第2アンテナ部の間の媒質中での電磁波の伝搬特性に関する情報を含む測定信号を測定する測定部と、測定信号から得られる特徴量に基づいて媒質の特性情報を算出する演算部と、を備えた検出装置を用いた検出方法であって、第1モードにおいて、媒質中を伝搬する電磁波の第1周波数帯域における測定信号を測定し、演算部は第1周波数帯域の測定信号から得られる第1特徴量に基づいて媒質の特性情報を算出し、第2モードにおいて、電磁波の第1周波数帯域の一部分である第2周波数帯域における測定信号を測定し、演算部は第2周波数帯域の測定信号から得られる第2特徴量に基づいて媒質の特性情報を算出することを具備する。
第1モードにおいて、演算部は、第1周波数帯域における測定信号のうち第2周波数帯域の測定信号から得られる部分特徴量に基づいて、第1特徴量と部分特徴量との関係情報を生成し、第2モードにおいて、演算部は、関係情報に第2特徴量を適用することによって、媒質の特性情報を算出してよい。
第2周波数帯域は、第1周波数帯域のうち測定信号の強度が最大となるピーク周波数を含む帯域でよい。
第1モードにおいて、測定部は、電磁波を第1周波数間隔で測定し、第2モードにおいて、測定部は、電磁波を第1周波数間隔よりも広い第2周波数間隔で測定してよい。
第2周波数帯域の広さは、第1周波数帯域の広さとほぼ等しくてよい。
第2周波数帯域は、第1周波数帯域内の特定周波数でよい。
特徴量は、第1および第2アンテナ部間の電磁波の伝搬遅延時間、該電磁波の周波数特性の形状、または、該電磁波の周波数特性に基づいて得られた伝搬遅延時間の波形でよい。
特徴量は、特定周波数における電磁波の位相または振幅でよい。
第1モードにおいて、演算部は、第1周波数帯域における測定信号に基づいて第1伝搬遅延時間を算出し、第1周波数帯域における測定信号のうち第2周波数帯域の測定信号から得られる部分遅延時間を算出し、第1伝搬遅延時間および部分遅延時間を用いて関係情報を生成し、第2モードにおいて、演算部は、第2周波数帯域における測定信号に基づいて第2伝搬遅延時間を算出し、第2伝搬遅延時間を関係情報に適用することによって該第2伝搬遅延時間を第1周波数帯域の伝搬遅延時間へ換算した補正遅延時間を生成し、補正遅延時間を用いて媒質の比誘電率および該媒質中の水分量を算出してよい。
第2周波数帯域は、第1周波数帯域のうち測定信号のレベルの上限が他の周波数帯域における測定信号のレベルの上限よりも高く、第1アンテナ部は、第2周波数帯域において、第1周波数帯域の他の周波数帯域よりも測定信号のレベルを高くしてもよい。
以下、本技術を適用した具体的な実施の形態について、図面を参照しながら詳細に説明する。図面は模式的または概念的なものであり、各部分の比率などは、必ずしも現実のものと同一とは限らない。明細書と図面において、既出の図面に関して前述したものと同様の要素には同一の符号を付して詳細な説明は適宜省略する。
(実施形態)
図1は、実施形態に係る水分量測定センサを備えた測定装置の概略構成図である。図2は、水分量測定センサの構成を示すブロック図である。
図1は、実施形態に係る水分量測定センサを備えた測定装置の概略構成図である。図2は、水分量測定センサの構成を示すブロック図である。
[水分量測定装置]
本実施形態の測定装置100は、水分量測定センサ装置(以下、センサ装置)10と、信号処理ユニット50とを有する。本実施形態では、農作物を育成する土壌の水分量の測定に本技術を適用した例について説明する。
本実施形態の測定装置100は、水分量測定センサ装置(以下、センサ装置)10と、信号処理ユニット50とを有する。本実施形態では、農作物を育成する土壌の水分量の測定に本技術を適用した例について説明する。
センサ装置10は、媒質(土壌)Mの電磁波伝搬特性を取得し、媒質Mの比誘電率の算出に用いられる測定信号S1を生成する。信号処理ユニット50は、センサ装置10から測定信号S1を受信し、測定信号S1に基づいて媒質M中の水分量を算出する。
以下、各部の詳細について説明する。
センサ装置10は、センサヘッド20と、測定ユニット30とを有する。
(センサヘッド)
センサヘッド20は、送信用プローブ21(第1プローブ)と、受信用プローブ22(第2プローブ)とを有する。センサヘッド20は、土壌等の媒質Mの中に配置され、送信用及び受信用プローブ21,22間で所定周波数の電磁波EWを送受信することが可能なアンテナ部210,220(第1アンテナ部、第2アンテナ部)をそれぞれ有する。
センサヘッド20は、送信用プローブ21(第1プローブ)と、受信用プローブ22(第2プローブ)とを有する。センサヘッド20は、土壌等の媒質Mの中に配置され、送信用及び受信用プローブ21,22間で所定周波数の電磁波EWを送受信することが可能なアンテナ部210,220(第1アンテナ部、第2アンテナ部)をそれぞれ有する。
送信用プローブ21及び受信用プローブ22は、距離Dをおいて相互に対向するように媒質M中に概ね垂直な姿勢で埋め込まれる。送信用プローブ21及び受信用プローブ22は、芯線部C1とシールド部C2とを有する同軸ケーブルで構成される。当該ケーブルの太さ及び長さは特に限定されず、任意の太さ及び長さとすることができる。例えば、当該ケーブルの太さ(直径)を2mm~6mmとすることで、土壌への挿入が容易となる。芯線部C1は銅線で構成され、シールド部C2は銅パイプで構成されるが、シールド部C2は銅線のメッシュ体で構成されてもよい。シールド部C2の外表面は、図示せずとも、絶縁材料で構成された保護層で被覆される。
送信用プローブ21は、測定ユニット30の出力端子34(図3参照)に接続され、測定ユニット30からアンテナ部210へ送信信号を伝送する。アンテナ部210は、送信用プローブ21の先端部(終端部)又はその近傍に設けられ、送信信号に応じた電磁波EWを受信用プローブ22へ送信する。
受信用プローブ22は、測定ユニット30の入力端子35(図3参照)に接続され、アンテナ部220で電磁波EWを受信し、測定ユニット30へ受信信号を入力する。アンテナ部220は、送信用プローブ21のアンテナ部210と対向するように受信用プローブ22の先端部(終端部)又はその近傍に設けられる。アンテナ部210,220は、プローブ21,22の先端部に設けられる場合に限られず、プローブ21,22の中央位置など任意の位置に設けられてもよい。
アンテナ部210,220は、プローブ21,22の所定位置において局所的に電磁波EWを送受信するためのものであり、典型的には、プローブ21,22を共振させない大きさで形成された微小アンテナで構成される。これにより、プローブ21,22の共振による測定精度の低下を抑制することができる。
本実施形態において、アンテナ部210,220は、シールド部C2の一部に設けられた開口部Hを含む。すなわち、プローブ21,22は、アンテナ部210,220を電波漏洩部として有する漏洩同軸アンテナで構成される。
開口部Hは、矩形、円形、楕円形、長円形等の開口形状を有し、本実施形態ではプローブ21,22の長手方向に長軸を有する長円形状で形成される。開口部Hの長軸は、使用する電磁波EWの波長に応じて適宜設定可能である。例えば、電磁波EWの波長が1GHz~9GHzの場合、開口部Hの長軸の長さは、5mm~15mm程度である。
送信用プローブ21及び受信用プローブ22は、終端抵抗23をそれぞれ有する。終端抵抗23は、芯線部C1の終端部とシールド部C2との間に電気的に接続される。これにより、プローブ終端における送受信信号の不要反射が防止される。
送信用プローブ21及び受信用プローブ22の先端部は、アンテナ部210,220を被覆する電磁波透過性の保護部材(図示略)で被覆することが望ましい。
送信用プローブ21及び受信用プローブ22は、電磁波吸収材を含有するスリーブ24をさらに有する。スリーブ24は、アンテナ部210,220(開口部H)周辺のプローブ21,22の外周面を被覆し、開口部H以外の領域からの送受信信号の漏洩を抑制する。
スリーブ24を構成する電磁波吸収材には主にフェライトが用いられるが、これに限られず、電磁波EWの周波数等に応じて、センダストやパーマロイ等の他の高透磁率材料が用いられてもよい。スリーブ24は、必要に応じて省略されてもよいし、いずれか一方のプローブ21,22にのみ設けられてもよい。
送信用プローブ21と受信用プローブ22との距離Dの大きさは特に限定されず、例えば、20mm~100mmである。距離Dが100mmより大きいと、媒質Mを伝搬する電磁波EWの減衰が大きくなり、十分な受信強度が得られなくなるおそれがある。一方、距離Dが20mmより小さいと、技術的に観測が難しくなる。また距離Dが短くなると、プローブ21,22の近傍に形成される空隙の影響を大きく受け、正しい比誘電率あるいは水分量を測定できなくなるおそれがある。
上記空隙は、媒質Mとプローブ21,22の周囲との間に形成される空気層であり、プローブ21,22を媒質Mにその表面から埋め込むときに、あるいは、プローブ21,22を媒質M内で動かしたりしたときに形成されてしまう。後述するように、媒質Mの比誘電率あるいは水分量を精度よく測定する上で、空隙の大きさ(空気層の厚さ)は小さい方が好ましいが、典型的には、1mm程度の空隙が生じることがある。
(測定ユニット)
図3は、測定ユニットの構成を示すブロック図である。
図3は、測定ユニットの構成を示すブロック図である。
測定ユニット30は、信号生成部31と、通信部32とを有する。測定ユニット30は、典型的には、ネットワークアナライザで構成される。
信号生成部31は、制御部310と、信号発生器311、位相シフタ313、混合器315等を有する。信号生成部31は、送信用プローブ21のアンテナ部210と受信用プローブ22のアンテナ部220との間における媒質M中での電磁波EWの伝搬特性に関する情報を含む測定信号S1を生成する。
制御部310は、CPU(Central Processing Unit)やメモリ等を有するコンピュータで構成され、信号発生器311、通信部32を含む測定ユニット30の各部を制御する。
信号発生器311は、所定周波数の送信信号Fを発生し、増幅器312および出力端子34を介して送信用プローブ21へ入力する。信号発生器311は、送信信号Fとしてパルス波(パルス信号)を生成するが、送信信号Fとして連続波を生成するように構成されてもよい。
信号発生器311は、送信信号Fの周波数掃引機能を有していてもよい。この場合、信号発生器311は、制御部310の指令に基づいて、例えば1GHzから9GHzの送信信号Fを生成する。
位相シフタ313は、送信信号Fを位相が90度異なる2つの信号に分離して混合器315へ入力する。混合器315は、受信用プローブ22から入力端子35および増幅器314を介して入力された受信信号を、位相シフタ313から出力される2つの信号と混合して、互いに直交する2つの応答信号(I信号/Q信号)に変調する。これら応答信号は、AD変換器316を介してアナログ信号からデジタル信号に変換されて、制御部310において測定信号S1として生成される。
位相シフタ313および混合器315は、受信用プローブ22の出力を直交検波(IQ検波)する検波器を構成する。I信号とQ信号の二乗和は受信信号の強度に、I信号とQ信号の二乗和の平方根は受信信号の振幅に、I信号とQ信号の逆正接は位相に、それぞれ相当する。
通信部32は、通信用アンテナ等を含む通信モジュールで構成される。通信部32は、センサ装置10から信号処理ユニット50へ測定信号S1を無線送信するためのものである。これにより、観測地とは異なる場所に配置された信号処理ユニット50へ測定信号S1を提供することができる。これに限られず、センサ装置10は信号処理ユニット50と配線ケーブル等を介して接続されてもよい。
(信号処理ユニット)
演算部としての信号処理ユニット50は、図2に示すように、遅延時間算出部51、比誘電率算出部52、水分量算出部53、メモリ54、関係情報生成部55およびモード切替部56、57を有する。信号処理ユニット50は、センサ装置10(測定ユニット30)から送信される測定信号S1に基づいて、電磁波EWの伝搬遅延時間等の特徴量を得て、さらに、その特徴量から媒質M中の水分量等の特性情報を算出する情報処理装置で構成される。
演算部としての信号処理ユニット50は、図2に示すように、遅延時間算出部51、比誘電率算出部52、水分量算出部53、メモリ54、関係情報生成部55およびモード切替部56、57を有する。信号処理ユニット50は、センサ装置10(測定ユニット30)から送信される測定信号S1に基づいて、電磁波EWの伝搬遅延時間等の特徴量を得て、さらに、その特徴量から媒質M中の水分量等の特性情報を算出する情報処理装置で構成される。
当該情報処理装置は、CPU、RAM(Random Access Memory)、ROM(Read Only Memory)等のコンピュータに用いられるハードウェア要素および必要なソフトウェアにより実現され得る。CPUに代えて、またはこれに加えて、FPGA(Field Programmable Gate Array)等のPLD(Programmable Logic Device)、あるいは、DSP(Digital Signal Processor)、その他ASIC(Application Specific Integrated Circuit)等が用いられてもよい。
本実施形態では、CPUが所定のプログラムを実行することで、機能ブロックとしての遅延時間算出部51、比誘電率算出部52、水分量算出部53、関係情報生成部55およびモード切替部56が構成される。信号処理ユニット50のRAM等によりメモリ54が構成される。もちろん各ブロックを実現するために、IC(集積回路)等の専用のハードウェアが用いられてもよい。プログラムは、例えば種々の記録媒体を介して信号処理ユニット50にインストールされる。あるいは、インターネット等を介してプログラムのインストールが実行されてもよい。
遅延時間算出部51は、測定信号S1に基づいて送信用プローブ21(アンテナ部210)と受信用プローブ22(アンテナ部220)との間における電磁波EWの伝搬遅延時間を特徴量として算出するように構成される。
電磁波EWの伝搬遅延時間とは、空気中における電磁波EWの伝搬時間に対する媒質M中における電磁波の伝搬時間の差分をいう。電磁波の伝搬遅延時間は、伝送経路の比誘電率に依存し、伝搬遅延時間は媒質の比誘電率の平方根に比例する。一般的に土壌自体の比誘電率は1から10程度であり、水分に応じて変化する。したがって、伝搬遅延時間を測定できれば、媒質M中の水分量を間接的に測定することができることになる。
伝搬遅延時間の算出方法は特に限定されず、本実施形態では、測定信号S1を逆フーリエ変換(逆FFT)してインパルス応答を求め、そのピーク位置からパルス遅延時間を算出する。パルス遅延時間からプローブ21,22の伝送時間(ケーブル伝送時間)を差し引くことにより、電磁波EWの伝搬遅延時間が算出される。
比誘電率算出部52は、遅延時間算出部51において算出された電磁波EWの伝搬遅延時間に基づいて、媒質Mの比誘電率を媒質Mの特性情報として算出するように構成される。水の比誘電率は、典型的には、80である。
水分量算出部53は、比誘電率算出部52において算出された比誘電率に基づいて、媒質M中の水分量を算出するように構成される。水分量の算出には、例えば、Toppの式が用いられ(後述)、水分量として、媒質Mの体積含水率[%]が算出される。あるいは、水分量算出部53は、比誘電率を求めることなく、電磁波EWの伝搬遅延時間から水分量を直接計算してもよい。
関係情報生成部55は、或る周波数帯域(第1周波数帯域)の測定信号を用いて得られる伝搬遅延時間DL11と該第1周波数帯域の一部分の周波数帯域(第2周波数帯域)の測定信号を用いて得られる部分遅延時間DL12との間の関係情報を生成する。関係情報は、伝搬遅延時間DL11と部分遅延時間DL12との間の関係を示す関数または対応表でよい。この関係情報は、メモリ54内に格納される。
モード切替部56、57は、後述する第1モードと第2モードとの切り替えを行う。例えば、第1モードにおいて、測定ユニット30は、媒質M中を伝搬する電磁波EWの第1周波数帯域における測定信号を測定する。即ち、測定ユニット30は、電磁波EWの周波数を第1周波数帯域内で所定間隔(第1周波数間隔)毎に変化させながら、媒質Mを伝搬した電磁波EWの測定信号を測定する。信号処理ユニット50は、第1周波数帯域の測定信号から得られる第1伝搬遅延時間(第1特徴量)DL11に基づいて媒質Mの比誘電率および水分量を算出する。それとともに、信号処理ユニット50は、第1モードで得られた測定信号のうち、第2モードで用いられる第2周波数帯域の測定信号の部分を抜き出し、該測定信号の部分から部分遅延時間(部分特徴量)DL12を求める。第2周波数帯域は、第1周波数帯域内の一部分の周波数帯域または第1周波数帯域内の特定周波数である。例えば、第2周波数帯域は、測定信号を正確に検出するために、第1周波数帯域のうち測定信号が最大強度となるピーク周波数を含む帯域でよい。さらに、信号処理ユニット50は、第1伝搬遅延時間DL11と部分遅延時間DL12との関係情報(例えば、関係式または対応表)を求める。尚、関係情報の生成については後述する。また、後述するように、特徴量は伝搬遅延時間に限定されない。
第2モードにおいて、測定ユニット30は、媒質M中を伝搬する電磁波EWの第2周波数帯域における測定信号を測定する。信号処理ユニット50は、第2周波数帯域の測定信号から得られる第2伝搬遅延時間DL22に基づいて媒質Mの比誘電率および水分量を算出する。第2モードにおいて、信号処理ユニット50は、第1モードで算出された関係情報に、第2モードで得られた第2伝搬遅延時間DL22を適用することによって、補正遅延時間DL21を算出する。例えば、関係情報が第1伝搬遅延時間DL11と部分遅延時間DL12との間の関係を示す関係式である場合、信号処理ユニット50は、第2モードで得られた第2伝搬遅延時間DL22をその関係式の部分遅延時間DL12に代入する。これにより得られた第1伝搬遅延時間DL11を補正遅延時間DL21とする。この補正遅延時間DL21は、第1周波数帯域を用いて得られる伝搬遅延時間に相当することになる。即ち、信号処理ユニット50は、第2伝搬遅延時間DL22を上記関係式に適用することによって、第1周波数帯域の伝搬遅延時間(DL21)へ換算(補正)することができる。信号処理ユニット50は、このようにして補正された補正遅延時間DL21を用いて比誘電率または水分量を算出する。
関係情報が第1伝搬遅延時間DL11と部分遅延時間DL12とのと関係を示す対応表である場合、信号処理ユニット50は、その対応表を参照して、第2モードで得られた第2伝搬遅延時間DL22を補正遅延時間DL21へ変換すればよい。例えば、信号処理ユニット50は、第2伝搬遅延時間DL22に等しいまたは最も近い部分遅延時間DL12を対応表中で検索し、その部分遅延時間DL12に対応する第1伝搬遅延時間DL11を補正遅延時間DL21とすればよい。あるいは、信号処理ユニット50は、第2伝搬遅延時間DL22に隣接する複数の部分遅延時間DL12を用いて補間し、その補間された値に対応する第1伝搬遅延時間DL11を補正遅延時間DL21としてもよい。
このように、本開示による信号処理ユニット50は、第1モードにおいて、第1周波数帯域における第1伝搬遅延時間DL11と第2周波数帯域における部分遅延時間DL12との間の関係情報を生成する。第2モードにおいて、信号処理ユニット50は、第2周波数帯域における第2伝搬遅延時間DL22を上記関係情報に適用することによって、第1周波数帯域の伝搬遅延時間(補正遅延時間DL21)に換算する。これにより、第2モードでは、第1周波数帯域の一部分である第2周波数帯域を用いながらも、第1周波数帯域の伝搬遅延時間を推定することができる。その後、信号処理ユニット50は、補正遅延時間DL21を用いて比誘電率または水分量を算出する。
モード切替部56、57は、このような第1モードと第2モードとを切り替えるスイッチである。モード切替部56は、例えば、信号処理ユニット50内に設けられたスイッチ機能(ソフトウェア)である。モード切替部57は、例えば、センサ装置10の筐体に設けられた物理スイッチである。モード切替部56は、信号処理ユニット50の内部でモード切り替えを自動で実行する場合に用いられる。モード切替部57は、ユーザが任意にモード切り替えを実行する場合に用いられる。センサ装置10は、モード切替部56、57の両方を備えていてもよく、いずれか一方を備えていてもよい。
信号処理ユニット50はさらに、測定ユニット30の通信部32と通信可能に構成された通信部、各機能ブロックで算出された伝搬遅延時間、比誘電率、水分量に関する情報等を表示可能な表示部などを備えてもよい。
ここで、第1モードでは、測定ユニット30は、電磁波EWを比較的広範な第1周波数帯域で電磁波EWを測定するので、分解能が高く、水分量を正確に算出することができる。しかし、第1モードのみで測定すると、比較的長い時間がかかり、かつ、消費電力も大きくなる。第2モードでは、測定ユニット30は、第1周波数帯域の一部分の第2周波数帯域で電磁波EWを測定するので、比較的短い時間で済み、かつ、消費電力も小さい。しかし、第2モードのみで測定すると、分解能が低く、正確な水分量を算出することが困難である。
そこで、本実施形態では、例えば、当初、上記関係情報を得るために第1モードで関係情報を生成し、その後、第2モードでその関係情報を用いて測定を実行する。これにより、第1モードでは比較的長い時間および大きな消費電力を必要とするが、その後の第2モードにおいては、短時間かつ低消費電力で測定を繰り返すことができる。また、第2モードにおいて、信号処理ユニット50は、広帯域の第1周波数帯域において得られた関係情報を用いて、第2伝搬遅延時間DL22を、第1周波数帯域の伝搬遅延時間に相当する補正遅延時間DL21へ変換している。従って、本実施形態による検査装置での測定は、短時間かつ低消費電力で実行することができるとともに、第1周波数帯域の測定に匹敵する比較的正確な水分量を得ることができる。
(水分量測定方法)
以下、信号処理ユニット50の詳細について、本実施形態に係る水分量測定装置の動作を説明する。
以下、信号処理ユニット50の詳細について、本実施形態に係る水分量測定装置の動作を説明する。
(第1モード)
図4は、第1モードの水分量測定方法および関係情報の生成方法を説明するフローチャートである。図5Aは、第1周波数帯域における電磁波EWの送信時の信号レベルを示す図である。図5Bは、第1周波数帯域における電磁波EWの測定信号のレベルを示す図である。図5Cは、第1伝搬遅延時間DL11を示す図である。図5Dは、第2周波数帯域における電磁波EWの測定信号のレベルを示す図である。図5Eは、部分遅延時間DL12を示す図である。
図4は、第1モードの水分量測定方法および関係情報の生成方法を説明するフローチャートである。図5Aは、第1周波数帯域における電磁波EWの送信時の信号レベルを示す図である。図5Bは、第1周波数帯域における電磁波EWの測定信号のレベルを示す図である。図5Cは、第1伝搬遅延時間DL11を示す図である。図5Dは、第2周波数帯域における電磁波EWの測定信号のレベルを示す図である。図5Eは、部分遅延時間DL12を示す図である。
まず図1に示すように、送信用プローブ21及び受信用プローブ22が土壌M中に埋め込まれる(ステップ101)。送信用プローブ21と受信用プローブ22との間の対向距離Dは、例えば、50mmである。
続いて、送信用プローブ21(アンテナ部210)と受信用アンテナ(アンテナ部220)との間で電磁波EWが送受信される(ステップ102)。 このとき、測定ユニット30は、送信用プローブ21へ入力される送信信号F(n)の周波数を50MHzステップで変化させながら、受信用プローブ22から出力される受信信号の直交周波数応答信号(I(n)信号、Q(n)信号)を含む測定信号S1を生成する。測定ユニット30は、図5Aに示すように、電磁波EWの周波数を第1周波数帯域FB1内において10MHzステップごとに変化させてスイープする。これにより、図5Bに示すように、第1周波数帯域FB1の測定信号S1が得られる。測定信号S1は、信号処理ユニット50へ送信される。
続いて、信号処理ユニット50(遅延時間算出部51)は、測定信号S1に基づいて、送信用プローブ21と受信用プローブ22との間における電磁波EWの第1伝搬遅延時間DL11を算出する(ステップ103)。 ここで、遅延時間算出部51は、図5Cに示すように、第1周波数帯域FB1の測定信号S1を用いて第1伝搬遅延時間DL11を計算する。これとともに、遅延時間算出部51は、図5Dに示すように、第1周波数帯域FB1の一部分である第2周波数帯域FB2の測定信号を抜き出し、図5Eに示すように、該第2周波数帯域FB2の測定信号を用いて部分遅延時間DL12を算出する。即ち、遅延時間算出部51は、第1モードの測定信号S1を用いて、第1伝搬遅延時間DL11を生成するとともに、部分遅延時間DL12を生成する。第2周波数帯域FB2は、第1モードの測定信号S1のうち伝搬ロスが少なく、大きな信号強度を得ることができる部分的な周波数帯域でよい。第2周波数帯域FB2は伝搬ロスの少ない周波数帯域に設定されるので、第2モードにおいて、測定ユニット30は、第2周波数帯域FB2の測定信号S2を確実に検出することが可能になる。また、第2モードにおける測定信号S2のSN比(Signal-to-Noise ratio)が向上する。よって、第2モードにおける送信信号の電力を抑制することにも繋がる。
伝搬遅延時間および媒質Mの比誘電率および水分量の算出方法は以下の通りである。尚、第1伝搬遅延時間DL11は、測定信号S1の第1周波数帯域FB1を用いて算出され、部分遅延時間DL12は、測定信号S1のうち第2周波数帯域FB2を用いて算出される。
伝搬遅延時間および媒質Mの比誘電率および水分量の算出方法は以下の通りである。尚、第1伝搬遅延時間DL11は、測定信号S1の第1周波数帯域FB1を用いて算出され、部分遅延時間DL12は、測定信号S1のうち第2周波数帯域FB2を用いて算出される。
遅延時間算出部51は、I(n)信号を実部、Q(n)信号を虚部として、高速フーリエ変換により受信信号を逆フーリエ変換(IFFT)し、インパルス応答h(τ)を求める。
h(τ)=IFFT{I(n)、Q(n)} (式1)
h(τ)=IFFT{I(n)、Q(n)} (式1)
遅延時間算出部51は、インパルス応答h(τ)のピーク位置からパルス遅延時間τ[s]を求め、パルス遅延時間τからケーブル伝送時間τ0[s]を差し引くことにより、伝搬遅延時間τdelay[s]を求める。
τdelay=τ-τ0 (式2)
τdelay=τ-τ0 (式2)
続いて、信号処理ユニット50(比誘電率算出部52)は、伝搬遅延時間DL11またはDL12をτdelay[s]、光速をc[m/s]、プローブ間距離(D)をd[m]として、媒質Mの比誘電率εrを算出する(ステップ104)。
τdelay=d・√(εr)/c (式3)
τdelay=d・√(εr)/c (式3)
続いて、信号処理ユニット50(水分量算出部53)は、Topp式から、媒質M中の水分量(体積含水率)θ[%]を算出する(ステップ105)。
θ=-5.3×10⁻²+2.92×10⁻²εr-5.5×10⁻⁴εr 2+4.3×10⁻⁶εr 3 (式4)
θ=-5.3×10⁻²+2.92×10⁻²εr-5.5×10⁻⁴εr 2+4.3×10⁻⁶εr 3 (式4)
このように、伝搬遅延時間DL11,DL12および媒質Mの比誘電率および水分量は、上記式1~式4を用いて算出され得る。
続いて、信号処理ユニット50(関係情報生成部55)は、第1伝搬遅延時間DL11と部分遅延時間DL12との関係情報を生成する(ステップ106)。
例えば、図6は、第1伝搬遅延時間DL11と部分遅延時間DL12との関係を示すグラフである。ステップ102~105を繰り返すことによって、図6に示すようなグラフが得られる。これにより、第1伝搬遅延時間DL11と部分遅延時間DL12との関係式が得られる。関係式は、一次関数でもよく、二次以上の関数であってもよい。関係式は、メモリ54に格納される。尚、関係情報は、第1伝搬遅延時間DL11と部分遅延時間DL12との関係を示す対応表であってもよい。
このように、第1モードにおいて、広帯域の第1周波数帯域FB1の測定信号を用いて第1伝搬遅延時間DL11を算出し、第1伝搬遅延時間DL11を用いて媒質Mの比誘電率および媒質M中の体積含水率(水分量)が算出される。それとともに、第1周波数帯域FB1の第1伝搬遅延時間DL11と第2周波数帯域FB2の部分遅延時間DL12との関係情報が生成される。
(第2モード)
図7は、第2モードの水分量測定方法を説明するフローチャートである。 図8Aは、第2周波数帯域における電磁波EWの送信時の信号レベルを示す図である。図8Bは、第2周波数帯域における電磁波EWの測定信号のレベルを示す図である。図8Cは、第2伝搬遅延時間DL22を示す図である。図8Dは、補正遅延時間DL21を示す図である。
図7は、第2モードの水分量測定方法を説明するフローチャートである。 図8Aは、第2周波数帯域における電磁波EWの送信時の信号レベルを示す図である。図8Bは、第2周波数帯域における電磁波EWの測定信号のレベルを示す図である。図8Cは、第2伝搬遅延時間DL22を示す図である。図8Dは、補正遅延時間DL21を示す図である。
まず、第1モードと同様に、ステップ101が実行される。これにより、送信用プローブ21及び受信用プローブ22が、土壌M中に埋め込まれる。
続いて、送信用プローブ21(アンテナ部210)と受信用アンテナ(アンテナ部220)との間で電磁波EWが送受信される(ステップ202)。 このとき、測定ユニット30は、図8Aに示すように、電磁波EWの周波数を第2周波数帯域FB2内において50MHzステップごとに変化させてスイープする。これにより、図8Bに示すように、第2周波数帯域FB2の測定信号S2が得られる。測定信号S2は、信号処理ユニット50へ送信される。
続いて、送信用プローブ21(アンテナ部210)と受信用アンテナ(アンテナ部220)との間で電磁波EWが送受信される(ステップ202)。 このとき、測定ユニット30は、図8Aに示すように、電磁波EWの周波数を第2周波数帯域FB2内において50MHzステップごとに変化させてスイープする。これにより、図8Bに示すように、第2周波数帯域FB2の測定信号S2が得られる。測定信号S2は、信号処理ユニット50へ送信される。
続いて、遅延時間算出部51は、図8Cに示すように、測定信号S2に基づいて、送信用プローブ21と受信用プローブ22との間における電磁波EWの第2伝搬遅延時間DL22を算出する(ステップ203)。第2伝搬遅延時間DL22は、伝搬遅延時間DL11、DL12と同様に、上記式1および式2を用いて算出すればよい。第2伝搬遅延時間DL22は、第2周波数帯域FB2の測定信号S2を用いて算出される。
続いて、遅延時間算出部51は、図8Dに示すように、第2伝搬遅延時間DL22を第1モードで得られた関係情報に適用することによって補正遅延時間DL21を算出する(ステップ204)。例えば、遅延時間算出部51は、第2伝搬遅延時間DL22を、上記関係式の部分遅延時間DL12に代入することによって、補正遅延時間DL21を算出する。補正遅延時間DL21は、第2伝搬遅延時間DL22を部分遅延時間DL12に代入した場合の第1伝搬遅延時間DL11に相当する。従って、補正遅延時間DL21は、第2伝搬遅延時間DL22を第1周波数帯域の伝搬遅延時間に対応するように補正した伝搬遅延時間となる。よって、補正遅延時間DL21は、第2周波数帯域の測定信号S2を用いて算出されているものの、比較的正確な伝搬遅延時間に補正される。
尚、関係情報が第1伝搬遅延時間DL11と部分遅延時間DL12との対応表である場合、遅延時間算出部51は、第2伝搬遅延時間DL22に等しいまたは最も近い部分遅延時間DL12を対応表から検索する。そして、遅延時間算出部51は、その検索でヒットした部分遅延時間DL12に対応する第1伝搬遅延時間DL11を補正遅延時間DL21とすればよい。あるいは、遅延時間算出部51は、第2伝搬遅延時間DL22に隣接する複数の部分遅延時間DL12を用いて補間し、その補間された値に対応する第1伝搬遅延時間DL11を補正遅延時間DL21としてもよい。このように、遅延時間算出部51は、関係情報を用いて、第2伝搬遅延時間DL22を補正遅延時間DL21へ変換する。
続いて、信号処理ユニット50は、補正遅延時間DL21を用いて、ステップ104および105を実行する。これにより、第2モードにおいて、媒質M中の水分量θ[%]が算出される。
このように本実施形態によるセンサ装置10は、第1モードにおいて、比較的広域の第1周波数帯域の電磁波EWを用いて第1伝搬遅延時間DL11と部分遅延時間DL12との関係情報を生成する。その後、センサ装置10は、第2モードにおいて、第1周波数帯域の一部分の第2周波数帯域の電磁波EWを用いて、第2伝搬遅延時間DL22を測定し、第1モードで得られた関係情報を用いて、第2伝搬遅延時間DL22を補正遅延時間DL21へ補正する。これにより、当初、第1モードでは比較的長い時間および大きな消費電力を必要とするが、その後の第2モードにおいては、短時間かつ低消費電力で測定を繰り返すことができる。また、第2モードにおいて、信号処理ユニット50は、広帯域の第1周波数帯域において得られた関係情報を用いて、第2伝搬遅延時間DL22を、第1周波数帯域の伝搬遅延時間に相当する補正遅延時間DL21へ変換している。従って、本実施形態による検査装置での測定は、短時間かつ低消費電力で実行することができるとともに、第1周波数帯域の測定に匹敵する比較的正確な水分量を得ることができる。
図9は、実際の測定におけるセンサ装置の全体の動作例を示すフロー図である。
まず、送信用プローブ21及び受信用プローブ22が土壌M中に埋め込まれる(ステップ101)。
続いて、信号処理ユニット50は、第1モードの実行が必要か否かを判断する(ステップ302)。例えば、関係情報がまだ設定されていない場合、関係情報が設定されてから第2モードが所定回数実行された場合、関係情報が設定されてから所定時間経過した場合等に、信号処理ユニット50は、第1モードの実行が必要と判断する(ステップ302のYES)。この場合、センサ装置10は、第1モードで測定を実行する(ステップ303)。これにより、関係情報が得られる。また、第1モードによる媒質Mの比誘電率および水分量が得られる。
一方、有効な関係情報がすでに設定されており、第1モードの実行が不要と判断された場合(ステップ302のNO)、センサ装置10は、第2モードで測定を実行する(ステップ304)。これにより、第2モードによる媒質Mの比誘電率および水分量も得られる。
ステップ302~304は、所定の測定期間の間、繰り返し実行される(ステップ305のNO)。測定期間が終了すると(ステップ305のYES)、測定が終了する(ステップ306)。測定が終了すると、ユーザは、センサ装置10のプローブ21,22を媒質Mから撤去する。
このように、第1モードで一旦設定された関係情報は、その後、第2モードにおいて繰り返し用いてもよい。従って、第1モードで関係情報の生成後、センサ装置10は、第2モードで短時間かつ低消費電力で、比較的精度良く水分量を検出することができる。
一方、関係情報は必要に応じて周期的にあるいは任意に更新してよい。例えば、図10Aおよび図10Bに示すように、センサ装置10は、第2モードをn(n≧1)回実行するごとに、第1モードを1回実行してもよい。図10(A)および図10Bは、第1および第2モードの実行周期の一例を示す図である。第1モードの実行頻度は、モード切替部56のソフトウェアで設定すればよい。また、第1モードは、所定の期間ごとに定期的に実行してもよい。この場合、信号処理ユニット50は、図示しないタイマーで第1モードの実行後の時間を計測すればよい。また、ユーザが任意で第1モードと第2モードとを切り替えてもよい。この場合、ユーザはモード切替部57、即ち、物理スイッチでモードを任意に設定すればよい。
また、第1モードは、センサ装置10の製造時のみに実行されてもよい。この場合、販売後、センサ装置10は、第2モードのみで測定する。また、販売後、センサ装置10は、最初の測定において第1モードを実行し、関係情報の設定後、第2モードのみで測定してもよい。このように、第1モードは、最初に実施する必要があるが、その後、環境に変化がなければ、ほとんど実施しなくてもよい。しかし、第1モードは、測定精度を向上させるために、一定期間ごとに周期的に行うことが好ましい。また、測定ユニット30が温度センサ等の環境センサ39を備え、環境の変化に応じて、第1モードを実行してもよい。例えば、環境センサ39が媒質Mの温度や気温を測定し、その温度が3℃以上変化した場合に、センサ装置10は、第1モードを実行し関係情報を更新してもよい。
(第2周波数帯域の変形例)
上記実施形態では、第2周波数帯域FB2は、第1周波数帯域FB1の測定信号S1の強度が最大となるピーク周波数を含む帯域であり、第1周波数帯域FB1よりも狭い帯域である。
上記実施形態では、第2周波数帯域FB2は、第1周波数帯域FB1の測定信号S1の強度が最大となるピーク周波数を含む帯域であり、第1周波数帯域FB1よりも狭い帯域である。
これに対し、電磁波EWの送信信号Fのレベルには周波数によって上限が設定されている場合がある。例えば、図11A~図11Cは、第2周波数帯域の変形例を示すグラフである。図11Aは、第2モードにおける送信信号Fを示す。送信信号レベルには上限ULが設定されている。上限ULとして、例えば、ISM(Industry Science and Medical)バンド(2.4GHz帯)が設定されている場合がある。このような場合、第2周波数帯域FB2は、送信信号レベルの上限ULが他の周波数帯域の上限ULよりも高い周波数帯域に設定すればよい。これにより、アンテナ部210は、第2周波数帯域FB2において、他の周波数帯域の上限ULよりも高いレベル(出力)の送信信号を送信することができる。これにより、図11Bに示すように、測定ユニット30は、第2周波数帯域FB2において、他の周波数帯の測定信号よりも高いレベルで測定信号S2を受信することができる。測定信号S2のレベルが高いと、ノイズが多い環境であっても、測定ユニット30は、測定信号S2を正確に検出することができる。信号処理ユニット50は、信号レベルの高い周波数帯域を用いて第2伝搬遅延時間DL22および補正遅延時間DL21を算出するので、ノイズの影響を受け難くなり、正確な水分量を検出することができる。
図12A~図12Cは、第2周波数帯域の他の変形例を示すグラフである。図12Aでは、第1周波数帯域FB1から間欠的に測定周波数を選択し、その選択された測定周波数を第2周波数帯域FB2としている。即ち、第2周波数帯域FB2の広さは、第1周波数帯域FB1の広さとほぼ等しいが、第1周波数帯域FB1に対して間欠的に測定周波数を有する。換言すると、測定ユニット30は、図12Bに示すように、第2モードにおいて、第1モードの測定間隔(第1周波数間隔)よりも広い測定間隔(第2周波数間隔)で測定を実行する。これにより、センサ装置10は、短時間かつ低消費電力で水分量を検出することができる。それとともに、第2周波数帯域FB2の広さは第1周波数帯域FB1の広さとほぼ等しいので、第2モードでも比較的正確に水分量を検出することができる。
図13A~図13Cは、第2周波数帯域のさらに他の変形例を示すグラフである。図13Aでは、第2周波数帯域FB2は、第1周波数帯域FB1内の1つの特定周波数である。この場合、図13Bに示すように、測定ユニット30は、第2モードにおいて、特定周波数で測定を実行する。これにより、センサ装置10は、非常に短時間かつ非常に低消費電力で水分量を検出することができる。
この場合、図13Cに示す振幅差ΔWまたは位相差ΔΦを特徴量とすればよい。振幅差ΔWは、図13Aの送信信号Fのレベルと図13Bに示す測定信号S2のレベルとの差(振幅減衰幅)を示す。位相差ΔΦは、送信信号Fに対する測定信号S2のレベルの位相遅れを示す。尚、第1モードでは、関係情報生成部55は、部分遅延時間DL12に代えて、測定信号S1の特定周波数における振幅差または位相差を第1特徴量として関係情報を生成すればよい。従って、図6の縦軸は、測定信号S1の特定周波数における振幅差または位相差となる。即ち、この変形例では、関係情報は、振幅差または位相差と第1伝搬遅延時間DL11との関係式あるいは対応表となる。
第2モードでは、信号処理ユニット50は、この関係情報に、特定周波数の測定信号の振幅差ΔWまたは位相差ΔΦを第2特徴量として適用することによって、媒質Mの伝搬遅延時間DL21を算出する。このように、特徴量は、特定周波数における測定信号の振幅差または位相差であってもよい。
尚、特定周波数は、周波数が高いほど、伝搬遅延時間に対する位相差ΔΦが大きくなる。このため、測定精度を向上させるために、特定周波数は高周波数であることが好ましい。一方、位相差ΔΦが360度以上回転することがあるため、特定周波数が高いと、測定不能となるおそれもある。従って、第2周波数帯域FB2には、複数の特定周波数を用いることが好ましい。これにより、位相回転によって測定不能になる事態を抑制することができる。あるいは、特定周波数における測定信号の振幅差および位相差の両方を特徴量として用いてもよい。
(特徴量の変形例)
図13A~図13Cを参照して説明したように、特徴量は、伝搬遅延時間に限定されず、振幅差または位相差であってもよい。さらに、特徴量は、測定信号S2の周波数特性の形状、伝搬遅延時間の時間波形であってもよい。
図13A~図13Cを参照して説明したように、特徴量は、伝搬遅延時間に限定されず、振幅差または位相差であってもよい。さらに、特徴量は、測定信号S2の周波数特性の形状、伝搬遅延時間の時間波形であってもよい。
(周波数特性の形状)
例えば、図14Aは、測定信号S1の周波数特性を示す図である。図14Bは、測定信号S1から得られた第1伝搬遅延時間DL11を示す図である。信号処理ユニット50は、図14Aの周波数特性のうち第2周波数帯域FB2の特性を抜き出し、第1伝搬遅延時間DL11と関連付けてメモリ54に格納する。第1モードでは、ステップ102~105を繰り返すごとに、第2周波数帯域FB2の特性と第1伝搬遅延時間DL11との関係情報が格納されていく。これにより、複数の関係情報がメモリ54に格納される。
例えば、図14Aは、測定信号S1の周波数特性を示す図である。図14Bは、測定信号S1から得られた第1伝搬遅延時間DL11を示す図である。信号処理ユニット50は、図14Aの周波数特性のうち第2周波数帯域FB2の特性を抜き出し、第1伝搬遅延時間DL11と関連付けてメモリ54に格納する。第1モードでは、ステップ102~105を繰り返すごとに、第2周波数帯域FB2の特性と第1伝搬遅延時間DL11との関係情報が格納されていく。これにより、複数の関係情報がメモリ54に格納される。
第2モードにおいて、信号処理ユニット50は、第2周波数帯域FB2の測定信号S2を取得すると、測定信号S2の波形に近い特性を有する関係情報を検索する。そして、信号処理ユニット50は、検索でヒットした関係情報から第1伝搬遅延時間DL11を得る。信号処理ユニット50は、その関係情報から得た第1伝搬遅延時間DL11を補正遅延時間DL21として媒質Mの比誘電率および水分量を算出すればよい。本変形例では、第2モードにおいて、信号処理ユニット50は、第2伝搬遅延時間DL22を算出する必要が無い。従って、信号処理ユニット50の負荷が軽減され得る。
(伝搬遅延時間の時間波形)
例えば、図15Aは、図5Eと同様に、部分遅延時間DL12の時間波形を示す図である。図15Bは、図5Cと同様に、第1伝搬遅延時間DL11の時間波形を示す図である。この変形例では、信号処理ユニット50は、図15Aの部分遅延時間DL12の時間波形を第1伝搬遅延時間DL11と関連付けてメモリ54に格納する。第1モードでは、ステップ102~105を繰り返すごとに、部分遅延時間DL12の波形と第1伝搬遅延時間DL11との関係情報が格納されていく。これにより、複数の関係情報がメモリ54に格納される。
例えば、図15Aは、図5Eと同様に、部分遅延時間DL12の時間波形を示す図である。図15Bは、図5Cと同様に、第1伝搬遅延時間DL11の時間波形を示す図である。この変形例では、信号処理ユニット50は、図15Aの部分遅延時間DL12の時間波形を第1伝搬遅延時間DL11と関連付けてメモリ54に格納する。第1モードでは、ステップ102~105を繰り返すごとに、部分遅延時間DL12の波形と第1伝搬遅延時間DL11との関係情報が格納されていく。これにより、複数の関係情報がメモリ54に格納される。
第2モードにおいて、信号処理ユニット50は、第2周波数帯域FB2の測定信号S2から、部分遅延時間DL22の時間波形を得て、部分遅延時間DL22の時間波形に近い波形を有する関係情報を検索する。そして、信号処理ユニット50は、検索でヒットした関係情報から第1伝搬遅延時間DL11を得る。信号処理ユニット50は、その関係情報から得た第1伝搬遅延時間DL11を補正遅延時間DL21として媒質Mの比誘電率および水分量を算出すればよい。
このように、センサ装置10は、測定信号S2の周波数特性の形状または伝搬遅延時間の時間波形を特徴量としてもよい。
(マルチパスについて)
図16Aは、第1モードにおける第1伝搬遅延時間DL11の一例を示すグラフである。図16Bは、第2モードにおける第2伝搬遅延時間DL22の一例を示すグラフである。電磁波EWが媒質Mを複数経路(マルチパス)で伝搬する場合、第1モードの分解能は比較的高いので、図16Aに示すように、第1伝搬遅延時間DL11には複数のピークが現れる。この場合、マルチパスを明確に判別することができ、各経路の波形を容易に分離することができる。
図16Aは、第1モードにおける第1伝搬遅延時間DL11の一例を示すグラフである。図16Bは、第2モードにおける第2伝搬遅延時間DL22の一例を示すグラフである。電磁波EWが媒質Mを複数経路(マルチパス)で伝搬する場合、第1モードの分解能は比較的高いので、図16Aに示すように、第1伝搬遅延時間DL11には複数のピークが現れる。この場合、マルチパスを明確に判別することができ、各経路の波形を容易に分離することができる。
一方、第2モードの分解能は比較的低いので、図16Bに示すように、第2伝搬遅延時間DL22では複数のピークが重複してしまい、マルチパスを明確に判別することができない。この場合、第2伝搬遅延時間DL22は、主経路の伝搬遅延時間に対して或る程度ずれる。
このような場合、第1モードにおいて、信号処理ユニット50は、マルチパスのうち主経路の第1伝搬遅延時間DL11を算出する。これとともに、信号処理ユニット50は、マルチパスの影響を含めた状態で第2周波数帯域の測定信号の部分を測定信号S1から抜き出して、部分遅延時間DL12を算出する。関係情報は、ステップ106を実行することにより導出される。これにより、関係情報は、主系路のみの影響を含む第1伝搬遅延時間DL11と、マルチパスの影響を含む部分遅延時間DL12との関係を示すことになる。
従って、第2モードにおいて、信号処理ユニット50は、第2伝搬遅延時間DL22がマルチパスの影響を含んでいても、関係情報を用いて主系路のみを考慮した補正遅延時間DL21を算出することができる。このように、本実施形態によるセンサ装置10は、マルチパスの影響を排除して、主経路の補正遅延時間DL21を分離して求めることができる。
(プローブについて)
図17は、プローブ21、22の変形例を示す概略図である。図18は、本変形例のプローブ21または22の先端部の構成例を示す概略図である。
図17は、プローブ21、22の変形例を示す概略図である。図18は、本変形例のプローブ21または22の先端部の構成例を示す概略図である。
送信用プローブ21及び受信用プローブ22は、芯線部C1とシールド部C2とを有する同軸ケーブルで構成される。芯線部C1は銅線で構成され、シールド部C2は銅パイプで構成されるが、シールド部C2は銅線のメッシュ体で構成されてもよい。シールド部C2の外表面は、絶縁材料で構成された保護層(図示せず)で被覆され、その外側には電磁波吸収材を含有するスリーブ24を有する。さらに、スリーブ24の外側には、先端が尖ったカバー25が設けられている。カバー25は、媒質M内に送信用プローブ21及び受信用プローブ22を容易に挿入可能にし、かつ、芯線部C1およびシールド部C2を保護するために設けられている。芯線部C1およびシールド部C2の先端部は、スリーブ24から露出されており、アンテナ部210、220を構成している。
図18に示すように、芯線部C1は、シールド部C2の内側に設けられた内側部C1_1と、シールド部C2の先端から突出した先端部C1_2と、内側部C1_1およびシールド部C2の間に設けられた絶縁体26とを備えている。内側部C1_1および先端部C1_2には、例えば、銅のような導電体が用いられている。絶縁体26には、例えば、所定の比誘電率を有するテフロンやポリエチレン等を用いている。
内側部C1_1は、シールド部C2の内径よりも小さな外径を有し、シールド部C2から離間し絶縁されている。また、先端部C1_2は、シールド部C2の内径よりも大きいが、シールド部C2の外側に突出しており、シールド部C2から離間するように設けられている。従って、芯線部C1は、シールド部C2から電気的に絶縁されている。
このような構成によるプローブ21、22を用いることによって、放射効率を上げることができる。
本技術に係る実施形態は、上記実施形態に限定されるものではなく、本技術の要旨を逸脱しない範囲において種々の変更が可能である。
(1)
送信用の第1アンテナ部を有する第1プローブと、
前記第1プローブと所定の距離をおいて対向する受信用の第2アンテナ部を有する第2プローブと、
前記第1および第2アンテナ部の間の媒質中での電磁波の伝搬特性に関する情報を含む測定信号を測定する測定部と、
前記測定信号から得られる特徴量に基づいて前記媒質の特性情報を算出する演算部と、を備え、
第1モードにおいて、前記測定部は前記媒質中を伝搬する電磁波の第1周波数帯域における前記測定信号を測定し、前記演算部は前記第1周波数帯域の測定信号から得られる第1特徴量に基づいて前記媒質の特性情報を算出し、
第2モードにおいて、前記測定部は前記電磁波の前記第1周波数帯域の一部分である第2周波数帯域における前記測定信号を測定し、前記演算部は前記第2周波数帯域の測定信号から得られる第2特徴量に基づいて前記媒質の特性情報を算出する、検出装置。
(2)
前記第1モードにおいて、前記演算部は、前記第1周波数帯域における前記測定信号のうち前記第2周波数帯域の測定信号から得られる部分特徴量に基づいて、前記第1特徴量と前記部分特徴量との関係情報を生成し、
前記第2モードにおいて、前記演算部は、前記関係情報に前記第2特徴量を適用することによって、前記媒質の特性情報を算出する、(1)に記載の検出装置。
(3)
前記第2周波数帯域は、前記第1周波数帯域のうち前記測定信号の強度が最大となるピーク周波数を含む帯域である、(1)または(2)に記載の検出装置。
(4)
前記第1モードにおいて、前記測定部は、前記電磁波を第1周波数間隔で測定し、
前記第2モードにおいて、前記測定部は、前記電磁波を前記第1周波数間隔よりも広い第2周波数間隔で測定する、(1)または(2)に記載の検出装置。
(5)
前記第2周波数帯域の広さは、前記第1周波数帯域の広さとほぼ等しい、請求項4に記載の検出装置。
(6)
前記第2周波数帯域は、前記第1周波数帯域内の特定周波数である、(1)または(2)に記載の検出装置。
(7)
前記特徴量は、前記第1および第2アンテナ部間の前記電磁波の伝搬遅延時間、該電磁波の周波数特性の形状、または、該電磁波の周波数特性に基づいて得られた伝搬遅延時間の波形である、(1)から(5)のいずれか一項に記載の検出装置。
(8)
前記特徴量は、前記特定周波数における前記電磁波の位相または振幅である、(6)に記載の検出装置。
(9)
前記演算部は、
前記測定信号に基づいて前記第1及び第2のプローブ間における電磁波の伝搬遅延時間を前記特徴量として算出する遅延時間算出部と、
前記伝搬遅延時間に基づいて前記媒質の比誘電率を前記特性情報として算出する比誘電率算出部と、
前記比誘電率に基づいて前記媒質中の水分量を算出する水分量算出部と、
前記関係情報を生成する関係情報生成部(55)と、を備える、(2)から(8)のいずれか一項に記載の検出装置。
(10)
前記第1モードにおいて、前記演算部は、前記第1周波数帯域における前記測定信号に基づいて第1伝搬遅延時間を算出し、前記第1周波数帯域における前記測定信号のうち前記第2周波数帯域の測定信号から得られる部分遅延時間を算出し、前記第1伝搬遅延時間および前記部分遅延時間を用いて前記関係情報を生成し、
前記第2モードにおいて、前記演算部は、前記第2周波数帯域における前記測定信号に基づいて第2伝搬遅延時間を算出し、前記第2伝搬遅延時間を前記関係情報に適用することによって該第2伝搬遅延時間を前記第1周波数帯域の伝搬遅延時間へ換算した補正遅延時間を生成し、前記補正遅延時間を用いて前記媒質の比誘電率および該媒質中の水分量を算出する、(9)に記載の検出装置。
(11)
前記第1モードと前記第2モードとを切り替えるモード切替部をさらに備えた、(1)から(10)のいずれか一項に記載の検出装置。
(12)
前記第2周波数帯域は、前記第1周波数帯域のうち前記測定信号のレベルの上限が他の周波数帯域のレベルの上限よりも高く、
前記第1アンテナ部は、前記第2周波数帯域において、前記第1周波数帯域の他の周波数帯域よりも前記測定信号のレベルを高くする、(1)から(11)のいずれか一項に記載の検出装置。
(13)
送信用の第1アンテナ部を有する第1プローブと、前記第1プローブと所定の距離をおいて対向する受信用の第2アンテナ部を有する第2プローブと、前記第1および第2アンテナ部の間の媒質中での電磁波の伝搬特性に関する情報を含む測定信号を測定する測定部と、前記測定信号から得られる特徴量に基づいて前記媒質の特性情報を算出する演算部と、を備えた検出装置を用いた検出方法であって、
第1モードにおいて、前記媒質中を伝搬する電磁波の第1周波数帯域における前記測定信号を測定し、前記演算部は前記第1周波数帯域の測定信号から得られる第1特徴量に基づいて前記媒質の特性情報を算出し、
第2モードにおいて、前記電磁波の前記第1周波数帯域の一部分である第2周波数帯域における前記測定信号を測定し、前記演算部は前記第2周波数帯域の測定信号から得られる第2特徴量に基づいて前記媒質の特性情報を算出することを具備する検出方法。
(14)
前記第1モードにおいて、前記演算部は、前記第1周波数帯域における前記測定信号のうち前記第2周波数帯域の測定信号から得られる部分特徴量に基づいて、前記第1特徴量と前記部分特徴量との関係情報を生成し、
前記第2モードにおいて、前記演算部は、前記関係情報に前記第2特徴量を適用することによって、前記媒質の特性情報を算出する、(13)に記載の検出方法。
(15)
前記第2周波数帯域は、前記第1周波数帯域のうち前記測定信号の強度が最大となるピーク周波数を含む帯域である、(13)または(14)に記載の検出方法。
(16)
前記第1モードにおいて、前記測定部は、前記電磁波を第1周波数間隔で測定し、
前記第2モードにおいて、前記測定部は、前記電磁波を前記第1周波数間隔よりも広い第2周波数間隔で測定する、(13)から(15)のいずれか一項に記載の検出方法。
(17)
前記第2周波数帯域の広さは、前記第1周波数帯域の広さとほぼ等しい、(16)に記載の検出方法。
(18)
前記第2周波数帯域は、前記第1周波数帯域内の特定周波数である、(13)または(14)に記載の検出方法。
(19)
前記特徴量は、前記第1および第2アンテナ部間の電磁波の伝搬遅延時間、該電磁波の周波数特性の形状、または、該電磁波の周波数特性に基づいて得られた伝搬遅延時間の波形である、(13)から(17)のいずれか一項に記載の検出方法。
(20)
前記特徴量は、前記特定周波数における前記電磁波の位相または振幅である、(18)に記載の検出方法。
(21)
前記第1モードにおいて、前記演算部は、前記第1周波数帯域における前記測定信号に基づいて第1伝搬遅延時間を算出し、前記第1周波数帯域における前記測定信号のうち前記第2周波数帯域の測定信号から得られる部分遅延時間を算出し、前記第1伝搬遅延時間および前記部分遅延時間を用いて前記関係情報を生成し、
前記第2モードにおいて、前記演算部は、前記第2周波数帯域における前記測定信号に基づいて第2伝搬遅延時間を算出し、前記第2伝搬遅延時間を前記関係情報に適用することによって該第2伝搬遅延時間を前記第1周波数帯域の伝搬遅延時間へ換算した補正遅延時間を生成し、前記補正遅延時間を用いて前記媒質の比誘電率および該媒質中の水分量を算出する、(14)から(20)のいずれか一項に記載の検出方法。
(22)
前記第2周波数帯域は、前記第1周波数帯域のうち前記測定信号のレベルの上限が他の周波数帯域のレベルの上限よりも高く、
前記第1アンテナ部は、前記第2周波数帯域において、前記第1周波数帯域の他の周波数帯域よりも前記測定信号のレベルを高くする、(13)から(21)のいずれか一項に記載の方法。
尚、本開示は、上述した実施形態に限定されるものではなく、本開示の要旨を逸脱しない範囲において種々の変更が可能である。また、本明細書に記載された効果はあくまで例示であって限定されるものでは無く、他の効果があってもよい。
10 センサ装置、20 センサヘッド、30 測定ユニット、21 送信用プローブ、22受信用プローブ、31 信号生成部、32 通信部、310 制御部、311 信号発生器、313 位相シフタ、315 混合器、50 信号処理ユニット、51 遅延時間算出部、52 比誘電率算出部、53 水分量算出部、54 メモリ、55 関係情報生成部、56、57 モード切替部、DL11 第1伝搬遅延時間、DL12 部分遅延時間、DL22 第2伝搬遅延時間、DL21 補正遅延時間、FB1 第1周波数帯域、FB2 第2周波数帯域
Claims (22)
- 送信用の第1アンテナ部を有する第1プローブと、
前記第1プローブと所定の距離をおいて対向する受信用の第2アンテナ部を有する第2プローブと、
前記第1および第2アンテナ部の間の媒質中での電磁波の伝搬特性に関する情報を含む測定信号を測定する測定部と、
前記測定信号から得られる特徴量に基づいて前記媒質の特性情報を算出する演算部と、を備え、
第1モードにおいて、前記測定部は前記媒質中を伝搬する電磁波の第1周波数帯域における前記測定信号を測定し、前記演算部は前記第1周波数帯域の測定信号から得られる第1特徴量に基づいて前記媒質の特性情報を算出し、
第2モードにおいて、前記測定部は前記電磁波の前記第1周波数帯域の一部分である第2周波数帯域における前記測定信号を測定し、前記演算部は前記第2周波数帯域の測定信号から得られる第2特徴量に基づいて前記媒質の特性情報を算出する、検出装置。 - 前記第1モードにおいて、前記演算部は、前記第1周波数帯域における前記測定信号のうち前記第2周波数帯域の測定信号から得られる部分特徴量に基づいて、前記第1特徴量と前記部分特徴量との関係情報を生成し、
前記第2モードにおいて、前記演算部は、前記関係情報に前記第2特徴量を適用することによって、前記媒質の特性情報を算出する、請求項1に記載の検出装置。 - 前記第2周波数帯域は、前記第1周波数帯域のうち前記測定信号の強度が最大となるピーク周波数を含む帯域である、請求項1に記載の検出装置。
- 前記第1モードにおいて、前記測定部は、前記電磁波を第1周波数間隔で測定し、
前記第2モードにおいて、前記測定部は、前記電磁波を前記第1周波数間隔よりも広い第2周波数間隔で測定する、請求項1に記載の検出装置。 - 前記第2周波数帯域の広さは、前記第1周波数帯域の広さとほぼ等しい、請求項4に記載の検出装置。
- 前記第2周波数帯域は、前記第1周波数帯域内の特定周波数である、請求項1に記載の検出装置。
- 前記特徴量は、前記第1および第2アンテナ部間の前記電磁波の伝搬遅延時間、該電磁波の周波数特性の形状、または、該電磁波の周波数特性に基づいて得られた伝搬遅延時間の波形である、請求項1に記載の検出装置。
- 前記特徴量は、前記特定周波数における前記電磁波の位相または振幅である、請求項6に記載の検出装置。
- 前記演算部は、
前記測定信号に基づいて前記第1及び第2のプローブ間における電磁波の伝搬遅延時間を前記特徴量として算出する遅延時間算出部と、
前記伝搬遅延時間に基づいて前記媒質の比誘電率を前記特性情報として算出する比誘電率算出部と、
前記比誘電率に基づいて前記媒質中の水分量を算出する水分量算出部と、
前記関係情報を生成する関係情報生成部と、を備える、請求項2に記載の検出装置。 - 前記第1モードにおいて、前記演算部は、前記第1周波数帯域における前記測定信号に基づいて第1伝搬遅延時間を算出し、前記第1周波数帯域における前記測定信号のうち前記第2周波数帯域の測定信号から得られる部分遅延時間を算出し、前記第1伝搬遅延時間および前記部分遅延時間を用いて前記関係情報を生成し、
前記第2モードにおいて、前記演算部は、前記第2周波数帯域における前記測定信号に基づいて第2伝搬遅延時間を算出し、前記第2伝搬遅延時間を前記関係情報に適用することによって該第2伝搬遅延時間を前記第1周波数帯域の伝搬遅延時間へ換算した補正遅延時間を生成し、前記補正遅延時間を用いて前記媒質の比誘電率および該媒質中の水分量を算出する、請求項9に記載の検出装置。 - 前記第1モードと前記第2モードとを切り替えるモード切替部をさらに備えた、請求項1に記載の検出装置。
- 前記第2周波数帯域は、前記第1周波数帯域のうち前記測定信号のレベルの上限が他の周波数帯域における前記測定信号のレベルの上限よりも高く、
前記第1アンテナ部は、前記第2周波数帯域において、前記第1周波数帯域の他の周波数帯域よりも前記測定信号のレベルを高くする、請求項1に記載の検出装置。 - 送信用の第1アンテナ部を有する第1プローブと、前記第1プローブと所定の距離をおいて対向する受信用の第2アンテナ部を有する第2プローブと、前記第1および第2アンテナ部の間の媒質中での電磁波の伝搬特性に関する情報を含む測定信号を測定する測定部と、前記測定信号から得られる特徴量に基づいて前記媒質の特性情報を算出する演算部と、を備えた検出装置を用いた検出方法であって、
第1モードにおいて、前記媒質中を伝搬する電磁波の第1周波数帯域における前記測定信号を測定し、前記演算部は前記第1周波数帯域の測定信号から得られる第1特徴量に基づいて前記媒質の特性情報を算出し、
第2モードにおいて、前記電磁波の前記第1周波数帯域の一部分である第2周波数帯域における前記測定信号を測定し、前記演算部は前記第2周波数帯域の測定信号から得られる第2特徴量に基づいて前記媒質の特性情報を算出することを具備する検出方法。 - 前記第1モードにおいて、前記演算部は、前記第1周波数帯域における前記測定信号のうち前記第2周波数帯域の測定信号から得られる部分特徴量に基づいて、前記第1特徴量と前記部分特徴量との関係情報を生成し、
前記第2モードにおいて、前記演算部は、前記関係情報に前記第2特徴量を適用することによって、前記媒質の特性情報を算出する、請求項13に記載の検出方法。 - 前記第2周波数帯域は、前記第1周波数帯域のうち前記測定信号の強度が最大となるピーク周波数を含む帯域である、請求項13に記載の検出方法。
- 前記第1モードにおいて、前記測定部は、前記電磁波を第1周波数間隔で測定し、
前記第2モードにおいて、前記測定部は、前記電磁波を前記第1周波数間隔よりも広い第2周波数間隔で測定する、請求項13に記載の検出方法。 - 前記第2周波数帯域の広さは、前記第1周波数帯域の広さとほぼ等しい、請求項16に記載の検出方法。
- 前記第2周波数帯域は、前記第1周波数帯域内の特定周波数である、請求項13に記載の検出方法。
- 前記特徴量は、前記第1および第2アンテナ部間の電磁波の伝搬遅延時間、該電磁波の周波数特性の形状、または、該電磁波の周波数特性に基づいて得られた伝搬遅延時間の波形である、請求項13に記載の検出方法。
- 前記特徴量は、前記特定周波数における前記電磁波の位相または振幅である、請求項18に記載の検出方法。
- 前記第1モードにおいて、前記演算部は、前記第1周波数帯域における前記測定信号に基づいて第1伝搬遅延時間を算出し、前記第1周波数帯域における前記測定信号のうち前記第2周波数帯域の測定信号から得られる部分遅延時間を算出し、前記第1伝搬遅延時間および前記部分遅延時間を用いて前記関係情報を生成し、
前記第2モードにおいて、前記演算部は、前記第2周波数帯域における前記測定信号に基づいて第2伝搬遅延時間を算出し、前記第2伝搬遅延時間を前記関係情報に適用することによって該第2伝搬遅延時間を前記第1周波数帯域の伝搬遅延時間へ換算した補正遅延時間を生成し、前記補正遅延時間を用いて前記媒質の比誘電率および該媒質中の水分量を算出する、請求項14に記載の検出方法。 - 前記第2周波数帯域は、前記第1周波数帯域のうち前記測定信号のレベルの上限が他の周波数帯域における前記測定信号のレベルの上限よりも高く、
前記第1アンテナ部は、前記第2周波数帯域において、前記第1周波数帯域の他の周波数帯域よりも前記測定信号のレベルを高くする、請求項13に記載の方法。
Priority Applications (2)
| Application Number | Priority Date | Filing Date | Title |
|---|---|---|---|
| EP21792320.0A EP4141424A4 (en) | 2020-04-20 | 2021-03-17 | DETECTION DEVICE AND DETECTION METHOD |
| US17/995,574 US12099020B2 (en) | 2020-04-20 | 2021-03-17 | Detection device and detection method |
Applications Claiming Priority (2)
| Application Number | Priority Date | Filing Date | Title |
|---|---|---|---|
| JP2020-074863 | 2020-04-20 | ||
| JP2020074863A JP2023076774A (ja) | 2020-04-20 | 2020-04-20 | 検出装置および検出方法 |
Publications (1)
| Publication Number | Publication Date |
|---|---|
| WO2021215151A1 true WO2021215151A1 (ja) | 2021-10-28 |
Family
ID=78269409
Family Applications (1)
| Application Number | Title | Priority Date | Filing Date |
|---|---|---|---|
| PCT/JP2021/010948 Ceased WO2021215151A1 (ja) | 2020-04-20 | 2021-03-17 | 検出装置および検出方法 |
Country Status (4)
| Country | Link |
|---|---|
| US (1) | US12099020B2 (ja) |
| EP (1) | EP4141424A4 (ja) |
| JP (1) | JP2023076774A (ja) |
| WO (1) | WO2021215151A1 (ja) |
Cited By (1)
| Publication number | Priority date | Publication date | Assignee | Title |
|---|---|---|---|---|
| EP4524580A4 (en) * | 2022-05-13 | 2025-08-13 | Sony Group Corp | SENSOR DEVICE, INFORMATION PROCESSING DEVICE, INFORMATION PROCESSING METHOD, AND PROGRAM |
Families Citing this family (3)
| Publication number | Priority date | Publication date | Assignee | Title |
|---|---|---|---|---|
| US12467880B2 (en) * | 2020-11-12 | 2025-11-11 | Sony Group Corporation | Sensor device |
| US12140551B2 (en) * | 2021-07-23 | 2024-11-12 | The Regents Of The University Of Colorado, A Body Corporate | Radiometer and radiometer-based soil moisture determination method |
| CN117250410B (zh) * | 2023-09-25 | 2025-09-16 | 电子科技大学 | 基于延迟线与电调滤波器的多频电磁波信号特征测试系统 |
Citations (10)
| Publication number | Priority date | Publication date | Assignee | Title |
|---|---|---|---|---|
| JPH06324162A (ja) * | 1993-05-17 | 1994-11-25 | Kawasaki Chishitsu Kk | 地中レーダトモグラフィ方法及び装置 |
| JP2000146867A (ja) * | 1998-11-11 | 2000-05-26 | Nireco Corp | 土壌の水分計測装置 |
| JP2003329613A (ja) * | 2002-05-15 | 2003-11-19 | Shinku Rei:Kk | 物性測定装置 |
| JP2011191208A (ja) * | 2010-03-15 | 2011-09-29 | Toru Mino | 土壌水分測定方法及び土壌水分測定装置 |
| JP2014200030A (ja) * | 2013-03-29 | 2014-10-23 | 富士通株式会社 | 受信機および同期補正方法 |
| JP2017143459A (ja) * | 2016-02-12 | 2017-08-17 | 国立研究開発法人産業技術総合研究所 | 伝搬遅延特性の測定方法および装置 |
| CN107966476A (zh) * | 2017-11-16 | 2018-04-27 | 太原理工大学 | 一种混沌时域反射土壤含水量测量装置及方法 |
| WO2018221051A1 (ja) | 2017-06-02 | 2018-12-06 | ソニー株式会社 | センサ装置、水分量測定装置、水分量測定方法、情報処理装置および情報処理方法 |
| JP2018207403A (ja) * | 2017-06-08 | 2018-12-27 | 富士通株式会社 | 無線通信装置および遅延調整方法 |
| CN109342515A (zh) * | 2018-11-29 | 2019-02-15 | 中国水利水电第七工程局有限公司 | 基于tdt与相位比较的混凝土拌合物含湿率测量装置及其测量方法 |
Family Cites Families (5)
| Publication number | Priority date | Publication date | Assignee | Title |
|---|---|---|---|---|
| US4817021A (en) * | 1985-01-24 | 1989-03-28 | Commonwealth Scientific And Industrial Research Organisation | Moisture and density determination |
| US5315258A (en) | 1989-01-13 | 1994-05-24 | Kajaani Elektroniikka Oy | Method and apparatus for determining the moisture content of a material |
| US6215317B1 (en) * | 1999-04-27 | 2001-04-10 | Purdue Research Foundation | Method and apparatus for measuring in-place density and moisture content |
| US6963205B2 (en) * | 2002-08-21 | 2005-11-08 | Lundstrom John W | Electrically measuring soil dry density |
| DE10350224B4 (de) | 2003-10-27 | 2007-07-26 | Sartorius Ag | Verfahren zur Bestimmung von Feuchte und Dichte eines dielelektrischen Materials |
-
2020
- 2020-04-20 JP JP2020074863A patent/JP2023076774A/ja active Pending
-
2021
- 2021-03-17 EP EP21792320.0A patent/EP4141424A4/en not_active Withdrawn
- 2021-03-17 US US17/995,574 patent/US12099020B2/en active Active
- 2021-03-17 WO PCT/JP2021/010948 patent/WO2021215151A1/ja not_active Ceased
Patent Citations (10)
| Publication number | Priority date | Publication date | Assignee | Title |
|---|---|---|---|---|
| JPH06324162A (ja) * | 1993-05-17 | 1994-11-25 | Kawasaki Chishitsu Kk | 地中レーダトモグラフィ方法及び装置 |
| JP2000146867A (ja) * | 1998-11-11 | 2000-05-26 | Nireco Corp | 土壌の水分計測装置 |
| JP2003329613A (ja) * | 2002-05-15 | 2003-11-19 | Shinku Rei:Kk | 物性測定装置 |
| JP2011191208A (ja) * | 2010-03-15 | 2011-09-29 | Toru Mino | 土壌水分測定方法及び土壌水分測定装置 |
| JP2014200030A (ja) * | 2013-03-29 | 2014-10-23 | 富士通株式会社 | 受信機および同期補正方法 |
| JP2017143459A (ja) * | 2016-02-12 | 2017-08-17 | 国立研究開発法人産業技術総合研究所 | 伝搬遅延特性の測定方法および装置 |
| WO2018221051A1 (ja) | 2017-06-02 | 2018-12-06 | ソニー株式会社 | センサ装置、水分量測定装置、水分量測定方法、情報処理装置および情報処理方法 |
| JP2018207403A (ja) * | 2017-06-08 | 2018-12-27 | 富士通株式会社 | 無線通信装置および遅延調整方法 |
| CN107966476A (zh) * | 2017-11-16 | 2018-04-27 | 太原理工大学 | 一种混沌时域反射土壤含水量测量装置及方法 |
| CN109342515A (zh) * | 2018-11-29 | 2019-02-15 | 中国水利水电第七工程局有限公司 | 基于tdt与相位比较的混凝土拌合物含湿率测量装置及其测量方法 |
Non-Patent Citations (2)
| Title |
|---|
| ASHI HAYASHI: "Study of Applicability on existing structures of reinforced concrete salinity measurement methods using electromagnetic waves", PROCEEDINGS OF THE JAPAN CONCRETE INSTITUTE, vol. 26, 31 December 2003 (2003-12-31), JP , pages 119 - 120, XP009540847, ISSN: 1347-7560 * |
| See also references of EP4141424A4 |
Cited By (1)
| Publication number | Priority date | Publication date | Assignee | Title |
|---|---|---|---|---|
| EP4524580A4 (en) * | 2022-05-13 | 2025-08-13 | Sony Group Corp | SENSOR DEVICE, INFORMATION PROCESSING DEVICE, INFORMATION PROCESSING METHOD, AND PROGRAM |
Also Published As
| Publication number | Publication date |
|---|---|
| US12099020B2 (en) | 2024-09-24 |
| EP4141424A4 (en) | 2023-10-18 |
| US20230194440A1 (en) | 2023-06-22 |
| EP4141424A1 (en) | 2023-03-01 |
| JP2023076774A (ja) | 2023-06-02 |
Similar Documents
| Publication | Publication Date | Title |
|---|---|---|
| WO2021215151A1 (ja) | 検出装置および検出方法 | |
| JP7133584B2 (ja) | センサ装置、水分量測定装置、水分量測定方法、情報処理装置および情報処理方法 | |
| US9615274B2 (en) | Plane wave generation within a small volume of space for evaluation of wireless devices | |
| JP7747129B2 (ja) | 測定装置、測定システム、および、測定方法 | |
| JP5568237B2 (ja) | 三次元位置推定システム、及び、ダイポールアレイアンテナ | |
| JP7674254B2 (ja) | センサ装置および水分量測定装置 | |
| JP5952168B2 (ja) | 液位測定装置 | |
| JP2022110737A (ja) | 測定装置、及び測定方法 | |
| Kurokawa et al. | Measurement and uncertainty analysis of free-space antenna factors of a log-periodic antenna using time-domain techniques | |
| CN102768309A (zh) | 采用频率差分技术消减天线测试环境中多径干扰的方法 | |
| CN101477153B (zh) | 高频电场测试仪 | |
| CN119804560B (zh) | 基于传输参数的土壤含水率测试方法 | |
| CN102768310A (zh) | 采用距离偏移技术消减天线测试环境中多径干扰的方法 | |
| Constantin et al. | A single-antenna calibration method | |
| JP2008145387A (ja) | 複素誘電率測定装置及び複素誘電率測定方法 | |
| JP2001074798A (ja) | 電磁波シールド特性測定評価装置 | |
| Ghattas et al. | In-Situ Monitoring Method for Direction Finding Antennas |
Legal Events
| Date | Code | Title | Description |
|---|---|---|---|
| 121 | Ep: the epo has been informed by wipo that ep was designated in this application |
Ref document number: 21792320 Country of ref document: EP Kind code of ref document: A1 |
|
| NENP | Non-entry into the national phase |
Ref country code: DE |
|
| ENP | Entry into the national phase |
Ref document number: 2021792320 Country of ref document: EP Effective date: 20221121 |
|
| NENP | Non-entry into the national phase |
Ref country code: JP |
|
| WWW | Wipo information: withdrawn in national office |
Ref document number: 2021792320 Country of ref document: EP |