WO2022014004A1 - 構造物評価システム、構造物評価装置及び構造物評価方法 - Google Patents
構造物評価システム、構造物評価装置及び構造物評価方法 Download PDFInfo
- Publication number
- WO2022014004A1 WO2022014004A1 PCT/JP2020/027652 JP2020027652W WO2022014004A1 WO 2022014004 A1 WO2022014004 A1 WO 2022014004A1 JP 2020027652 W JP2020027652 W JP 2020027652W WO 2022014004 A1 WO2022014004 A1 WO 2022014004A1
- Authority
- WO
- WIPO (PCT)
- Prior art keywords
- unit
- vehicle
- information
- impact
- evaluation
- Prior art date
- Legal status (The legal status is an assumption and is not a legal conclusion. Google has not performed a legal analysis and makes no representation as to the accuracy of the status listed.)
- Ceased
Links
Images


Classifications
-
- G—PHYSICS
- G01—MEASURING; TESTING
- G01N—INVESTIGATING OR ANALYSING MATERIALS BY DETERMINING THEIR CHEMICAL OR PHYSICAL PROPERTIES
- G01N29/00—Investigating or analysing materials by the use of ultrasonic, sonic or infrasonic waves; Visualisation of the interior of objects by transmitting ultrasonic or sonic waves through the object
- G01N29/44—Processing the detected response signal, e.g. electronic circuits specially adapted therefor
- G01N29/4445—Classification of defects
-
- G—PHYSICS
- G01—MEASURING; TESTING
- G01N—INVESTIGATING OR ANALYSING MATERIALS BY DETERMINING THEIR CHEMICAL OR PHYSICAL PROPERTIES
- G01N29/00—Investigating or analysing materials by the use of ultrasonic, sonic or infrasonic waves; Visualisation of the interior of objects by transmitting ultrasonic or sonic waves through the object
- G01N29/44—Processing the detected response signal, e.g. electronic circuits specially adapted therefor
- G01N29/4454—Signal recognition, e.g. specific values or portions, signal events, signatures
-
- G—PHYSICS
- G01—MEASURING; TESTING
- G01N—INVESTIGATING OR ANALYSING MATERIALS BY DETERMINING THEIR CHEMICAL OR PHYSICAL PROPERTIES
- G01N29/00—Investigating or analysing materials by the use of ultrasonic, sonic or infrasonic waves; Visualisation of the interior of objects by transmitting ultrasonic or sonic waves through the object
- G01N29/04—Analysing solids
- G01N29/043—Analysing solids in the interior, e.g. by shear waves
-
- G—PHYSICS
- G01—MEASURING; TESTING
- G01N—INVESTIGATING OR ANALYSING MATERIALS BY DETERMINING THEIR CHEMICAL OR PHYSICAL PROPERTIES
- G01N29/00—Investigating or analysing materials by the use of ultrasonic, sonic or infrasonic waves; Visualisation of the interior of objects by transmitting ultrasonic or sonic waves through the object
- G01N29/04—Analysing solids
- G01N29/045—Analysing solids by imparting shocks to the workpiece and detecting the vibrations or the acoustic waves caused by the shocks
-
- G—PHYSICS
- G01—MEASURING; TESTING
- G01N—INVESTIGATING OR ANALYSING MATERIALS BY DETERMINING THEIR CHEMICAL OR PHYSICAL PROPERTIES
- G01N29/00—Investigating or analysing materials by the use of ultrasonic, sonic or infrasonic waves; Visualisation of the interior of objects by transmitting ultrasonic or sonic waves through the object
- G01N29/04—Analysing solids
- G01N29/07—Analysing solids by measuring propagation velocity or propagation time of acoustic waves
-
- G—PHYSICS
- G01—MEASURING; TESTING
- G01N—INVESTIGATING OR ANALYSING MATERIALS BY DETERMINING THEIR CHEMICAL OR PHYSICAL PROPERTIES
- G01N29/00—Investigating or analysing materials by the use of ultrasonic, sonic or infrasonic waves; Visualisation of the interior of objects by transmitting ultrasonic or sonic waves through the object
- G01N29/14—Investigating or analysing materials by the use of ultrasonic, sonic or infrasonic waves; Visualisation of the interior of objects by transmitting ultrasonic or sonic waves through the object using acoustic emission techniques
-
- G—PHYSICS
- G01—MEASURING; TESTING
- G01N—INVESTIGATING OR ANALYSING MATERIALS BY DETERMINING THEIR CHEMICAL OR PHYSICAL PROPERTIES
- G01N29/00—Investigating or analysing materials by the use of ultrasonic, sonic or infrasonic waves; Visualisation of the interior of objects by transmitting ultrasonic or sonic waves through the object
- G01N29/22—Details, e.g. general constructional or apparatus details
- G01N29/32—Arrangements for suppressing undesired influences, e.g. temperature or pressure variations, compensating for signal noise
-
- G—PHYSICS
- G01—MEASURING; TESTING
- G01N—INVESTIGATING OR ANALYSING MATERIALS BY DETERMINING THEIR CHEMICAL OR PHYSICAL PROPERTIES
- G01N29/00—Investigating or analysing materials by the use of ultrasonic, sonic or infrasonic waves; Visualisation of the interior of objects by transmitting ultrasonic or sonic waves through the object
- G01N29/34—Generating the ultrasonic, sonic or infrasonic waves, e.g. electronic circuits specially adapted therefor
- G01N29/341—Generating the ultrasonic, sonic or infrasonic waves, e.g. electronic circuits specially adapted therefor with time characteristics
-
- G—PHYSICS
- G01—MEASURING; TESTING
- G01N—INVESTIGATING OR ANALYSING MATERIALS BY DETERMINING THEIR CHEMICAL OR PHYSICAL PROPERTIES
- G01N2291/00—Indexing codes associated with group G01N29/00
- G01N2291/02—Indexing codes associated with the analysed material
- G01N2291/023—Solids
- G01N2291/0232—Glass, ceramics, concrete or stone
-
- G—PHYSICS
- G01—MEASURING; TESTING
- G01N—INVESTIGATING OR ANALYSING MATERIALS BY DETERMINING THEIR CHEMICAL OR PHYSICAL PROPERTIES
- G01N2291/00—Indexing codes associated with group G01N29/00
- G01N2291/02—Indexing codes associated with the analysed material
- G01N2291/025—Change of phase or condition
- G01N2291/0258—Structural degradation, e.g. fatigue of composites, ageing of oils
-
- G—PHYSICS
- G01—MEASURING; TESTING
- G01N—INVESTIGATING OR ANALYSING MATERIALS BY DETERMINING THEIR CHEMICAL OR PHYSICAL PROPERTIES
- G01N2291/00—Indexing codes associated with group G01N29/00
- G01N2291/10—Number of transducers
- G01N2291/106—Number of transducers one or more transducer arrays
Definitions
- the embodiment of the present invention relates to a structure evaluation system, a structure evaluation device, and a structure evaluation method.
- elastic waves generated inside the structure can be detected. Furthermore, by installing multiple sensors on the surface of the structure, the position of the elastic wave source (hereinafter referred to as “elastic wave source”) can be determined based on the difference in the arrival times of the elastic waves detected by each of the multiple sensors. Can be calibrated. Elastic waves are also generated inside the structure when an impact is applied to the surface of the structure from the outside. Therefore, the position of the elastic wave source can be defined.
- the propagation path of elastic waves is damaged, the propagation of elastic waves is hindered. In such a case, the accuracy of the orientation result of the elastic wave source is lowered. Areas with internal damage when elastic waves are detected by sensors installed facing each other by applying a spatially uniform impact to the surface of a structure, such as a collision with a road surface caused by raindrops during rainfall. Then, the density of the elastic wave source is reduced and observed. Damage inside the structure can be detected by utilizing such characteristics. When a method of applying a uniformly applied impact to the surface of the structure is used, the distribution of the elastic wave source becomes uniform if there is no damage inside the structure. This method is based on the premise that a uniformly applied impact is applied to the surface of the structure. Therefore, if the impact applied to the surface of the structure is not uniform, the evaluation accuracy may decrease.
- the problem to be solved by the present invention is a structure evaluation system, a structure evaluation device, and a structure evaluation device capable of improving the evaluation accuracy of a structure even when the impact applied to the surface of the structure is not uniform. It is to provide a structure evaluation method.
- the structure evaluation system of the embodiment has a plurality of sensors, a position setting unit, a correction unit, and an evaluation unit.
- the plurality of sensors detect elastic waves generated from the structure.
- the position determining unit determines the position of the source of the plurality of elastic waves based on the plurality of elastic waves detected by each of the plurality of sensors.
- the correction unit corrects the information based on the position orientation by the position determination unit by using the correction value determined according to the impact.
- the evaluation unit evaluates the deteriorated state of the structure based on the corrected information.
- the figure for demonstrating the outline of the structure evaluation system in an embodiment The figure which shows an example of the elastic wave source density distribution generated based on the detection result of the elastic wave generated by the impact caused by the passage of a traveling part.
- Explanatory drawing when the non-uniform object is a sprinkle
- the structure evaluation system in the embodiment can improve the evaluation accuracy of the structure even when the impact applied to the surface of the structure (hereinafter referred to as “road surface”) is not spatially uniform. It is a system.
- the case where the impact applied to the road surface is not spatially uniform is the case where the position of the impact applied in a predetermined space is biased.
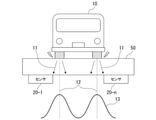
- the vehicle 10 passes through the road surface (the surface of the structure 50) as shown in FIG.
- FIG. 1 is a diagram for explaining an outline of the structure evaluation system in the embodiment.
- a load is applied to the road surface due to the contact between the traveling portion (for example, a tire) of the vehicle 10 and the road surface.
- the load on the road surface is caused by the traveling portion of the vehicle 10.
- the traveling portion of the vehicle 10 gives an impact to the road surface.
- elastic waves 11 are generated in the structure 50.
- no impact is applied to the region of the road surface where the traveling portion of the vehicle 10 does not pass.
- the elastic wave 11 is generated around the position 12 through which the traveling portion of the vehicle 10 has passed.
- the elastic wave 11 propagates in the structure 50 starting from the position 12.
- the elastic wave 11 propagating in the structure 50 is detected by a plurality of sensors 20-1 to 20-n (n is an integer of 3 or more). It is conceivable that the passing position of the vehicle 10 is different for each vehicle. However, depending on the width of the road, it is considered that many vehicles 10 pass through a certain fixed position.
- the frequency distribution of the impact applied positions due to the passage of the traveling portions of a large number of vehicles 10 can be expressed as, for example, the distribution 13 shown at the bottom of FIG.
- the horizontal axis represents the distance of the road width
- the vertical axis represents the frequency of impact.
- the frequency at which the impact is applied is highest at the position 12 where the traveling portion of the vehicle 10 is assumed to pass.
- the elastic wave source density distribution obtained in this case is such that the density of the elastic wave source is equal to or higher than the threshold value (for example, in a dense state) at a position where the traveling portion of the vehicle 10 frequently passes, and the traveling portion of the vehicle 10 passes less frequently.
- the distribution has a bias such that the density is less than the threshold value (for example, a sparse state).
- the elastic wave source density distribution obtained when the impact applied to the road surface is not spatially uniform has a low density of the elastic wave source even when there is no damage in the region where the impact is not applied.
- the density of elastic wave sources tends to be high even if the impacted area is damaged. That is, in the non-impacted region, the density of the elastic wave source is likely to be less than the threshold value even if there is no damage, and in the impacted region, the elastic wave source is elastic even if there is damage. There is a high possibility that the density of the wave source will exceed the threshold value.
- the undamaged region in the structure 50 is evaluated as the damaged region, and the structure is evaluated.
- the damaged area in the object 50 may be evaluated as a healthy area.
- the damaged area is an area where deterioration has occurred inside the structure 50.
- the deteriorated region is a region where a part of the inside of the structure 50 is damaged.
- a healthy area is an area that is not damaged or is damaged but is not expected to be affected by the damage.
- the conventional evaluation method is an evaluation method in which a region where the density of the elastic wave source is less than the threshold value is regarded as a damaged region.
- the conventional evaluation method is a method published in, for example, International Publication No. 2017/217834.
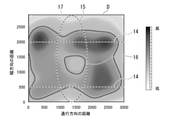
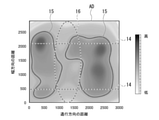
- FIG. 2 is a diagram showing an example of the elastic wave source density distribution D generated based on the detection result of the elastic wave 11 generated by the impact caused by the passage of the traveling portion.
- the horizontal axis represents the distance in the traffic direction of the vehicle
- the vertical axis represents the distance in the width direction.
- the dotted line 14 shown on the elastic wave source density distribution D represents the passing position of the traveling portion of the vehicle 10.
- a plurality of sensors for detecting the elastic wave 11 generated inside the structure 50 and a plurality of elastic wave sources based on the plurality of elastic waves 11 detected by each of the plurality of sensors are used.
- the correction unit that corrects the information based on the position orientation by the position orientation unit for example, elastic wave source density distribution
- the position orientation unit for example, elastic wave source density distribution
- the correction value determined according to the impact is used to correct the information so as to reduce the bias of the information based on the position orientation by the position determination unit. This makes it possible to reduce misdiagnosis. Therefore, even when the impact applied to the road surface is not uniform, it is possible to improve the evaluation accuracy of the structure 50.
- the details of the structure evaluation system 100 in the embodiment will be described.
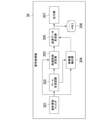
- FIG. 3 is a diagram showing the configuration of the structure evaluation system 100 in the first embodiment.
- the structure evaluation system 100 is used to evaluate the soundness of the structure 50.
- evaluation means determining the degree of soundness of the structure 50, that is, the deterioration state of the structure 50, based on a certain criterion.
- the structure 50 may be any structure as long as the elastic wave 11 is generated due to the generation or growth of cracks or an external impact (for example, rain, artificial rain, etc.).
- the structure 50 may be a bedrock.
- the bridge is not limited to a structure erected on a river or a valley, but also includes various structures (for example, a viaduct on a highway) provided above the ground.
- the thickness of the structure 50 is, for example, 15 cm or more.
- Damage that affects the evaluation of the deterioration state of the structure 50 includes damage inside the structure that hinders the propagation of elastic waves 11 such as cracks, cavities, and sedimentation.
- the cracks include vertical cracks, horizontal cracks, diagonal cracks, and the like.
- a vertical crack is a crack that occurs in the direction perpendicular to the road surface.
- Lateral cracks are cracks that occur in the horizontal direction with respect to the road surface.
- An oblique crack is a crack that occurs in a direction other than horizontal and vertical with respect to the road surface.
- Sedimentation is deterioration in which concrete changes to a sediment-like shape mainly at the boundary between asphalt and concrete deck.
- the structure evaluation system 100 includes a plurality of sensors 20-1 to 20-n, a signal processing unit 30, and a structure evaluation device 40. Each of the plurality of sensors 20-1 to 20-n and the signal processing unit 30 are connected by wire so as to be communicable. The signal processing unit 30 and the structure evaluation device 40 are communicably connected by wire or wirelessly. In the following description, when the sensors 20-1 to 20-n are not distinguished, the sensor 20 is described.
- the sensor 20 has a piezoelectric element and detects an elastic wave 11 generated from the inside of the structure 50.
- the sensor 20 is installed at a position on the surface of the structure 50 where the elastic wave 11 can be detected.
- the sensor 20 is installed on any surface of the road surface, the side surface, and the bottom surface.
- the sensor 20 converts the detected elastic wave 11 into an electric signal.
- a case where the sensor 20 is installed on the bottom surface of the structure 50 will be described as an example.
- a piezoelectric element having a sensitivity in the range of 10 kHz to 1 MHz is used.
- the sensor 20 has a type such as a resonance type having a resonance peak in the frequency range and a wide band type in which resonance is suppressed, but the type of the sensor 20 may be any.
- the method for detecting the elastic wave 11 by the sensor 20 includes a voltage output type, a resistance change type, a capacitance type, and the like, and any detection method may be used.
- An acceleration sensor may be used instead of the sensor 20.
- the accelerometer detects the elastic wave 11 generated inside the structure 50. Then, the accelerometer converts the detected elastic wave 11 into an electric signal by performing the same processing as the sensor 20.
- An amplifier and an A / D converter (not shown) are provided between the sensor 20 and the signal processing unit 30, for example.
- the amplifier amplifies the electric signal output from the sensor 20.
- the amplifier outputs the amplified electric signal to the A / D converter.
- the amplifier amplifies the electrical signal to the extent that it can be processed by, for example, an A / D converter.
- the A / D converter quantizes the amplified electrical signal and converts it into a digital signal.
- the A / D converter outputs a digital signal to the signal processing unit 30.
- the signal processing unit 30 inputs a digital signal output from the A / D converter.
- the signal processing unit 30 performs signal processing on the input digital signal.
- the signal processing performed by the signal processing unit 30 is, for example, noise removal, parameter extraction, and the like.
- the signal processing unit 30 generates transmission data including a digital signal after signal processing.
- the signal processing unit 30 outputs the generated transmission data to the structure evaluation device 40.
- the signal processing unit 30 is configured by using an analog circuit or a digital circuit.
- the digital circuit is realized by, for example, FPGA (Field Programmable Gate Array) or a microcomputer.
- the digital circuit may be realized by a dedicated LSI (Large-Scale Integration).
- the signal processing unit 30 may be equipped with a non-volatile memory such as a flash memory or a removable memory.
- FIG. 4 is a schematic block diagram showing the functions of the signal processing unit 30 in the first embodiment.
- the signal processing unit 30 includes a waveform shaping filter 301, a gate generation circuit 302, an arrival time determination unit 303, a feature amount extraction unit 304, a transmission data generation unit 305, a memory 306, and an output unit 307.
- the waveform shaping filter 301 removes noise components outside a predetermined band from the input digital signal.
- the waveform shaping filter 301 is, for example, a digital bandpass filter (BPF).
- BPF digital bandpass filter
- the waveform shaping filter 301 outputs a digital signal after noise component removal (hereinafter referred to as “noise removal signal”) to the gate generation circuit 302, the arrival time determination unit 303, and the feature amount extraction unit 304.
- the gate generation circuit 302 inputs the noise reduction signal output from the waveform shaping filter 301.
- the gate generation circuit 302 generates a gate signal based on the input noise reduction signal.
- the gate signal is a signal indicating whether or not the waveform of the noise reduction signal is sustained.
- the gate generation circuit 302 is realized by, for example, an envelope detector and a comparator.
- the envelope detector detects the envelope of the denoising signal.
- the envelope is extracted, for example, by squared a noise reduction signal and performing a predetermined process (for example, a process using a low-pass filter or a Hilbert transform) on the squared output value.
- the comparator determines whether or not the envelope of the denoising signal is greater than or equal to a predetermined threshold.
- the gate generation circuit 302 uses a first gate signal indicating that the waveform of the denoising signal is sustained by the arrival time determination unit 303 and the feature amount extraction unit. Output to 304.
- the gate generation circuit 302 sets a second gate signal indicating that the waveform of the noise reduction signal is not sustained by the arrival time determination unit 303 and the feature amount. Output to the extraction unit 304.
- the arrival time determination unit 303 inputs the noise removal signal output from the waveform shaping filter 301 and the gate signal output from the gate generation circuit 302.
- the arrival time determination unit 303 determines the elastic wave arrival time using the noise reduction signal input while the first gate signal is input.
- the arrival time determination unit 303 outputs the determined elastic wave arrival time as time information to the transmission data generation unit 305.
- the arrival time determination unit 303 does not perform processing while the second gate signal is being input.
- the feature amount extraction unit 304 inputs the noise removal signal output from the waveform shaping filter 301 and the gate signal output from the gate generation circuit 302.
- the feature amount extraction unit 304 extracts the feature amount of the noise reduction signal by using the noise reduction signal input while the first gate signal is input.
- the feature amount extraction unit 304 does not perform processing while the second gate signal is input.
- the feature amount is information indicating the feature of the noise reduction signal.
- the features include, for example, the amplitude of the waveform [mV], the rise time of the waveform [usc], the duration of the gate signal [usc], the number of zero cross counts [times], and the energy of the waveform [arb. ], Frequency [Hz], RMS (Root Mean Square) value, etc.
- the feature amount extraction unit 304 outputs parameters related to the extracted feature amount to the transmission data generation unit 305.
- the sensor ID is associated with the parameter related to the feature amount.
- the sensor ID represents identification information for identifying the sensor 20 installed in the area (hereinafter referred to as “evaluation area”) to be evaluated for the soundness of the structure 50.
- the amplitude of the waveform is, for example, the value of the maximum amplitude in the noise reduction signal.
- the rising edge time of the waveform is, for example, the time T1 from the start of rising edge of the gate signal to the time when the noise reduction signal reaches the maximum value.
- the duration of the gate signal is, for example, the time from the start of the rise of the gate signal until the amplitude becomes smaller than the preset value.
- the zero cross count number is, for example, the number of times the noise reduction signal crosses the reference line passing through the zero value.
- the energy of the waveform is, for example, the value obtained by time-integrating the square of the amplitude of the noise reduction signal at each time point.
- the definition of energy is not limited to the above example, and may be approximated by using, for example, a waveform envelope.
- the frequency is the frequency of the noise reduction signal.
- the RMS value is, for example, a value obtained by square root of the amplitude of the noise reduction signal at each time point.
- the transmission data generation unit 305 inputs the sensor ID, time information, and parameters related to the feature amount.
- the transmission data generation unit 305 generates transmission data including the input sensor ID, time information, and parameters related to the feature amount.
- the memory 306 stores transmission data.
- the memory 306 is, for example, a dual port RAM (Random Access Memory).
- the output unit 307 sequentially outputs the transmission data stored in the memory 306 to the structure evaluation device 40.
- the structure evaluation device 40 includes a communication unit 41, a control unit 42, a storage unit 43, and a display unit 44.
- the communication unit 41 receives the transmission data output from the signal processing unit 30.
- the control unit 42 controls the entire structure evaluation device 40.
- the control unit 42 is configured by using a processor such as a CPU (Central Processing Unit) and a memory. By executing the program, the control unit 42 functions as an acquisition unit 421, an event extraction unit 422, a position determination unit 423, a distribution generation unit 424, a correction unit 425, and an evaluation unit 426.
- a processor such as a CPU (Central Processing Unit) and a memory.
- the functional units of the acquisition unit 421, event extraction unit 422, position determination unit 423, distribution generation unit 424, correction unit 425, and evaluation unit 426 are ASIC (Application Specific Integrated Circuit) or PLD (Programmable Logic Device). ), It may be realized by hardware such as FPGA, or it may be realized by collaboration between software and hardware.
- the program may be recorded on a computer-readable recording medium.
- the computer-readable recording medium is, for example, a flexible disk, a magneto-optical disk, a portable medium such as a ROM or a CD-ROM, or a non-temporary storage medium such as a storage device such as a hard disk built in a computer system.
- the program may be transmitted over a telecommunication line.
- Some of the functions of the acquisition unit 421, the event extraction unit 422, the position determination unit 423, the distribution generation unit 424, the correction unit 425, and the evaluation unit 426 do not need to be mounted on the structure evaluation device 40 in advance, and are additional. It may be realized by installing the application program in the structure evaluation device 40.
- the acquisition unit 421 acquires various information. For example, the acquisition unit 421 acquires the transmission data received by the communication unit 41. The acquisition unit 421 stores the acquired transmission data in the storage unit 43. In the first embodiment, the acquisition unit 421 acquires information about the vehicle 10 traveling on the structure 50 to be evaluated (hereinafter referred to as "vehicle information") for a predetermined period.
- vehicle information information about the vehicle 10 traveling on the structure 50 to be evaluated
- the vehicle information is, for example, vehicle type information of the vehicle 10 that has traveled in the structure 50 during a predetermined period, and traffic volume information of the vehicle 10 of the structure 50.
- the vehicle type information of the vehicle 10 includes at least information on the tread width of the vehicle 10.
- the traffic volume information of the vehicle 10 is information indicating how many vehicles 10 of which vehicle type have passed through the structure 50 in a predetermined period.
- the acquisition unit 421 may acquire vehicle information by input of a user, or may acquire vehicle information from a server that stores traffic information.
- the event extraction unit 422 extracts the transmission data in one event from the transmission data stored in the storage unit 43.
- the event represents an elastic wave generation event that has occurred in the structure 50.
- the elastic wave generation event in the present embodiment is the passage of the road surface by the vehicle 10.
- the event extraction unit 422 provides a predetermined time window, and extracts all transmission data whose arrival time is within the range of the time window as transmission data in one event.
- the event extraction unit 422 outputs the transmission data in one extracted event to the position determination unit 423.
- the elastic wave propagation velocity v may be obtained in advance.
- the position determination unit 423 performs position determination of the elastic wave source based on the sensor position information and the sensor ID and time information included in each of the plurality of transmission data extracted by the event extraction unit 422.
- the sensor position information includes information regarding the installation position of the sensor 20 in association with the sensor ID.
- the sensor position information includes information about the installation position of the sensor 20, such as latitude and longitude, or horizontal and vertical distances from a reference position of the structure 50.
- the position setting unit 423 holds the sensor position information in advance.
- the sensor position information may be stored in the position determination unit 423 at any timing before the position determination unit 423 performs position determination of the elastic wave source.
- the sensor position information may be stored in the storage unit 43.
- the position determination unit 423 acquires the sensor position information from the storage unit 43 at the timing of performing the position determination.
- a Kalman filter, a least squares method, or the like may be used to determine the position of the elastic wave source.
- the position setting unit 423 outputs the position information of the elastic wave source obtained during the measurement period to the distribution generation unit 424.
- the distribution generation unit 424 inputs the position information of a plurality of elastic wave sources output from the position determination unit 423.
- the distribution generation unit 424 uses the input position information of the plurality of elastic wave sources to generate an elastic wave source distribution.
- the elastic wave source distribution represents a distribution in which the position of the elastic wave source is shown. More specifically, the elastic wave source distribution is the position of the elastic wave source on the virtual data representing the structure 50 to be evaluated, with the horizontal axis as the distance in the passage direction and the vertical axis as the distance in the width direction. The points shown are the distributions shown.
- the distribution generation unit 424 generates an elastic wave source density distribution using the elastic wave source distribution. For example, the distribution generation unit 424 generates an elastic wave source density distribution by representing the position of the elastic wave source with a contour diagram as shown in FIG.
- the correction unit 425 corrects the information based on the position setting by the position setting unit 423 by using the correction value determined according to the impact.
- the correction value determined in response to the impact in the first embodiment is a correction value obtained from the vehicle information acquired by the acquisition unit 421.
- the correction value has an extreme value at the passing position of the traveling portion of the vehicle 10.
- the information based on the position orientation is the information obtained before the position orientation (for example, the amplitude of the elastic wave) or by using the orientation result.
- the information based on position orientation is the elastic wave source density distribution. In the following description, the case where the information based on the position orientation is the elastic wave source density distribution will be described as an example.
- the evaluation unit 426 evaluates the deterioration state of the structure 50 based on the corrected information. Specifically, the evaluation unit 426 evaluates the deteriorated state of the structure 50 using the corrected elastic wave source density distribution. For example, the evaluation unit 426 evaluates a region where the density of the elastic wave source is equal to or higher than the threshold value as a healthy region, and evaluates a region where the density of the elastic wave source is less than the threshold value as a damaged region.
- the storage unit 43 stores the transmission data and vehicle information acquired by the acquisition unit 421.
- the storage unit 43 is configured by using a storage device such as a magnetic hard disk device or a semiconductor storage device.
- the display unit 44 displays the evaluation result according to the control of the evaluation unit 426.
- the display unit 44 is an image display device such as a liquid crystal display or an organic EL (ElectroLuminescence) display.
- the display unit 44 may be an interface for connecting the image display device to the structure evaluation device 40. In this case, the display unit 44 generates a video signal for displaying the evaluation result, and outputs the video signal to the image display device connected to the display unit 44.
- FIG. 5 is a sequence diagram showing a flow of evaluation processing of a deteriorated state by the structure evaluation system 100 in the first embodiment.
- the process of FIG. 5 is executed according to the vehicle 10 traveling on the structure 50 to be evaluated.
- the traveling portion of the vehicle 10 comes into contact with the road surface.
- elastic waves 11 are generated in the structure 50.
- Each of the plurality of sensors 20 detects the elastic wave 11 generated in the structure 50 (step S101).
- Each of the plurality of sensors 20 converts the detected elastic wave 11 into an electric signal and outputs it to the signal processing unit 30 (step S102).
- the electric signal output from each of the plurality of sensors 20 is amplified by an amplifier (not shown).
- the amplified electric signal is converted into a digital signal by an A / D converter.
- the signal processing unit 30 inputs the digital signal output from the A / D converter.
- the arrival time determination unit 303 of the signal processing unit 30 determines the arrival time of each elastic wave 11 using the input digital signal (step S103). Specifically, the arrival time determination unit 303 determines the elastic wave arrival time using the noise reduction signal which is a digital signal input while the first gate signal is input.
- the arrival time determination unit 303 outputs the determined elastic wave arrival time as time information to the transmission data generation unit 305.
- the arrival time determination unit 303 performs this processing on all the input digital signals.
- the feature amount extraction unit 304 of the signal processing unit 30 extracts the feature amount of the noise reduction signal by using the noise reduction signal which is a digital signal input while the first gate signal is input (step S104). ).
- the feature amount extraction unit 304 outputs parameters related to the extracted feature amount to the transmission data generation unit 305.
- the transmission data generation unit 305 generates transmission data including the sensor ID, time information, and parameters related to the feature amount (step S105).
- the output unit 307 sequentially outputs the transmission data to the structure evaluation device 40 (step S106).
- the communication unit 41 of the structure evaluation device 40 receives the transmission data output from the signal processing unit 30.
- the acquisition unit 421 acquires the transmission data received by the communication unit 41.
- the acquisition unit 421 records the acquired transmission data in the storage unit 43 (step S107).
- the event extraction unit 422 extracts the transmission data in one event from the transmission data stored in the storage unit 43.
- the event extraction unit 422 outputs the transmission data in one extracted event to the position determination unit 423 and the distribution generation unit 424.
- the position determination unit 423 determines the position of the elastic wave source based on the sensor ID and time information included in the transmission data output from the event extraction unit 422 and the sensor position information held in advance (step S108). Specifically, first, the position setting unit 423 calculates the difference in the arrival time of the elastic wave 11 to each of the plurality of sensors 20. Next, the position setting unit 423 positions the position of the elastic wave source using the sensor position information and the information of the difference in arrival time.
- the position setting unit 423 executes the process of step S108 every time the transmission data of one event is output from the event extraction unit 422 during the measurement period. As a result, the position setting unit 423 positions the positions of the plurality of elastic wave sources. The position setting unit 423 outputs position information of a plurality of elastic wave sources to the distribution generation unit 424.
- the distribution generation unit 424 generates an elastic wave source distribution using the position information of a plurality of elastic wave sources output from the position determination unit 423. Specifically, the distribution generation unit 424 generates an elastic wave source distribution by plotting the positions of the elastic wave sources indicated by the position information of the obtained plurality of elastic wave sources on virtual data. The distribution generation unit 424 generates an elastic wave source density distribution by representing the generated elastic wave source distribution in a contour diagram (step S109). The distribution generation unit 424 outputs the generated elastic wave source density distribution to the correction unit 425.
- the correction unit 425 inputs the elastic wave source density distribution output from the distribution generation unit 424 and the vehicle information stored in the storage unit 43.
- the correction unit 425 corrects the elastic wave source density distribution with the correction value obtained by using the input vehicle information (step S110).
- the correction unit 425 calculates the correction value f (x, y) based on the following equation (1) using the vehicle information.
- Equation (1) y is the distance in the width direction of the road, k is the coefficient, a is the position of the traveling portion, and w is the degree of variation in the passing position.
- the correction value obtained by the equation (1) has a peak at the passing position of the traveling portion in the y direction and has a constant value in the passage direction in the x direction.
- the traveling portion position used at the time of correction the tread width of the vehicle 10 included in the vehicle information can be referred to.
- the tread width is about 1900 mm for a 10t truck. Therefore, the traveling portion position a can be set to a position ⁇ 950 mm from the center of the lane. In the case of an ordinary vehicle, the tread width is about 1500 mm. Therefore, the traveling portion position a can be set to ⁇ 750 mm from the center of the lane.
- the position of the traveling part is also possible to determine the position of the traveling part according to the traffic conditions of the structure 50 to be evaluated.
- the structure 50 to be evaluated is a road through which a large vehicle does not pass, for example, a tread width of about 1500 mm for a normal vehicle may be adopted and set to ⁇ 750 mm from the center of the lane.
- Information on the traffic conditions of the structure 50 may be input to the structure evaluation device 40 from the outside, or may be included in the vehicle information.
- the correction unit 425 may determine the traveling unit position a based on the statistical value of the vehicle type information included in the vehicle information. For example, the correction unit 425 may set the tread width of the vehicle type having the largest number of passages as the traveling unit position a from the statistical result of the vehicle type information included in the vehicle information. For example, the correction unit 425 may use the tread width of the vehicle having the largest tread width as the traveling unit position a or the average tread width as the traveling unit position a based on the statistical results of the vehicle type information included in the vehicle information. good.
- the variation in the passage position can be determined by the condition of the structure 50 to be evaluated. For example, on a highway or a wide road, the variation in the passage position of each vehicle 10 becomes large. On the other hand, on a narrow road where only one vehicle 10 can pass, all the vehicles pass at substantially the same position, so that the variation is small. Therefore, the correction unit 425 appropriately sets the parameters related to the degree of variation in the traffic position by referring to the traffic volume information, the road width, the frequency of lane changes, and the like.
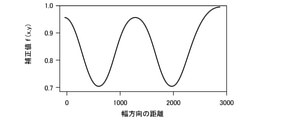
- FIG. 6 shows an example of the correction value calculated based on the above equation (1).
- the horizontal axis represents the distance in the width direction
- the vertical axis represents the correction value f (x, y).
- the correction value f (x, y) is a value that reduces at least a position value (for example, density) on the elastic wave source density distribution corresponding to the passing position of the traveling portion of the vehicle 10. It is represented by the distribution it has. That is, the correction value f (x, y) has a value that most decreases the value of the position on the elastic wave source density distribution corresponding to the passing position of the traveling portion of the vehicle 10 and does not decrease as far as the position away from the passing position. It is represented by a distribution.
- FIG. 6 shows an example of a correction value f (x, y) when there are two passing positions of the traveling portion of the vehicle 10. Therefore, the correction value f (x, y) shown in FIG. 6 has two values that most reduce the value of the position on the elastic wave source density distribution corresponding to the passing position of the traveling portion of the vehicle 10. Depending on the evaluation area, there may be one passing position of the traveling portion of the vehicle 10. Therefore, the correction value f (x, y) may have one or more values that most reduce the value of the position on the elastic wave source density distribution corresponding to the passing position of the traveling portion of the vehicle 10.
- the correction unit 425 corrects the elastic wave source density distribution by multiplying the calculated correction value f (x, y) by the elastic wave source density distribution. Specifically, the correction unit 425 multiplies the width direction of the elastic wave source density distribution by the correction value f (x, y) according to the distance in the width direction of the calculated correction value f (x, y). do.
- the correction unit 425 is set at a position of a distance "500" in the width direction of the calculated correction value f (x, y) with respect to a density value at a position of a distance "500” in the width direction of the elastic wave source density distribution. Multiply the corresponding correction value f (x, y). Similarly, the correction unit 425 multiplies the passage direction of the elastic wave source density distribution by the correction value f (x, y) according to the distance in the width direction. For example, the correction unit 425 calculates the correction value f (for all the density values at the position of the distance "0 to 3000" in the traffic direction corresponding to the position of the distance "500” in the width direction of the elastic wave source density distribution. The correction value f (x, y) corresponding to the position of the distance "500” in the width direction of x, y) is multiplied.
- the correction unit 425 corrects the elastic wave source density distribution by the above processing to generate the corrected elastic wave source density distribution AD shown in FIG. 7.
- the correction unit 425 outputs the corrected elastic wave source density distribution AD to the evaluation unit 426.
- FIG. 7 is a diagram showing an example of the corrected elastic wave source density distribution AD.
- the horizontal axis represents the distance in the traffic direction of the vehicle, and the vertical axis represents the distance in the width direction.
- the corrected elastic wave source density distribution AD shown in FIG. 7 is less affected by the passage of the traveling portion of the vehicle 10 than the elastic wave source density distribution D shown in FIG.
- the effect of the passage of the traveling portion of the vehicle 10 is that the density of the elastic wave source at the position where the traveling portion of the vehicle 10 has passed increases.
- the evaluation unit 426 evaluates the deterioration state of the structure 50 using the corrected elastic wave source density distribution AD output from the correction unit 425 (step S111).
- the evaluation unit 426 evaluates a region having a density lower than the threshold value 15 set in the elastic wave source density distribution AD corrected by the conventional evaluation method as a damaged region. In this case, the region 16 shown in FIG. 7 is evaluated as a damaged region.
- the evaluation unit 426 outputs the evaluation result to the display unit 44.
- the display unit 44 displays the evaluation result output from the evaluation unit 426 (step S112). For example, the display unit 44 may display the corrected elastic wave source density distribution as an evaluation result, or may display a region that is considered to be a damaged region in a different display mode from other regions.
- the correction value f (x, y) determined according to the impact is used to correct the information so as to reduce the bias of the information based on the position orientation by the position determination unit. More specifically, the structure evaluation device 40 calculates a correction value f (x, y) for a future impact from the vehicle information of the vehicle 10 traveling on the structure 50 to be evaluated. Then, the structure evaluation device 40 uses the calculated correction value f (x, y) to correct the influence of the impact caused by the passage of the traveling portion of the vehicle 10 in the elastic wave source density distribution which is the information based on the position orientation. do. This makes it possible to reduce misdiagnosis. Therefore, even when the impact applied to the road surface is not uniform, it is possible to improve the evaluation accuracy of the structure 50.
- the correction unit 425 corrects the elastic wave source density distribution with a correction value f (x, y) having at least one extreme value portion for correcting information at a position where an impact is applied.
- the information at the position where the impact is applied is, for example, the information at the position affected by the passage of the traveling portion of the vehicle 10.
- the correction unit 425 corrects the correction value f (x, y) having one or more extreme value portions in order to reduce the influence caused by the passage of the traveling unit of the vehicle 10. This makes it possible to reduce the influence caused by the passage of the traveling portion of the vehicle 10. As a result, it is possible to improve the evaluation accuracy of the structure 50 even when the impact applied to the road surface is not uniform.
- the correction unit 425 corrects the elastic wave source density distribution in the traffic direction of the vehicle 10 by using the correction value f (x, y) determined for each distance in the width direction of the road.
- One vehicle 10 travels on the road with the same tread width. Therefore, when viewed in the traffic direction of the vehicle 10, an impact (dotted line 14) is linearly applied to the road surface as shown in FIG. Therefore, the correction unit 425 calculates the correction value f (x, y) for each distance in the width direction, and obtains the same correction value f (x, y) in the passage direction as seen from the position of the distance in one width direction. Use.
- the correction unit 425 uses the same correction value f (x, y) for the value at the position of the distance "0 to 3000" in the passage direction as seen from the position "500" of the distance in the width direction. As a result, it is not necessary to calculate all the correction values at positions where the distance in the width direction is the same but the distance in the traffic direction is different. Therefore, the correction can be easily performed.
- the correction unit 425 calculates the correction value based on the position where the impact generated by the contact between the traveling unit of the vehicle 10 and the road surface is generated. As a result, the correction unit 425 can calculate the correction value in consideration of the position where the influence of the passage of the traveling unit of the vehicle 10 is further reduced. For example, the correction unit 425 can calculate a correction value that most reduces the value at a position where the influence of the passage of the traveling unit of the vehicle 10 is large. This makes it possible to reduce misdiagnosis. Therefore, even when the impact applied to the road surface is not uniform, it is possible to improve the evaluation accuracy of the structure 50.
- the correction value is not limited to the form obtained by the equation (1).
- the correction value may be a rectangle or a distribution represented by a function having a shape close to a rectangle.
- the correction unit 425 superimposes a weighted distribution on the tread width for each vehicle type according to the ratio of the vehicle types of the vehicle 10 obtained from the vehicle information to obtain a correction value f (x, y) closer to the actual value. It may be calculated.
- the evaluation unit 426 may be configured to evaluate the deterioration state of the region of the evaluation target region where the frequency of impact is assumed to be equal to or higher than the threshold value.
- the correction unit 425 shows a configuration in which the correction value f (x, y) is calculated using the tread width of the vehicle 10 in the vehicle information and the traffic volume information, but the correction unit 425 is a vehicle.
- the correction value f (x, y) may be calculated based on the tread width of 10.
- the correction unit 425 calculates the correction value f (x, y) with the degree of variation w of the passing position as 1 in the above equation (1).
- the traveling portion position a may be obtained in the same manner as in the above embodiment.
- the correction unit 425 can calculate the correction value f (x, y) from the tread width information even if the traffic volume information cannot be obtained. Therefore, it is possible to perform correction with a small amount of information.
- the correction unit 425 shows a configuration in which the correction value f (x, y) is calculated using the vehicle information.
- the second embodiment a configuration will be described in which the position where the vehicle 10 has passed is estimated based on the electric signal obtained from the sensor 20 and the correction value f (x, y) is acquired.
- FIG. 9 is a diagram showing the configuration of the structure evaluation system 100a in the second embodiment.
- the structure evaluation system 100a in the second embodiment is the same as the first embodiment except that the structure evaluation device 40a is provided in place of the structure evaluation device 40.
- the configuration of the structure evaluation device 40a according to the difference will be described.
- the structure evaluation device 40a includes a communication unit 41, a control unit 42a, a storage unit 43a, and a display unit 44.
- the control unit 42a controls the entire structure evaluation device 40a.
- the control unit 42a is configured by using a processor such as a CPU and a memory. By executing the program, the control unit 42a functions as an acquisition unit 421a, an event extraction unit 422, a position determination unit 423, a distribution generation unit 424, a correction unit 425a, and an evaluation unit 426.
- a part or all of the functional parts of the acquisition unit 421a, the event extraction unit 422, the position determination unit 423, the distribution generation unit 424, the correction unit 425a, and the evaluation unit 426 are realized by hardware such as ASIC, PLD, and FPGA. It may be realized by the cooperation of software and hardware.
- the program may be recorded on a computer-readable recording medium.
- the computer-readable recording medium is a non-temporary storage medium such as a flexible disk, a magneto-optical disk, a portable medium such as a ROM or a CD-ROM, or a storage device such as a hard disk built in a computer system.
- the program may be transmitted over a telecommunication line.
- Some of the functions of the acquisition unit 421a, the event extraction unit 422, the position determination unit 423, the distribution generation unit 424, the correction unit 425a, and the evaluation unit 426 do not need to be mounted on the structure evaluation device 40a in advance, and additional functions are required. It may be realized by installing the application program in the structure evaluation device 40a.
- the control unit 42a is different from the control unit 42 in that the acquisition unit 421a and the correction unit 425a are provided in place of the acquisition unit 421 and the correction unit 425.
- the differences will be described below.
- the acquisition unit 421a acquires various types of information. For example, the acquisition unit 421a acquires the transmission data received by the communication unit 41. The acquisition unit 421a stores the acquired transmission data in the storage unit 43. In the second embodiment, the acquisition unit 421a acquires information indicating the position of a sound region in the structure 50 to be evaluated (hereinafter referred to as “healthy position information”). The acquisition unit 421a acquires sound position information by input from the user.
- the correction unit 425a corrects the information based on the position orientation by the position determination unit 423 by using the correction value f (x, y) determined according to the impact.
- the correction value determined in response to the impact in the second embodiment is a correction value obtained based on the electric signal obtained from the sensor 20.
- the correction value determined in response to the impact in the second embodiment is a correction value obtained by calculating the tread width based on the electric signal obtained from the sensor 20.
- the storage unit 43a stores the transmission data and sound position information acquired by the acquisition unit 421a.
- the storage unit 43a is configured by using a storage device such as a magnetic hard disk device or a semiconductor storage device.
- the correction unit 425a inputs the elastic wave source density distribution output from the distribution generation unit 424 and the sound position information stored in the storage unit 43a.
- the correction unit 425a corrects the elastic wave source density distribution based on the input elastic wave source density distribution and the sound position information (step S110). Specifically, first, the correction unit 425a estimates the passing position of the traveling unit of the vehicle 10 by using the elastic wave source density distribution.
- the correction unit 425a estimates the passing position of the traveling unit of the vehicle 10 based on the first condition and the second condition.
- the first condition is that the regions where the density is equal to or higher than the first threshold value in the traffic direction of the elastic wave source density distribution are continuous for the first distance or longer.
- the second condition is that there are two or more regions in the width direction that satisfy the first condition.
- the correction unit 425a estimates each of the regions satisfying the first condition as the passing position of the traveling unit of the vehicle 10.
- the correction unit 425a calculates a correction value f (x, y) that reduces the value of the position on the elastic wave source density distribution corresponding to the estimated passing position of the traveling unit of the vehicle 10 by a threshold value or more. For example, the correction unit 425a calculates a correction value f (x, y) that most reduces the value of the position on the elastic wave source density distribution corresponding to the estimated passing position of the traveling unit of the vehicle 10.
- the correction unit 425a uses sound position information when calculating the correction value f (x, y). For example, the correction unit 425a calculates the correction value f (x, y) with reference to the density value of the region indicated by the sound position information (hereinafter referred to as “reference value”).
- the correction unit 425a determines the minimum value of the correction value so as to match the value of the position on the elastic wave source density distribution corresponding to the estimated passing position of the traveling unit of the vehicle 10 with the reference value.
- the correction unit 425a corrects the elastic wave source density distribution by multiplying the calculated correction value f (x, y) by the elastic wave source density distribution.
- the correction value f (x, y) determined according to the impact is acquired from the elastic wave source density distribution. More specifically, the structure evaluation device 40a calculates the correction value f (x, y) for the past impact from the elastic wave source density distribution obtained by the vehicle 10 traveling on the structure 50 to be evaluated. .. Then, the structure evaluation device 40a uses the calculated correction value f (x, y) to correct the influence of the impact caused by the passage of the traveling portion of the vehicle 10 in the elastic wave source density distribution which is the information based on the position orientation. do. This makes it possible to reduce misdiagnosis. Therefore, even when the impact applied to the road surface is not uniform, it is possible to improve the evaluation accuracy of the structure 50.
- the correction unit 425a may estimate the passing position of the traveling unit of the vehicle 10 as follows.
- the correction unit 425a estimates that one region satisfying the first condition is the passing position of the traveling unit of the vehicle 10 when the first condition is satisfied and the second condition is not satisfied.
- the correction unit 425a calculates a correction value f (x, y) that most reduces the value of the position on the elastic wave source density distribution corresponding to the estimated passing position of the traveling unit of the vehicle 10.
- the correction unit 425a has shown a configuration in which the passing position of the vehicle 10 is estimated from the elastic wave source density distribution and the correction value f (x, y) is acquired.
- the correction unit 425a may be configured to correct the elastic wave source density distribution using the correction value f (x, y) generated by the user.
- the distribution generation unit 424 outputs the generated elastic wave source density distribution to the display unit 44 in the process of step S109.
- the display unit 44 displays the elastic wave source density distribution.
- the user grasps the position where the traveling portion of the vehicle 10 has passed by referring to the elastic wave source density distribution displayed on the display unit 44. Then, the user generates a correction value f (x, y) capable of suppressing the influence caused by the passage of the traveling portion of the vehicle 10 and inputs it to the structure evaluation device 40a.
- the correction value f (x, y) that can suppress the influence is a value that can reduce the value corresponding to the density of the elastic wave source that has increased due to the passage of the traveling portion of the vehicle 10.
- the correction value f (x, y) capable of suppressing the influence is a value that can cancel the influence caused by the passage of the traveling portion of the vehicle 10.
- the correction unit 425a corrects the elastic wave source density distribution using the input correction value f (x, y).
- the position where the traveling portion of the vehicle 10 has passed is grasped by the user's visual recognition. This makes it possible to roughly estimate the position where the traveling portion of the vehicle 10 has passed.
- the user generates a correction value f (x, y) capable of suppressing the influence caused by the passage of the traveling portion of the vehicle 10, and inputs the correction value f (x, y) to the structure evaluation device 40a.
- the structure evaluation device 40a does not need to calculate the correction value f (x, y). Therefore, the processing load can be reduced, and the evaluation accuracy of the structure 50 can be improved even when the impact applied to the road surface is not uniform.
- the evaluation unit 426a may be configured to evaluate the deterioration state of the region of the evaluation target region where the frequency of impact is assumed to be equal to or higher than the threshold value. With such a configuration, the processing load can be reduced and misdiagnosis can be suppressed.
- FIG. 10 is a diagram showing the configuration of the structure evaluation system 100b according to the third embodiment.
- the structure evaluation system 100b in the third embodiment is the same as the first embodiment except that the structure evaluation device 40b is provided in place of the structure evaluation device 40.
- the configuration of the structure evaluation device 40b according to the difference will be described.
- the structure evaluation device 40b includes a communication unit 41, a control unit 42b, a storage unit 43b, and a display unit 44.
- the control unit 42b controls the entire structure evaluation device 40b.
- the control unit 42b is configured by using a processor such as a CPU and a memory. By executing the program, the control unit 42b functions as an acquisition unit 421b, an event extraction unit 422, a position determination unit 423, a distribution generation unit 424, and an evaluation unit 426b.
- a part or all of the functional parts of the acquisition unit 421b, the event extraction unit 422, the position determination unit 423, the distribution generation unit 424, and the evaluation unit 426b may be realized by hardware such as ASIC, PLD, or FPGA. It may be realized by the cooperation of software and hardware.
- the program may be recorded on a computer-readable recording medium.
- the computer-readable recording medium is, for example, a flexible disk, a magneto-optical disk, a portable medium such as a ROM or a CD-ROM, or a non-temporary storage medium such as a storage device such as a hard disk built in a computer system.
- the program may be transmitted over a telecommunication line.
- Some of the functions of the acquisition unit 421b, the event extraction unit 422, the position determination unit 423, the distribution generation unit 424, and the evaluation unit 426b do not need to be mounted on the structure evaluation device 40b in advance, and an additional application program is structured. It may be realized by installing it in the object evaluation device 40b.
- the control unit 42b is different from the control unit 42 in that the acquisition unit 421b and the evaluation unit 426b are provided in place of the acquisition unit 421 and the evaluation unit 426, and the correction unit 425 is not provided. The differences will be described below.
- the acquisition unit 421b acquires various types of information. For example, the acquisition unit 421b acquires the transmission data received by the communication unit 41. The acquisition unit 421b stores the acquired transmission data in the storage unit 43b. In the third embodiment, the acquisition unit 421b acquires information about the structure 50 to be evaluated. The information about the structure 50 to be evaluated includes at least the information on the road width of the structure 50.
- the evaluation unit 426b evaluates the deteriorated state of the structure 50 based on the frequency of applying impact. Specifically, the evaluation unit 426b evaluates the deterioration state of the region where the impact frequency is assumed to be equal to or higher than the threshold value, and does not evaluate the deterioration state of the region where the impact application frequency is assumed to be less than the threshold value. For example, the evaluation unit 426b evaluates a region where the density of the elastic wave source is equal to or higher than the threshold value in a region where the impact application frequency is assumed to be equal to or higher than the threshold value, and evaluates a region where the impact application frequency is assumed to be equal to or higher than the threshold value. A region where the density of the elastic wave source is less than the threshold value is evaluated as a damaged region.
- the storage unit 43b stores the transmission data acquired by the acquisition unit 421b and the information regarding the structure 50 to be evaluated.
- the storage unit 43b is configured by using a storage device such as a magnetic hard disk device or a semiconductor storage device.
- the evaluation unit 426b evaluates the structure to be evaluated based on the road width information included in the information about the structure 50 to be evaluated acquired by the acquisition unit 421b. It is determined whether or not the condition that the road width of 50 is very narrow is satisfied.
- the condition that the road width is very narrow shall be set in advance.
- the condition that the road width is very narrow is that the road width is the same as the tread width of a specific vehicle (for example, an ordinary vehicle) or is wider by a predetermined width (for example, +10 mm).
- the following processing is executed when the condition that the road width of the structure 50 to be evaluated is very narrow is satisfied.
- the condition that the road width of the structure 50 to be evaluated is very narrow is not satisfied, the following processing is not executed.
- the structure evaluation system 100 executes the processes from step S101 to step S109 shown in FIG. After that, the evaluation unit 426b evaluates the deterioration state of the region of the evaluation target region where the frequency of impact is assumed to be equal to or higher than the threshold value.
- the structure evaluation system 100c configured as described above does not evaluate the deterioration state of the region where the frequency of impact is assumed to be less than the threshold value. This makes it possible to reduce misdiagnosis. Therefore, even when the impact applied to the road surface is not uniform, it is possible to improve the evaluation accuracy of the structure 50.
- the signal processing unit 30 may be provided in the structure evaluation devices 40, 40a, 40b.
- a configuration is shown in which a plurality of sensors 20-1 to 20-n are connected to one signal processing unit 30.
- the structure evaluation systems 100, 100a, 100b include a plurality of signal processing units 30, and each sensor 20 may be connected to a different signal processing unit 30.
- Each functional unit included in the structure evaluation devices 40, 40a, 40b may be partially or completely provided in another device.
- the display unit 44 included in the structure evaluation devices 40, 40a, 40b may be provided in another device.
- the structure evaluation devices 40, 40a, 40b transmit the evaluation results to another device including the display unit 44.
- Another device including the display unit 44 displays the received evaluation result.
- non-uniform target that gives a spatially non-uniform impact to the road surface is the traveling portion of the vehicle 10
- the non-uniform object need not be limited to the traveling portion of the vehicle 10.
- non-uniform objects include sprinkler vehicles, manually pushed vehicles, fixed sprinklers, and the like. Hereinafter, it will be described in detail.
- a sprinkler vehicle is a vehicle that can travel on the road surface while sprinkling water.
- a sprinkler vehicle is a vehicle equipped with a sprinkler for sprinkling water behind the vehicle.
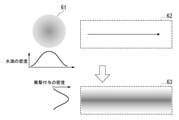
- the sprinkler sprinkles water droplets (objects) in a distribution having a normal distribution with the center of the circular region 61 of FIG. 11 as the peak. In this case, the impact applied to the road surface is water droplets.
- FIG. 11 is an explanatory diagram when the non-uniform object is a sprinkler vehicle.
- a distribution 63 for example, an elastic wave source density distribution
- the correction units 425 and 425a calculate a correction value f (x, y) capable of suppressing the bias of the distribution 63. Then, the correction units 425 and 425a correct the elastic wave source density distribution by multiplying the calculated correction value f (x, y) by the elastic wave source density distribution.
- a person may give a spatially non-uniform impact to the road surface by spraying a plurality of objects such as water and ice by a predetermined method.
- a predetermined method a person carries a watering device and sprays it, or a method of spraying water or ice directly on the road surface without using the device (for example, holding water or ice in his hand on the road surface). Method of sprinkling) and the like.
- a hand-held vehicle is a vehicle that can give an impact to the road surface at regular intervals by traveling on the road surface manually.
- a push vehicle is a vehicle equipped with a striking mechanism.
- the striking mechanism is, for example, a rotation mechanism of a tooth profile.
- the tooth profile rotation mechanism comes into contact with the road surface at regular intervals, so that the tooth profile rotation mechanism gives an impact to the road surface.
- a distribution for example, elastic wave source density distribution
- the correction units 425 and 425a calculate a correction value f (x, y) that cancels out the bias of this distribution. Then, the correction units 425 and 425a correct the elastic wave source density distribution by multiplying the calculated correction value f (x, y) by the elastic wave source density distribution.
- the striking mechanism is not limited to the rotation mechanism of the tooth profile, and may be any mechanism as long as an impact can be applied to the road surface.
- the method of applying an impact to the road surface by the striking mechanism is not limited to the hand-pushed vehicle, and may be a method of towing the striking mechanism with the vehicle.
- a fixed sprinkler is a spraying device capable of spraying water droplets on a predetermined range of a road surface at regular time intervals.
- the impact applied to the road surface is water droplets.
- the fixed sprinklers are installed on each of a plurality of streets installed outside the road on which the vehicle 10 can travel. When water droplets are sprayed on the road surface by such a fixed sprinkler, an impact is applied to a predetermined range of the road surface.
- the distribution generation unit 424 generates an elastic wave source density distribution based on the applied impact. Since different water droplets are applied to the road surface for each fixed sprinkler, the distribution generation unit 424 generates an elastic wave source density distribution according to the water droplets applied from each fixed sprinkler.
- the correction units 425 and 425a calculate a correction value f (x, y) for each fixed sprinkler so as to cancel the bias according to the water droplets applied from each fixed sprinkler. Then, the correction units 425 and 425a correct each elastic wave source density distribution by multiplying each of the calculated correction values f (x, y) by the elastic source density distribution corresponding to each fixed sprinkler.
- the elastic wave source density distribution was described as an example as information based on the position orientation.
- the information based on the position orientation may be any information as long as it is the information obtained by using the orientation result.
- the information based on position orientation may be average amplitude.
- the average amplitude is calculated by averaging the amplitude of the elastic wave of the first hit detected by the sensor 20 for each impact in each predetermined region.
- the predetermined area is a area having a predetermined size.
- the amplitude of the first hit elastic wave is used to calculate the average in a predetermined region including the position where the first hit elastic wave is generated. Therefore, the average amplitude is close to 0 in a predetermined region where elastic waves are not generated because no impact is applied.
- the correction unit 425 corrects the average amplitude value for each predetermined region using the correction value f (x, y) determined according to the impact. For example, the correction unit 425 corrects with a correction value f (x, y) that reduces the value of the average amplitude in a predetermined region corresponding to the passing position of the traveling unit of the vehicle 10.
- the evaluation unit 426 evaluates the deterioration state of the structure 50 for each predetermined region based on the corrected average amplitude value. Specifically, the evaluation unit 426 evaluates a predetermined region corresponding to the passing position of the traveling portion of the vehicle 10 as a damaged region in which the corrected average amplitude value is less than the threshold value. Whether or not the region corresponds to the passing position of the traveling portion of the vehicle 10 may be determined based on the tread width information, or may be input from the outside.
- the evaluation unit 426 may evaluate as follows in addition to the conventional evaluation method.
- the evaluation unit 426 sets a plurality of regions within a predetermined range on the corrected elastic wave source density distribution AD. As a result, the evaluation unit 426 divides each region on the corrected elastic wave source density distribution AD.
- the evaluation unit 426 makes a comparison with the threshold value 15 for each divided region (hereinafter referred to as “divided region”). For example, the evaluation unit 426 compares the density in the divided region with the threshold value 15. As a result of comparison, the evaluation unit 426 evaluates a region having a density lower than the threshold value 15 as a damaged region.
- the plurality of sensors detect elastic waves generated from the structure.
- the position determination unit positions the positions of the sources of the plurality of elastic waves based on the plurality of elastic waves detected by each of the plurality of sensors.
- the correction unit corrects the information based on the position setting by the position setting unit by using the correction value determined according to the impact.
- the evaluation unit evaluates the deterioration state of the structure based on the corrected information. This makes it possible to improve the evaluation accuracy of the structure even when the impact applied to the surface of the structure is not uniform.
Landscapes
- Physics & Mathematics (AREA)
- Biochemistry (AREA)
- General Physics & Mathematics (AREA)
- Life Sciences & Earth Sciences (AREA)
- Chemical & Material Sciences (AREA)
- Analytical Chemistry (AREA)
- Pathology (AREA)
- General Health & Medical Sciences (AREA)
- Health & Medical Sciences (AREA)
- Immunology (AREA)
- Acoustics & Sound (AREA)
- Engineering & Computer Science (AREA)
- Signal Processing (AREA)
- Investigating Or Analyzing Materials By The Use Of Ultrasonic Waves (AREA)
- Traffic Control Systems (AREA)
Abstract
実施形態の構造物評価システムは、複数のセンサと、位置標定部と、補正部と、評価部とを持つ。複数のセンサは、構造物から発生した弾性波を検出する。位置標定部は、前記複数のセンサそれぞれによって検出された複数の弾性波に基づいて、前記複数の弾性波の発生源の位置を標定する。補正部は、衝撃に応じて定まる補正値を用いて、前記位置標定部による位置標定に基づく情報を補正する。評価部は、補正された前記情報に基づいて前記構造物の劣化状態を評価する。
Description
本発明の実施形態は、構造物評価システム、構造物評価装置及び構造物評価方法に関する。
橋梁のような構造物の表面にセンサを設置することで、構造物内部で発生する弾性波を検出することができる。さらに、複数のセンサを構造物の表面に設置することで、複数のセンサそれぞれで検出した弾性波の到達時刻の差に基づいて、弾性波の発生源(以下「弾性波源」という)の位置を標定することができる。外部から構造物の表面に衝撃を与えた場合にも構造物内部で弾性波が発生する。そのため、弾性波源の位置を標定することができる。
弾性波の伝搬経路に損傷がある場合、弾性波の伝搬が妨げられる。このような場合、弾性波源の標定結果の精度が低下してしまう。降雨時の雨滴による路面への衝突のように空間的に一様に付与される衝撃を構造物の表面に与えて対面に設置されたセンサによって弾性波を検出した場合、内部に損傷を有する領域では弾性波源の密度が低下して観測される。このような特性を利用して、構造物内部の損傷を検出することができる。一様に付与される衝撃を構造物の表面に与える手法を用いた場合、構造物内部に損傷がなければ弾性波源の分布は一様となる。この手法では、一様に付与される衝撃を構造物の表面に与えることを前提としている。そのため、構造物の表面に与えられる衝撃が一様ではない場合には評価精度が低下してしまう場合があった。
本発明が解決しようとする課題は、構造物の表面に与えられる衝撃が一様ではない場合であっても、構造物の評価精度を向上させることができる構造物評価システム、構造物評価装置及び構造物評価方法を提供することである。
実施形態の構造物評価システムは、複数のセンサと、位置標定部と、補正部と、評価部とを持つ。複数のセンサは、構造物から発生した弾性波を検出する。位置標定部は、前記複数のセンサそれぞれによって検出された複数の弾性波に基づいて、前記複数の弾性波の発生源の位置を標定する。補正部は、衝撃に応じて定まる補正値を用いて、前記位置標定部による位置標定に基づく情報を補正する。評価部は、補正された前記情報に基づいて前記構造物の劣化状態を評価する。
以下、実施形態の構造物評価システム、構造物評価装置及び構造物評価方法を、図面を参照して説明する。
(概要)
実施形態における構造物評価システムは、構造物の表面(以下「路面」という。)に与えられる衝撃が空間的に一様ではない場合であっても、構造物の評価精度を向上させることができるシステムである。路面に与えられる衝撃が空間的に一様ではない場合とは、所定の空間内で付与される衝撃の位置が偏っている場合である。例えば、路面に与えられる衝撃が空間的に一様ではない場合とは、図1に示すように路面(構造物50の表面)を車両10が通行する場合が想定される。
(概要)
実施形態における構造物評価システムは、構造物の表面(以下「路面」という。)に与えられる衝撃が空間的に一様ではない場合であっても、構造物の評価精度を向上させることができるシステムである。路面に与えられる衝撃が空間的に一様ではない場合とは、所定の空間内で付与される衝撃の位置が偏っている場合である。例えば、路面に与えられる衝撃が空間的に一様ではない場合とは、図1に示すように路面(構造物50の表面)を車両10が通行する場合が想定される。
図1は、実施形態における構造物評価システムの概要を説明するための図である。図1に示すような状況下では、車両10の走行部(例えば、タイヤ)と路面との接触により、路面に対して荷重がかかる。路面に対する荷重は、車両10の走行部によって引き起こされる。このように、車両10の走行部は、路面に衝撃を与える。その結果、構造物50内で弾性波11が発生する。一方で、路面の領域のうち車両10の走行部が通過していない領域には衝撃が与えられない。
弾性波11は、車両10の走行部が通過した位置12を中心に発生する。弾性波11は、位置12を起点として構造物50内を伝搬していく。構造物50内を伝搬した弾性波11は、複数のセンサ20-1~20-n(nは3以上の整数)によって検出される。車両10の通行する位置は1台ごとに異なることが考えられる。ただし、道路の幅によっては、多くの車両10はある程度定まった位置を通行すると考えられる。
したがって、多数の車両10の走行部の通過に起因する衝撃の付与位置の頻度分布は、例えば図1の下に示す分布13のように表すことができる。分布13において、横軸は道路幅の距離を表し、縦軸は衝撃が付与される頻度を表す。分布13に示すように、衝撃が付与される頻度が最も高くなるのは、車両10の走行部が通行すると想定される位置12である。一方で、位置12から離れるほど、衝撃が付与される頻度が低くなる。
図1に示す状況下で得られた弾性波11の検出結果に基づいて、弾性波源の密度を表す分布(以下「弾性波源密度分布」という。)を従来の手法により生成したとする。この場合に得られる弾性波源密度分布は、車両10の走行部の通過頻度が多い位置で弾性波源の密度が閾値以上(例えば、密な状態)、車両10の走行部の通過頻度が少ない位置で密度が閾値未満(例えば、疎な状態)といった偏りを持った分布になる。
このように、路面に与えられる衝撃が空間的に一様ではない場合に得られる弾性波源密度分布は、衝撃が付与されていない領域において損傷がない場合であっても弾性波源の密度が低くなり、衝撃が付与された領域に損傷がある場合であっても弾性波源の密度が高くなる傾向がある。すなわち、衝撃が付与されていない領域は、損傷がない場合であっても弾性波源の密度が閾値未満となる可能性が高く、衝撃が付与された領域は、損傷がある場合であっても弾性波源の密度が閾値以上となる可能性が高い。したがって、路面に与えられる衝撃が空間的に一様ではない場合に、従来の評価手法により構造物50の劣化状態を評価すると、構造物50内に損傷がない領域が損傷領域と評価され、構造物50内に損傷がある領域が健全な領域と評価されることがある。
損傷領域とは、構造物50内部に劣化が発生している領域である。劣化が発生している領域は、構造物50内部の一部に損傷が発生している領域である。健全な領域とは、損傷がない、又は、損傷はあるが損傷による影響が少ないと想定される領域である。従来評価手法では、上記のように構造物50の劣化状態の評価精度が低下してしまうことになる。従来評価手法は、弾性波源の密度が閾値未満の領域を損傷領域とみなす評価手法である。例えば、従来評価手法は、例えば国際公開第2017/217034号に公開されている手法である。
図2は、走行部の通過に起因する衝撃により発生した弾性波11の検出結果に基づいて生成された弾性波源密度分布Dの一例を表す図である。図2において横軸は車両の通行方向の距離を表し、縦軸は幅方向の距離を表す。弾性波源密度分布D上に示された点線14は、車両10の走行部の通過位置を表す。従来評価手法により弾性波源密度分布Dにおいて設定された閾値15よりも密度が低い領域を損傷領域として評価した場合、領域16が損傷領域と評価される。実際の損傷領域は、図2の領域17に示した縦方向に広い領域となっている。このように評価精度が低下した原因は、車両10の走行部の通過位置が図2に示した位置にあり、車両10の走行部の通過により弾性波源の密度に偏りが生じたことによると考えられる。
そこで、実施形態における構造物評価システムでは、構造物50内部で発生した弾性波11を検出する複数のセンサと、複数のセンサそれぞれによって検出された複数の弾性波11に基づいて複数の弾性波源の位置を標定する位置標定部と、衝撃に応じて定まる補正値を用いて、位置標定部による位置標定に基づく情報(例えば、弾性波源密度分布)を補正する補正部と、補正された情報に基づいて構造物50の劣化状態を評価する評価部とを備えている。
実施形態における構造物評価システムでは、衝撃に応じて定まる補正値を用いて、位置標定部による位置標定に基づく情報の偏りを軽減するように補正する。これにより、誤診断を軽減することができる。そのため、路面に与えられる衝撃が一様ではない場合であっても、構造物50の評価精度を向上させることが可能になる。
以下、実施形態における構造物評価システム100の詳細について説明する。
以下、実施形態における構造物評価システム100の詳細について説明する。
(第1の実施形態)
図3は、第1の実施形態における構造物評価システム100の構成を示す図である。
構造物評価システム100は、構造物50の健全性の評価に用いられる。以下の説明において、評価とは、ある基準に基づいて構造物50の健全性の度合い、すなわち構造物50の劣化状態を決定することを意味する。
図3は、第1の実施形態における構造物評価システム100の構成を示す図である。
構造物評価システム100は、構造物50の健全性の評価に用いられる。以下の説明において、評価とは、ある基準に基づいて構造物50の健全性の度合い、すなわち構造物50の劣化状態を決定することを意味する。
以下の説明では、構造物50の一例としてコンクリートで構成された橋梁を例に説明するが、構造物50は橋梁に限定される必要はない。構造物50は、亀裂の発生または進展、あるいは外的衝撃(例えば雨、人工雨など)に伴い弾性波11が発生する構造物であればどのようなものであってもよい。例えば、構造物50は、岩盤であってもよい。なお、橋梁は、河川や渓谷等の上に架設される構造物に限らず、地面よりも上方に設けられる種々の構造物(例えば高速道路の高架橋)なども含む。構造物50の厚さは、例えば15cm以上である。
構造物50の劣化状態の評価に影響を及ぼす損傷としては、例えば亀裂、空洞、土砂化等の弾性波11の伝搬を妨害する構造物内部の損傷がある。ここで、亀裂には、縦方向の亀裂、横方向の亀裂及び斜め方向の亀裂等が含まれる。縦方向の亀裂とは、路面に対して垂直な方向に生じている亀裂である。横方向の亀裂とは、路面に対して水平な方向に生じている亀裂である。斜め方向の亀裂とは、路面に対して水平及び垂直以外の方向に生じている亀裂である。土砂化とは、主にアスファルトとコンクリート床版の境界部でコンクリートが土砂状に変化する劣化である。
構造物評価システム100は、複数のセンサ20-1~20-n、信号処理部30及び構造物評価装置40を備える。複数のセンサ20-1~20-nそれぞれと信号処理部30とは、有線により通信可能に接続される。信号処理部30と構造物評価装置40とは、有線又は無線により通信可能に接続される。なお、以下の説明では、センサ20-1~20-nを区別しない場合にはセンサ20と記載する。
センサ20は、圧電素子を有し、構造物50内部から発生する弾性波11を検出する。センサ20は、構造物50の面上における弾性波11を検出することが可能な位置に設置される。例えば、センサ20は、路面、側面及び底面のいずれかの面上に設置される。センサ20は、検出した弾性波11を電気信号に変換する。以下の説明では、センサ20が、構造物50の底面に設置されている場合を例に説明する。
センサ20には、例えば10kHz~1MHzの範囲に感度を有する圧電素子が用いられる。センサ20は、周波数範囲内に共振ピークをもつ共振型、共振を抑えた広帯域型等の種類があるが、センサ20の種類はいずれでもよい。センサ20が弾性波11を検出する方法は、電圧出力型、抵抗変化型及び静電容量型等があるが、いずれの検出方法でもよい。
センサ20に代えて加速度センサが用いられてもよい。この場合、加速度センサは、構造物50内部で発生する弾性波11を検出する。そして、加速度センサは、センサ20と同様の処理を行うことによって、検出した弾性波11を電気信号に変換する。
センサ20と信号処理部30との間には、例えば不図示の増幅器及びA/D変換器が設けられる。
増幅器は、センサ20から出力された電気信号を増幅する。増幅器は、増幅後の電気信号をA/D変換器に出力する。増幅器は、例えばA/D変換器において処理ができる程度に電気信号を増幅する。
A/D変換器は、増幅された電気信号を量子化してデジタル信号に変換する。A/D変換器は、デジタル信号を信号処理部30に出力する。
増幅器は、センサ20から出力された電気信号を増幅する。増幅器は、増幅後の電気信号をA/D変換器に出力する。増幅器は、例えばA/D変換器において処理ができる程度に電気信号を増幅する。
A/D変換器は、増幅された電気信号を量子化してデジタル信号に変換する。A/D変換器は、デジタル信号を信号処理部30に出力する。
信号処理部30は、A/D変換器から出力されたデジタル信号を入力とする。信号処理部30は、入力したデジタル信号に対して信号処理を行う。信号処理部30が行う信号処理は、例えば、ノイズ除去、パラメータ抽出等である。信号処理部30は、信号処理後のデジタル信号を含む送信データを生成する。信号処理部30は、生成した送信データを構造物評価装置40に出力する。
信号処理部30は、アナログ回路又はデジタル回路を用いて構成される。デジタル回路は、例えばFPGA(Field Programmable Gate Array)やマイクロコンピュータにより実現される。デジタル回路は、専用のLSI(Large-Scale Integration)により実現されてもいい。また信号処理部30は、フラッシュメモリ等の不揮発メモリや、取り外し可能なメモリを搭載してもよい。
図4は、第1の実施形態における信号処理部30の機能を表す概略ブロック図である。信号処理部30は、波形整形フィルタ301、ゲート生成回路302、到達時刻決定部303、特徴量抽出部304、送信データ生成部305、メモリ306及び出力部307を備える。
波形整形フィルタ301は、入力されたデジタル信号から所定の帯域外のノイズ成分を除去する。波形整形フィルタ301は、例えばデジタルバンドパスフィルタ(BPF)である。波形整形フィルタ301は、ノイズ成分除去後のデジタル信号(以下「ノイズ除去信号」という。)をゲート生成回路302、到達時刻決定部303及び特徴量抽出部304に出力する。
ゲート生成回路302は、波形整形フィルタ301から出力されたノイズ除去信号を入力とする。ゲート生成回路302は、入力したノイズ除去信号に基づいてゲート信号を生成する。ゲート信号は、ノイズ除去信号の波形が持続しているか否かを示す信号である。
ゲート生成回路302は、例えばエンベロープ検出器及びコンパレータにより実現される。エンベロープ検出器は、ノイズ除去信号のエンベロープを検出する。エンベロープは、例えばノイズ除去信号を二乗し、二乗した出力値に対して所定の処理(例えばローパスフィルタを用いた処理やヒルベルト変換)を行うことで抽出される。コンパレータは、ノイズ除去信号のエンベロープが所定の閾値以上であるか否かを判定する。
ゲート生成回路302は、ノイズ除去信号のエンベロープが所定の閾値以上となった場合、ノイズ除去信号の波形が持続していることを示す第1のゲート信号を到達時刻決定部303及び特徴量抽出部304に出力する。一方、ゲート生成回路302は、ノイズ除去信号のエンベロープが所定の閾値未満になった場合、ノイズ除去信号の波形が持続していないことを示す第2のゲート信号を到達時刻決定部303及び特徴量抽出部304に出力する。
到達時刻決定部303は、波形整形フィルタ301から出力されたノイズ除去信号と、ゲート生成回路302から出力されたゲート信号とを入力とする。到達時刻決定部303は、第1のゲート信号が入力されている間に入力されたノイズ除去信号を用いて、弾性波到達時刻を決定する。到達時刻決定部303は、決定した弾性波到達時刻を時刻情報として送信データ生成部305に出力する。到達時刻決定部303は、第2のゲート信号が入力されている間に処理を行わない。
特徴量抽出部304は、波形整形フィルタ301から出力されたノイズ除去信号と、ゲート生成回路302から出力されたゲート信号とを入力とする。特徴量抽出部304は、第1のゲート信号が入力されている間に入力されたノイズ除去信号を用いて、ノイズ除去信号の特徴量を抽出する。特徴量抽出部304は、第2のゲート信号が入力されている間に処理を行わない。特徴量は、ノイズ除去信号の特徴を示す情報である。
特徴量は、例えば波形の振幅[mV]、波形の立ち上がり時間[usec]、ゲート信号の持続時間[usec]、ゼロクロスカウント数[times]、波形のエネルギー[arb.]、周波数[Hz]及びRMS(Root Mean Square:二乗平均平方根)値等である。特徴量抽出部304は、抽出した特徴量に関するパラメータを送信データ生成部305に出力する。特徴量抽出部304は、特徴量に関するパラメータを出力する際に、特徴量に関するパラメータにセンサIDを対応付ける。センサIDは、構造物50の健全性の評価対象となる領域(以下「評価領域」という。)に設置されているセンサ20を識別するための識別情報を表す。
波形の振幅は、例えばノイズ除去信号の中で最大振幅の値である。波形の立ち上がり時間は、例えばゲート信号の立ち上がり開始からノイズ除去信号が最大値に達するまでの時間T1である。ゲート信号の持続時間は、例えばゲート信号の立ち上がり開始から振幅が予め設定される値よりも小さくなるまでの時間である。ゼロクロスカウント数は、例えばゼロ値を通る基準線をノイズ除去信号が横切る回数である。
波形のエネルギーは、例えば各時点においてノイズ除去信号の振幅を二乗したものを時間積分した値である。なお、エネルギーの定義は、上記例に限定されず、例えば波形の包絡線を用いて近似されたものでもよい。周波数は、ノイズ除去信号の周波数である。RMS値は、例えば各時点においてノイズ除去信号の振幅を二乗して平方根により求めた値である。
送信データ生成部305は、センサIDと、時刻情報と、特徴量に関するパラメータとを入力とする。送信データ生成部305は、入力したセンサIDと、時刻情報と、特徴量に関するパラメータとを含む送信データを生成する。
メモリ306は、送信データを記憶する。メモリ306は、例えばデュアルポートRAM(Random Access Memory)である。
出力部307は、メモリ306に記憶されている送信データを構造物評価装置40に逐次出力する。
出力部307は、メモリ306に記憶されている送信データを構造物評価装置40に逐次出力する。
図3に戻って説明を続ける。
構造物評価装置40は、通信部41、制御部42、記憶部43及び表示部44を備える。
通信部41は、信号処理部30から出力された送信データを受信する。
制御部42は、構造物評価装置40全体を制御する。制御部42は、CPU(Central Processing Unit)等のプロセッサやメモリを用いて構成される。制御部42は、プログラムを実行することによって、取得部421、イベント抽出部422、位置標定部423、分布生成部424、補正部425及び評価部426として機能する。
構造物評価装置40は、通信部41、制御部42、記憶部43及び表示部44を備える。
通信部41は、信号処理部30から出力された送信データを受信する。
制御部42は、構造物評価装置40全体を制御する。制御部42は、CPU(Central Processing Unit)等のプロセッサやメモリを用いて構成される。制御部42は、プログラムを実行することによって、取得部421、イベント抽出部422、位置標定部423、分布生成部424、補正部425及び評価部426として機能する。
取得部421、イベント抽出部422、位置標定部423、分布生成部424、補正部425及び評価部426の機能部のうち一部または全部は、ASIC(Application Specific Integrated Circuit)やPLD(Programmable Logic Device)、FPGAなどのハードウェアによって実現されてもよいし、ソフトウェアとハードウェアとの協働によって実現されてもよい。プログラムは、コンピュータ読み取り可能な記録媒体に記録されてもよい。コンピュータ読み取り可能な記録媒体とは、例えばフレキシブルディスク、光磁気ディスク、ROM、CD-ROM等の可搬媒体、コンピュータシステムに内蔵されるハードディスク等の記憶装置などの非一時的な記憶媒体である。プログラムは、電気通信回線を介して送信されてもよい。
取得部421、イベント抽出部422、位置標定部423、分布生成部424、補正部425及び評価部426の機能の一部は、予め構造物評価装置40に搭載されている必要はなく、追加のアプリケーションプログラムが構造物評価装置40にインストールされることで実現されてもよい。
取得部421は、各種情報を取得する。例えば、取得部421は、通信部41によって受信された送信データを取得する。取得部421は、取得した送信データを記憶部43に保存する。第1の実施形態において取得部421は、評価対象となる構造物50を走行した車両10に関する情報(以下「車両情報」という。)を所定期間分取得する。
車両情報は、例えば所定の期間に構造物50を走行した車両10の車種情報と、構造物50の車両10の通行量情報である。車両10の車種情報には、少なくとも車両10のトレッド幅の情報が含まれる。車両10の通行量情報は、所定の期間に構造物50をどの車種の車両10が何台通過したかを示す情報である。取得部421は、車両情報を、ユーザの入力によって取得してもよいし、交通情報を記憶しているサーバから取得してもよい。
イベント抽出部422は、記憶部43に記憶されている送信データの中から1イベントにおける送信データを抽出する。イベントとは、構造物50で起こった弾性波発生事象を表す。本実施形態における弾性波発生事象は、車両10による路面の通過である。1回のイベントが発生した場合、複数のセンサ20で略同時刻に弾性波11が検出されることになる。すなわち、記憶部43には、略同時刻に検出された弾性波11に関する送信データが記憶されていることになる。そこで、イベント抽出部422は、所定の時間窓を設け、到達時刻が時間窓の範囲内に存在する全ての送信データを1イベントにおける送信データとして抽出する。イベント抽出部422は、抽出した1イベントにおける送信データを位置標定部423に出力する。
時間窓の範囲Twは、対象とする構造物50における弾性波伝搬速度vと、最大のセンサ間隔dmaxを用いて、Tw≧dmax/vの範囲になるように決定してもよい。誤検出を避けるためには、Twをできるだけ小さい値に設定することが望ましいため、実質的にはTw=dmax/vとすることができる。弾性波伝搬速度vは、予め求められていてもよい。
位置標定部423は、センサ位置情報と、イベント抽出部422によって抽出された複数の送信データそれぞれに含まれるセンサID及び時刻情報とに基づいて弾性波源の位置標定を行う。
センサ位置情報には、センサIDに対応付けてセンサ20の設置位置に関する情報が含まれる。センサ位置情報は、例えば緯度および経度、あるいは構造物50の基準となる位置からの水平方向および垂直方向の距離などのセンサ20の設置位置に関する情報を含む。位置標定部423は、センサ位置情報を予め保持している。センサ位置情報は、位置標定部423が弾性波源の位置標定を行う前であればどのタイミングで位置標定部423に記憶されてもよい。
センサ位置情報は、記憶部43に記憶されていてもよい。この場合、位置標定部423は、位置標定を行うタイミングで記憶部43からセンサ位置情報を取得する。弾性波源の位置の標定には、カルマンフィルタ、最小二乗法などが用いられてもよい。位置標定部423は、計測期間中に得られた弾性波源の位置情報を分布生成部424に出力する。
分布生成部424は、位置標定部423から出力された複数の弾性波源の位置情報を入力とする。分布生成部424は、入力した複数の弾性波源の位置情報を用いて、弾性波源分布を生成する。弾性波源分布は、弾性波源の位置が示された分布を表す。より具体的には、弾性波源分布は、横軸を通行方向の距離とし、縦軸を幅方向の距離として、評価対象となる構造物50を表した仮想的なデータ上において弾性波源の位置を示す点が示された分布である。分布生成部424は、弾性波源分布を用いて弾性波源密度分布を生成する。例えば、分布生成部424は、弾性波源の位置を図2に示すようなコンター図で表すことによって弾性波源密度分布を生成する。
補正部425は、衝撃に応じて定まる補正値を用いて、位置標定部423による位置標定に基づく情報を補正する。第1の実施形態において衝撃に応じて定まる補正値とは、取得部421によって取得された車両情報により得られる補正値である。補正値は、車両10の走行部の通過位置に極値を持つ。位置標定に基づく情報は、位置標定する前(例えば、弾性波の振幅)又は標定結果を用いて得られる情報である。例えば、位置標定に基づく情報は、弾性波源密度分布である。以下の説明では、位置標定に基づく情報が、弾性波源密度分布である場合を例に説明する。
評価部426は、補正された情報に基づいて構造物50の劣化状態を評価する。具体的には、評価部426は、補正された弾性波源密度分布を用いて構造物50の劣化状態を評価する。例えば、評価部426は、弾性波源の密度が閾値以上の領域を健全な領域と評価し、弾性波源の密度が閾値未満の領域を損傷領域と評価する。
記憶部43は、取得部421によって取得された送信データ及び車両情報を記憶する。記憶部43は、磁気ハードディスク装置や半導体記憶装置などの記憶装置を用いて構成される。
表示部44は、評価部426の制御に従って評価結果を表示する。表示部44は、液晶ディスプレイ、有機EL(Electro Luminescence)ディスプレイ等の画像表示装置である。表示部44は、画像表示装置を構造物評価装置40に接続するためのインタフェースであってもよい。この場合、表示部44は、評価結果を表示するための映像信号を生成し、自身に接続されている画像表示装置に映像信号を出力する。
図5は、第1の実施形態における構造物評価システム100による劣化状態の評価処理の流れを示すシーケンス図である。図5の処理は、評価対象となる構造物50を車両10が走行したことに応じて実行される。
評価対象となる構造物50を車両10が走行すると、車両10の走行部が路面に接触する。これにより、構造物50内で弾性波11が発生する。複数のセンサ20それぞれは、構造物50内で発生した弾性波11を検出する(ステップS101)。複数のセンサ20それぞれは、検出した弾性波11を電気信号に変換して信号処理部30に出力する(ステップS102)。複数のセンサ20それぞれから出力された電気信号は、不図示の増幅器に増幅される。増幅後の電気信号は、A/D変換器によってデジタル信号に変換される。
評価対象となる構造物50を車両10が走行すると、車両10の走行部が路面に接触する。これにより、構造物50内で弾性波11が発生する。複数のセンサ20それぞれは、構造物50内で発生した弾性波11を検出する(ステップS101)。複数のセンサ20それぞれは、検出した弾性波11を電気信号に変換して信号処理部30に出力する(ステップS102)。複数のセンサ20それぞれから出力された電気信号は、不図示の増幅器に増幅される。増幅後の電気信号は、A/D変換器によってデジタル信号に変換される。
信号処理部30は、A/D変換器から出力されたデジタル信号を入力する。信号処理部30の到達時刻決定部303は、入力したデジタル信号を用いて各弾性波11の到達時刻を決定する(ステップS103)。具体的には、到達時刻決定部303は、第1のゲート信号が入力されている間に入力されたデジタル信号であるノイズ除去信号を用いて弾性波到達時刻を決定する。到達時刻決定部303は、決定した弾性波到達時刻を時刻情報として送信データ生成部305に出力する。到達時刻決定部303は、この処理を、入力した全てのデジタル信号に対して行う。
信号処理部30の特徴量抽出部304は、第1のゲート信号が入力されている間に入力されたデジタル信号であるノイズ除去信号を用いて、ノイズ除去信号の特徴量を抽出する(ステップS104)。特徴量抽出部304は、抽出した特徴量に関するパラメータを送信データ生成部305に出力する。送信データ生成部305は、センサIDと、時刻情報と、特徴量に関するパラメータとを含む送信データを生成する(ステップS105)。出力部307は、送信データを構造物評価装置40に逐次出力する(ステップS106)。
構造物評価装置40の通信部41は、信号処理部30から出力された送信データを受信する。取得部421は、通信部41によって受信された送信データを取得する。取得部421は、取得した送信データを記憶部43に記録する(ステップS107)。イベント抽出部422は、記憶部43に記憶されている送信データの中から1イベントにおける送信データを抽出する。イベント抽出部422は、抽出した1イベントにおける送信データを位置標定部423及び分布生成部424に出力する。
位置標定部423は、イベント抽出部422から出力された送信データに含まれるセンサID及び時刻情報と、予め保持しているセンサ位置情報とに基づいて弾性波源の位置を標定する(ステップS108)。具体的には、まず位置標定部423は、複数のセンサ20それぞれへの弾性波11の到達時刻の差を算出する。次に、位置標定部423は、センサ位置情報と、到達時刻の差の情報とを用いて弾性波源の位置を標定する。
位置標定部423は、計測期間中にイベント抽出部422から1イベントの送信データが出力される度にステップS108の処理を実行する。これにより、位置標定部423は、複数の弾性波源の位置を標定する。位置標定部423は、複数の弾性波源の位置情報を分布生成部424に出力する。
分布生成部424は、位置標定部423から出力された複数の弾性波源の位置情報を用いて弾性波源分布を生成する。具体的には、分布生成部424は、得られた複数の弾性波源の位置情報で示される弾性波源の位置を、仮想的なデータ上にプロットすることによって弾性波源分布を生成する。分布生成部424は、生成した弾性波源分布をコンター図で表すことによって弾性波源密度分布を生成する(ステップS109)。分布生成部424は、生成した弾性波源密度分布を補正部425に出力する。
補正部425は、分布生成部424から出力された弾性波源密度分布と、記憶部43に記憶されている車両情報とを入力する。補正部425は、入力した車両情報を用いて得られる補正値で弾性波源密度分布を補正する(ステップS110)。
具体的には、まず補正部425は、車両情報を用いて下記式(1)に基づいて補正値f(x、y)を算出する。

式(1)においてyは道路の幅方向の距離、kは係数、aは走行部位置、wは通行位置のばらつき度合いを表す。式(1)により得られる補正値は、y方向の走行部の通過位置にピークを持ち、x方向の通行方向には一定の値を持つ分布となる。補正の際に使用する走行部位置としては、車両情報に含まれる車両10のトレッド幅を参照することができる。
弾性波11の発生が多いと考えられる大型車両の場合、10tトラックでトレッド幅が1900mm程度である。このため、走行部位置aは、車線の中央より±950mmの位置に設定することができる。普通車両の場合、トレッド幅が1500mm程度である。このため、走行部位置aは、車線の中央より±750mmに設定することができる。
評価対象となる構造物50の交通事情に応じて、走行部位置を決めることもできる。評価対象となる構造物50が大型車両の通らない道路である場合、トレッド幅として例えば普通車の1500mm程度を採用し、車線の中央より±750mmに設定することもできる。構造物50の交通事情の情報は、外部から構造物評価装置40に入力されてもよいし、車両情報に含まれていてもよい。
補正部425は、車両情報に含まれる車種の情報の統計値に基づいて走行部位置aを決定してもよい。例えば、補正部425は、車両情報に含まれる車種の情報の統計結果から、通行数が最多の車種のトレッド幅を走行部位置aとしてもよい。例えば、補正部425は、車両情報に含まれる車種の情報の統計結果から、トレッド幅が最大の車種のトレッド幅を走行部位置aとしてもよいし、平均のトレッド幅を走行部位置aとしてもよい。
通行位置のばらつきに関しては、評価対象となる構造物50の状況により定めることができる。例えば、高速道路や道幅の広い道路においては、各車両10の通行位置のばらつきは大きくなる。一方で、車両10が一台しか通行できないような狭い道路においては、どの車両も略同じ位置を通行するためばらつきは小さくなる。したがって、補正部425は、通行量情報、道路幅や車線変更の頻度等を参照することで、通行位置のばらつき度合に関するパラメータを適切に設定する。
上記の式(1)に基づいて算出された補正値の一例を図6に示す。図6において横軸は幅方向の距離を表し、縦軸は補正値f(x、y)を表す。図6に示すように、補正値f(x、y)は、少なくとも車両10の走行部の通過位置に対応する弾性波源密度分布上の位置の値(例えば、密度)を減少させるような値を有する分布で表される。すなわち、補正値f(x、y)は、車両10の走行部の通過位置に対応する弾性波源密度分布上の位置の値を最も減少させ、通過位置から離れる位置ほど減少させないような値を有する分布で表される。
図6では、車両10の走行部の通過位置が2つある場合の補正値f(x、y)を例に示している。そのため、図6に示す補正値f(x、y)では、車両10の走行部の通過位置に対応する弾性波源密度分布上の位置の値を最も減少させるような値を2つ有する。評価領域によっては、車両10の走行部の通過位置が1つの場合もある。そのため、補正値f(x、y)では、車両10の走行部の通過位置に対応する弾性波源密度分布上の位置の値を最も減少させるような値を1つ以上有していればよい。
補正部425は、算出した補正値f(x、y)を、弾性波源密度分布に掛け合わせることによって弾性波源密度分布を補正する。具体的には、補正部425は、弾性波源密度分布の幅方向に対して、算出した補正値f(x、y)の幅方向の距離に応じた補正値f(x、y)をそれぞれ乗算する。
例えば、補正部425は、弾性波源密度分布の幅方向の距離“500”の位置の密度の値に対して、算出した補正値f(x、y)の幅方向の距離“500”の位置に応じた補正値f(x、y)を乗算する。補正部425は、弾性波源密度分布の通行方向に対しても同様に、幅方向の距離に応じた補正値f(x、y)をそれぞれ乗算する。例えば、補正部425は、弾性波源密度分布の幅方向の距離“500”の位置に対応する通行方向の距離“0~3000”の位置の密度の値全てに対して、算出した補正値f(x、y)の幅方向の距離“500”の位置に応じた補正値f(x、y)を乗算する。
補正部425は、上記の処理により弾性波源密度分布を補正することで、図7に示す補正後の弾性波源密度分布ADを生成する。補正部425は、補正後の弾性波源密度分布ADを評価部426に出力する。
図7は、補正後の弾性波源密度分布ADの一例を表す図である。図7において、横軸は車両の通行方向の距離を表し、縦軸は幅方向の距離を表す。図7に示す補正後の弾性波源密度分布ADは、図2に示した弾性波源密度分布Dに比べて、車両10の走行部の通行による影響が軽減されていることがわかる。車両10の走行部の通行による影響とは、車両10の走行部が通行した位置の弾性波源の密度が高くなることである。評価部426は、補正部425から出力された補正後の弾性波源密度分布ADを用いて、構造物50の劣化状態を評価する(ステップS111)。
評価部426は、従来評価手法により補正後の弾性波源密度分布ADで設定された閾値15よりも密度が低い領域を損傷領域として評価する。この場合、図7に示す領域16が損傷領域として評価される。評価部426は、評価結果を表示部44に出力する。表示部44は、評価部426から出力された評価結果を表示する(ステップS112)。例えば、表示部44は、評価結果として、補正後の弾性波源密度分布を表示してもよいし、損傷領域とみられる領域を他の領域と表示態様を変えて表示してもよい。
以上のように構成された構造物評価システム100では、衝撃に応じて定まる補正値f(x、y)を用いて、位置標定部による位置標定に基づく情報の偏りを軽減するように補正する。より具体的には、構造物評価装置40は、評価対象となる構造物50を走行した車両10の車両情報から将来の衝撃に対する補正値f(x、y)を算出する。そして、構造物評価装置40は、算出した補正値f(x、y)を用いて、位置標定に基づく情報である弾性波源密度分布における車両10の走行部の通過に起因する衝撃の影響を補正する。これにより、誤診断を軽減することができる。そのため、路面に与えられる衝撃が一様ではない場合であっても、構造物50の評価精度を向上させることが可能になる。
補正部425は、少なくとも衝撃が付与される位置における情報を補正するための極値部分を1つ以上有する補正値f(x、y)で、弾性波源密度分布を補正する。衝撃が付与される位置における情報は、例えば、車両10の走行部の通行により影響を受ける位置における情報である。上記のように、車両10の走行部が通行する位置は、車両10の走行部が通行しない位置に比べて密度が高くなる傾向がある。そこで、補正部425では、車両10の走行部の通行により生じる影響を軽減するために極値部分を1つ以上有する補正値f(x、y)で補正を行う。これにより、車両10の走行部の通行により生じる影響を軽減することができる。その結果、路面に与えられる衝撃が一様ではない場合であっても、構造物50の評価精度を向上させることが可能になる。
補正部425は、道路の幅方向の距離毎に定められた補正値f(x、y)を用いて、車両10の通行方向における弾性波源密度分布を補正する。1つの車両10は、同じトレッド幅で道路を走行する。したがって、車両10の通行方向で見ると図2に示すように路面に対して直線状に衝撃(点線14)が付与されることになる。そこで、補正部425は、幅方向の距離毎に補正値f(x、y)を算出し、1つの幅方向の距離の位置から見た通行方向で同一の補正値f(x、y)を用いる。例えば、補正部425は、幅方向の距離の位置“500”から見た通行方向の距離“0~3000”の位置における値に対して同一の補正値f(x、y)を用いる。これにより、幅方向の距離が同じであって通行方向の距離が異なる位置における補正値を全て算出する必要がない。そのため、簡便に補正を行うことができる。
補正部425は、車両10の走行部と路面との接触により生じる衝撃の発生位置に基づいて補正値を算出する。これにより、補正部425は、車両10の走行部の通行による影響をより軽減させる位置を加味して補正値を算出することができる。例えば、補正部425は、車両10の走行部の通行による影響が大きい位置における値を最も減少させるような補正値を算出することができる。これにより、誤診断を軽減することができる。そのため、路面に与えられる衝撃が一様ではない場合であっても、構造物50の評価精度を向上させることが可能になる。
以下、構造物評価システム100の変形例について説明する。
補正値は、式(1)で得られる形に限定されない。例えば、補正値は、図8に示すように、矩形あるいは矩形に近い形状の関数によって表される分布であってもよい。
補正値は、式(1)で得られる形に限定されない。例えば、補正値は、図8に示すように、矩形あるいは矩形に近い形状の関数によって表される分布であってもよい。
補正部425は、車両情報から得られる車両10の車種の割合に応じて、車種ごとのトレッド幅に対して重み付けした分布を重ね合わせることで、より実際に近い補正値f(x、y)を算出してもよい。
道幅が非常に細いといった状況により、どの車両10も略同じ位置を走行する場合、轍以外の領域ではほとんど弾性波11を発生するような衝撃が付与されない場合も起こり得る。そこで、評価部426は、評価対象領域のうち衝撃が付与された頻度が閾値以上と想定される領域の劣化状態を評価するように構成されてもよい。
上記の実施形態では、補正部425が、車両情報における車両10のトレッド幅と、通行量情報とを用いて補正値f(x、y)を算出する構成を示したが、補正部425は車両10のトレッド幅に基づいて補正値f(x、y)を算出してもよい。このように構成される場合、例えば補正部425は、上記の式(1)において通行位置のばらつき度合いwを1として補正値f(x、y)を算出する。走行部位置aは、上記の実施形態と同様に求められてもよい。
これにより、補正部425は、通行量情報が得られなかったとしてもトレッド幅の情報により補正値f(x、y)を算出することができる。そのため、少ない情報量で補正を行うことが可能になる。
これにより、補正部425は、通行量情報が得られなかったとしてもトレッド幅の情報により補正値f(x、y)を算出することができる。そのため、少ない情報量で補正を行うことが可能になる。
(第2の実施形態)
第1の実施形態では、補正部425が車両情報を用いて補正値f(x、y)を算出する構成を示した。第2の実施形態では、センサ20から得られる電気信号に基づいて車両10の通過した位置を推定して補正値f(x、y)を取得する構成について説明する。
第1の実施形態では、補正部425が車両情報を用いて補正値f(x、y)を算出する構成を示した。第2の実施形態では、センサ20から得られる電気信号に基づいて車両10の通過した位置を推定して補正値f(x、y)を取得する構成について説明する。
図9は、第2の実施形態における構造物評価システム100aの構成を示す図である。第2の実施形態における構造物評価システム100aでは、構造物評価装置40に代えて構造物評価装置40aが備えられる点以外は第1の実施形態と同様である。以下、相違点に係る構造物評価装置40aの構成について説明する。
構造物評価装置40aは、通信部41、制御部42a、記憶部43a及び表示部44を備える。制御部42aは、構造物評価装置40a全体を制御する。制御部42aは、CPU等のプロセッサやメモリを用いて構成される。制御部42aは、プログラムを実行することによって、取得部421a、イベント抽出部422、位置標定部423、分布生成部424、補正部425a及び評価部426として機能する。
取得部421a、イベント抽出部422、位置標定部423、分布生成部424、補正部425a及び評価部426の機能部のうち一部または全部は、ASICやPLD、FPGAなどのハードウェアによって実現されてもよいし、ソフトウェアとハードウェアとの協働によって実現されてもよい。プログラムは、コンピュータ読み取り可能な記録媒体に記録されてもよい。コンピュータ読み取り可能な記録媒体とは、例えばフレキシブルディスク、光磁気ディスク、ROM、CD-ROM等の可搬媒体、コンピュータシステムに内蔵されるハードディスク等の記憶装置などの非一時的な記憶媒体である。プログラムは、電気通信回線を介して送信されてもよい。
取得部421a、イベント抽出部422、位置標定部423、分布生成部424、補正部425a及び評価部426の機能の一部は、予め構造物評価装置40aに搭載されている必要はなく、追加のアプリケーションプログラムが構造物評価装置40aにインストールされることで実現されてもよい。
制御部42aは、取得部421及び補正部425に代えて取得部421a及び補正部425aを備える点で制御部42と構成が異なる。以下、相違点について説明する。
取得部421aは、各種情報を取得する。例えば、取得部421aは、通信部41によって受信された送信データを取得する。取得部421aは、取得した送信データを記憶部43に保存する。第2の実施形態において取得部421aは、評価対象となる構造物50において健全な領域の位置を示す情報(以下「健全位置情報」という。)を取得する。取得部421aは、ユーザの入力によって健全位置情報を取得する。
取得部421aは、各種情報を取得する。例えば、取得部421aは、通信部41によって受信された送信データを取得する。取得部421aは、取得した送信データを記憶部43に保存する。第2の実施形態において取得部421aは、評価対象となる構造物50において健全な領域の位置を示す情報(以下「健全位置情報」という。)を取得する。取得部421aは、ユーザの入力によって健全位置情報を取得する。
補正部425aは、衝撃に応じて定まる補正値f(x、y)を用いて、位置標定部423による位置標定に基づく情報を補正する。第2の実施形態において衝撃に応じて定まる補正値とは、センサ20から得られる電気信号に基づいて得られる補正値である。例えば、第2の実施形態において衝撃に応じて定まる補正値は、センサ20から得られる電気信号に基づいてトレッド幅を算出して得られる補正値である。
記憶部43aは、取得部421aによって取得された送信データ及び健全位置情報を記憶する。記憶部43aは、磁気ハードディスク装置や半導体記憶装置などの記憶装置を用いて構成される。
第2の実施形態における構造物評価システム100aによる劣化状態の評価処理の流れについて説明する。第2の実施形態における構造物評価システム100aでは、図5に示したステップS110の処理が第1の実施形態と異なる。以下、その点について説明する。
補正部425aは、分布生成部424から出力された弾性波源密度分布と、記憶部43aに記憶されている健全位置情報とを入力する。補正部425aは、入力した弾性波源密度分布と、健全位置情報とに基づいて弾性波源密度分布を補正する(ステップS110)。具体的には、まず補正部425aは、弾性波源密度分布を用いて車両10の走行部の通過位置を推定する。
補正部425aは、分布生成部424から出力された弾性波源密度分布と、記憶部43aに記憶されている健全位置情報とを入力する。補正部425aは、入力した弾性波源密度分布と、健全位置情報とに基づいて弾性波源密度分布を補正する(ステップS110)。具体的には、まず補正部425aは、弾性波源密度分布を用いて車両10の走行部の通過位置を推定する。
上述したように、車両10が路面を通過した場合には、弾性波源密度分布の通行方向の密度が連続して高くなる傾向がある。より具体的には、車両10の走行部の通過位置に対応する弾性波源密度分布上の位置の密度が通行方向に連続して高くなる傾向がある。これは、車両10が路面を走行することによって、車両10の通行方向に対して連続して衝撃が付与されるためである。そこで、補正部425aは、第1の条件及び第2の条件に基づいて車両10の走行部の通過位置を推定する。
第1の条件は、弾性波源密度分布の通行方向において密度が第1の閾値以上となっている領域が第1の距離以上連続していることである。第2の条件は、第1の条件を満たす領域が幅方向に2つ以上存在することである。補正部425aは、第2の条件を満たす場合に、第1の条件を満たす領域それぞれを車両10の走行部の通過位置と推定する。
次に、補正部425aは、推定した車両10の走行部の通過位置に対応する弾性波源密度分布上の位置の値を閾値以上減少させるような補正値f(x、y)を算出する。例えば、補正部425aは、推定した車両10の走行部の通過位置に対応する弾性波源密度分布上の位置の値を最も減少させるような補正値f(x、y)を算出する。補正部425aは、補正値f(x、y)を算出する際、健全位置情報を用いる。例えば、補正部425aは、健全位置情報で示される領域の密度の値(以下「基準値」という。)を基準として補正値f(x、y)を算出する。補正部425aは、推定した車両10の走行部の通過位置に対応する弾性波源密度分布上の位置の値を基準値に合わせるように補正値の最低値を決定する。補正部425aは、算出した補正値f(x、y)を、弾性波源密度分布に掛け合わせることによって弾性波源密度分布を補正する。
以上のように構成された構造物評価システム100aでは、衝撃に応じて定まる補正値f(x、y)を弾性波源密度分布から取得する。より具体的には、構造物評価装置40aは、車両10が評価対象となる構造物50を走行したことによって得られる弾性波源密度分布から過去の衝撃に対する補正値f(x、y)を算出する。そして、構造物評価装置40aは、算出した補正値f(x、y)を用いて、位置標定に基づく情報である弾性波源密度分布における車両10の走行部の通過に起因する衝撃の影響を補正する。これにより、誤診断を軽減することができる。そのため、路面に与えられる衝撃が一様ではない場合であっても、構造物50の評価精度を向上させることが可能になる。
以下、構造物評価システム100aの変形例について説明する。
評価領域によっては、車両10の走行部の通過位置が1つの場合もある。そこで、補正部425aは、以下のように車両10の走行部の通過位置を推定してもよい。補正部425aは、第1の条件を満たし、第2の条件を満たさない場合には、第1の条件を満たす1つの領域を車両10の走行部の通過位置と推定する。この場合、補正部425aは、推定した車両10の走行部の通過位置に対応する弾性波源密度分布上の位置の値を最も減少させるような補正値f(x、y)を算出する。
このように構成されることによって、評価領域内において車両10の通過位置が1つしかない場合であっても、車両10の走行部の通過に起因する衝撃の影響を補正することができる。その結果、構造物50の評価精度を向上させることが可能になる。
上記の実施形態では、補正部425aが、弾性波源密度分布から車両10の通過位置を推定して補正値f(x、y)を取得する構成を示した。これに対し、補正部425aは、ユーザによって生成された補正値f(x、y)を用いて弾性波源密度分布を補正するように構成されてもよい。このように構成される場合、ステップS109の処理において分布生成部424は、生成した弾性波源密度分布を表示部44に出力する。表示部44は、弾性波源密度分布を表示する。
ユーザは、表示部44に表示された弾性波源密度分布を参照して、車両10の走行部が通過した位置を把握する。そしてユーザは、車両10の走行部が通過したことにより生じる影響を抑制可能な補正値f(x、y)を生成して構造物評価装置40aに入力する。影響を抑制可能な補正値f(x、y)とは、車両10の走行部が通過したことで高くなった弾性波源の密度に相当する値を減少させることが可能な値である。例えば、影響を抑制可能な補正値f(x、y)は、車両10の走行部が通過したことにより生じる影響を打ち消すことができるような値であることが望ましい。補正部425aは、入力された補正値f(x、y)を用いて弾性波源密度分布を補正する。
このように構成されることによって、ユーザの視認により車両10の走行部が通過した位置を把握している。これにより、大まかに車両10の走行部が通過した位置を推定することができる。そして、ユーザが、車両10の走行部が通過したことにより生じる影響を抑制可能な補正値f(x、y)を生成して構造物評価装置40aに入力する。これにより、構造物評価装置40aでは、補正値f(x、y)を算出する必要がない。そのため、処理負荷を軽減することができるとともに、路面に与えられる衝撃が一様ではない場合であっても、構造物50の評価精度を向上させることが可能になる。
道幅が非常に細いといった状況により、どの車両10も略同じ位置を走行する場合、轍以外の領域ではほとんど弾性波11を発生するような衝撃が付与されない場合も起こり得る。そこで、評価部426aは、評価対象領域のうち衝撃が付与された頻度が閾値以上と想定される領域の劣化状態を評価するように構成されてもよい。
このように構成されることによって、処理負荷を軽減することができるとともに、誤診断を抑制することができる。
このように構成されることによって、処理負荷を軽減することができるとともに、誤診断を抑制することができる。
(第3の実施形態)
第1の実施形態及び第2の実施形態では、補正値f(x、y)を用いて弾性波源密度分布を補正する構成を示した。道幅が非常に細いといった状況により、どの車両10も略同じ位置を走行する場合、轍以外の領域ではほとんど弾性波11を発生するような衝撃が付与されない場合も起こり得る。この場合、衝撃の付与頻度が閾値未満の領域に対して補正を行ってもより顕著な効果は得られないこともある。そこで、第3の実施形態では、弾性波源密度分布の補正を行わず、評価対象領域のうち衝撃が付与された頻度が閾値以上と想定される領域の劣化状態を評価し、衝撃が付与された頻度が閾値未満と想定される領域の劣化状態を評価しない構成について説明する。
第1の実施形態及び第2の実施形態では、補正値f(x、y)を用いて弾性波源密度分布を補正する構成を示した。道幅が非常に細いといった状況により、どの車両10も略同じ位置を走行する場合、轍以外の領域ではほとんど弾性波11を発生するような衝撃が付与されない場合も起こり得る。この場合、衝撃の付与頻度が閾値未満の領域に対して補正を行ってもより顕著な効果は得られないこともある。そこで、第3の実施形態では、弾性波源密度分布の補正を行わず、評価対象領域のうち衝撃が付与された頻度が閾値以上と想定される領域の劣化状態を評価し、衝撃が付与された頻度が閾値未満と想定される領域の劣化状態を評価しない構成について説明する。
図10は、第3の実施形態における構造物評価システム100bの構成を示す図である。第3の実施形態における構造物評価システム100bでは、構造物評価装置40に代えて構造物評価装置40bが備えられる点以外は第1の実施形態と同様である。以下、相違点に係る構造物評価装置40bの構成について説明する。
構造物評価装置40bは、通信部41、制御部42b、記憶部43b及び表示部44を備える。制御部42bは、構造物評価装置40b全体を制御する。制御部42bは、CPU等のプロセッサやメモリを用いて構成される。制御部42bは、プログラムを実行することによって、取得部421b、イベント抽出部422、位置標定部423、分布生成部424及び評価部426bとして機能する。
取得部421b、イベント抽出部422、位置標定部423、分布生成部424及び評価部426bの機能部のうち一部または全部は、ASICやPLD、FPGAなどのハードウェアによって実現されてもよいし、ソフトウェアとハードウェアとの協働によって実現されてもよい。プログラムは、コンピュータ読み取り可能な記録媒体に記録されてもよい。コンピュータ読み取り可能な記録媒体とは、例えばフレキシブルディスク、光磁気ディスク、ROM、CD-ROM等の可搬媒体、コンピュータシステムに内蔵されるハードディスク等の記憶装置などの非一時的な記憶媒体である。プログラムは、電気通信回線を介して送信されてもよい。
取得部421b、イベント抽出部422、位置標定部423、分布生成部424及び評価部426bの機能の一部は、予め構造物評価装置40bに搭載されている必要はなく、追加のアプリケーションプログラムが構造物評価装置40bにインストールされることで実現されてもよい。
制御部42bは、取得部421及び評価部426に代えて取得部421b及び評価部426bを備える点、補正部425を備えない点で制御部42と構成が異なる。以下、相違点について説明する。
取得部421bは、各種情報を取得する。例えば、取得部421bは、通信部41によって受信された送信データを取得する。取得部421bは、取得した送信データを記憶部43bに保存する。第3の実施形態において取得部421bは、評価対象となる構造物50に関する情報を取得する。評価対象となる構造物50に関する情報は、少なくとも構造物50の道幅の情報を含む。
取得部421bは、各種情報を取得する。例えば、取得部421bは、通信部41によって受信された送信データを取得する。取得部421bは、取得した送信データを記憶部43bに保存する。第3の実施形態において取得部421bは、評価対象となる構造物50に関する情報を取得する。評価対象となる構造物50に関する情報は、少なくとも構造物50の道幅の情報を含む。
評価部426bは、衝撃の付与頻度に基づいて構造物50の劣化状態を評価する。具体的には、評価部426bは、衝撃の付与頻度が閾値以上と想定される領域の劣化状態を評価し、衝撃が付与された頻度が閾値未満と想定される領域の劣化状態を評価しない。例えば、評価部426bは、衝撃の付与頻度が閾値以上と想定される領域において弾性波源の密度が閾値以上の領域を健全な領域と評価し、衝撃の付与頻度が閾値以上と想定される領域において弾性波源の密度が閾値未満の領域を損傷領域と評価する。
記憶部43bは、取得部421bによって取得された送信データ及び評価対象となる構造物50に関する情報を記憶する。記憶部43bは、磁気ハードディスク装置や半導体記憶装置などの記憶装置を用いて構成される。
第3の実施形態における構造物評価システム100bによる劣化状態の評価処理の流れについて説明する。第3の実施形態における構造物評価システム100bでは、評価部426bが、取得部421bによって取得された評価対象となる構造物50に関する情報に含まれる道幅の情報に基づいて、評価対象となる構造物50の道幅が非常に細いといった条件を満たすか否かを判定する。道幅が非常に細いといった条件は、予め設定されているものとする。例えば、道幅が非常に細いといった条件は、道幅が、特定の車両(例えば、普通車)のトレッド幅と同じ又は所定の幅分(例えば、+10mm等)だけ広いといった条件である。評価対象となる構造物50の道幅が非常に細いといった条件を満たす場合に以下の処理が実行される。一方で、評価対象となる構造物50の道幅が非常に細いといった条件を満たさない場合に以下の処理は実行されない。
評価対象となる構造物50の道幅が非常に細いといった条件を満たす場合、構造物評価システム100では、図5に示すステップS101からステップS109までの処理が実行される。その後、評価部426bは、評価対象領域のうち衝撃が付与された頻度が閾値以上と想定される領域の劣化状態を評価する。
以上のように構成された構造物評価システム100cでは、衝撃が付与された頻度が閾値未満と想定される領域の劣化状態を評価しない。これにより、誤診断を軽減することができる。そのため、路面に与えられる衝撃が一様ではない場合であっても、構造物50の評価精度を向上させることが可能になる。
以下、各実施形態に共通の変形例について説明する。
信号処理部30は、構造物評価装置40,40a,40bに備えられてもよい。
上記の各実施形態では、複数のセンサ20-1~20-nが、1台の信号処理部30に接続されている構成を示した。構造物評価システム100,100a,100bは、複数台の信号処理部30を備え、各センサ20それぞれが異なる信号処理部30に接続されてもよい。
信号処理部30は、構造物評価装置40,40a,40bに備えられてもよい。
上記の各実施形態では、複数のセンサ20-1~20-nが、1台の信号処理部30に接続されている構成を示した。構造物評価システム100,100a,100bは、複数台の信号処理部30を備え、各センサ20それぞれが異なる信号処理部30に接続されてもよい。
構造物評価装置40,40a,40bが備える各機能部は、一部又は全てが他の装置に備えられてもよい。例えば、構造物評価装置40,40a,40bが備える表示部44が他の装置に備えられてもよい。このように構成される場合、構造物評価装置40,40a,40bは、評価結果を、表示部44を備える他の装置に送信する。表示部44を備える他の装置は、受信した評価結果を表示する。
上記の各実施形態では、路面に対して空間的に一様ではない衝撃を与える対象(以下「非一様対象」という。)が車両10の走行部である場合を例に説明した。上記の各実施形態において、非一様対象は、車両10の走行部に限定される必要はない。例えば、非一様対象は、散水車両、人力による手押し車両及び固定スプリンクラー等が挙げられる。以下、詳細に説明する。
(非一様対象が散水車両である場合)
散水車両は、散水しながら路面を走行可能な車両である。例えば、散水車両は、車両の後方に散水するための散水装置が取り付けられた車両である。散水装置は、図11の円形領域61の中心をピークとした正規分布となるような分布で水滴(物体)を散布する。この場合、路面に付与される衝撃は、水滴である。図11は、非一様対象が散水車両である場合の説明図である。
散水車両は、散水しながら路面を走行可能な車両である。例えば、散水車両は、車両の後方に散水するための散水装置が取り付けられた車両である。散水装置は、図11の円形領域61の中心をピークとした正規分布となるような分布で水滴(物体)を散布する。この場合、路面に付与される衝撃は、水滴である。図11は、非一様対象が散水車両である場合の説明図である。
このような散水車両が定速で路面62を通り過ぎた場合、水滴が散布された路面の位置をピークとする分布63(例えば、弾性波源密度分布)が得られる。補正部425,425aは、この分布63の偏りを抑制可能な補正値f(x、y)を算出する。そして、補正部425,425aは、算出した補正値f(x、y)を、弾性波源密度分布に乗算することによって、弾性波源密度分布を補正する。
散水車両に限定されず、人が、水や氷等の複数の物体を所定の方法で散布することによって、路面に対して空間的に一様ではない衝撃を与えてもよい。所定の方法としては、人が散水装置を持ち歩いて散布する方法や、装置を介さずに水や氷等を路面に対して直接散布する方法(例えば、手に水や氷を持って、路面にばら撒く方法)等が挙げられる。
この構成により、車両10の走行部以外で衝撃を付与する場面においても適用することができる。そのため、利便性を向上させることが可能になる。
(非一様対象が手押し車両である場合)
手押し車両は、人力で路面を走行することにより、一定の間隔で路面に対して衝撃を付与することが可能な車両である。例えば、手押し車両は、打撃機構を備える車両である。打撃機構は、例えば歯形の回転機構である。人力により手押し車両が路面を走行すると、歯形の回転機構が一定の間隔で路面に接触することにより、歯形の回転機構が路面に衝撃を与える。
手押し車両は、人力で路面を走行することにより、一定の間隔で路面に対して衝撃を付与することが可能な車両である。例えば、手押し車両は、打撃機構を備える車両である。打撃機構は、例えば歯形の回転機構である。人力により手押し車両が路面を走行すると、歯形の回転機構が一定の間隔で路面に接触することにより、歯形の回転機構が路面に衝撃を与える。
このような手押し車両が路面を通り過ぎた場合、歯形の回転機構が接触した路面の位置をピークとする分布(例えば、弾性波源密度分布)が得られる。補正部425,425aは、この分布の偏りを打ち消すような補正値f(x、y)を算出する。そして、補正部425,425aは、算出した補正値f(x、y)を、弾性波源密度分布に乗算することによって、弾性波源密度分布を補正する。なお、打撃機構は、歯形の回転機構に限らず、路面に対して衝撃を付与することができればどのような機構であってもよい。
打撃機構で路面に衝撃を付与する方法は、手押し車両に限定されず、打撃機構を車両でけん引する方法であってもよい。
この構成により、車両10の走行部以外で衝撃を付与する場面においても適用することができる。そのため、利便性を向上させることが可能になる。
(非一様対象が固定スプリンクラーである場合)
固定スプリンクラーは、一定の時間間隔で、路面の所定の範囲に水滴を散布することが可能な散布装置である。この場合、路面に付与される衝撃は、水滴である。固定スプリンクラーは、車両10が走行可能な道路外に設置された複数の街頭それぞれに設置される。このような固定スプリンクラーにより水滴が路面に散布された場合、路面の所定の範囲に衝撃が付与されることになる。分布生成部424は、付与された衝撃に基づいて弾性波源密度分布を生成する。固定スプリンクラー毎に異なる水滴が路面に付与されるため、分布生成部424は各固定スプリンクラーから付与された水滴に応じた弾性波源密度分布を生成する。
固定スプリンクラーは、一定の時間間隔で、路面の所定の範囲に水滴を散布することが可能な散布装置である。この場合、路面に付与される衝撃は、水滴である。固定スプリンクラーは、車両10が走行可能な道路外に設置された複数の街頭それぞれに設置される。このような固定スプリンクラーにより水滴が路面に散布された場合、路面の所定の範囲に衝撃が付与されることになる。分布生成部424は、付与された衝撃に基づいて弾性波源密度分布を生成する。固定スプリンクラー毎に異なる水滴が路面に付与されるため、分布生成部424は各固定スプリンクラーから付与された水滴に応じた弾性波源密度分布を生成する。
補正部425,425aは、各固定スプリンクラーから付与された水滴に応じた偏りを打ち消すような補正値f(x、y)を固定スプリンクラー毎に算出する。そして、補正部425,425aは、算出した補正値f(x、y)それぞれを、各固定スプリンクラーに対応する弾性波源密度分布に乗算することによって、各弾性波源密度分布を補正する。
この構成により、車両10の走行部以外で衝撃を付与する場面においても適用することができる。そのため、利便性を向上させることが可能になる。
上記の各実施形態では、位置標定に基づく情報として弾性波源密度分布を例に説明した。位置標定に基づく情報は、標定結果を用いて得られる情報であればどのような情報であってもよい。例えば、位置標定に基づく情報は、平均振幅であってもよい。平均振幅は、衝撃毎にセンサ20にて検出された第1ヒットの弾性波の振幅を、所定の領域毎に平均して算出されたものである。所定の領域は、予め定められた大きさを有する領域である。第1ヒットの弾性波の振幅は、第1ヒットの弾性波が生じた位置を含む所定の領域における平均の算出に用いられる。そのため、衝撃が付与されないために弾性波が発生しない所定の領域では、平均振幅が0に近い値となる。
そして、補正部425は、衝撃に応じて定まる補正値f(x、y)を用いて所定の領域毎に平均振幅の値を補正する。例えば、補正部425は、車両10の走行部の通過位置に対応する所定の領域における平均振幅の値を減少させるような補正値f(x、y)で補正を行う。評価部426は、補正後の平均振幅の値に基づいて所定の領域毎に構造物50の劣化状態を評価する。具体的には、評価部426は、車両10の走行部の通過位置に対応する所定の領域であって、補正後の平均振幅の値が閾値未満の領域を損傷領域と評価する。車両10の走行部の通過位置に対応する所定の領域であるか否かは、トレッド幅の情報に基づいて判定されてもよいし、外部から入力されてもよい。
評価部426は、従来評価手法の他に、以下のように評価してもよい。評価部426は、補正後の弾性波源密度分布AD上において、所定の範囲の複数の領域を設定する。これにより、評価部426は、補正後の弾性波源密度分布AD上で各領域を区分けする。評価部426は、区分けした領域(以下「分割領域」という。)毎に閾値15との比較を行う。例えば、評価部426は、分割領域内の密度と、閾値15とを比較する。評価部426は、比較の結果、閾値15よりも密度が低い領域を損傷領域として評価する。
以上説明した少なくともひとつの実施形態によれば、複数のセンサと、位置標定部と、補正部と、評価部とを持つ。複数のセンサは、構造物から発生した弾性波を検出する。位置標定部は、複数のセンサそれぞれによって検出された複数の弾性波に基づいて、複数の弾性波の発生源の位置を標定する。補正部は、衝撃に応じて定まる補正値を用いて、位置標定部による位置標定に基づく情報を補正する。評価部は、補正された情報に基づいて構造物の劣化状態を評価する。これにより、構造物の表面に与えられる衝撃が一様ではない場合であっても、構造物の評価精度を向上させることができる。
本発明のいくつかの実施形態を説明したが、これらの実施形態は、例として提示したものであり、発明の範囲を限定することは意図していない。これら実施形態は、その他の様々な形態で実施されることが可能であり、発明の要旨を逸脱しない範囲で、種々の省略、置き換え、変更を行うことができる。これら実施形態やその変形は、発明の範囲や要旨に含まれると同様に、特許請求の範囲に記載された発明とその均等の範囲に含まれるものである。
Claims (17)
- 構造物から発生した弾性波を検出する複数のセンサと、
前記複数のセンサそれぞれによって検出された複数の弾性波に基づいて、前記複数の弾性波の発生源の位置を標定する位置標定部と、
衝撃に応じて定まる補正値を用いて、前記位置標定部による位置標定に基づく情報を補正する補正部と、
補正された前記情報に基づいて前記構造物の劣化状態を評価する評価部と、
を備える構造物評価システム。 - 前記補正部は、少なくとも前記衝撃が付与される位置における情報を補正するための極値部分を1つ以上有する補正値で前記情報を補正する、
請求項1に記載の構造物評価システム。 - 前記構造物は、車両が走行可能な道路を含み、
前記補正部は、前記道路の幅方向の距離毎に定められた補正値を用いて、前記車両の通行方向における前記情報を補正する、
請求項1又は2に記載の構造物評価システム。 - 前記構造物は、車両が走行可能な道路を含み、
前記補正部は、前記車両の走行部と路面との接触により生じる衝撃の発生位置に基づいて前記補正値を算出する、
請求項1から3のいずれか一項に記載の構造物評価システム。 - 前記構造物は、車両が走行可能な道路を含み、
前記補正部は、少なくとも前記道路を通過した車両のトレッド幅の情報を用いて前記補正値を算出する、
請求項1から3のいずれか一項に記載の構造物評価システム。 - 前記補正部は、前記道路を通過した車両のトレッド幅の情報と、前記構造物の車両の通行量の情報とを用いて前記補正値を算出する、
請求項5に記載の構造物評価システム。 - 前記補正部は、前記位置標定部による位置標定結果に基づいて得られる前記補正値で前記情報を補正する、
請求項1から3のいずれか一項に記載の構造物評価システム。 - 前記構造物は、車両が走行可能な道路を含み、
前記補正部は、前記位置標定部による位置標定結果に基づいて、前記道路を通過した車両の通過位置を推定し、推定した前記通過位置に基づいて前記補正値を取得する、
請求項7に記載の構造物評価システム。 - 複数の物体を空間的に一様にならないように散布することにより路面に対して衝撃を付与し、
前記補正部は、前記散布により付与される前記衝撃に応じて定まる補正値で前記情報を補正する、
請求項1から3のいずれか一項に記載の構造物評価システム。 - 前記路面に対して所定の間隔で衝撃を付与することが可能な打撃機構をさらに備え、
前記補正部は、前記打撃機構により付与される前記衝撃に応じて定まる補正値で前記情報を補正する、
請求項1から3のいずれか一項に記載の構造物評価システム。 - 車両が走行可能な道路外に設置され、路面の所定に範囲に水滴を散布することが可能な散布装置をさらに備え、
前記補正部は、前記散布装置により付与される前記衝撃に応じて定まる補正値で前記情報を補正する、
請求項1又は2に記載の構造物評価システム。 - 前記評価部は、評価対象領域のうち、前記衝撃が付与された頻度が閾値以上と想定される領域の劣化状態を評価する、
請求項1から11のいずれか一項に記載の構造物評価システム。 - 構造物から発生した弾性波を検出する複数のセンサと、
前記複数のセンサそれぞれによって検出された複数の弾性波に基づいて、前記複数の弾性波の発生源の位置を標定する位置標定部と、
前記位置標定部による標定結果に基づいて、評価対象領域のうち衝撃が付与された頻度が閾値以上と想定される領域の劣化状態を評価する評価部と、
を備える構造物評価システム。 - 構造物から発生した弾性波を検出する複数のセンサそれぞれによって検出された複数の弾性波に基づいて、前記複数の弾性波の発生源の位置を標定する位置標定部と、
衝撃に応じて定まる補正値を用いて、前記位置標定部による位置標定に基づく情報を補正する補正部と、
補正された前記情報に基づいて前記構造物の劣化状態を評価する評価部と、
を備える構造物評価装置。 - 構造物から発生した弾性波を検出する複数のセンサそれぞれによって検出された複数の弾性波に基づいて、前記複数の弾性波の発生源の位置を標定する位置標定部と、
前記位置標定部による標定結果に基づいて、評価対象領域のうち衝撃が付与された頻度が閾値以上と想定される領域の劣化状態を評価する評価部と、
を備える構造物評価装置。 - 構造物から発生した弾性波を検出する複数のセンサそれぞれによって検出された複数の弾性波に基づいて、前記複数の弾性波の発生源の位置を標定し、
衝撃に応じて定まる補正値を用いて、位置標定に基づく情報を補正し、
補正された前記情報に基づいて前記構造物の劣化状態を評価する構造物評価方法。 - 構造物から発生した弾性波を検出する複数のセンサそれぞれによって検出された複数の弾性波に基づいて、前記複数の弾性波の発生源の位置を標定し、
標定結果に基づいて、評価対象領域のうち衝撃が付与された頻度が閾値以上と想定される領域の劣化状態を評価する構造物評価方法。
Priority Applications (4)
| Application Number | Priority Date | Filing Date | Title |
|---|---|---|---|
| JP2022504129A JP7323698B2 (ja) | 2020-07-16 | 2020-07-16 | 構造物評価システム、構造物評価装置及び構造物評価方法 |
| EP20945193.9A EP4184161A4 (en) | 2020-07-16 | 2020-07-16 | STRUCTURE EVALUATION SYSTEM, STRUCTURE EVALUATION DEVICE, AND STRUCTURE EVALUATION METHOD |
| PCT/JP2020/027652 WO2022014004A1 (ja) | 2020-07-16 | 2020-07-16 | 構造物評価システム、構造物評価装置及び構造物評価方法 |
| US17/653,512 US12169189B2 (en) | 2020-07-16 | 2022-03-04 | Structure evaluation system, structure evaluation apparatus, and structure evaluation method |
Applications Claiming Priority (1)
| Application Number | Priority Date | Filing Date | Title |
|---|---|---|---|
| PCT/JP2020/027652 WO2022014004A1 (ja) | 2020-07-16 | 2020-07-16 | 構造物評価システム、構造物評価装置及び構造物評価方法 |
Related Child Applications (1)
| Application Number | Title | Priority Date | Filing Date |
|---|---|---|---|
| US17/653,512 Continuation US12169189B2 (en) | 2020-07-16 | 2022-03-04 | Structure evaluation system, structure evaluation apparatus, and structure evaluation method |
Publications (1)
| Publication Number | Publication Date |
|---|---|
| WO2022014004A1 true WO2022014004A1 (ja) | 2022-01-20 |
Family
ID=79554562
Family Applications (1)
| Application Number | Title | Priority Date | Filing Date |
|---|---|---|---|
| PCT/JP2020/027652 Ceased WO2022014004A1 (ja) | 2020-07-16 | 2020-07-16 | 構造物評価システム、構造物評価装置及び構造物評価方法 |
Country Status (4)
| Country | Link |
|---|---|
| US (1) | US12169189B2 (ja) |
| EP (1) | EP4184161A4 (ja) |
| JP (1) | JP7323698B2 (ja) |
| WO (1) | WO2022014004A1 (ja) |
Cited By (5)
| Publication number | Priority date | Publication date | Assignee | Title |
|---|---|---|---|---|
| US20220034749A1 (en) * | 2018-02-27 | 2022-02-03 | Kabushiki Kaisha Toshiba | Structure evaluation system and structure evaluation method |
| JP2024043068A (ja) * | 2022-09-16 | 2024-03-29 | 株式会社東芝 | 構造物評価システム、構造物評価装置、構造物評価方法及びコンピュータプログラム |
| US12098976B2 (en) | 2021-12-20 | 2024-09-24 | Kabushiki Kaisha Toshiba | Structure evaluation system and structure evaluation method |
| US12104986B2 (en) | 2021-09-16 | 2024-10-01 | Kabushiki Kaisha Toshiba | Structure evaluation system, structure evaluation apparatus, and structure evaluation method |
| JP2024134786A (ja) * | 2023-03-22 | 2024-10-04 | 株式会社東芝 | 構造物評価システム及び構造物評価方法 |
Families Citing this family (4)
| Publication number | Priority date | Publication date | Assignee | Title |
|---|---|---|---|---|
| CN111479982B (zh) * | 2017-11-15 | 2023-01-17 | 吉奥奎斯特系统公司 | 具有滤波器的现场操作系统 |
| JP7362580B2 (ja) * | 2020-09-16 | 2023-10-17 | 株式会社東芝 | 構造物評価方法、及び構造物評価システム |
| JP2025007782A (ja) * | 2023-07-03 | 2025-01-17 | 株式会社東芝 | 構造物評価システム、構造物評価装置及び構造物評価方法 |
| CN117191944B (zh) * | 2023-09-12 | 2025-08-29 | 深地科学与工程云龙湖实验室 | 一种带有贯通钢筋的混凝土结构内部缺陷检测方法 |
Citations (5)
| Publication number | Priority date | Publication date | Assignee | Title |
|---|---|---|---|---|
| JP2010122173A (ja) * | 2008-11-21 | 2010-06-03 | Ohbayashi Corp | 地盤のゆるみ検知方法、地盤のゆるみ検知システム |
| US8059489B1 (en) * | 2009-04-17 | 2011-11-15 | The Boeing Company | Acoustic airport surveillance system |
| WO2017217034A1 (ja) | 2016-06-15 | 2017-12-21 | 株式会社東芝 | 構造物評価システム、構造物評価装置及び構造物評価方法 |
| WO2019167137A1 (ja) * | 2018-02-27 | 2019-09-06 | 株式会社東芝 | 構造物評価システム及び構造物評価方法 |
| JP2019158899A (ja) * | 2018-08-07 | 2019-09-19 | 株式会社東芝 | 検出システム、情報処理装置、および検出方法 |
Family Cites Families (4)
| Publication number | Priority date | Publication date | Assignee | Title |
|---|---|---|---|---|
| CN102269736B (zh) | 2011-07-08 | 2012-12-19 | 天津大学 | 罐底腐蚀声发射检测中声源分布区域的自动识别方法 |
| WO2017199542A1 (ja) * | 2016-05-17 | 2017-11-23 | 株式会社東芝 | 構造物評価システム、構造物評価装置及び構造物評価方法 |
| US10613060B2 (en) | 2016-06-15 | 2020-04-07 | Kabushiki Kaisha Toshiba | Structure evaluation system, structure evaluation apparatus, and structure evaluation method |
| JP6857777B2 (ja) | 2018-09-13 | 2021-04-14 | 株式会社東芝 | 構造物評価システム、構造物評価装置及び構造物評価方法 |
-
2020
- 2020-07-16 JP JP2022504129A patent/JP7323698B2/ja active Active
- 2020-07-16 WO PCT/JP2020/027652 patent/WO2022014004A1/ja not_active Ceased
- 2020-07-16 EP EP20945193.9A patent/EP4184161A4/en active Pending
-
2022
- 2022-03-04 US US17/653,512 patent/US12169189B2/en active Active
Patent Citations (5)
| Publication number | Priority date | Publication date | Assignee | Title |
|---|---|---|---|---|
| JP2010122173A (ja) * | 2008-11-21 | 2010-06-03 | Ohbayashi Corp | 地盤のゆるみ検知方法、地盤のゆるみ検知システム |
| US8059489B1 (en) * | 2009-04-17 | 2011-11-15 | The Boeing Company | Acoustic airport surveillance system |
| WO2017217034A1 (ja) | 2016-06-15 | 2017-12-21 | 株式会社東芝 | 構造物評価システム、構造物評価装置及び構造物評価方法 |
| WO2019167137A1 (ja) * | 2018-02-27 | 2019-09-06 | 株式会社東芝 | 構造物評価システム及び構造物評価方法 |
| JP2019158899A (ja) * | 2018-08-07 | 2019-09-19 | 株式会社東芝 | 検出システム、情報処理装置、および検出方法 |
Non-Patent Citations (1)
| Title |
|---|
| See also references of EP4184161A4 |
Cited By (7)
| Publication number | Priority date | Publication date | Assignee | Title |
|---|---|---|---|---|
| US20220034749A1 (en) * | 2018-02-27 | 2022-02-03 | Kabushiki Kaisha Toshiba | Structure evaluation system and structure evaluation method |
| US11639880B2 (en) * | 2018-02-27 | 2023-05-02 | Kabushiki Kaisha Toshiba | Structure evaluation system and structure evaluation method |
| US12104986B2 (en) | 2021-09-16 | 2024-10-01 | Kabushiki Kaisha Toshiba | Structure evaluation system, structure evaluation apparatus, and structure evaluation method |
| US12098976B2 (en) | 2021-12-20 | 2024-09-24 | Kabushiki Kaisha Toshiba | Structure evaluation system and structure evaluation method |
| JP2024043068A (ja) * | 2022-09-16 | 2024-03-29 | 株式会社東芝 | 構造物評価システム、構造物評価装置、構造物評価方法及びコンピュータプログラム |
| JP7739245B2 (ja) | 2022-09-16 | 2025-09-16 | 株式会社東芝 | 構造物評価システム、構造物評価装置、構造物評価方法及びコンピュータプログラム |
| JP2024134786A (ja) * | 2023-03-22 | 2024-10-04 | 株式会社東芝 | 構造物評価システム及び構造物評価方法 |
Also Published As
| Publication number | Publication date |
|---|---|
| US12169189B2 (en) | 2024-12-17 |
| US20220187253A1 (en) | 2022-06-16 |
| JPWO2022014004A1 (ja) | 2022-01-20 |
| EP4184161A1 (en) | 2023-05-24 |
| EP4184161A4 (en) | 2024-07-03 |
| JP7323698B2 (ja) | 2023-08-08 |
Similar Documents
| Publication | Publication Date | Title |
|---|---|---|
| WO2022014004A1 (ja) | 構造物評価システム、構造物評価装置及び構造物評価方法 | |
| JP6756927B2 (ja) | 構造物評価システム及び構造物評価方法 | |
| JP2021096266A (ja) | 構造物評価システム、構造物評価装置及び構造物評価方法 | |
| US10352912B2 (en) | Structure evaluation system, structure evaluation apparatus, and structure evaluation method | |
| JP6794435B2 (ja) | 構造物評価システム、構造物評価方法及び衝撃付与装置 | |
| JP6833770B2 (ja) | 構造物評価システム、構造物評価装置及び構造物評価方法 | |
| CN114487126B (zh) | 车辆信息推测系统、车辆信息推测装置、车辆信息推测方法以及计算机程序 | |
| JP7155277B2 (ja) | 構造物評価システム、構造物評価装置及び構造物評価方法 | |
| JP7508427B2 (ja) | 構造物評価システム、構造物評価装置及び構造物評価方法 | |
| US10458954B2 (en) | Structure evaluation system, structure evaluation apparatus, and structure evaluation method | |
| KR100922128B1 (ko) | 기상레이더의 반사도 보정 방법 | |
| US20250012662A1 (en) | Structure evaluation system, structure evaluation apparatus, and structure evaluation method | |
| JP2024134786A (ja) | 構造物評価システム及び構造物評価方法 | |
| JP7823000B2 (ja) | 構造物評価システム、構造物評価方法及び構造物評価装置 | |
| JP7830114B2 (ja) | 構造物評価システム及び構造物評価方法 | |
| JP7739245B2 (ja) | 構造物評価システム、構造物評価装置、構造物評価方法及びコンピュータプログラム | |
| JP7757364B2 (ja) | 波形信号処理システム、構造物評価システム及び波形信号処理方法 |
Legal Events
| Date | Code | Title | Description |
|---|---|---|---|
| ENP | Entry into the national phase |
Ref document number: 2022504129 Country of ref document: JP Kind code of ref document: A |
|
| 121 | Ep: the epo has been informed by wipo that ep was designated in this application |
Ref document number: 20945193 Country of ref document: EP Kind code of ref document: A1 |
|
| NENP | Non-entry into the national phase |
Ref country code: DE |
|
| ENP | Entry into the national phase |
Ref document number: 2020945193 Country of ref document: EP Effective date: 20230216 |