WO2022059467A1 - 細胞分析方法及び細胞分析装置 - Google Patents
細胞分析方法及び細胞分析装置 Download PDFInfo
- Publication number
- WO2022059467A1 WO2022059467A1 PCT/JP2021/031651 JP2021031651W WO2022059467A1 WO 2022059467 A1 WO2022059467 A1 WO 2022059467A1 JP 2021031651 W JP2021031651 W JP 2021031651W WO 2022059467 A1 WO2022059467 A1 WO 2022059467A1
- Authority
- WO
- WIPO (PCT)
- Prior art keywords
- parallel processing
- cell
- data
- processor
- unit
- Prior art date
- Legal status (The legal status is an assumption and is not a legal conclusion. Google has not performed a legal analysis and makes no representation as to the accuracy of the status listed.)
- Ceased
Links
Images

















Classifications
-
- G—PHYSICS
- G01—MEASURING; TESTING
- G01N—INVESTIGATING OR ANALYSING MATERIALS BY DETERMINING THEIR CHEMICAL OR PHYSICAL PROPERTIES
- G01N15/00—Investigating characteristics of particles; Investigating permeability, pore-volume or surface-area of porous materials
- G01N15/10—Investigating individual particles
- G01N15/14—Optical investigation techniques, e.g. flow cytometry
- G01N15/1434—Optical arrangements
-
- G—PHYSICS
- G01—MEASURING; TESTING
- G01N—INVESTIGATING OR ANALYSING MATERIALS BY DETERMINING THEIR CHEMICAL OR PHYSICAL PROPERTIES
- G01N15/00—Investigating characteristics of particles; Investigating permeability, pore-volume or surface-area of porous materials
- G01N15/10—Investigating individual particles
- G01N15/14—Optical investigation techniques, e.g. flow cytometry
- G01N15/1456—Optical investigation techniques, e.g. flow cytometry without spatial resolution of the texture or inner structure of the particle, e.g. processing of pulse signals
- G01N15/1459—Optical investigation techniques, e.g. flow cytometry without spatial resolution of the texture or inner structure of the particle, e.g. processing of pulse signals the analysis being performed on a sample stream
-
- G—PHYSICS
- G01—MEASURING; TESTING
- G01N—INVESTIGATING OR ANALYSING MATERIALS BY DETERMINING THEIR CHEMICAL OR PHYSICAL PROPERTIES
- G01N15/00—Investigating characteristics of particles; Investigating permeability, pore-volume or surface-area of porous materials
- G01N15/10—Investigating individual particles
- G01N15/14—Optical investigation techniques, e.g. flow cytometry
- G01N15/1429—Signal processing
-
- G—PHYSICS
- G01—MEASURING; TESTING
- G01N—INVESTIGATING OR ANALYSING MATERIALS BY DETERMINING THEIR CHEMICAL OR PHYSICAL PROPERTIES
- G01N15/00—Investigating characteristics of particles; Investigating permeability, pore-volume or surface-area of porous materials
- G01N15/01—Investigating characteristics of particles; Investigating permeability, pore-volume or surface-area of porous materials specially adapted for biological cells, e.g. blood cells
-
- G—PHYSICS
- G01—MEASURING; TESTING
- G01N—INVESTIGATING OR ANALYSING MATERIALS BY DETERMINING THEIR CHEMICAL OR PHYSICAL PROPERTIES
- G01N15/00—Investigating characteristics of particles; Investigating permeability, pore-volume or surface-area of porous materials
- G01N15/10—Investigating individual particles
- G01N2015/1006—Investigating individual particles for cytology
-
- G—PHYSICS
- G01—MEASURING; TESTING
- G01N—INVESTIGATING OR ANALYSING MATERIALS BY DETERMINING THEIR CHEMICAL OR PHYSICAL PROPERTIES
- G01N15/00—Investigating characteristics of particles; Investigating permeability, pore-volume or surface-area of porous materials
- G01N15/10—Investigating individual particles
- G01N15/14—Optical investigation techniques, e.g. flow cytometry
- G01N2015/1488—Methods for deciding
-
- G—PHYSICS
- G16—INFORMATION AND COMMUNICATION TECHNOLOGY [ICT] SPECIALLY ADAPTED FOR SPECIFIC APPLICATION FIELDS
- G16H—HEALTHCARE INFORMATICS, i.e. INFORMATION AND COMMUNICATION TECHNOLOGY [ICT] SPECIALLY ADAPTED FOR THE HANDLING OR PROCESSING OF MEDICAL OR HEALTHCARE DATA
- G16H10/00—ICT specially adapted for the handling or processing of patient-related medical or healthcare data
- G16H10/40—ICT specially adapted for the handling or processing of patient-related medical or healthcare data for data related to laboratory analysis, e.g. patient specimen analysis
Definitions
- the present invention relates to a cell analysis method and a cell analysis device.
- Patent Document 1 describes a method of analyzing data obtained by measuring blood cell cells with a flow cytometer in a data processing system equipped with a processor and classifying the cells according to the type. Patent Document 1 describes that when cells cannot be classified by optical information measured by a flow cytometer, information on cell volume and conductivity is further used.
- Patent Document 1 does not disclose a system capable of processing a significantly increased amount of information within the required processing capacity.
- the present invention in a configuration for analyzing data obtained from a plurality of cells contained in a sample, it is possible to satisfy the required processing capacity of cell data with a significantly increased amount of information. It is an object of the present invention to provide a cell analysis method and a cell analysis apparatus.
- the cell analysis method is a cell including a host processor (3001, 4831, 6001, 8111) and a parallel processing processor (3002, 4833, 6002, 8112).
- the analyzer (4000, 4000', 4000'')
- data about each of the plurality of cells in the sample is acquired under the control of the host processor (3001, 4831, 6001, 8111), and the parallel processing processor (3002). , 4833, 6002, 8112), including performing a parallel process on the data and generating information about the cell type for each of the plurality of cells based on the result of the parallel process.
- cells are measured by a measurement unit (400, 400a, 500, 500a, 700), and the measurement unit (400, 400a, 500,
- a parallel processing processor (3002, 4833, 6002, 8112) connected to the 500a, 700) without an internet or intranet performs parallel processing of data on cells based on the measurement, and based on the result of the parallel processing, Includes generating information about the cell type of the cell.
- the cell analysis method is a measurement unit (400, 400a, 500, 500a,) mounted on a cell analyzer (4000, 4000', 4000'').
- the sample is aspirated by 700), data on the cells in the aspirated sample is generated, and parallel processing on the data is performed by a parallel processing processor (3002) mounted on a cell analyzer (4000, 4000', 4000'').
- a parallel processing processor 3002 mounted on a cell analyzer (4000, 4000', 4000'').
- 4833, 6002, 8112 and generate information about the cell type of the cell based on the result of the parallel processing performed by the parallel processing processor (3002, 4833, 6002, 8112).
- the cell analyzer includes a measurement unit (400, 400a, 500, 500a, 700) for measuring a plurality of cells contained in a sample, and a plurality of cells.
- a processor (3001, 4831, 6001, 8111) for performing information processing related to analysis, a parallel processing processor (3002, 4833, 6002, 8112), and a measurement unit (400, 400a, 500, 500a, 700) are provided. Data on each of the plurality of cells is acquired, the parallel processing processor (3002, 4833, 6002, 8112) executes the parallel processing on the data, and the processor (3001, 4831, 6001, 8111) is the result of the parallel processing. Includes processing information about each cell type of a plurality of cells generated on the basis of.
- FIG. 1A shows an example of conventional leukocyte classification.
- FIG. 1 (b) shows an example of leukocyte classification of this method.
- FIG. 2A shows an example of irradiating cells flowing through a flow cell with light.
- FIG. 2B shows an example of sampling a forward scattered light signal, a side scattered light signal, and a fluorescent signal.
- FIG. 2C shows an example of waveform data obtained by sampling.
- FIG. 3 shows an example of a training data generation method.
- FIG. 4 shows an example of a label value.
- FIG. 5 shows an example of an analysis method of analytical data.
- FIG. 6 shows an example of the appearance of the cell analyzer.
- FIG. 7 shows an example of a block diagram of the measurement unit.
- FIG. 8 shows an example of a sample suction unit and a sample preparation unit.
- FIG. 9 shows a configuration example of the optical system of the FCM detection unit.
- FIG. 10 shows a configuration example of the processing unit.
- FIG. 11 shows a configuration example of a parallel processing processor.
- FIG. 12 shows an example of mounting a parallel processing processor in a measurement unit.
- FIG. 13 shows another implementation example of the parallel processing processor in the measurement unit.
- FIG. 14 shows another implementation example of the parallel processing processor in the measurement unit.
- FIG. 15 shows another implementation example of the parallel processing processor in the measurement unit.
- FIG. 16 shows an outline of an operation in which a processor executes arithmetic processing of matrix data using a parallel processing processor.
- FIG. 17A shows a formula for calculating the product of matrices.
- FIG. 17B shows an example of arithmetic processing executed in parallel by a parallel processing processor.
- FIG. 17A shows a formula for calculating the product of matrices.
- FIG. 17B shows an example of arithmetic processing executed in parallel by a parallel
- FIG. 18 shows how the arithmetic processing is executed by the parallel processing processor.
- FIG. 19A shows an example of waveform data of forward scattered light as waveform data input to the deep learning algorithm.
- FIG. 19B shows an outline of the matrix operation between the waveform data and the filter.
- FIG. 20 shows an example of a sample analysis operation by a cell analyzer.
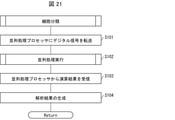
- FIG. 21 shows an example of a cell analysis process.
- FIG. 22 shows an example of parallel processing.
- FIG. 23 shows another example of the block diagram of the measurement unit.
- FIG. 24 shows an example of a block diagram of the processing unit.
- FIG. 25 shows an outline of an operation in which a processor executes arithmetic processing of matrix data using a parallel processing processor.
- FIG. 26 shows another example of the block diagram of the measurement unit.
- FIG. 27 shows another example of the block diagram of the processing unit.
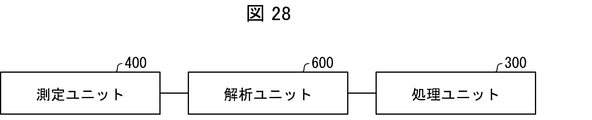
- FIG. 28 shows a configuration example of the measurement unit, the processing unit, and the analysis unit.
- FIG. 29 shows another example of the block diagram of the measurement unit.
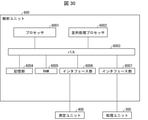
- FIG. 30 shows an example of a block diagram of the analysis unit.
- FIG. 31 shows an outline of an operation in which a processor executes arithmetic processing of matrix data using a parallel processing processor.
- FIG. 32 shows another example of the block diagram of the processing unit.
- FIG. 33 shows another example of the block diagram of the measurement unit.
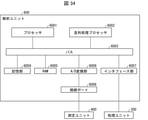
- FIG. 34 shows another example of the block diagram of the analysis unit.
- FIG. 35 shows an example of a block diagram of the measurement unit.
- FIG. 36 shows a schematic example of the optical system of the flow cytometer.
- FIG. 36 shows a schematic example of the optical system of the flow cytometer.
- FIG. 37 shows a schematic example of the sample preparation unit of the measurement unit.
- FIG. 38 shows a schematic example of a waveform data analysis system.
- FIG. 39 shows an example of a block diagram of the vendor side device.
- FIG. 40 shows an example of a block diagram of the measurement unit.
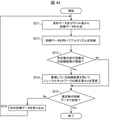
- FIG. 41 shows another example of the block diagram of the analysis unit.
- FIG. 42 shows an example of a functional block diagram of a deep learning device.
- FIG. 43 shows an example of a flowchart of the operation of the processing unit for generating training data.
- FIG. 44 shows a schematic diagram for explaining a neural network.
- FIG. 44A shows a schematic diagram showing an outline of the neural network.
- FIG. 44B shows a schematic diagram showing operations at each node.
- FIG. 44 (c) shows a schematic diagram showing operations between nodes.
- FIG. 44A shows a schematic diagram showing an outline of the neural network.
- FIG. 44B shows a schematic diagram showing operations at each node.
- FIG. 45 shows a mixed matrix of the determination result by the reference method and the determination result using the deep learning algorithm.
- FIG. 46 (a) shows the ROC curve of neutrophils.
- FIG. 46 (b) shows the ROC curve of lymphocytes.
- FIG. 46 (c) shows the ROC curve of a monocyte.
- FIG. 47 (a) shows the ROC curve of eosinophils.
- FIG. 47 (b) shows the ROC curve of basophils.
- FIG. 47 (c) shows the ROC curve of the ROC curve of the control blood (CONT).
- FIG. 48 shows a configuration example of a cell analyzer as an image analyzer.
- FIG. 49 shows a configuration example of the processing unit.
- FIG. 50 shows an example of a method of generating training data.
- FIG. 51 shows an example of a label value.
- FIG. 52 shows an example of an image analysis method.
- FIG. 53 shows an embodiment of the analysis result.
- a cell analyzer including a host processor and a parallel processing processor
- data regarding each of the cells is acquired based on control by the host processor
- parallel processing regarding the data is executed by the parallel processing processor.
- a cell analysis method comprising generating information about a cell type for each of the cells based on the results of the parallel treatment.
- processing related to cell data is performed by a parallel processing processor provided separately from the host processor. Can be executed in parallel. Therefore, for example, even when cells are classified by a deep learning algorithm using a huge amount of data, the data processing is completed only by the cell analyzer. For example, it is not necessary to send cell data to an analysis server that stores a deep learning algorithm via the Internet or an intranet. Therefore, according to this analysis method, it is not necessary to send a large amount of data from the cell analyzer to the analysis server and acquire the analysis result returned from the analysis server, while improving the cell classification accuracy. The processing capacity of the cell analyzer can be maintained.
- FIG. 1A is a diagram schematically showing the leukocyte classification of the conventional method
- FIG. 1B is a diagram schematically showing the leukocyte classification of the present method.
- FSC indicates an analog signal indicating the signal intensity of the forward scattered light
- SSC indicates an analog signal of the side scattered light
- SFL indicates the signal intensity of the side fluorescence. Shows an analog signal.
- FIG. 1 (a) in the conventional method, individual cells contained in a sample are measured with a flow cytometer, and the pulses of each analog signal of forward scattered light, side scattered light, and side fluorescence are measured.
- the peak height of is acquired as the forward scattered light intensity, the lateral scattered light intensity, and the lateral fluorescence intensity.
- the cells are classified into specific types based on the forward scattered light intensity, the lateral scattered light intensity, and the lateral fluorescence intensity.
- the result of classifying the cells is displayed as a scattergram as shown in FIG. 1 (a).
- the horizontal axis indicates the lateral scattered light
- the vertical axis indicates the intensity of the lateral fluorescence.
- FIG. 1 (a) the type of blood cell was determined based only on the information of the peak height of the analog waveform.
- FIG. 1 (b) the entire waveform of the analog signal acquired from one cell by the flow cytometer is analyzed. The cells are classified by analyzing as the data of.
- FIG. 1B shows a waveform obtained by drawing an analog signal obtained by a flow cytometer, but as will be described later, the data regarding the cells in the sample in the present embodiment A / D-convert the analog signal.
- This digital data group is matrix data, and in this embodiment, it is, for example, one-row and multiple-column matrix data (that is, one-dimensional array data).
- the pre-training deep learning algorithm 50 shown in FIG. 1 (b) is used to learn waveform data for each cell type. Then, by inputting the waveform data of the cell whose cell type is unknown contained in the sample into the trained deep learning algorithm 60, the determination result of the cell type is derived from the deep learning algorithm 60 for each cell.
- the deep learning algorithms 50 and 60 are one of the artificial intelligence algorithms, and are composed of a neural network including a multi-layered intermediate layer.
- a large amount of matrix operations included in the deep learning algorithm 60 are performed by using a parallel processing processor mounted on the cell analyzer. , Execute in parallel processing.
- the cell analyzer includes a parallel processing processor capable of executing parallel processing and an execution instruction processor (hereinafter, simply referred to as a processor) that causes the parallel processing processor to execute parallel processing.
- individual cells in a biological sample used for analysis for the purpose of determining the cell type are also referred to as "cells to be analyzed”.
- the biological sample may contain multiple cells to be analyzed.
- the plurality of cells may include a plurality of types of cells to be analyzed.
- the biological sample may contain, for example, peripheral blood such as venous blood, arterial blood, urine, blood and body fluids other than urine.
- peripheral blood such as venous blood, arterial blood, urine, blood and body fluids other than urine.
- Body fluids other than blood and urine may include spinal fluid, ascites, pleural effusion, cerebrospinal fluid and the like.
- body fluids other than blood and urine may be simply referred to as "body fluids”.
- the blood sample is not limited as long as the number of cells can be counted and the cell type can be determined.
- the blood is preferably peripheral blood.
- the blood may be peripheral blood collected using an anticoagulant such as ethylenediamine tetraacetate sodium salt or potassium salt) and heparin sodium.
- Peripheral blood may be taken from an artery or a vein.
- the cell type to be determined in this embodiment is based on the cell type based on the morphological classification, and differs depending on the type of the biological sample.
- the cell types to be determined in the present embodiment include, for example, erythrocytes, nucleated cells such as leukocytes, platelets and the like. Is included. Nucleated cells include, for example, neutrophils, lymphocytes, monocytes, eosinophils, basophils. Neutrophils include, for example, lobulated nucleus neutrophils and rod-shaped nucleus neutrophils.
- the nucleated cells may include, for example, at least one selected from the group consisting of immature granulocytes and abnormal cells. Such cells are also included in the cell type to be determined in this embodiment. Immature granulocytes can include, for example, cells such as metamyelocytes, myelocytes, promyelocytes, myeloblasts and the like.
- nucleated cells may contain abnormal cells that are not contained in the peripheral blood of a healthy person.
- abnormal cells are cells that appear when suffering from a given disease, such as tumor cells.
- certain diseases include, for example, myelodystrophy syndrome, acute myeloblastic leukemia, acute myeloblastic leukemia, acute premyelocytic leukemia, acute myelomonocytic leukemia, acute monocytic leukemia.
- Leukemia acute giant nuclear blast leukemia, acute myeloid leukemia, acute lymphocytic leukemia, lymphoblastic leukemia, chronic myeloid leukemia, or chronic lymphocytic leukemia, hodgkin lymphoma, non-hodgkin lymphoma, etc. It can be a disease selected from the group consisting of malignant lymphoma of leukemia and multiple myeloma.
- abnormal cells include, for example, lymphoblasts, plasma cells, atypical erythroblasts, reactive erythroblasts, pre-erythroblasts, basic erythroblasts, polychromatic erythroblasts, orthochromatic erythroblasts. , Pre-major erythroblasts, basic erythroblasts, polychromatic giant erythroblasts, and erythroblasts that are nucleated erythroblasts such as orthochromatic giant erythroblasts, and giant nuclei containing micromegacariosites. It may contain cells that are not normally found in the peripheral blood of healthy individuals such as erythroblasts.
- the cell type to be determined in the present embodiment may include, for example, erythrocytes, leukocytes, transitional epithelium, epithelial cells such as squamous epithelium and the like.
- the abnormal cells may include bacteria, filamentous fungi, fungi such as yeast, tumor cells and the like.
- the cell type may include, for example, red blood cells, leukocytes, and large cells.
- large cell refers to a cell detached from the peritoneum of the body cavity or the viscera, which is larger than a leukocyte, and corresponds to, for example, a mesothelial cell, a histiocyte, a tumor cell, or the like.
- the cell type to be determined in this embodiment may include mature blood cell cells and immature blood cell lineage cells as normal cells.
- Mature blood cell cells include, for example, erythrocytes, nucleated cells such as leukocytes, platelets and the like.
- Nucleated cells such as leukocytes include, for example, neutrophils, lymphocytes, plasma cells, monocytes, eosinophils, and basophils.
- Neutrophils include, for example, lobulated nucleus neutrophils and rod-shaped nucleus neutrophils.
- Immature hematopoietic cells include, for example, hematopoietic stem cells, immature granulocyte cells, immature lymphocytic cells, immature monocytic cells, immature erythrocyte cells, megakaryocytic cells, mesenchymal. Includes cells and the like.
- Immature granulocytes can include, for example, cells such as metamyelocytes, myelocytes, promyelocytes, myeloblasts and the like.
- Immature lymphocytic cells include, for example, lymphoblasts.
- Immature monoblastic cells include monoblasts and the like.
- Immature erythroblasts include, for example, pre-erythroblasts, basic erythroblasts, polychromatic erythroblasts, orthochromatic erythroblasts, pre-giant erythroblasts, basic giant erythroblasts, etc. Includes polychromatic giant erythroblasts and nucleated red blood cells such as orthochromatic giant erythroblasts. Megakaryocyte cells include, for example, megakaryoblasts and the like.
- Examples of the abnormal cells that can be contained in the bone marrow include the above-mentioned myeloid atypical syndrome, acute myeloblastic leukemia, acute myeloblastic leukemia, acute premyelocytic leukemia, acute myelomonocytic leukemia, and acute monosphere.
- Leukemias such as sexual leukemia, erythrocyte leukemia, acute giant nuclear blast leukemia, acute myeloid leukemia, acute lymphocytic leukemia, lymphoblastic leukemia, chronic myeloid leukemia, or chronic lymphocytic leukemia, hodgkin lymphoma, non-hodgkin
- malignant lymphoma such as lymphoma, hematopoietic tumor cells selected from the group consisting of multiple myeloma, and metastatic tumor cells of malignant tumors developed in organs other than bone marrow.
- FIG. 1 illustrates forward scattered light signals, side scattered light signals, and side fluorescent signals, which are optical signals obtained by irradiating cells flowing through a flow cell with light, as signals obtained from cells. , It is not particularly limited as long as it is a signal that represents the characteristics of cells and can classify cells by type.
- the signal obtained from the cell may be any of a signal representing the morphological characteristics of the cell, a signal representing the chemical characteristics, a signal representing the physical characteristics, and a signal representing the genetic characteristics, but the morphology of the cells is preferable. It is a signal that represents a scientific feature.
- the signal representing the morphological characteristics of the cell is preferably an optical signal obtained from the cell.
- the optical signal is preferably an optical signal obtained as an optical response by irradiating a cell with light.
- the optical signal may include at least one selected from a signal based on light scattering, a signal based on light absorption, a signal based on transmitted light, and a signal based on fluorescence.
- the signal based on light scattering may include a scattered light signal generated by light irradiation and a light loss signal generated by light irradiation.
- the scattered light signal becomes a different parameter indicating the characteristics of the cell depending on the light receiving angle of the scattered light with respect to the traveling direction of the irradiation light.
- the forward scattered light signal is used as a parameter representing the size of the cell.
- the laterally scattered light signal is used as a parameter to represent the complexity of the cell's nucleus.
- the "forward” of the forward scattered light is intended to be the traveling direction of the light emitted from the light source.
- the "forward” may include a front low angle where the light receiving angle is around 0 to 5 degrees and / or a front high angle where the light receiving angle is around 5 to 20 degrees when the angle of the irradiation light is 0 degrees.
- “Side” is not restricted as long as it does not overlap with “forward”.
- the “side” may include a light receiving angle of around 25 to 155 degrees, preferably around 45 to 135 degrees, and more preferably around 90 degrees, where the angle of the irradiation light is 0 degrees.
- a signal based on light scattering may include polarization or depolarization as a component of the signal. For example, by irradiating a cell with light and receiving the scattered light generated through the polarizing plate, it is possible to receive only the scattered light polarized at a specific angle. Further, by irradiating the cells with light through the polarizing plate and receiving the generated scattered light through the polarizing plate that transmits only the polarization at an angle different from that of the polarizing plate for irradiation, only the depolarized scattered light can be received. ..
- the light loss signal represents the loss amount of the light receiving amount based on the fact that the light receiving amount in the light receiving portion decreases due to the light being irradiated to the cells and scattered.
- the light loss signal is preferably obtained as a light loss (axial light loss) in the optical axis direction of the irradiation light.
- the light loss signal can be expressed as a ratio of the light receiving amount when the cell flows through the flow cell when the light receiving amount in the light receiving portion is 100% in a state where the cell does not flow through the flow cell.
- Axial light loss is used as a parameter indicating the size of a cell like the forward scattered light signal, but the signal obtained differs depending on whether the cell has translucency or not.
- the fluorescence-based signal may be fluorescence excited by irradiating cells labeled with a fluorescent substance with light, or autofluorescence generated from unstained cells.
- the fluorescent substance may be a fluorescent dye that binds to a nucleic acid or a membrane protein, or may be a labeled antibody obtained by modifying an antibody that binds to a specific protein of a cell with a fluorescent dye.
- the optical signal may be acquired in the form of image data obtained by irradiating the cells with light and imaging the irradiated cells.
- Image data can be obtained by imaging individual cells flowing through a flow path with an image sensor such as a TDI camera or a CCD camera using a so-called imaging flow cytometer.
- image data of cells may be obtained by applying a sample containing cells or a measurement sample on a slide glass, spraying or instilling the sample, and imaging the slide glass with an image pickup element.
- the signal obtained from the cell is not limited to the optical signal, but may be an electrical signal obtained from the cell.
- the electrical signal for example, a direct current may be applied to the flow cell, and the change in impedance caused by the cell flowing through the flow cell may be used as the electrical signal.
- the electrical signal thus obtained is a parameter that reflects the volume of the cell.
- the electrical signal may be a change in impedance when a radio frequency is applied to cells flowing through the flow cell as an electrical signal.
- the electrical signal thus obtained is a parameter that reflects the conductivity of the cell.
- the signal obtained from the cell may be a combination of at least two or more types of signals obtained from the above-mentioned cell.
- the combination may be, for example, a combination of at least two of a plurality of optical signals, such as a forward scattered light signal, a side scattered light signal, and a fluorescent signal, or a scattered light signal having a different angle, for example, a low angle scattered light signal.
- high angle scattered light signals may be combined.
- an optical signal and an electrical signal may be combined, and the type and number of the combined signals are not particularly limited.
- the determination of the cell type is not limited to the method using the deep learning algorithm. From individual cells passing through a predetermined position in the flow path, signal intensities are obtained for each cell at multiple time points while the cell is passing through the predetermined position, and a plurality of acquired individual cells are obtained.
- the cell type may be determined based on the result of recognizing the signal strength at the time point as a pattern.
- the pattern may be recognized as a numerical pattern of signal strength at a plurality of time points, or may be recognized as a shape pattern when the signal strength at a plurality of time points is plotted as a graph.
- the cell type can be determined by comparing the numerical pattern of the cell to be analyzed with the numerical pattern whose cell type is already known. For comparison between the numerical pattern of the cell to be analyzed and the numerical pattern of the control, for example, Spearman's rank correlation, z-score, or the like can be used.
- the cell type can be determined by comparing the graph-shaped pattern of the cell to be analyzed with the graph-shaped pattern for which the cell type is already known. For comparison between the graph shape pattern of the cell to be analyzed and the graph shape pattern whose cell type is already known, for example, geometric shape pattern matching may be used, or a feature data represented by SIFT Descriptor may be used. A scripter may be used.
- FIG. 2 is a schematic diagram for explaining the waveform data used in this analysis method.
- FIG. 2A when a sample containing cell C is flowed through the flow cell FC and the cells C flowing through the flow cell FC are irradiated with light, forward scattered light FSC is generated forward in the traveling direction of the light.
- lateral scattered light SSC and lateral fluorescent SFL are generated laterally with respect to the traveling direction of light.
- the forward scattered light is received by the first light receiving unit D1, and a signal corresponding to the amount of received light is output.
- the laterally scattered light is received by the second light receiving unit D2, and a signal corresponding to the amount of light received is output.
- the lateral fluorescence is received by the third light receiving unit D3, and a signal corresponding to the amount of received light is output.
- analog signals representing changes in the signal over time are output from the light receiving units D1 to D3.
- the analog signal corresponding to the forward scattered light is called “forward scattered light signal”
- the analog signal corresponding to the side scattered light is called “side scattered light signal”
- the analog signal corresponding to side fluorescence is called “fluorescent signal”.
- One pulse of each analog signal corresponds to one cell.
- FIG. 2B is a diagram schematically showing conversion to a digital signal by the A / D conversion unit.
- the level of the analog signal may be converted into a digital signal as it is, but if necessary, processing such as noise reduction, baseline correction, and normalization may be performed.
- the A / D conversion unit reaches a time when the level of the forward scattered light signal among the analog signals input from the light receiving units D1 to D3 reaches a level set as a predetermined threshold value.
- the forward scattered light signal, the side scattered light signal, and the fluorescent signal are sampled.
- the A / D converter has each at a predetermined sampling rate (for example, sampling of 1024 points at intervals of 10 nanoseconds, sampling of 128 points at intervals of 80 nanoseconds, sampling of 64 points at intervals of 160 nanoseconds, etc.). Sampling analog signals.
- FIG. 2C is a diagram schematically showing waveform data obtained by sampling.
- matrix data having a value digitally indicating an analog signal level at a plurality of time points as an element can be obtained.
- the A / D conversion unit generates a digital signal of forward scattered light, a digital signal of laterally scattered light, and a digital signal of lateral fluorescence corresponding to one cell.
- the A / D conversion is repeated until the number of digitally signalized cells reaches a predetermined number, or until a predetermined time elapses from the start of flowing the sample into the flow cell. As a result, as shown in FIG.
- a digital signal obtained by combining the waveform data of N cells contained in one sample can be obtained.
- the set is called a digital signal.
- Each waveform data generated by the A / D conversion unit may be given an index for identifying each cell.
- an integer from 1 to N is given in the order of the generated waveform data, and the waveform data of the forward scattered light, the waveform data of the side scattered light, and the waveform data of the side fluorescence obtained from the same cell are given. , Each is given the same index.
- Waveform data can be analyzed as a set to classify cell types.
- FIG. 3 is a schematic diagram showing an example of a training data generation method used for training a deep learning algorithm for determining a cell type.
- the training data 75 measures the sample with a flow cytometer, and the analog signal 70a of the forward scattered light (FSC), the analog signal 70b of the side scattered light (SSC), and the side fluorescence obtained for the cells contained in the sample. It is waveform data generated based on the analog signal 70c of (SFL). The method for acquiring waveform data is as described above.
- the training data 75 is, for example, a cell in which a sample is measured by a flow cytometer and the cells contained in the sample are analyzed based on a conventional scattergram, and as a result, it is determined that there is a high possibility of a specific cell type.
- Waveform data can be used.
- a blood sample is measured with a flow cytometer, and waveform data of forward scattered light, side scattered light, and fluorescence of individual cells contained in the sample are accumulated. Based on lateral scattered light intensity (pulse height of lateral scattered light signal) and fluorescence intensity (pulse height of fluorescent signal), cells are neutrophils, lymphocytes, monocytes, eosinophils, basophils.
- Training data can be obtained by assigning a label value corresponding to the classified cell type to the waveform data of the cell. For example, determine the mode, mean or median of lateral scattered light intensity and lateral fluorescence intensity of cells contained in a population of neutrophils, identify representative cells based on those values, and identify them. Training data can be obtained by assigning the label value "1" corresponding to the neutrophil to the waveform data of the cells of.
- the method of generating training data is not limited to this, for example, training is performed by collecting only specific cells with a cell sorter, measuring the cells with a flow cytometer, and assigning a cell label value to the obtained waveform data. Data may be obtained.
- the analog signals 70a, 70b, and 70c indicate a forward scattered light signal, a side scattered light signal, and a side fluorescence signal when the neutrophil is measured by the flow cytometer, respectively.
- waveform data 72a of the forward scattered light signal, waveform data 72b of the side scattered light signal, and waveform data 72c of the side fluorescent signal are obtained.
- Adjacent cells within each of the waveform data 72a, 72b, 72c store signal levels at intervals corresponding to the sampling rate, for example, at intervals of 10 nanoseconds.
- the waveform data 72a, 72b, 72c are combined with a label value 77 indicating the type of cell from which the data is based, and three waveform data corresponding to each cell, in other words, three signal intensities (forward scattered light signal).
- the data of intensity, signal intensity of laterally scattered light, and signal intensity of lateral fluorescence) are input to the deep learning algorithm 50 as training data 75 so as to be a set.
- the waveform data 72a, 72b, and 72c are given "1" as the label value 77 indicating that they are neutrophils, and the training data. 75 is generated.
- FIG. 4 shows an example of the label value 77. Since the training data 75 is generated for each cell type, the label value 77 is assigned differently depending on the cell type.
- the neural network 50 is preferably a convolutional neural network having a convolutional layer.
- the number of nodes of the input layer 50a in the neural network 50 corresponds to the number of elements of the array included in the waveform data of the input training data 75.
- the number of elements in the sequence is equal to the sum of the number of elements of the forward scattered light, the side scattered light, and the lateral fluorescence waveform data 72a, 72b, and 72c corresponding to one cell.
- the waveform data 72a, 72b, 72c are input to the input layer 50a of the neural network 50.
- the label value 77 of each waveform data of the training data 75 is input to the output layer 50b of the neural network to train the neural network 50.
- Reference numeral 50c in FIG. 3 indicates an intermediate layer.
- FIG. 5 shows an example of a method for analyzing waveform data of cells to be analyzed.
- the analog signal 80a of the forward scattered light, the analog signal 80b of the side scattered light, and the analog signal 80c of the side fluorescence obtained from the cells to be analyzed by the flow cytometer are obtained by the above method.
- the analysis data 85 composed of the waveform data to be generated is generated.
- the analysis data 85 and the training data 75 have at least the same acquisition conditions.
- the acquisition conditions are the conditions for measuring the cells contained in the sample with a flow cytometer, for example, the preparation conditions of the measurement sample, the flow velocity when the measurement sample is passed through the flow cell, the intensity of the light applied to the flow cell, the scattered light and the scattered light. Includes the amplification factor of the light receiving part that receives fluorescence.
- the acquisition condition further includes a sampling rate at the time of A / D conversion of the analog signal.
- an analog signal 80a for forward scattered light, an analog signal 80b for side scattered light, and an analog signal 80c for side fluorescence are obtained.
- these analog signals 80a, 80b, and 80c are A / D converted as described above, the time points at which the signal intensities are acquired are synchronized for each cell, and the waveform data 82a of the forward scattered light signal and the side scattered light signal are synchronized.
- the waveform data 82b and the waveform data 82c of the lateral fluorescence signal are obtained.
- the waveform data 82a, 82b, 82c are combined so that the data of the three signal intensities of each cell (the signal intensity of the forward scattered light, the signal intensity of the side scattered light, and the signal intensity of the side fluorescence) are set as a set. Then, it is input to the deep learning algorithm 60 as the analysis data 85.
- the analysis result 83 is output from the output layer 60b as classification information regarding the cell type corresponding to the analysis data 85.
- Reference numeral 60c in FIG. 5 indicates an intermediate layer.
- the classification information regarding a cell type is, for example, the probability that a cell belongs to each of a plurality of cell types. Further, it is determined that the cell to be analyzed for which the analysis data 85 has been acquired belongs to the classification having the highest value in this probability, and the label value 82 or the like, which is an identifier indicating the cell type, is included in the analysis result 83. You may.
- the analysis result 83 may be data in which the label value is replaced with information indicating the cell type (for example, a character string).
- the deep learning algorithm 60 outputs the label value “1” having the highest probability that the analysis target cell for which the analysis data 85 has been acquired belongs, and further, “1” corresponding to this label value is output.
- An example is shown in which the character data "neutrophil" is output as the analysis result 83.
- the label value may be output by the deep learning algorithm 60, but another computer program may output the most preferable label value based on the probability calculated by the deep learning algorithm 60.
- the cell waveform data of the present embodiment, or the analog signal of the cell that is the source thereof, can be acquired by the first cell analyzer 4000 or the second cell analyzer 4000'.
- FIG. 6A shows an example of the appearance of the cell analyzer 4000.
- FIG. 6B shows an example of the appearance of the cell analyzer 4000'.
- the cell analyzer 4000 controls the setting and measurement of the measurement conditions of the sample in the measurement unit 400 and the measurement unit 400, and analyzes the analysis result of the cell data by the deep learning algorithm 60.
- a processing unit 300 for this purpose is provided.
- the cell analyzer 4000 controls the setting and measurement of the measurement conditions of the sample in the measurement unit 500 and the measurement unit 500, and analyzes the analysis result of the cell data by the deep learning algorithm 60.
- a processing unit 300 is provided for this purpose.
- the measuring units 400 and 500 and the processing unit 300 may be connected by wire or wirelessly so as to be able to communicate with each other. Although the configuration examples of the measurement units 400 and 500 are shown below, the present embodiment is not limited to the following examples and is not interpreted.
- the processing unit 300 may be shared with the vendor-side device 100 described later.
- Measurement unit and processing unit configuration A configuration example will be described when the measurement unit 400 is a blood analyzer including an FCM detection unit which is a flow cytometer for detecting cells in a blood sample, and more specifically, a blood cell counter.
- FIG. 7 shows an example of a block diagram of the measurement unit 400.
- the measurement unit 400 includes an FCM detection unit 410 for detecting blood cells, an analog processing unit 420 for processing an analog signal output from the FCM detection unit 410, a measurement unit control unit 480, and a sample preparation unit 440.
- a device mechanism unit 430 and a sample suction unit 450 are provided.
- FIG. 8 is a schematic diagram for explaining the sample suction unit 450 and the sample preparation unit 440.
- the sample suction unit 450 includes a nozzle 451 for sucking a blood sample (whole blood) from the blood collection tube T, and a pump 452 for applying negative pressure / positive pressure to the nozzle.
- the nozzle 451 is inserted into the blood collection tube T by being moved up and down by the device mechanism unit 430.
- the device mechanism unit 430 may include a hand member that overturns and stirs the blood collection tube T before suctioning blood from the blood collection tube T.
- the sample preparation unit 440 includes five reaction chambers 440a to 440e.
- the reaction chambers 440a to 440e are used in the DIFF, RET, WPC, PLT-F, and WNR measurement channels, respectively.
- a hemolytic agent container containing a hemolytic agent which is a reagent corresponding to each measurement channel
- a staining liquid container containing a staining liquid are connected via a flow path.
- a measurement channel is composed of one reaction chamber and reagents (hemolytic agent and stain solution) connected to the reaction chamber.
- the DIFF measurement channel is composed of a DIFF hemolytic agent and a DIFF stain, which are reagents for DIFF measurement, and a DIFF reaction chamber 440a.
- measurement channels are similarly configured. Although one measurement channel is illustrated here with one hemolyzing agent and one staining solution, one measurement channel does not necessarily have to include both the hemolyzing agent and the staining solution, and a plurality of measurement channels may be provided. One reagent may be shared by the measurement channel.
- the nozzle 451 that sucks the blood sample accesses the reaction chamber corresponding to the measurement channel corresponding to the order from above in the reaction chambers 440a to 440e by moving horizontally and vertically by the device mechanism unit 430, and sucks the blood sample. Discharge.
- the sample preparation unit 440 supplies the corresponding hemolytic agent and staining solution to the reaction chamber into which the blood sample is discharged, and prepares the measurement sample by mixing the blood sample, the hemolytic agent, and the staining solution in the reaction chamber.
- the prepared measurement sample is supplied to the FCM detection unit 410 from the reaction chamber via the flow path, and the cells are measured by the flow cytometry method.
- FIG. 9 shows a configuration example of the optical system of the FCM detection unit 410.
- the light source 4111 irradiates the flow cell 4113 with light when the cells contained in the measurement sample pass through the flow cell (sheath flow cell) 4113 provided in the flow cytometer. Then, the scattered light and fluorescence emitted from the cells in the flow cell 4113 by this light are detected.
- the light emitted from the laser diode which is the light source 4111, is applied to the cells passing through the flow cell 4113 via the irradiation lens system 4112.
- the light source 4111 of the flow cytometer is not particularly limited, and a light source 4111 having a wavelength suitable for exciting the fluorescent dye is selected.
- a light source 4111 for example, a semiconductor laser light source including a red semiconductor laser light source and / or a blue semiconductor laser light source, an argon laser light source, a gas laser light source such as a helium-neon laser, a mercury arclamp, and the like are used.
- a semiconductor laser light source is suitable because it is much cheaper than a gas laser light source.
- the forward scattered light emitted from the particles passing through the flow cell 4113 is received by the forward scattered light receiving element 4116 via the condenser lens 4114 and the pinhole portion 4115.
- the forward scattered light receiving element 4116 is a photodiode.
- the side scattered light is received by the side scattered light receiving element 4121 via the condenser lens 4117, the dichroic mirror 4118, the bandpass filter 4119, and the pinhole portion 4120.
- the side scattered light receiving element 4121 is a photodiode.
- the lateral fluorescence is received by the lateral fluorescence light receiving element 4122 via the condenser lens 4117 and the dichroic mirror 4118.
- the side fluorescence light receiving element 4122 is an avalanche photodiode.
- a photomultiplier tube may be used as the forward scattered light receiving element 4116, the side scattered light receiving element 4121, and the side fluorescent light receiving element 4122.
- the light receiving signals output from the light receiving elements 4116, 4121 and 4122 are input to the analog processing unit 420 via the amplifiers 4151, 4152 and 4153, respectively.
- the analog processing unit 420 performs processing such as noise removal and smoothing on the analog signal input from the FCM detection unit 410, and transfers the processed analog signal to the measurement unit control unit 480. Output.
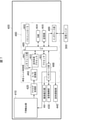
- the measurement unit control unit 480 includes an A / D conversion unit 482, a processor 4831, a RAM 4834, a storage unit 4835, a bus controller 4850, a parallel processing processor 4833, and an interface unit 489 connected to the processing unit 300. ing. Further, the measurement unit control unit 480 includes an interface unit 484 interposed between the A / D conversion unit 482 and an interface unit 488 interposed between the device mechanism unit 430. As shown in FIG. 7, in this configuration example, the parallel processing processor 4833 is mounted on the cell analyzer 4000 in a form incorporated inside the measurement unit 400.
- the processor 4831 is connected to the interface unit 489, the interface unit 488, the interface unit 484, the RAM 4834, and the storage unit 4835 via the bus 485.
- the processor 4831 is connected to the parallel processing processor 4833 via the bus 485.
- the processing unit 300 is connected to each unit of the measurement unit 400 via the interface unit 489 and the bus 485.
- the bus 485 is, for example, a transmission line having a data transfer speed of several hundred MB / s or more.
- the bus 485 may be configured by, for example, a transmission line having a data transfer rate of 1 GB / s or more.
- the bus 485 transfers data based on, for example, the PCI-Express or the PCI-X standard.
- the A / D conversion unit 482 converts the analog signal output from the analog processing unit 420 into a digital signal.
- the A / D conversion unit 482 converts an analog signal from the start of measurement of the sample to the end of measurement into a digital signal.
- the A / D conversion unit 482 performs each. Converts the analog signal from the start of measurement to the end of measurement into a digital signal.
- the A / D conversion unit 482 for example, as described with reference to FIG.
- three types of analog signals correspond to a plurality of corresponding analog signals. It is input via the signal transmission path 421.
- the A / D conversion unit 482 converts each of the analog signals input from the plurality of signal transmission paths 421 into digital signals.
- Each signal transmission path 421 is configured to transmit, for example, an analog signal as a differential signal.
- the A / D conversion unit 482 has a predetermined sampling rate (for example, sampling of 1024 points at intervals of 10 nanoseconds, sampling of 128 points at intervals of 80 nanoseconds, or sampling of 160 nanoseconds).
- the analog signal is sampled at intervals (sampling of 64 points, etc.).
- the A / D conversion unit 482 performs sampling processing on three types of analog signals corresponding to each cell, and for each cell, the waveform data of the forward scattered light signal, the waveform data of the side scattered light signal, and the fluorescence. Generates signal waveform data.
- the A / D conversion unit 482 assigns an index to each of the generated waveform data. As shown in FIG.
- the generated waveform data becomes a digital signal in which waveform data of N cells contained in one sample can be continuously formed.
- three digital signals corresponding to three types of analog signals (forward scattered light signal, side scattered light signal and fluorescent signal) obtained from N cells are generated.
- the A / D conversion unit 482 may calculate the peak value from the pulse of the analog signal in addition to generating the waveform data from the analog signal.
- the A / D conversion unit 482 inputs the generated digital signal to the bus 485.
- the bus controller 4850 transmits the digital signal output from the A / D conversion unit 482 to the RAM 4834 by, for example, DMA (Direct Memory Access) transfer.
- the RAM 4834 stores a digital signal.
- the processor 4831 uses the parallel processing processor 4833 to perform analysis processing of the waveform data included in the generated digital signal according to the deep learning algorithm 60. That is, the processor 4831 is programmed to execute the analysis processing of the waveform data included in the digital signal according to the deep learning algorithm 60.
- the analysis software 4832 for analyzing cell data based on the deep learning algorithm 60 may be stored in the storage unit 4835. In this case, the processor 4831 executes the data analysis process based on the deep learning algorithm 60 by executing the analysis software 4832 stored in the storage unit 4835.
- the processor 4831 is, for example, a CPU (Central Processing Unit).
- the processor 4831 is, for example, Core i9, Core i7, Core i5 manufactured by Intel, Ryzen 9, Ryzen manufactured by AMD. 7, Ryzen 5, Ryzen 3 and the like may be used.
- the processor 4831 controls the parallel processing processor 4833.
- the parallel processing processor 4833 executes, for example, parallel processing related to matrix operations according to the control of the processor 4831. That is, the processor 4831 is the master processor of the parallel processing processor 4833, and the parallel processing processor 4833 is a slave processor of the processor 4831.
- Processor 4831 is also referred to as a host processor or main processor.
- the parallel processing processor 4833 executes a plurality of arithmetic processes in parallel, which are at least a part of the processes related to the analysis of waveform data.
- the parallel processing processor 4833 is, for example, a GPU (Graphics Processing Unit), an FPGA (Field Programmable Gate Array), or an ASIC (Application Specific Integrated Circuit).
- the parallel processing processor 4833 may be pre-programmed with arithmetic processing related to the trained deep learning algorithm 60, for example.
- the parallel processing processor 4833 is an ASIC
- the parallel processing processor 4833 may, for example, preliminarily incorporate a circuit for executing arithmetic processing related to the trained deep learning algorithm 60, or may be incorporated in such an embedded circuit.
- a programmable module may be built-in.
- the parallel processing processor 4833 for example, GeForce, Quadro, TITAN, Jetson or the like manufactured by NVIDIA may be used.
- Jetson series for example, Jetson Nano, Jetson Tx2, Jetson Xavier, and Jetson AGX Xavier are used.
- the processor 4831 executes, for example, a calculation process related to the control of the measurement unit 400.
- the processor 4831 executes, for example, a calculation process relating to a control signal transmitted / received between the device mechanism unit 430, the sample preparation unit 440, and the sample suction unit 450.
- the processor 4831 executes, for example, a calculation process related to transmission / reception of information to / from the processing unit 300.
- the processor 4831 executes, for example, reading program data from the storage unit 4835, expanding the program to the RAM 4834, and transmitting / receiving data to / from the RAM 4834.
- Each of the above-mentioned processes executed by the processor 4831 is required to be executed in a predetermined order, for example.
- the processes required for controlling the device mechanism unit 430, the sample preparation unit 440, and the sample suction unit 450 are A, B, and C, it may be required to execute B, A, and C in this order. Since the processor 4831 often executes continuous processing depending on such an order, even if the number of arithmetic units (sometimes referred to as "processor core”, “core”, etc.) is increased, the processing is not necessarily performed. It doesn't increase the speed.
- the parallel processing processor 4833 executes a large amount of routine calculation processing such as an operation of matrix data including a large amount of elements.
- the parallel processing processor 4833 executes parallel processing in which at least a part of the processing for analyzing waveform data according to the deep learning algorithm 60 is parallelized.
- the deep learning algorithm 60 includes, for example, a large number of matrix operations.
- the deep learning algorithm 60 may include, for example, at least 100 matrix operations and may also include at least 1000 matrix operations.
- the parallel processing processor 4833 has a plurality of arithmetic units, and each of these arithmetic units can execute a matrix operation at the same time.
- the parallel processing processor 4833 can execute the matrix operation by each of the plurality of arithmetic units in parallel as the parallel processing.
- the matrix operation included in the deep learning algorithm 60 can be divided into a plurality of arithmetic processes that are not order-dependent from each other.
- the arithmetic processing divided in this way can be executed in parallel by each of the plurality of arithmetic units.
- These arithmetic units may be referred to as a "processor core", a "core”, or the like.
- SIMD Single Instruction Multiple Data
- the parallel processing processor 4833 is suitable for such SIMD operation, for example.
- Such a parallel processing processor 4833 may be referred to as a vector processor.
- the processor 4831 is suitable for executing various and complicated processes.
- the parallel processing processor 4833 is suitable for executing a large amount of stylized processing in parallel. By executing a large number of stylized processes in parallel, the TAT (Turn Around Time) required for the calculation process is shortened.
- the target of parallel processing executed by the parallel processing processor 4833 is not limited to matrix operations.
- the parallel processing processor 4833 executes the learning processing according to the deep learning algorithm 50
- the differential calculation or the like related to the learning processing may be the target of the parallel processing.
- the number of arithmetic units of the processor 4831 is, for example, dual cores (number of cores: 2), quad cores (number of cores: 4), and octacores (number of cores: 8).
- the parallel processing processor 4833 has, for example, at least 10 arithmetic units (number of cores: 10), and can execute 10 matrix operations in parallel.
- the parallel processing processor 4833 may have, for example, dozens of arithmetic units.
- the parallel processing processor 4833 may have, for example, at least 100 arithmetic units (number of cores: 100) and can execute 100 matrix operations in parallel.
- the parallel processing processor 4833 may have, for example, hundreds of arithmetic units.
- the parallel processing processor 4833 may have, for example, at least 1000 arithmetic units (number of cores: 1000) and can execute 1000 matrix operations in parallel.
- the parallel processing processor 4833 may have, for example, thousands of arithmetic units.
- FIG. 11 shows a configuration example of the parallel processing processor 4833.
- the parallel processing processor 4833 includes a plurality of arithmetic units 4836 and a RAM 4837. Each of the arithmetic units 4836 executes arithmetic processing of matrix data in parallel.
- the RAM 4837 stores data related to arithmetic processing executed by the arithmetic unit 4836.
- the RAM 4837 is a memory having a capacity of at least 1 gigabyte.
- the RAM 4837 may be a memory having a capacity of 2 gigabytes, 4 gigabytes, 6 gigabytes, 8 gigabytes, or 10 gigabytes or more.
- the arithmetic unit 4836 acquires data from the RAM 4837 and executes arithmetic processing.
- the arithmetic unit 4836 may be referred to as a "processor core", a "core”, or the like.
- FIGS. 12 to 14 show an example of mounting the parallel processing processor 4833 on the measurement unit 400.
- 12 to 14 show an example in which the parallel processing processor 4833 is mounted on the cell analyzer 4000 in a form of being incorporated inside the measurement unit 400.
- 12 and 13 show a mounting example in which the processor 4831 and the parallel processing processor 4833 are provided as separate bodies.
- the processor 4831 is mounted on the substrate 4838, for example.
- the parallel processing processor 4833 is mounted on the graphic board 4830, for example, and the graphic board 4830 is connected to the board 4838 via the connector 4839.
- the processor 4831 is connected to the parallel processing processor 4833 via the bus 485.
- FIG. 12 to 14 show an example in which the parallel processing processor 4833 is mounted on the cell analyzer 4000 in a form of being incorporated inside the measurement unit 400.
- 12 and 13 show a mounting example in which the processor 4831 and the parallel processing processor 4833 are provided as separate bodies.
- the processor 4831 is mounted on the substrate 4838, for example.
- the parallel processing processor 4833 may be mounted directly on the substrate 4838 and connected to the processor 4831 via the bus 485, for example.
- FIG. 14 shows a mounting example in which the processor 4831 and the parallel processing processor 4833 are integrally provided. As shown in FIG. 14, the parallel processing processor 4833 may be built in, for example, the processor 4831 mounted on the board 4838.
- FIG. 15 shows another example of mounting the parallel processing processor 4833 on the measurement unit 400.
- FIG. 15 shows an example in which a parallel processing processor 4833 is mounted on the measurement unit 400 by an external device 4800 connected to the measurement unit 400.
- the parallel processing processor 4833 is mounted on, for example, an external device 4800 which is a USB (Universal Serial Bus) device, and the USB device is connected to the bus 485 via the interface unit 487 so that the parallel processing processor 4833 becomes a cell. It is mounted on the analyzer 4000.
- the USB device may be a small device such as a USB dongle.
- the interface unit 487 is, for example, a USB interface having a transfer rate of several hundred Mbps, and more preferably a USB interface having a transfer rate of several Gbps to several tens of Gbps or more.
- a Neural Compute Stick 2 manufactured by Intel may be used as the external device 4800 on which the parallel processing processor 4833 is mounted.
- a plurality of parallel processing processors 4833 may be mounted on the cell analyzer 4000. Since the number of arithmetic units 4836 in the parallel processing processor 4833 mounted on one USB device may be smaller than that of the GPU or the like, the number of cores can be increased by adding a plurality of USB devices connected to the measurement unit 400. It is possible to scale up.
- FIGS. 16, 17 and 18 show an outline of arithmetic processing executed by the parallel processing processor 4833 under the control of the analysis software 4832 running on the processor 4831.
- FIG. 16 shows a configuration example of a parallel processing processor 4833 that executes arithmetic processing.
- the parallel processing processor 4833 has a plurality of arithmetic units 4836 and RAM 4837.
- the processor 4831 that executes the analysis software 4832 can instruct the parallel processing processor 4833 to execute at least a part of the arithmetic processing required for analyzing the waveform data by the deep learning algorithm 60 on the parallel processing processor 4833.
- the processor 4831 instructs the parallel processing processor 4833 to execute arithmetic processing related to waveform data analysis based on the deep learning algorithm.
- All or at least a part of the waveform data corresponding to the signal detected by the FCM detection unit 410 is stored in the RAM 4834.
- the data stored in the RAM 4834 is transferred to the RAM 4837 of the parallel processing processor 4833.
- the data stored in the RAM 4834 is transferred to the RAM 4738 by, for example, a DMA (Direct Memory Access) method.
- Each of the plurality of arithmetic units 4836 of the parallel processing processor 4833 executes arithmetic processing on the data stored in the RAM 4837 in parallel.
- Each of the plurality of arithmetic units 4836 acquires necessary data from the RAM 4837 and executes arithmetic processing.
- the data corresponding to the calculation result is stored in the RAM 4837 of the parallel processing processor 4833.
- the data corresponding to the calculation result is transferred from RAM 4837 to RAM 4834, for example, by the DMA method.
- FIG. 17 shows an outline of the matrix operation executed by the parallel processing processor 4833.
- the parallel processing processor 4833 executes a plurality of arithmetic processings related to matrix operations in parallel.
- FIG. 17A shows a formula for calculating the product of matrices.
- the matrix c is obtained by the product of the matrix a of n rows and n columns and the matrix b of n rows and n columns.
- the formula is described in a multi-layered loop syntax.
- FIG. 17B shows an example of arithmetic processing executed in parallel by the parallel processing processor 4833.
- the calculation formula illustrated in FIG. 17A is divided into n ⁇ n arithmetic processes, which is the number of combinations of the loop variable i in the first layer and the loop variable j in the second layer, for example. Can be done. Since each of the arithmetic processes divided in this way is an arithmetic process that does not depend on each other, they can be executed in parallel.
- FIG. 18 is a conceptual diagram showing that a plurality of arithmetic processes exemplified in FIG. 17 (b) are executed in parallel by the parallel processing processor 4833.
- each of the plurality of arithmetic processes is assigned to any of the plurality of arithmetic units 4836 included in the parallel processing processor 4833.
- Each of the arithmetic units 4836 executes the assigned arithmetic processing in parallel with each other. That is, each of the arithmetic units 4836 simultaneously executes the divided arithmetic processing.
- the parallel processing processor 4833 By the calculation by the parallel processing processor 4833 exemplified in FIGS. 17 and 18, for example, information regarding the probability that the cell corresponding to the waveform data belongs to each of a plurality of cell types is obtained. Based on the result of the calculation, the processor 4831 that executes the analysis software 4832 analyzes the cell type of the cell corresponding to the waveform data. The calculation result is stored in the RAM 4837 of the parallel processing processor 4833, and is transferred from the RAM 4738 to the RAM 4834. The processor 4831 transmits the analysis result based on the calculation result stored in the RAM 4834 to the processing unit 300 via the bus 485 and the interface unit 489.
- the calculation of the probability that a cell belongs to each of a plurality of cell types may be performed by a processor other than the parallel processing processor 4833.
- the calculation result by the parallel processing processor 4833 is transferred from the RAM 4738 to the RAM 4834, and the processor 4831 relates to the probability that the cell corresponding to each waveform data belongs to each of the plurality of cell types based on the calculation result read from the RAM 4834. Information may be calculated.
- the calculation result by the parallel processing processor 4833 is transferred from the RAM 4738 to the processing unit 300, and the processor mounted on the processing unit 300 provides information on the probability that the cells corresponding to the respective waveform data belong to each of the plurality of cell types. You may calculate.
- the processes shown in FIGS. 17 and 18 are applied to, for example, arithmetic processing (also referred to as filter processing) related to the convolution layer in the deep learning algorithm 60.
- arithmetic processing also referred to as filter processing
- FIG. 19 shows an outline of the arithmetic processing related to the convolution layer.
- FIG. 19A shows an example of waveform data of forward scattered light (FSC) as waveform data input to the deep learning algorithm 60.
- the waveform data of this embodiment is one-dimensional matrix data as shown in FIG.
- waveform data is an array of elements arranged in a row.
- the number of elements of the waveform data is n (n is an integer of 1 or more).
- a a plurality of filters are shown. The filter is generated by the learning process of the deep learning algorithm 50.
- Each of the plurality of filters is one-dimensional matrix data representing the characteristics of the waveform data.
- the filter shown in (a) is matrix data of 1 row and 3 columns, but the number of columns is not limited to 3.
- FIG. 19B shows an outline of the matrix operation between the waveform data and the filter.
- the matrix operation is executed while shifting each filter by one for each element of the waveform data.
- the calculation of the matrix operation is executed by the following equation 1.
- the subscript of x is a variable indicating the row number and column number of the waveform data.
- the subscript of h is a variable indicating the row number and the column number of the filter.
- the parallel processing processor 4833 executes the matrix operation represented by the equation 1 in parallel by each of the plurality of calculation units 4836. Classification information regarding the cell type of each cell is generated based on the arithmetic processing executed by the parallel processing processor 4833. The generated classification information is transmitted to the processing unit 300 used for generating and displaying the test result of the sample based on the classification information.
- the measurement unit 400 can process the waveform data and the identification information in association with each other. Specifically, the measurement unit 400 can generate the analysis result of the waveform data (that is, the classification information regarding the cell type of each cell) in association with the identification information. For example, the measurement unit 400 associates the classification information and the identification information regarding the cell type of each cell and transmits them to the processing unit 300.
- the identification information includes, for example, (1) identification information of a biological sample corresponding to waveform data, (2) identification information of cells corresponding to waveform data (for example, the index described above), and (3) identification of a patient corresponding to waveform data.
- identification information of the biological sample corresponding to the waveform data includes information on the time when the measurement order for the biological sample is registered, information on the time when the analyzer identifies the biological sample, and the analyzer measures the biological sample.
- information to identify whether the biological sample is an emergency sample or a normal sample and information to identify whether the biological sample is a remeasurement or a new measurement. May contain information.
- the measurement unit 400 receives an inspection order from the LIS (Laboratory Information System) or the processing unit 300, for example, at least one of the above identification information (1) to (6) or one of them is received from the LIS or the processing unit 300. You can get the combination.
- at least one of the illustrated (1) to (6) is transmitted to the processing unit 300 in association with the classification information, and is provided to the user as an inspection result via the processing unit 300.
- the plurality of combinations of (1) to (6) exemplified may be transmitted to the processing unit 300 in association with the classification information.
- the measurement unit 400 can also generate, for example, at least one of the above identification information (1) to (6) or a combination thereof.
- the processing unit 300 may perform the correspondence between the waveform data and the identification information (at least one of the above (1) to (6) or a combination thereof).
- the processing unit 300 acquires, for example, identification information of a biological sample and identification information of a patient when receiving a test order from LIS.
- the processing unit 300 instructs the measurement unit 400 to perform the measurement corresponding to the inspection order.
- the processing unit 300 acquires the result (that is, waveform data) corresponding to the measurement instruction from the measurement unit 400
- the processing unit 300 associates the result (that is, the waveform data) with the identification information.
- the processing unit 300 is connected to the processor 4831 via the interface unit 489 and the bus 485, and can receive the analysis result by the processor 4831 and the parallel processing processor 4833.
- the interface unit 489 is, for example, a USB interface.
- FIG. 10 is a diagram showing the configuration of the processing unit 300.
- the processing unit 300 includes a processor 3001, a bus 3003, a storage unit 3004, an interface unit 3006, a display unit 3015, and an operation unit 3016.
- the processing unit 300 is configured by a personal computer that is general in terms of hardware, and functions as a processing unit of the cell analyzer 4000 by executing a dedicated program stored in the storage unit 3004.
- the processor 3001 is a CPU and can execute a program stored in the storage unit 3004.
- the storage unit 3004 includes a hard disk device.
- the storage unit 3004 stores at least a program 60 for processing cell classification information transmitted from the measurement unit 400 and generating a test result of a sample.
- the test result of the sample means the result of counting the blood cells contained in the sample based on the analysis result 83 of the classification information 82 of the individual cells obtained by the measurement unit 400.
- the display unit 3015 includes a computer screen.
- the display unit 3015 is connected to the processor 3001 via the interface unit 3006 and the bus 3003.
- the display unit 3015 can receive the image signal input from the processor 3001 and display the analysis result 83 received from the measurement unit 400 and the inspection result obtained by the processor 3001 analyzing the analysis result 83.
- the operation unit 3016 includes a pointing device including a keyboard, a mouse, or a touch panel.
- a user such as a doctor or a laboratory engineer can input a measurement order to the cell analyzer 4000 and input a measurement instruction according to the measurement order.
- the operation unit 3016 can also receive an instruction to display the inspection result from the user.
- the user can operate the operation unit 3016 to browse various information regarding the test result, for example, graphs, charts, and flag information given to the sample.
- the above-mentioned measurement unit 400 is connected to the processing unit 300 via the interface unit 3006.
- the processor 4831 of the measurement unit 400 can transmit the classification information of individual cells generated by the deep learning algorithm 60 to the processor 3001 of the processing unit 300 in association with the identification information of the sample.
- the processor 3001 stores the cell analysis result 83 received from the measurement unit 400 in the storage unit 3004 in association with the identification information of the sample.
- the processor 3001 of the processing unit 300 receives a measurement order and a measurement instruction from the user via the operation unit 3016, the processor 3001 transmits a measurement command to the measurement unit 400 (step S1).
- the processor 4831 of the measurement unit 400 Upon receiving the measurement command, the processor 4831 of the measurement unit 400 starts the measurement of the sample.
- the processor 4831 causes the sample suction unit 450 to suck the sample from the blood collection tube T (step S10).
- the processor 4831 causes the sample suction unit 450 to dispense the sucked sample into any of the reaction chambers 440a to 440e of the sample preparation unit 440.
- the measurement command transmitted from the processing unit 300 in step S1 includes information on the measurement channel for which measurement is requested by the measurement order.
- the processor 4831 controls the sample suction unit 450 to discharge the sample into the reaction chamber of the corresponding measurement channel based on the information of the measurement channel included in the measurement command.
- the processor 4831 causes the sample preparation unit 440 to prepare a measurement sample (step S11). Specifically, the sample preparation unit 440 receives a command from the processor 4831, supplies a reagent (hemolytic agent and a staining solution) to the reaction chamber into which the sample is discharged, and mixes the sample and the reagent. This prepares a measurement sample in which the erythrocytes are hemolyzed with a hemolytic agent and the cells targeted by the measurement channel, such as leukocytes and reticulocytes, are stained by staining in the reaction chamber.
- a reagent hemolytic agent and a staining solution
- the processor 4831 causes the FCM detection unit 410 to measure the prepared measurement sample (step S12). Specifically, the processor 4831 controls the device mechanism unit 430 to send the measurement sample in the reaction chamber of the sample preparation unit 440 to the FCM detection unit 410.
- the reaction chamber and the FCM detection unit 410 are connected by a flow path, and the measurement sample sent from the reaction chamber flows through the flow cell 4113 and is irradiated with laser light by the light source 4111 (see FIG. 9).
- the cells contained in the measurement sample pass through the flow cell 4113, the cells are irradiated with light, and the forward scattered light, the side scattered light, and the side fluorescence generated from the cells are detected by the light receiving elements 4116, 4121, and 4122, respectively.
- An analog signal corresponding to the light receiving intensity is output.
- the analog signal is output to the A / D conversion unit 482 via the analog processing unit 420.
- the A / D conversion unit 482 generates a digital signal including waveform data of individual cells by sampling an analog signal at a predetermined rate (step S13).
- the method of generating the waveform data and the digital signal is as described above.
- the processor 4831 takes in the digital signal generated by the A / D conversion unit 482 into the RAM 4834.
- the processor 4831 controls the bus controller 4850, and the digital signal generated by the A / D conversion unit 482 is taken into the RAM 4834 by DMA transfer. By DMA transfer, the digital signal is transferred directly to RAM 4834 without going through the processor 4831.
- the processor 4831 captures the digital signal of the forward scattered light signal, the digital signal of the side scattered light, and the digital signal of the fluorescent signal acquired from the cells contained in the sample to be inspected into the RAM 4834.
- the digital signal is stored in the RAM 4834.
- the processor 4831 uses the deep learning algorithm 60 to execute cell classification based on the waveform data included in the generated digital signal (step S14). The processing of S14 will be described later.
- the processor 4831 transmits the analysis result 83 including the classification information 82 of the individual cells obtained as a result of S14 to the processing unit 300 in association with the identification information of the sample (step S15).
- the analysis result 83 for example, the analysis result 83 of a plurality of cells contained in one sample is associated with the identification information of the sample and sent to the processing unit 300.
- the processor 3001 of the processing unit 300 receives the analysis result 83 from the measurement unit (step S2), the processor 3001 analyzes the analysis result 83 using the program stored in the storage unit 3004 and generates the test result of the sample (step S3). ).
- the processor 3001 acquires the counting result regarding the measurement item according to the measurement channel based on the analysis result 83, and stores it in the storage unit 3004 together with the identification information of the sample.
- the measurement item according to the measurement channel is an item for which the counting result is required by the measurement order.
- the measurement item according to the DIFF channel is the number of leukocyte 5 classifications, that is, monocytes, neutrophils, lymphocytes, eosinophils, and basophils.
- the measurement item according to the RET channel is the number of reticulocytes.
- the measurement item according to PLT-F is the number of platelets.
- the measurement item according to WPC is the number of hematopoietic progenitor cells.
- the measurement item according to WNR is the number of leukocytes and nucleated red blood cells.
- the counting result is not limited to the items for which measurement is required (also referred to as a reportable item) as listed above, and may include counting results of other cells that can be measured by the same measurement channel. For example, if the measurement channel is DIFF, as shown in FIG. 4, in addition to the leukocyte 5 classification, immature granulocytes (IG) and abnormal cells are also included in the counting results. Further, the processor 3001 generates a sample test result by analyzing the obtained counting result and stores it in the storage unit 3004. The analysis of the counting result includes, for example, determining whether the counting result is within the normal value range, no abnormal cells are detected, and whether the deviation from the previous test result is within the allowable range.
- the processor 3001 displays the generated inspection result on the display unit 3015 (step S4).
- the cell classification process in step S14 is a process performed by the processor 4831 according to the operation of the analysis software 4832.
- the processor 4831 transfers the digital signal captured in the RAM 4834 in step S13 to the parallel processing processor 4833 (S101). As shown in FIG. 16, processor 4831 transfers a digital signal from RAM 4834 to RAM 4837 by DMA transfer.
- the processor 4831 controls, for example, the bus controller 4850 to transfer a digital signal from the RAM 4834 to the RAM 4738 by DMA.
- the processor 4831 instructs the parallel processing processor 4833 to execute parallel processing on the waveform data included in the digital signal (S102).
- the processor 4831 instructs the execution of the parallel processing, for example, by calling the kernel function of the parallel processing processor 4833.
- the processing executed by the parallel processing processor 4833 will be described later in the flowchart illustrated in FIG.
- the processor 4831 instructs the parallel processing processor 4833 to execute the matrix operation related to the deep learning algorithm 60, for example.
- the digital signal is decomposed into a plurality of waveform data and sequentially input to the deep learning algorithm 60.
- the index corresponding to each cell contained in the digital signal is not input to the deep learning algorithm 60.
- the waveform data input to the deep learning algorithm 60 is calculated by the parallel processing processor 4833.
- Processor 4831 receives the calculation result executed by the parallel processing processor 4833 (S103).
- the calculation result is DMA-transferred from RAM 4837 to RAM 4834, for example, as shown in FIG.
- the processor 4831 generates an analysis result of the cell type of each measured cell based on the calculation result by the parallel processing processor 4833 (S104).
- FIG. 22 shows an operation example of arithmetic processing of the parallel processing processor 4833 executed based on the instruction of the processor 4831 according to the operation of the analysis software 4832.
- the processor 4831 that executes the analysis software 4832 causes the parallel processing processor 4833 to execute the assignment of arithmetic processing to the arithmetic unit 4836 (S110).
- the processor 4831 causes the parallel processing processor 4833 to execute the assignment of arithmetic processing to the arithmetic unit 4836, for example, by calling the kernel function of the parallel processing processor 4833.
- the matrix operation related to the deep learning algorithm 60 is divided into a plurality of operation processes, and each of the divided operation processes is assigned to the operation unit 4836.
- a plurality of waveform data are sequentially input to the deep learning algorithm 60.
- the matrix operation corresponding to the waveform data is divided into a plurality of arithmetic processes and assigned to the arithmetic unit 4836.
- Each arithmetic processing is processed in parallel by a plurality of arithmetic units 4836 (S111).
- the arithmetic processing is executed for a plurality of waveform data.
- the calculation result generated by being processed in parallel by the plurality of calculation units 4836 is transferred from the RAM 48 37 to the RAM 4834 (S112).
- the calculation result is transferred from RAM 4738 to RAM 4834 by DMA.
- FIG. 23 shows another example of the block diagram of the measurement unit 400.
- the measurement unit 400 shown in FIG. 23 does not include an A / D conversion unit 482, a processor 4831, a RAM 4834, a storage unit 4835, and a parallel processing processor 4833, and is provided with a connection port 4201. It has the same configuration and function as the measurement unit 400 described in FIG. 7 and its related description.
- a connection cable 4202 is connected to the connection port 4201.
- FIG. 24 shows an example of a block diagram of the processing unit 300.
- the processing unit 300 includes a processor 3001, a parallel processing processor 3002, a storage unit 3004, a RAM 3005, an interface unit 3006, an A / D conversion unit 3008, a bus controller 4850, and an interface unit 3009. Is connected to bus 3003. That is, in the example of FIG. 24, the parallel processing processor 3002 is mounted on the cell analyzer 4000 in a form of being incorporated inside the processing unit 300.
- the bus 3003 is, for example, a transmission line having a data transfer speed of several hundred MB / s or more. Bus 3003 may be a transmission line having a data transfer speed of 1 GB / s or more.
- Bus 3003 transfers data based on, for example, PCI-Express or PCI-X standard.
- the configurations of the processor 3001, the parallel processing processor 3002, the storage unit 3004, and the RAM 3005, and the processing executed by them are the processor 4831, the parallel processing processor 4833, the storage unit 4835, and the RAM 4834 described in FIGS. 11 to 19 above. It is the same as the configuration and processing of.
- the A / D conversion unit 3008 samples the analog signal output from the measurement unit 400 as described above, and generates a digital signal including the waveform data of the cells. The method of generating a digital signal is as described above. In the example of FIGS.
- the connection cable 4202 includes, for example, a number of transmission paths corresponding to the type of analog signal transmitted from the measurement unit 400 to the processing unit 300.
- the connection cable 4202 is composed of twisted pair cables and has a number of pairs of wiring corresponding to the type of analog signal transmitted to the processing unit 300.
- the transmission path from the connection port 3007 to the A / D converter 3008 may also have a number of wires corresponding to the type of analog signal transmitted to the processing unit 300.
- an analog signal is transmitted as a differential signal.
- the processor 3001 and the parallel processing processor 3002 have the same configurations and functions as the above-mentioned processor 4831 and parallel processing processor 4833.
- the parallel processing processor 3002 includes a plurality of arithmetic units 3200 and RAM 3201. Analysis software 3100 that analyzes the cell type of the measured cell is executed on the processor 3001.
- the parallel processing processor 3002 does not need to be directly connected to the bus 3003.
- the parallel processing processor 3002 is mounted on a USB device, and the USB device is connected to the bus 3003 via an interface unit (not shown) for processing. It may be mounted on the cell analyzer 4000 as part of the unit 300.
- This USB device may be a small device such as a USB dongle.
- the processing unit 300 is connected to the interface unit 489 of the measurement unit 400 via the interface unit 3006.
- the processing unit 300 transmits control signals of the device mechanism unit 430 and the sample preparation unit 440 to the measurement unit 400 via the interface unit 3006.
- the interface unit 3006 is, for example, a USB interface.
- the processing unit 300 is connected to the interface unit 3006 via the connection port 3007 connected to the A / D conversion unit 3008 and the connection cable 4202 connected to the connection port 3007. It is connected to the connection port 4201 of the measurement unit 400.
- the connection port 4201 is connected to the analog processing unit 420.
- the analog signal output from the connection port 4201 to the processing unit 300 is a signal obtained by processing the output of the FCM detection unit 410 of the measurement unit 400 by the analog processing unit 420.
- the analog processing unit 420 performs processing including noise reduction on the analog signal input from the FCM detection unit 410.
- the analog signal processed by the analog processing unit 420 is transmitted to the processing unit 300 via the connection port 4201 and the connection cable 4202.
- connection cable 4202 is configured, for example, with a length of 1 meter or less in order to reduce noise during signal transmission.
- the analog signal is transmitted to the processing unit 300 as a differential signal, for example, via the connection cable 4202.
- the processing unit 300 may include a plurality of connection ports 3007.
- the processing unit 300 may acquire analog signals from the plurality of measurement units 400 via the plurality of connection ports 3007.
- the analog signal transmitted from the measurement unit 400 via the connection cable 4202 is converted into a digital signal by the A / D conversion unit 3008 of the processing unit 300.
- the A / D converter 3008 for example, as described with reference to FIG. 2, has a predetermined sampling rate (eg, sampling of 1024 points at intervals of 10 nanoseconds, sampling of 128 points at intervals of 80 nanoseconds, or 160.
- the transmitted analog signal is sampled at nanosecond intervals (sampling of 64 points, etc.) to generate waveform data for each cell.
- the waveform data is stored in the storage unit 3004 or the RAM 3005 via the bus 3003.
- the waveform data is transferred to the RAM 3005 by, for example, DMA.
- the processor 3001 and the parallel processing processor 3002 execute arithmetic processing on the waveform data stored in the storage unit 3004 or the RAM 3005.
- the analysis software 3100 operating on the processor 3001 has the same function as the analysis software 4832 shown in FIG. By executing the analysis software 3100, the processor 3001 generates classification information regarding the cell type of the measured cells by the same operation as in FIG. 16, FIG. 17, FIG. 18, FIG. 21, FIG. 22 and the related description thereof. ..
- step S13 digital signal generation
- step S14 cell classification
- step S15 transmission of classification information
- the processor 3001 can process the waveform data and the identification information in association with each other. Specifically, the processor 3001 can associate the analysis result of the waveform data (that is, the classification information regarding the cell type of each cell) with the identification information.
- the identification information includes, for example, (1) identification information of a biological sample corresponding to waveform data, (2) identification information of cells corresponding to waveform data, (3) identification information of a patient corresponding to waveform data, and (4) waveform. Examples include the identification information of the test corresponding to the data, (5) the identification information of the cell analyzer in which the waveform data was measured, and (6) the identification information of the inspection-related facility in which the waveform data was measured.
- the processor 3001 can acquire at least one of the above identification information (1) to (6) or a combination thereof from LIS.
- at least one of (1) to (6) exemplified is associated with the classification information and provided to the user as an inspection result.
- the plurality of combinations of (1) to (6) exemplified may be associated with the classification information and provided to the user as an inspection result.
- FIG. 26 shows another example of the block diagram of the measurement unit 400.
- the measurement unit 400 shown in FIG. 26 does not include a processor 4831, a RAM 4834, a storage unit 4835, and a parallel processing processor 4833, and is an interface for transmitting a digital signal generated by the A / D conversion unit 482 to the processing unit 300. It has the same configuration and function as the measurement unit 400 described in FIGS. 6, 7 and related descriptions, except that the unit 4851 and the transmission line 4852 are provided.
- the interface unit 4851 is, for example, an interface as a dedicated line having a communication band of 1 gigabit / sec or more.
- the interface unit 4851 is an interface compliant with Gigabit Ethernet, USB3.0, or Thunderbolt 3.
- the transmission line 4852 is, for example, a LAN cable.
- the transmission line 4852 is a USB cable compliant with USB3.0.
- the transmission line 4852 is, for example, a dedicated transmission line for transmitting a digital signal between the measurement unit 400 and the processing unit 300.
- FIG. 27 shows another example of the block diagram of the processing unit 300.
- the processing unit 300 shown in FIG. 27 has the processing unit 300 described in FIG. 24 and its related description, except that it does not include the A / D conversion unit 3008 and the connection port 3007, and includes the interface unit 3010. It has a similar configuration and function.
- the processing unit 300 may be connected to a plurality of measurement units 400 via a plurality of interface units 3010 and a plurality of interface units 3006.
- the processor 3001 and the parallel processing processor 3002 have the same configurations and functions as the processor 3001 and the parallel processing processor 3002 described in FIG. 25 and its related description.
- the parallel processing processor 3002 does not necessarily have to be directly connected to the bus 3003, and may be mounted on a USB device, for example, and the USB device may be connected to the bus 3003 via an interface unit (not shown). good.
- This USB device may be a small device such as a USB dongle.
- the analysis software 3100 operating on the processor 3001 has the same function as the analysis software 4832 shown in FIG.
- the analysis software 3100 analyzes the cell type of the measured cell by the same operation as in FIG. 16, FIG. 17, FIG. 18, FIG. 21, FIG. 22 and related descriptions thereof.
- step S14 (cell classification) is performed in the processing unit 300 in the flowchart shown in FIG. 20.
- Step S15 transmission of classification information
- the processing of FIGS. 21 and 22 is performed by the processor 3001 of the processing unit 300 and the parallel processing processor 3002.
- the analog signals (forward scattered light signal, side scattered light signal, side fluorescent signal) of the cells generated by the FCM detection unit 410 are the A / D conversion unit in the measurement unit 400. It is converted into a digital signal at 482.
- the digital signal is sent to the processing unit 300 via the interface unit 484, the bus 485, the interface unit 4851, and the transmission line 4852.
- the transmission line 4852 is a dedicated transmission line for transmitting a digital signal between the measurement unit 400 and the processing unit 300 as described above.
- the measurement unit 400 and the processing unit 300 are connected one-to-one via a transmission line 4852.
- the transmission line 4852 is a transmission line that does not intervene in the transmission of data related to devices other than, for example, the components constituting the cell analyzer 4000 (for example, the measurement unit 400 and the processing unit 300).
- the transmission line 4852 is, for example, a transmission line different from the intranet or the Internet.
- an analysis unit 600 is provided between the measurement unit 400 and the processing unit 300. That is, in the configuration of FIGS. 28, 29, 30, 31, and 32, the cell analyzer 4000 includes a measurement unit 400, a processing unit 300, and an analysis unit 600. The analysis unit 600 analyzes the cell type of the measured cell. As will be described later, in this configuration example, the parallel processing processor 6002 is mounted on the cell analyzer 4000 in a form of being incorporated in the analysis unit 600.
- the configuration of the measurement unit 400 exemplified in FIG. 29 has the same configuration and function as the measurement unit 400 described in FIG. 26 and its related description.
- An analysis unit 600 is provided between the measurement unit 400 and the processing unit 300.
- the analysis unit 600 may be connected to a plurality of measurement units 400.
- the analysis unit 600 may be connected to a plurality of processing units 300.
- the interface unit 4851 is, for example, an interface having a communication band of 1 gigabit / sec or more.
- the interface unit 4851 is an interface compliant with Gigabit Ethernet, USB3.0, or Thunderbolt 3.
- the transmission line 4852 is, for example, a LAN cable.
- the transmission line 4852 is a USB cable compliant with USB3.0.
- the transmission line 4852 is a dedicated transmission line for transmitting a digital signal between the measurement unit 400 and the processing unit 300 as described above.
- the measurement unit 400 and the processing unit 300 are connected one-to-one via a transmission line 4852.
- FIG. 30 shows a configuration example of the analysis unit 600.
- the analysis unit 600 includes, for example, a processor 6001, a parallel processing processor 6002, a bus 6003, a storage unit 6004, a RAM 6005, an interface unit 6006, and an interface unit 6007, which are connected to the bus 6003.
- the bus 6003 is, for example, a transmission line having a data transfer speed of several hundred MB / s or more.
- Bus 3003 may be a transmission line having a data transfer speed of 1 GB / s or more.
- Bus 3003 transfers data based on, for example, PCI-Express or PCI-X standard.
- the analysis unit 600 may be connected to a plurality of measurement units 400 via a plurality of interface units 6006. When a plurality of measurement units 400 are provided, the analysis unit 600 may be connected to each of the measurement units 400 (for example, the plurality of measurement units 400 and the plurality of analysis units 600 are connected one-to-one). Ru).
- the processor 6001 and the parallel processing processor 6002 have the same configurations and functions as the above-mentioned processor 4831 and the parallel processing processor 4833.
- the parallel processing processor 6002 includes a plurality of arithmetic units 6200 and RAM 6201.
- the analysis software 6100 that analyzes the cell type of the measured cell runs on the processor 6001.
- the analysis software 6100 running on the processor 6001 has the same functions as the analysis software 4832 shown in FIG.
- the analysis software 6100 analyzes the cell type of the measured cell by the same operation as in FIG. 16, FIG. 17, FIG. 18, FIG. 21, FIG. 22 and related descriptions thereof.
- the analysis software 6100 transmits the measured cell classification information to the processing unit 300 via the interface unit 6007.
- the interface unit 6007 is, for example, Ethernet (registered trademark) or USB.
- the interface unit 6007 may be an interface capable of wireless communication (for example, WiFi (registered trademark), Bluetooth (registered trademark)).
- FIG. 32 shows a configuration example of the processing unit 300.
- the processing unit 300 shown in FIG. 32 does not have to include the parallel processing processor 3002 like the processing unit 300 shown in FIGS. 24 and 27. Further, the analysis software 3100 shown in FIGS. 24 and 27 may not be running on the processor 3001 shown in FIG. 32.
- the processing unit 300 receives the analysis result by the analysis unit 600 via the interface unit 3006.
- the interface unit 3006 is, for example, Ethernet or USB.
- the interface unit 3006 may be an interface capable of wireless communication (for example, WiFi, Bluetooth).
- the analog signals (forward scattered light signal, side scattered light signal, side fluorescent signal) of the cells generated by the FCM detection unit 410 are in the measurement unit 400. It is converted into a digital signal by the A / D conversion unit 482 of.
- the waveform data is sent to the analysis unit 600 via the interface unit 484, the bus 485, the interface unit 4851, and the transmission line 4852.
- the interface unit 4851 is a dedicated interface for connecting the measurement unit 400 and the analysis unit 600, and connects the measurement unit 400 and the analysis unit 600 on a one-to-one basis.
- the transmission line 4852 is a transmission line that does not intervene in the transmission of data related to devices other than, for example, the components constituting the cell analyzer 4000 (for example, the measurement unit 400 and the processing unit 300).
- Transmission and 4852 are, for example, separate transmission lines from the intranet or the Internet.
- step S14 cell classification
- step S15 transmission of classification information
- the cell analyzer of the configuration example 5 is also configured to include the measurement unit 400, the processing unit 300, and the analysis unit 600, as in the configuration example 4 described above.
- the measurement unit 400 shown in FIG. 33 has the same functions and configurations as the measurement unit 400 described in FIG. 23 and its related description.
- the measurement unit 400 shown in FIG. 33 is connected to the analysis unit 600 via the connection cable 4202.
- the connection cable 4202 is composed of twisted pair cables and has a number of pairs of wiring corresponding to the type of analog signal transmitted to the processing unit 300.
- the connection cable 4202 is configured, for example, with a length of 1 meter or less in order to reduce noise during signal transmission.
- the measurement unit 400 transmits an analog signal to the analysis unit 600 via the connection cable 4202.
- the analysis unit 600 shown in FIG. 34 has the same functions and configurations as the analysis unit 600 described in FIG. 30 and its related description. That is, in the example of FIG. 34, the parallel processing processor 6002 is mounted on the cell analyzer 4000 in a form incorporated in the analysis unit 600.
- the analysis unit 600 shown in FIG. 34 further includes a connection port 6008 and an A / D conversion unit 6009.
- the analog signal transmitted from the analysis unit 600 via the connection cable 4202 is input to the A / D conversion unit 6009 via the connection port 6008.
- the A / D conversion unit 6009 converts an analog signal into a digital signal by the same processing as the A / D conversion unit 482.
- the analysis unit 600 may be connected to a plurality of measurement units 400 via a plurality of connection ports 6008. When a plurality of measurement units 400 are provided, the analysis unit 600 may be connected to each of the measurement units 400 (for example, the plurality of measurement units 400 and the plurality of analysis units 600 are connected one-to-one). Ru).
- the processor 6001 and the parallel processing processor 6002 have the same configurations and functions as the above-mentioned processor 4831 and the parallel processing processor 4833.
- the analysis software 6100 that analyzes the cell type of the measured cell runs on the processor 6001.
- the analysis software 6100 running on the processor 6001 has the same functions as the analysis software 4832 shown in FIG.
- the analysis software 6100 analyzes the cell type of the measured cell by the same operation as in FIG. 16, FIG. 17, FIG. 18, FIG. 21, FIG. 22 and related descriptions thereof.
- the analysis software 6100 transmits the analysis result of the measured cell type of the cell to the processing unit 300 via the interface unit 6007.
- the interface unit 6007 is, for example, Ethernet or USB.
- the interface unit 6007 may be an interface capable of wireless communication (for example, WiFi, Bluetooth).
- step S13 digital signal generation
- step S14 cell classification
- step S15 classification information
- a digital signal is generated (step S13) in the A / D conversion unit 6009 of the analysis unit 600
- cell classification based on the digital signal is performed by the processor 6001 and the parallel processing processor 6002
- the classification information is obtained. It is transmitted from the analysis unit 600 to the processing unit 300 (step S15).
- the processing of FIGS. 21 and 22 is performed by the processor 6001 of the analysis unit 600 and the parallel processing processor 6002.
- the data size of the waveform data and the digital signal will be described.
- the analog signal of forward scattered light (FSC), the analog signal of laterally scattered light (SSC), and the analog signal of lateral fluorescence (SFL) one cell is at regular intervals. Sampling is done at multiple time points. Examples of sampling rates include 1024 point sampling at 10 nanosecond intervals, 128 point sampling at 80 nanosecond intervals, 64 point sampling at 160 nanosecond intervals, and the like.
- the amount of data is, for example, 2 bytes per sampling.
- FSC, SSC, SFL are measured for at least 100 cells.
- FSC, SSC, and SFL may be measured in one measurement, for example, for at least 1000 cells.
- FSC, SSC, and SFL may be measured for, for example, about 10,000 to about 140000 cells in one measurement.
- the capacity of the digital signal is, for example, several hundred megabytes to several gigabytes per sample, and is at least one gigabyte depending on the number of cells, the sampling rate, and the number of measurement channels.
- analysis using the deep learning algorithm 60 inside the cell analyzer 4000 or 4000'as described above is performed.
- the process is complete and no digital signal is transmitted over the internet or intranet to the analytical server installed outside the cell analyzer 4000 or 4000'. Therefore, it is possible to avoid a decrease in processing capacity due to an increase in communication load that occurs when a digital signal is transmitted from the cell analyzer 4000 or 4000'to the analysis server.
- FIG. 35 is an example of a block diagram of the measurement unit 500.
- the measurement unit 500 includes an amplifier circuit 550 and an amplifier circuit 550 that amplify the output signals (output signals amplified by the preamplifier) of the sample distribution unit 501, the sample preparation unit 502, the optical detection unit 505, and the optical detection unit 505.
- Filter circuit 506 that filters the output signal from, A / D converter 507 that converts the output signal (analog signal) of the filter circuit 506 into a digital signal, processor 4831, parallel processing processor 4833, RAM4834, bus controller Includes 4850, storage device 511a, and LAN (Local Area Network) adapter 512.
- the processor 4831, the parallel processing processor 4833, the RAM 4834, the bus controller 4850, the storage device 511a, and the LAN adapter 512 are connected to the bus 508.
- the analysis software based on the deep learning algorithm 60 and the deep learning algorithm 60 is stored in the storage device 511a.
- the processor 4831 performs predetermined arithmetic processing on the digital signal output from the A / D conversion unit 507, as described based on the example of the first cell analyzer 4000.
- Processor 4831 uses the parallel processing processor 4833 to analyze the waveform data.
- the configuration example of the processor 4831 and the parallel processing processor 4833 and the operation of the parallel processing processor 4833 are the same as those in FIGS. 11 to 19 and the related description described above.
- the processing unit 300 is connected to the measurement unit 500 via a LAN cable, for example, via a LAN adapter 512, and the processing unit 300 generates inspection results based on the measurement data acquired by the measurement unit 500. ..
- the optical detection unit 505, the amplifier circuit 550, the filter circuit 506, the A / D conversion unit 507, the processor 4831, the parallel processing processor 4833, and the storage device 511a constitute an optical measurement unit 510 that measures a measurement sample and generates measurement data. is doing.
- FIG. 36 is a diagram showing the configuration of the optical detection unit 505 of the measurement unit 500.
- the condenser lens 552 concentrates the laser light radiated from the semiconductor laser light source 551 as a light source on the flow cell 551, and the condenser lens 554 forward-scatters the forward scattered light emitted from the formed components in the measurement sample. Condenses light on the light receiving unit 555. Further, the other condenser lens 556 concentrates the laterally scattered light and the fluorescence emitted from the formed component on the dichroic mirror 557.
- the dichroic mirror 557 reflects the side-scattered light to the side-scattered light receiving unit 558, and transmits the fluorescence toward the fluorescence light-receiving unit 559. These optical signals reflect the characteristics of the formed components in the measurement sample. Then, the forward scattered light receiving unit 555, the side scattered light receiving unit 558, and the fluorescent light receiving unit 559 convert the optical signal into an electric signal, and output the forward scattered light signal, the side scattered light signal, and the fluorescence signal, respectively. These outputs are amplified by the preamplifier and then used for the next stage processing.
- each of the forward scattered light receiving unit 555, the side scattered light receiving unit 558, and the fluorescent light receiving unit 559 can switch between low-sensitivity output and high-sensitivity output by switching the drive voltage. This sensitivity switching is performed by the processor 4831 described later.
- a photodiode is used as the forward scattered light receiving unit 555, and a photomultiplier tube may be used as the side scattered light receiving unit 558 and the fluorescence receiving unit 55, or the side scattered light receiving unit 558 and A photodiode may be used as the fluorescence light receiving unit 559.
- the fluorescence signal output from the fluorescence light receiving unit 559 is amplified by the preamplifier and then given to the two branching signal channels.
- the two signal channels are connected to the amplifier circuit 550 described above in FIG. 35, respectively.
- the fluorescence input to one signal channel is amplified with high sensitivity by the amplifier circuit 550.
- FIG. 37 is a diagram showing a schematic functional configuration of the sample preparation unit 502 and the optical detection unit 505 shown in FIG. 35.
- the sample distribution unit 501 shown in FIGS. 35 and 37 includes a suction tube 517 and a syringe pump.
- the sample distribution unit 501 sucks the sample (urine or body fluid) 00b through the suction tube 517 and dispenses it to the sample preparation unit 502.
- the sample preparation unit 502 includes a reaction tank 512u and a reaction tank 512b.
- the sample distribution unit 501 distributes the quantified measurement sample to each of the reaction tank 512u and the reaction tank 512b.
- the distributed biological sample is mixed with the first reagent 519u as a diluent and the third reagent 518u containing the dye.
- the formed component in the sample is stained with the dye contained in the third reagent 518u.
- the biological sample is urine
- the sample prepared in this reaction tank 512u is used as a first measurement sample for analyzing relatively large urinary formations such as erythrocytes, leukocytes, epithelial cells, and tumor cells. .
- the sample prepared in the reaction tank 512u is used as a third measurement sample for analyzing red blood cells in the body fluid.
- the distributed biological sample is mixed with the second reagent 519b as a diluent and the fourth reagent 518b containing the dye.
- the second reagent 519b has a hemolytic effect.
- the dye contained in the fourth reagent 518b stains the formed components in the sample.
- the biological sample is urine
- the sample prepared in this reaction tank 512b becomes a second measurement sample for analyzing bacteria in urine.
- the sample prepared in the reaction tank 512b becomes a fourth measurement sample for analyzing nucleated cells (white blood cells and large cells) and bacteria in the body fluid.
- a tube extends from the reaction tank 512u to the flow cell 551 of the optical detection unit 505, and the measurement sample prepared in the reaction tank 512u can be supplied to the flow cell 551.
- a solenoid valve 521u is provided at the outlet of the reaction tank 512u.
- a tube is also extended from the reaction tank 512b, and this tube is connected in the middle of the tube extending from the reaction tank 2u. As a result, the measurement sample prepared in the reaction vessel 512b can be supplied to the flow cell 551. Further, a solenoid valve 521b is provided at the outlet of the reaction tank 512u.
- the tube extending from the reaction tanks 512u and 512b to the flow cell 551 is branched in front of the flow cell 551, and the branch destination is connected to the syringe pump 520a. Further, a solenoid valve 521c is provided between the syringe pump 520a and the branch point.
- the tube is further branched on the way from the connection point of the tube extending from each of the reaction tanks 512u and 512b to the branch point, and the branch destination is connected to the syringe pump 520b. Further, a solenoid valve 521d is provided between the branch point of the tube extending to the syringe pump 520b and the connection point.
- a sheath liquid accommodating unit 522 for accommodating the sheath liquid is connected to the sample preparation unit 502, and this sheath liquid accommodating unit 522 is connected to the flow cell 551 by a tube.
- a compressor 522a is connected to the sheath liquid accommodating portion 522, and when the compressor 522a is driven, compressed air is supplied to the sheath liquid accommodating portion 522, and the sheath liquid is supplied from the sheath liquid accommodating portion 522 to the flow cell 551.
- the two types of suspensions (measurement samples) prepared in each of the reaction tanks 512u and 512b are the suspensions of the reaction tank 512u (the first measurement sample when the biological sample is urine.
- the biological sample is the body fluid.
- the third measurement sample. Is guided to the optical detection unit 505 to form a thin flow wrapped in the sheath liquid in the flow cell 551, and the laser beam is irradiated there.
- the suspension of the reaction tank 512b (the second measurement sample when the biological sample is urine.
- the fourth measurement sample when the biological sample is body fluid) is guided to the optical detection unit 505 and is thin in the flow cell 551. It forms a flow and is irradiated with laser light.
- Such an operation is automatically performed by operating the solenoid valves 521a, 521b, 521c, 521d, the drive unit 503, and the like under the control of the processor 4831 (control unit).
- the first reagent to the fourth reagent will be described in detail.
- the first reagent 519u is a reagent containing a buffer as a main component, and contains an osmotic pressure compensating agent so that a stable fluorescent signal can be obtained without hemolyzing erythrocytes, so that it is suitable for classification measurement.
- the osmotic pressure is adjusted to 100 to 600 mOsm / kg.
- the first reagent 519u preferably does not have a hemolytic effect on red blood cells in urine.
- the second reagent 519b has a hemolytic action unlike the first reagent 519u. This is to enhance the passage of the fourth reagent 518b, which will be described later, to the cell membrane of the bacterium, and to accelerate the staining. It is also to shrink impurities such as mucous threads and red blood cell debris.
- the second reagent 519b contains a surfactant to obtain hemolytic action. Various surfactants such as anions, nonions, and cations are used, but cationic surfactants are particularly suitable. Since the surfactant can damage the cell membrane of the bacterium, the dye contained in the fourth reagent 518b can efficiently stain the nucleic acid of the bacterium. As a result, the measurement of bacteria can be performed in a short time staining process.
- the second reagent 519b may acquire a hemolytic action by being adjusted to an acidity or a low pH instead of a surfactant.
- the low pH means that the pH is lower than that of the first reagent 19u.
- the first reagent 519u is in the range of neutral or weakly acidic to weakly alkaline
- the second reagent 19b is acidic or strongly acidic.
- the pH of the first reagent 519u is 6.0 to 8.0
- the pH of the second reagent 519b is lower than that, preferably 2.0 to 6.0.
- the second reagent 519b may contain a surfactant and may be adjusted to a low pH.
- the second reagent 519b may acquire a hemolytic action by setting the osmotic pressure to be lower than that of the first reagent 19u.
- the first reagent 519u does not contain a surfactant.
- the first reagent 519u may contain a surfactant, but it is necessary to adjust the type and concentration so as not to hemolyze the erythrocytes. Therefore, it is preferable that the first reagent 519u does not contain the same surfactant as the second reagent 519b, or even if it contains the same surfactant, the concentration is lower than that of the second reagent 519b.
- the third reagent 518u is a staining reagent used for measuring urinary formed components (erythrocytes, leukocytes, epithelial cells, cylinders, etc.).
- a dye for film staining is selected in order to stain formed components having no nucleic acid.
- the third reagent 518u preferably contains an osmotic pressure compensating agent for the purpose of preventing erythrocyte hemolysis and for obtaining stable fluorescence intensity, and is adjusted to 100 to 600 mOsm / kg so as to have an osmotic pressure suitable for classification measurement. ing.
- the cell membrane and nucleus (membrane) of the urinary formation are stained with the third reagent 18u.
- a condensed benzene derivative is used as a dyeing reagent containing a dye for film dyeing, and for example, a cyanine dye can be used.
- the third reagent 18u stains not only the cell membrane but also the nuclear membrane.
- the third reagent 518u in nucleated cells such as leukocytes and epithelium, the staining intensity in the cytoplasm (cell membrane) and the staining intensity in the nucleus (nuclear envelope) are combined, and the staining is higher than that in urinary formation without nucleic acid. The strength increases.
- the third reagent the reagent described in JP-A-5891733 can be used. US 5891733 is incorporated herein by reference.
- the third reagent 518u is mixed with urine or body fluid together with the first reagent 519u.
- the fourth reagent 518b is a staining reagent that can accurately measure bacteria even if it is a sample containing impurities of the same size as bacteria and fungi.
- the fourth reagent 518b is described in detail in European Application Publication No. 1136563.
- a dye that stains nucleic acid is preferably used.
- a staining reagent containing a dye for nuclear staining for example, a cyanine-based dye of US Pat. No. 7,309,581 can be used.
- the fourth reagent 518b is mixed with urine or a sample together with the second reagent 519b. Publication No. 1136563 and US Pat. No. 7,309,581 are incorporated herein by reference.
- the third reagent 518u contains a dye that stains the cell membrane
- the fourth reagent 518b contains a dye that stains nucleic acid. Since the urinary formations include those that do not have nuclei such as red blood cells, the third reagent 518u contains a dye that stains the cell membrane, so that those that do not have such nuclei are also included. It is possible to detect urinary formations. Further, since the second reagent can damage the cell membrane of the bacterium, the dye contained in the fourth reagent 18b can efficiently stain the nucleic acid of the bacterium and the fungus. As a result, the measurement of bacteria can be performed in a short time staining process.
- the first waveform data analysis system includes a deep learning device 100A.
- the vendor side device 100 operates as a deep learning device 100A.
- the deep learning device 100A causes the neural network 50 to learn using the training data, and provides the user with the deep learning algorithm 60 trained by the training data.
- the deep learning algorithm 60 composed of the trained neural network is provided from the deep learning device 100A to the measurement unit 400 through the recording medium 98 or the communication network 99.
- the measurement unit 400 analyzes the waveform data of the cell to be analyzed by using the deep learning algorithm 60 composed of the trained neural network.
- the deep learning device 100A is composed of, for example, a general-purpose computer, and performs deep learning processing based on a flowchart described later.
- the measurement unit 400 performs waveform data analysis processing based on a flowchart described later.
- the recording medium 98 is a computer-readable and non-temporary tangible recording medium such as a DVD-ROM or a USB memory.
- the deep learning device 100A is connected to the measurement unit 400a or the measurement unit 500a.
- the configuration of the measuring unit 400a or the measuring unit 500a is the same as that of the measuring unit 400 or the measuring unit 500 described above, respectively.
- the deep learning device 100A acquires waveform data for training acquired by the measurement unit 400a or the measurement unit 500a.
- the method of generating waveform data for training is as described above.
- the measuring unit 400a or the measuring unit 500a includes flow cells 4113 and 551, respectively.
- the measuring unit 400a or the measuring unit 500a sends the biological sample to the flow cells 4113 and 551.
- the biological sample supplied to the flow cells 4113 and 551 is irradiated with light from the light sources 4112 and 553, and the forward scattered light, the lateral scattered light, and the lateral fluorescence emitted from the cells in the biological sample are emitted from the light detection unit (4116). 4121, 4122, 555, 558, 559) are detected.
- the measuring unit 400a or the measuring unit 500a is derived from the forward scattered light signal, the side scattered light signal, and the side fluorescent signal obtained by detecting the light by the light detection unit (4116, 4121, 4122, 555, 558, 559). Waveform data is generated, and the waveform data is transmitted to the vendor side device 100.
- FIG. 39 illustrates a block diagram of the vendor side device 100 (deep learning device 100A).
- the vendor side device 100 includes a processing unit 10 (10A), an input unit 16, and an output unit 17.
- the processing unit 10 transmits data between, for example, a CPU 11 that performs data processing described later, a memory 12 used for a work area for data processing, a storage unit 13 that records a program and processing data described later, and each unit. It includes a bus 14, an interface unit (I / F unit) 15 for inputting / outputting data to / from an external device, and a GPU 19.
- the input unit 16 and the output unit 17 are connected to the processing unit 10 via the interface unit 15.
- the input unit 16 is an input device such as a keyboard or a mouse
- the output unit 17 is a display device such as a liquid crystal display.
- the GPU 19 functions as an accelerator that assists the arithmetic processing (for example, parallel arithmetic processing) performed by the CPU 11.
- the processing performed by the CPU 11 means that the processing performed by the CPU 11 using the GPU 19 as an accelerator is also included.
- the GPU 19 has the same function as the above-mentioned parallel processing processor 4833.
- a chip which is preferable for the calculation of the neural network may be mounted. Examples of such a chip include FPGA, ASIC, Myriad X (Intel) and the like.
- the processing unit 10 stores, for example, an execution format of the deep learning algorithm 50 composed of the program according to the present embodiment and the neural network before training in order to perform the processing of each step described with reference to FIG. 43 below. It is recorded in advance in the unit 13.
- the execution format is, for example, a format generated by being converted by a compiler from a programming language.
- the processing unit 10 uses the program recorded in the storage unit 13 to perform training processing of the neural network 50 before training.
- the processing performed by the processing unit 10 means the processing performed by the CPU 11 based on the program and the neural network 50 stored in the storage unit 13 or the memory 12.
- the CPU 11 temporarily stores necessary data (intermediate data in the middle of processing, etc.) using the memory 12 as a work area, and appropriately records data to be stored for a long period of time, such as a calculation result, in the storage unit 13.
- the configuration of the measurement unit 400 or 500 that processes the waveform data based on the algorithm provided by the vendor-side device 100 is the same as the configuration described above. Further, the measurement unit 400 or 500 may also have the function of the vendor side device 100 (deep learning device 100A) and may train the neural network 50 using the training data. In this case, the vendor side device 100 (deep learning device 100A) becomes unnecessary.
- the measurement unit control unit 480 uses, for example, a deep learning algorithm 60 composed of the program according to the present embodiment and the trained neural network in order to perform the processing of each step described in the following waveform data analysis processing. It is recorded in advance in the storage unit 4835 in an execution format.
- the execution format is, for example, a format generated by being converted by a compiler from a programming language.
- the measurement unit control unit 480 performs processing using the program recorded in the storage unit 4835 and the deep learning algorithm 60.
- the measurement unit control unit 480 may update the program and the deep learning algorithm 60 recorded in the storage unit 4835 via, for example, the LAN adapter 481 and the communication network.
- the above-mentioned analysis unit 600 may transmit the digital signal received from the measurement unit 400 and the analysis result to the deep learning device 100A via the interface unit 6011.
- the analysis unit 600 transmits waveform data and classification information corresponding to the waveform data to the deep learning device 100A via the Internet, for example.
- the deep learning device 100A performs learning processing based on the waveform data transmitted from the analysis unit 600 and the classification information corresponding to the waveform data, and updates the deep learning algorithm 60.
- the deep learning device 100A transmits the updated deep learning algorithm 60 to the analysis unit 600.
- the analysis unit 600 updates the algorithm stored in the storage unit 6004 by the deep learning algorithm 60 transmitted from the deep learning device 100A. For example, the analysis unit 600 transmits the waveform data to the deep learning device 100A in parallel while the waveform data transmitted from the measurement unit 400 is being processed by the processor 6001 and the parallel processing processor 6002. The analysis unit 600 transmits the classification information to the deep learning device 100A as soon as the analysis of the waveform data, that is, the generation of the classification information is completed.
- the processing performed by the measurement unit control unit 480 is actually based on the program stored in the storage unit 4835 or the RAM 4834 and the deep learning algorithm 60, and is actually the processor 4831 and the parallel processing processor 4833. Means the processing performed by.
- the processor 4831 temporarily stores necessary data (intermediate data during processing, measurement results, analysis results, etc.) using the RAM 4834 as a work area, and appropriately records data to be stored for a long period of time such as calculation results in the storage unit 4835.
- FIG. 42 shows an example of a functional block of the deep learning device 100A that performs deep learning.
- the processing unit 10A of the deep learning device 100A includes a training data generation unit 101, a training data input unit 102, and an algorithm update unit 103.
- These functional blocks are realized by installing a program for causing a computer to execute a deep learning process in the storage unit 13 or the memory 12 of the processing unit 10A shown in FIG. 39, and executing this program by the CPU 11 and the GPU 19.
- the training data database (DB) 104 and the algorithm database (DB) 105 are recorded in the storage unit 13 or the memory 12 of the processing unit 10A.
- the training waveform data 76a, 76b, 76c are acquired in advance by, for example, the measurement units 400 and 500, and are stored in advance in the storage unit 13 or the memory 12 of the processing unit 10A.
- the deep learning algorithm 50 is stored in the algorithm database 105 in advance.
- the processing unit 10A of the deep learning device 100A performs the processing shown in FIG. 43.
- the training data generation unit 101 performs the processing of steps S211, S214 and S216 shown in FIG. 43.
- the training data input unit 102 performs the processing of step S212.
- the processing of steps S213 and S215 is performed by the algorithm update unit 103.
- the processing unit 10A acquires training waveform data 72a, 72b, 72c.
- the training waveform data 72a is the waveform data of the forward scattered light
- the waveform data 72b for training is the waveform data of the side scattered light
- the waveform data 72c for training is the waveform data of the lateral fluorescence.
- the acquisition of the waveform data 72a, 72b, 72c for training is, for example, by the operation of the operator, whether it is fetched from the measurement units 400, 500, from the recording medium 98, or via the I / F unit 15 via the communication network. It is done.
- the training waveform data 72a, 72b, 72c When the training waveform data 72a, 72b, 72c are acquired, information on which cell type the training waveform data 72a, 72b, 72c indicates is also acquired.
- the information indicating which cell type is indicated is associated with the training waveform data 72a, 72b, 72c, and may be input by the operator from the input unit 16.
- step S211th the processing unit 10A generates training data 75 from the acquired waveform data 72a, 72b, 72c and the label value 77.
- step S212 the processing unit 10A inputs the training data 75 to the neural network 50 and acquires the trial result.
- the trial result is accumulated every time a plurality of training data 75 are input to the neural network 50.
- step S213 the processing unit 10A uses a predetermined number of trial results. Judge whether or not is accumulated. When the trial result is accumulated a predetermined number of times (YES), the processing unit 10A proceeds to the process of step S214, and when the trial result is not accumulated a predetermined number of times (NO), the processing unit 10A proceeds to the process of step S215. Proceed to processing.
- step S214 the processing unit 10A updates the connection weight w of the neural network 50 using the training results accumulated in step S212.
- the connection weight w of the neural network 50 is updated at the stage where the trial results for a predetermined number of times are accumulated.
- the process of updating the bond weight w is specifically a process of performing a calculation by the gradient descent method shown in (Equation 12) and (Equation 13) described later.
- step S215 the processing unit 10A determines whether or not the neural network 50 has been trained with the specified number of training data 75. When the training is performed with the specified number of training data 75 (YES), the deep learning process is terminated.
- the processing unit 10A proceeds from step S215 to step S216, and processes the next training waveform data from step S211 to step S215. I do.
- the neural network 50 is trained to obtain the deep learning algorithm 60.
- the structure of the neural network 50 is illustrated in FIG. 44 (a).
- the neural network 50 includes an input layer 50a, an output layer 50b, and an intermediate layer 50c between the input layer 50a and the output layer 50b, and the intermediate layer 50c is composed of a plurality of layers.
- the number of layers constituting the intermediate layer 50c can be, for example, 5 layers or more, preferably 50 layers or more, and more preferably 100 layers or more.
- a plurality of nodes 89 arranged in a layer are connected between layers.
- the information propagates from the input side layer 50a to the output side layer 50b in only one direction indicated by the arrow D in the figure.
- FIG. 44 (b) is a schematic diagram showing operations at each node.
- Each node 89 receives a plurality of inputs and calculates one output (z).
- the node 89 receives four inputs.
- the total input (u) received by the node 89 is represented by the following (Equation 2) as an example.
- one-dimensional matrix data is used as the training data 75 and the analysis data 85. Therefore, when the variable of the arithmetic expression corresponds to the two-dimensional matrix data, the variable is the one-dimensional matrix data. Performs the conversion process to correspond to.
- Each input is weighted differently.
- b is a value called bias.
- the output (z) of the node is the output of the predetermined function f with respect to the total input (u) represented by (Equation 2), and is represented by the following (Equation 3).
- the function f is called an activation function.
- FIG. 44 (c) is a schematic diagram showing operations between nodes.
- the nodes that output the result (z) represented by (Equation 3) are arranged in layers for the total input (u) of each node 89 represented by (Equation 2). ..
- the output of the node of the previous layer becomes the input of the node of the next layer.
- the output of the node 89a in the layer on the left side in the figure is the input of the node 89b in the layer on the right side in the figure.
- Each node 89b receives an output from the node 89a, respectively.
- Each connection between each node 89a and each node 89b is weighted differently.
- the outputs of the plurality of nodes 89a are x1 to x4
- the inputs to each of the three nodes 89b are represented by the following (Equation 4-1) to (Equation 4-3).
- the generalization of these (Equation 4-1) to (Equation 4-3) is (Equation 4-4).
- i 1, ... I
- j 1, ...
- the function expressed by using the neural network is y (x: w)
- the function y (x: w) changes when the parameter w of the neural network is changed. Adjusting the function y (x: w) so that the neural network selects a more suitable parameter w for the input x is called neural network training or learning.
- a plurality of sets of inputs and outputs of a function expressed using a neural network are given. Assuming that the desired output for a given input x is d, the set of inputs and outputs is given ⁇ (x1, d1), (x2, d2), ..., (Xn, dn) ⁇ .
- the set of each set represented by (x, d) is called training data.
- the set of waveform data forward scattered light waveform data, side scattered light waveform data, fluorescence waveform data
- FIG. 3 is the training data shown in FIG.
- Neural network learning means that the output y (xn: w) of the neural network when the input xn is given is as close as possible to the output dn for any set of input / output (xn, dn). It means adjusting the weight w.
- the error function is the closeness of the training data to the function expressed using the neural network. It is a scale to measure. The error function is also called the loss function.
- the error function E (w) used in the cell type analysis method according to the embodiment is represented by the following (Equation 7). (Equation 7) is called cross entropy. The method of calculating the cross entropy of (Equation 7) will be described.
- an activation function for classifying the input x into a finite number of classes according to the content is used.
- the output yK (that is, uk (L) ) of the node k of the output layer L represents the probability that the given input x belongs to the class CK.
- the input x is classified into the class having the maximum probability expressed by (Equation 9).
- the function represented by the neural network is regarded as a model of the posterior probability of each class, and the likelihood of the weight w with respect to the training data is calculated under such a probability model. Evaluate and select a weight w that maximizes the likelihood.
- the target output dn by the softmax function of (Equation 8) is set to 1 only when the output is a correct class, and is set to 0 when the output is not.
- the posterior distribution is expressed by the following (Equation 10).
- the error function of (Equation 7) is derived.
- Learning means minimizing the error function E (w) calculated based on the training data with respect to the neural network parameter w.
- the error function E (w) is represented by (Equation 7).
- Minimizing the error function E (w) with respect to the parameter w has the same meaning as finding the local minimum point of the function E (w).
- the parameter w is the weight of the connection between the nodes.
- the minimum point of the weight w is obtained by an iterative calculation in which the parameter w is repeatedly updated starting from an arbitrary initial value.
- An example of such a calculation is the gradient descent method.
- Equation 12 the vector represented by the following (Equation 12) is used.
- the process of moving the value of the current parameter w in the negative gradient direction that is, ⁇ E
- the operation by the gradient descent method is expressed by the following (Equation 13).
- the value t means the number of times the parameter w is moved.
- symbol I is a constant that determines the magnitude of the update amount of the parameter w, and is called a learning coefficient.
- the gradient descent method performed only for some training data is called the stochastic gradient descent method.
- a stochastic gradient descent method is used.
- waveform data of cells in blood collected from 8 healthy subjects were pooled as digital signals.
- Neutrophils NEUT
- lymphocytes LYMPH
- monocytes MONO
- EO eosinophil
- BASO basophils
- IG immature granulocytes
- Classification was performed manually, and each waveform data was annotated (labeled) by cell type.
- the time when the signal intensity of the forward scattered light exceeded the threshold was set as the measurement start time, and the acquisition time of the waveform data of the forward scattered light, the side scattered light, and the side fluorescence was synchronized to generate the training data.
- the control blood was also annotated with control blood-derived cells (CONT). Training data was input to the deep learning algorithm and trained.
- waveform data for analysis was acquired by Sysmex XN-1000 in the same manner as the training data. Waveform data derived from control blood was mixed to create analytical data. This analysis data was input to the constructed deep learning algorithm, and data for each cell type was acquired.
- the result is shown in FIG. 45 as a mixed matrix.
- the horizontal axis shows the judgment result by the deep learning algorithm constructed, and the vertical axis shows the judgment result by human (reference method).
- the judgment result by the constructed deep learning algorithm showed a concordance rate of 98.8% with the judgment result by the reference method, although there was some confusion between basophils and lymphocytes and between basophils and ghosts. ..
- FIG. 46 (a) is a neutrophil
- FIG. 46 (b) is a lymphocyte
- FIG. 46 (c) is a monocyte
- FIG. 47 (a) is a neutrophil
- FIG. 47 (b) is favorable.
- the base sphere, FIG. 47 (c) shows the ROC curve of control blood (CONT).
- Sensitivity and specificity were 99.5% and 99.6% for neutrophils, 99.4% and 99.5% for lymphocytes, and 98.5% and 99.9% for monocytes, respectively.
- Acid spheres were 97.9% and 99.8%
- basophils were 71.0% and 81.4%, respectively
- control blood (CONT) was 99.8% and 99.6%, all of which were good. Showed good results.
- the third cell analyzer 4000'' which is an image analyzer, estimates the cell type of the imaged cell by analyzing the captured image data.
- FIG. 48 shows a configuration example of the cell analyzer 4000''.
- the cell analyzer 4000'' shown in FIG. 48 includes a measurement unit 700 and a treatment unit 800, and measures and analyzes a sample 901 prepared by pretreatment by the pretreatment device 900.
- the measuring unit 700 includes a flow cell 710, a light source 720 to 723, a condenser lens 730 to 733, a dichroic mirror 740 to 741, a condenser lens 750, an optical unit 751, a condenser lens 752, and an image pickup unit 760. And have.
- the sample 701 is flowed through the flow path 711 of the flow cell 710.
- the light sources 720 to 723 irradiate the sample 701 flowing through the flow cell 710 with light.
- the light sources 720 to 723 are composed of, for example, a semiconductor laser light source. Light having wavelengths ⁇ 11 to ⁇ 14 is emitted from the light sources 720 to 723, respectively.
- the condenser lenses 730 to 733 concentrate the light having wavelengths ⁇ 11 to ⁇ 14 emitted from the light sources 720 to 723, respectively.
- the dichroic mirror 740 transmits light of wavelength ⁇ 11 and refracts light of wavelength ⁇ 12.
- the dichroic mirror 741 transmits light having wavelengths ⁇ 11 and ⁇ 12 and refracts light having wavelength ⁇ 13.
- the number of semiconductor laser light sources included in the measurement unit 700 is not limited as long as it is 1 or more.
- the number of semiconductor laser light sources can be selected from, for example, 1, 2, 3, 4, 5 or 6.
- the condenser lens 750 collects the fluorescence generated from the sample 701 flowing through the flow path 711 of the flow cell 710 and the transmitted light transmitted through the sample 701 flowing through the flow path 711 of the flow cell 710.
- the optical unit 751 has, for example, a configuration in which four dichroic mirrors are combined. The four dichroic mirrors of the optical unit 751 reflect fluorescence and transmitted light at slightly different angles and separate them on the light receiving surface of the image pickup unit 760.
- the condenser lens 752 collects fluorescence and transmitted light.
- the image pickup unit 760 is composed of a TDI (Time Delay Integration) camera.
- the imaging unit 760 can image fluorescence and transmitted light, and output a fluorescent image corresponding to fluorescence and a bright field image corresponding to transmitted light to the processing unit 800 as an imaging signal.
- TDI Time Delay Integration
- the processing unit 800 includes a processing unit 811, a storage unit 812, an interface unit 816, and a bus 815 as hardware configurations.
- the processing unit 811, the storage unit 812, and the interface unit 816 are connected to the bus 815.
- Image data (for example, a fluorescent image or a bright field image) composed of an image pickup signal captured by the image pickup unit 760 of the measurement unit 700 is stored in the storage unit 812 via the interface unit 816.
- the processing unit 811 reads the image data from the storage unit 812 and analyzes the image data.
- FIG. 49 shows a configuration example of the processing unit 811.
- the processing unit 811 includes, for example, a processor 8111, a parallel processing processor 8112, and a RAM 8113.
- the processor 8111, the parallel processing processor 8112, and the RAM 8113 have the same configurations and functions as the above-mentioned processor 4831, parallel processing processor 4833, and RAM 4834, respectively.
- the image data captured by the image pickup unit 760 is analyzed by the processor 8111 and the parallel processing processor 8112.
- the parallel processing processor 8112 executes arithmetic processing of matrix data related to image data in parallel by a plurality of arithmetic units, for example, by the processing exemplified in FIGS. 16, 17 and 18.
- processing unit 811 (processor 8111, parallel processing processor 8112, RAM 8113) do not necessarily have to be provided in the processing unit 800, but may be provided in the measurement unit 700.
- the training image used for training the deep learning algorithm is preferably captured in RGB color, CMY color, or the like.
- the shade or brightness of each primary color such as red, green and blue or cyan, magenta, and yellow is represented by a 24-bit value (8 bits x 3 colors).
- the training image may include at least one hue and a shade or brightness of that hue, but more preferably include at least two hues and a shade or brightness of the hue, respectively.
- Information including a hue and the shade or brightness of the hue is also referred to as a color tone.
- the color tone information of each pixel in the training image is converted from, for example, RGB color to a format including luminance information and hue information.
- a format including luminance information and hue information YUV (YCbCr, YPbPr, YIQ, etc.) and the like can be mentioned.
- conversion to the YCbCr format will be described as an example.
- the training image captured in RGB color is converted into image data based on brightness, image data based on the first hue (for example, blue system), and image data based on the second hue (for example, red system), respectively. ..
- the conversion from RGB to YCbCr can be performed by a known method. For example, from RGB to YCbCr, the international standard ITU-R BT.
- the image data based on the brightness, the image data based on the first hue, and the image data based on the second hue can be represented as gradation value matrix data as shown in FIG. 50 (hereinafter, color tone matrix data 72y, Also referred to as 72kb and 72cr).
- the image data based on the luminance, the image data based on the first hue, and the image data based on the second hue are represented by, for example, 256 gradations from 0 to 255 gradations, respectively.
- the training image is converted with the three primary colors of red R, green G, and blue B, and the three primary colors of cyan C, magenta M, and yellow Y, instead of the brightness, the first hue, and the second hue. You may.
- the color tone vector data 74 is generated by combining the three gradation values of the luminance 72y, the first hue 72cc, and the second hue 72cr for each pixel. ..
- each color tone vector data 74 generated from the training image has a label value indicating that the lobation nucleus neutrophil is a lobation nucleus neutrophil. "1" is given as 77, and the training data becomes 75.
- the training data 75 is represented by 3 pixels ⁇ 3 pixels for convenience, but in reality, there is color tone vector data for each pixel when the training image is captured.
- FIG. 51 shows an example of the label value 77.
- a different label value 77 is given depending on the cell type and the presence or absence of the characteristics of each cell.
- the neural network 50 is preferably a convolutional neural network.
- the number of nodes of the input layer 50a in the neural network 50 is the number of pixels of the input training data 75 and the number of brightness and hue contained in the image (for example, in the above example, the brightness 72y, the first hue 72cc, and the second hue). It corresponds to the product with 3) of hue 72cr.
- the color tone vector data 74 is input to the input layer 50a of the neural network 50 as a set 76 thereof.
- the neural network 50 is trained by using the label value 77 of each pixel of the training data 75 as the output layer 50b of the neural network.
- the neural network 50 extracts feature quantities for morphological cell types and cell characteristics based on the training data 75.
- the output layer 50b of the neural network outputs a result reflecting these features.
- Reference numeral 50c in FIG. 50 indicates an intermediate layer.
- the deep learning algorithm 60 having the neural network 60 thus trained is to identify which of the plurality of cell types belonging to a predetermined cell group and morphologically classified corresponds to the cell to be analyzed. Used as a classifier.
- FIG. 52 shows an example of an image analysis method.
- analysis data 81 is generated from an analysis image obtained by imaging a cell to be analyzed.
- the analysis image is an image of the cells to be analyzed.
- the image pickup in the image pickup apparatus is performed in RGB color, CMY color, or the like.
- the shade or brightness of each primary color such as red, green and blue or cyan, magenta, and yellow is represented by a 24-bit value (8 bits x 3 colors).
- the image for analysis may include at least one hue and a shade or brightness of the hue, but more preferably contains at least two hues and a shade or brightness of the hue, respectively.
- Information including a hue and the shade or brightness of the hue is also referred to as a color tone.
- RGB color training image is converted into image data based on brightness, image data based on a first hue (for example, blue system), and image data based on a second hue (for example, red system).
- the conversion from RGB to YCbCr can be performed by a known method. For example, from RGB to YCbCr, the international standard ITU-R BT. It can be converted according to 601.
- the image data corresponding to each of the brightness, the first hue, and the second hue can be represented as matrix data of gradation values as shown in FIG. 52 (hereinafter, also referred to as color tone matrix data 79y, 79cc, 79cr). say).
- Luminance, first hue and second hue 72Cr are represented by 256 gradations from 0 to 255, respectively.
- the training image is converted with the three primary colors of red R, green G, and blue B, and the three primary colors of cyan C, magenta M, and yellow Y. You may.
- the color tone vector data 80 is generated by combining the three gradation values of the luminance 79y, the first hue 79cc, and the second hue 79cr for each pixel.
- a set of color tone vector data 80 generated from one analysis image is generated as analysis data 81.
- the imaging conditions and the generation conditions of the vector data input from each image to the neural network are the same.
- the analysis data 81 is input to the input layer 60a of the neural network 60 constituting the trained deep learning algorithm 60.
- the deep learning algorithm extracts a feature amount from the analysis data 81 and outputs the result from the output layer 60b of the neural network 60.
- the value output from the output layer 60b is the probability that the cells to be analyzed included in the analysis image belong to each of the morphological cell classifications and characteristics input as training data.
- the value is output.
- the label value itself or data in which the label value is replaced with information indicating the presence or absence of morphological cell type or cell characteristics (for example, terms, etc.) is output as the analysis result 83 regarding the cell morphology.
- the label value “1” is output from the analysis data 81 as the most likely label value 82 by the discriminator, and the character data “lobation nucleus neutrophil” corresponding to this label value is the cell data. It is output as the analysis result 83 regarding the morphology.
- Reference numeral 60c in FIG. 52 indicates an intermediate layer.
- each functional block of the training data generation unit 101, the training data input unit 102, the algorithm update unit 103, the analysis data generation unit 201, the analysis data input unit 202, and the analysis unit 203 is a single processor 4831. And run on a single parallel processor 4833, but each of these functional blocks does not necessarily have to be run on a single processor and a parallel processor, but is distributed across multiple processors and multiple parallel processors. It may be executed.
- a program for performing the processing of each step described with reference to FIG. 43 is recorded in advance in the storage unit 4835.
- the program may be installed on the measurement unit control unit 480 from a computer-readable, non-temporary tangible recording medium 98, such as a DVD-ROM or USB memory.
- the measurement unit control unit 480 may be connected to the communication network 99, and a program may be downloaded and installed from, for example, an external server (not shown) via the communication network 99.
- FIG. 53 shows an embodiment of the analysis result.
- FIG. 53 shows the cell types with the label values shown in FIG. 4 and the cell numbers of each cell number type contained in the biological sample measured by flow cytometry. Instead of displaying the number of cells, or together with the display of the number of cells, the ratio (for example,%) of each cell type to the total number of counted cells may be output.
- the cell number count can be obtained by coefficienting the number of label values (the number of the same label values) corresponding to each output cell type.
- a warning indicating that the biological sample contains abnormal cells may be output in the output result.
- FIG. 53 shows an example in which an exclamation mark is attached to the section of abnormal cells as a warning, but the present invention is not limited to this.
- the distribution of each cell tumor may be scattergrammed and output.
- the highest value when the signal intensity is acquired can be plotted with, for example, the lateral fluorescence intensity on the vertical axis and the lateral scattered light intensity on the horizontal axis.
Landscapes
- Chemical & Material Sciences (AREA)
- General Physics & Mathematics (AREA)
- Pathology (AREA)
- Health & Medical Sciences (AREA)
- Life Sciences & Earth Sciences (AREA)
- Analytical Chemistry (AREA)
- Biochemistry (AREA)
- General Health & Medical Sciences (AREA)
- Dispersion Chemistry (AREA)
- Physics & Mathematics (AREA)
- Immunology (AREA)
- Engineering & Computer Science (AREA)
- Signal Processing (AREA)
- Investigating Or Analysing Biological Materials (AREA)
- Medical Treatment And Welfare Office Work (AREA)
- Apparatus Associated With Microorganisms And Enzymes (AREA)
- Measuring Or Testing Involving Enzymes Or Micro-Organisms (AREA)
- Investigating, Analyzing Materials By Fluorescence Or Luminescence (AREA)
- Automatic Analysis And Handling Materials Therefor (AREA)
Abstract
Description
本実施形態は、ホストプロセッサと、並列処理プロセッサとを含む細胞分析装置において、前記ホストプロセッサによる制御に基づいて細胞の各々に関するデータを取得し、前記並列処理プロセッサで前記データに関する並列処理を実行し、前記並列処理の結果に基づき、前記細胞の各々について細胞種別に関する情報を生成する、ことを含む細胞分析方法を開示する。
次に、図2、図3~図5に示す例を用いて訓練データ75の生成方法及び波形データの分析方法を説明する。
図2は、本分析方法において用いられる波形データを説明するための模式図である。図2(a)に示すように、細胞Cを含む検体をフローセルFCに流し、フローセルFCを流れる細胞Cに光を照射すると、光の進行方向に対して前方に前方散乱光FSCが生じる。同様に、光の進行方向に対して側方に側方散乱光SSCと側方蛍光SFLが生じる。前方散乱光は、第1受光部D1によって受光され、受光量に応じた信号が出力される。側方散乱光は、第2受光部D2によって受光され、受光量に応じた信号が出力される。側方蛍光は、第3受光部D3によって受光され、受光量に応じた信号が出力される。これにより、受光部D1~D3から、時間経過に伴う信号の変化を表すアナログ信号が出力される。前方散乱光に対応するアナログ信号を「前方散乱光信号」、側方散乱光に対応するアナログ信号を「側方散乱光信号」、側方蛍光に対応するアナログ信号を「蛍光信号」という。各アナログ信号の1つのパルスが一つの細胞に対応する。
図3は、細胞の種別を判定するための深層学習アルゴリズムを訓練するために使用される訓練データの生成方法の一例を示す模式図である。訓練データ75は、検体をフローサイトメータによって測定し、検体に含まれる細胞について得られた前方散乱光(FSC)のアナログ信号70a、側方散乱光(SSC)のアナログ信号70b、及び側方蛍光(SFL)のアナログ信号70cに基づいて生成される波形データである。波形データの取得方法は、上述のとおりである。
図3を例として、ニューラルネットワークの訓練の概要を説明する。ニューラルネットワーク50は、畳み込み層を有する畳み込みニューラルネットワークであることが好ましい。ニューラルネットワーク50における入力層50aのノード数は、入力される訓練データ75の波形データに含まれる配列の要素数に対応している。配列の要素数は、1つの細胞に対応する前方散乱光、側方散乱光、側方蛍光の波形データ72a、72b、72cの要素数の総和に等しい。図3の例では、波形データ72a、72b、72cのそれぞれが1024個の要素を含んでいるため、入力層50aのノード数は、1024×3=3072個となる。波形データ72a、72b、72cは、ニューラルネットワーク50の入力層50aに入力される。訓練データ75の各波形データのラベル値77は、ニューラルネットワークの出力層50bに入力され、ニューラルネットワーク50を訓練する。図3の符号50cは、中間層を示す。
図5に分析対象である細胞の波形データを分析する方法の例を示す。波形データの分析方法では、分析対象の細胞からフローサイトメータによって取得した前方散乱光のアナログ信号80a、側方散乱光のアナログ信号80b、及び側方蛍光のアナログ信号80cから、上述の方法によって得られる波形データからなる分析データ85が生成される。
本実施形態の細胞の波形データ、またはその元となる細胞のアナログ信号は、第1の細胞分析装置4000又は第2の細胞分析装置4000’において取得され得る。図6の(a)は、細胞分析装置4000の外観の例を示す。図6の(b)は、細胞分析装置4000’の外観の例を示す。図6の(a)において、細胞分析装置4000は、測定ユニット400と、測定ユニット400における試料の測定条件の設定や測定を制御したり、深層学習アルゴリズム60による細胞のデータの分析結果を分析するための処理ユニット300を備える。図6の(b)において、細胞分析装置4000’は、測定ユニット500と、測定ユニット500における試料の測定条件の設定や測定を制御したり、深層学習アルゴリズム60による細胞のデータの分析結果を分析するための処理ユニット300を備える。測定ユニット400、500と処理ユニット300は相互に通信可能に有線、又は無線で接続されうる。以下に、測定ユニット400、500の構成例を示すが、本実施形態は、以下の例示に限定されて解釈されるものではない。処理ユニット300は、後述するベンダ側装置100と共用されてもよい。
(測定ユニット及び処理ユニットの構成)
測定ユニット400が、血液試料中の細胞を検出するためのフローサイトメータであるFCM検出部を備える血液分析装置、より具体的には血球計数装置である場合の構成例を説明する。
図7から図19を参照し、測定ユニット400及び処理ユニット300の構成例を説明する。図7は、測定ユニット400のブロック図の例を示す。図7に示されるように、測定ユニット400は、血球を検出するFCM検出部410、FCM検出部410から出力されるアナログ信号を処理するアナログ処理部420、測定ユニット制御部480、試料調製部440、装置機構部430及び検体吸引部450を備えている。
7、Ryzen 5、Ryzen 3などを用いてもよい。

図20~図22を参照し、細胞分析装置4000による検体の分析動作を説明する。
図23及び図24を参照し、測定ユニット400及び処理ユニット300によって構成される細胞分析装置4000の他の構成例を説明する。本構成例では、並列処理プロセッサは、処理ユニット300に設けられる。
図26及び図27を参照し、測定ユニット400及び処理ユニット300によって構成される細胞分析装置4000の他の構成例を説明する。本構成例においても、並列処理プロセッサ3002は、処理ユニット300の内部に組み込まれる形で細胞分析装置4000に搭載される。
図28、図29、図30、図31、及び図32を参照し、細胞分析装置4000の他の構成例を説明する。
図28、図33および図34を参照し、細胞分析装置4000の他の構成例を説明する。この構成例5の細胞分析装置も、前述の構成例4と同様、測定ユニット400と、処理ユニット300と、解析ユニット600を備えて構成される。
図33に示される測定ユニット400は、図23およびその関連記載で説明された測定ユニット400と同様の機能及び構成を備える。図33に示される測定ユニット400は、接続ケーブル4202を介して、解析ユニット600と接続される。例えば、接続ケーブル4202は、ツイストペアケーブルで構成され、処理ユニット300に伝送されるアナログ信号の種類に対応する数のペア数の配線を有する。接続ケーブル4202は、信号伝送中のノイズ低減のため、例えば、1メートル又はそれ以下の長さで構成される。測定ユニット400は、接続ケーブル4202を介して、解析ユニット600にアナログ信号を伝送する。
次に、波形データ及びデジタル信号のデータサイズについて説明する。本実施形態では、例えば、前方散乱光のアナログ信号(FSC)、側方散乱光のアナログ信号(SSC)、側方蛍光のアナログ信号(SFL)のそれぞれに対して、1つの細胞について一定間隔で複数の時点においてサンプリングが行われる。サンプリングレートの例は、10ナノ秒間隔で1024ポイントのサンプリング、80ナノ秒間隔で128ポイントのサンプリング、又は160ナノ秒間隔で64ポイントのサンプリング等を挙げることができる。データ量は、例えば、1サンプリングあたり2バイトとなる。FSC、SSC、SFLの各々について、サンプリングレートに応じた量のデータ(1024ポイントのレートの場合、2バイト×1024=2048バイト)が取得される。このデータ量は、一つの細胞あたりのデータ量である。1回の測定で、例えば、少なくとも100個の細胞について、FSC、SSC、SFLが測定される。また、1回の測定で、例えば、少なくとも1000個の細胞について、FSC、SSC、SFLが測定されることもある。また、1回の測定で、例えば、約10000個~約140000個の細胞について、FSC、SSC、SFLが測定されることもある。よって、例えば、1回の測定で計測される細胞数が100000個で、サンプリングレートが1024の場合、FSC、SSC、SFLの各々のデジタル信号のデータ量は、2バイト×1024×100000=204,800,000バイトとなり、FSC、SSC、SFLの合計で、614,400,000バイトとなる。
第2の細胞分析装置4000’の構成例として、測定ユニット500が尿試料又は体液試料を測定するためのフローサイトメータを備える尿中有形成分分析装置または体液分析装置である場合のブロック図の例を示す。
図37は、図35にて示した試料調製部502及び光学検出部505の概略機能構成を示す図である。図35及び図37に示した検体分配部501は、吸引管517とシリンジポンプとを備える。検体分配部501は、検体(尿又は体液)00bを、吸引管517を介して吸引し、試料調製部502へ分注する。試料調製部502は、反応槽512uと反応槽512bとを備えている。検体分配部501は、反応槽512u及び反応槽512bのそれぞれに定量された測定試料を分配する。
<第1の波形データ分析システムの構成>
他の実施形態は、波形データ分析システムに関する。図38を参照すると、第1の波形データ分析システムは、深層学習装置100Aを備える。ベンダ側装置100は深層学習装置100Aとして動作する。深層学習装置100Aは、ニューラルネットワーク50に訓練データを使って学習させ、訓練データによって訓練された深層学習アルゴリズム60をユーザに提供する。学習済みのニューラルネットワークから構成される深層学習アルゴリズム60は、記録媒体98又は通信ネットワーク99を通じて、深層学習装置100Aから測定ユニット400に提供される。測定ユニット400は、学習済みのニューラルネットワークから構成される深層学習アルゴリズム60を用いて分析対象の細胞の波形データの分析を行う。
図39に、ベンダ側装置100(深層学習装置100A)のブロック図を例示する。ベンダ側装置100は、処理部10(10A)と、入力部16と、出力部17とを備える。
ベンダ側装置100から提供されたアルゴリズムに基づいて波形データを処理する測定ユニット400又は500の構成は、上述の構成と同等である。また、測定ユニット400又は500は、ベンダ側装置100(深層学習装置100A)の機能を兼備し、訓練データを使ってニューラルネットワーク50を学習させてもよい。この場合、ベンダ側装置100(深層学習装置100A)は不要となる。
図41に示すように、上述の解析ユニット600は、測定ユニット400から受信したデジタル信号と解析結果を、インタフェース部6011を介して、深層学習装置100Aに送信してもよい。解析ユニット600は、例えば、インターネットを介して、深層学習装置100Aに、波形データと、波形データに対応する分類情報とを送信する。深層学習装置100Aは、解析ユニット600から送信された波形データと、当該波形データに対応する分類情報とに基づいて学習処理を行い、深層学習アルゴリズム60を更新する。深層学習装置100Aは、更新した深層学習アルゴリズム60を解析ユニット600に送信する。解析ユニット600は、深層学習装置100Aから送信された深層学習アルゴリズム60により、記憶部6004に格納されたアルゴリズムを更新する。解析ユニット600は、例えば、測定ユニット400から伝送された波形データをプロセッサ6001および並列処理プロセッサ6002で処理している間に、並行して、その波形データを深層学習装置100Aに送信する。解析ユニット600は、波形データの解析、つまり分類情報の生成が完了次第、分類情報を深層学習装置100Aに送信する。
(深層学習処理)
図42は、深層学習を行う深層学習装置100Aの機能ブロックの例を示す。図42を参照すると、本実施形態に係る深層学習装置100Aの処理部10Aは、訓練データ生成部101と、訓練データ入力部102と、アルゴリズム更新部103とを備える。これらの機能ブロックは、コンピュータに深層学習処理を実行させるプログラムを、図39に示す処理部10Aの記憶部13又はメモリ12にインストールし、このプログラムをCPU11及びGPU19が実行することにより実現される。訓練データデータベース(DB)104と、アルゴリズムデータベース(DB)105とは、処理部10Aの記憶部13又はメモリ12に記録される。
上述したように、本実施形態において、畳み込みニューラルネットワークを用いる。図44の(a)にニューラルネットワーク50の構造を例示する。ニューラルネットワーク50は、入力層50aと、出力層50bと、入力層50a及び出力層50bの間の中間層50cとを備え、中間層50cが複数の層で構成されている。中間層50cを構成する層の数は、例えば5層以上、好ましくは50層以上、より好ましくは100層以上とすることができる。
図44の(b)は、各ノードにおける演算を示す模式図である。各ノード89では、複数の入力を受け取り、1つの出力(z)を計算する。図44の(b)に示す例の場合、ノード89は4つの入力を受け取る。ノード89が受け取る総入力(u)は、例として以下の(式2)で表される。ここで、本実施形態においては、訓練データ75及び分析データ85として一次元の行列データを用いるため、演算式の変数が二次元の行列データに対応する場合には、変数を一次元の行列データに対応するように変換する処理を行う。





実施形態に係る細胞種別の分析方法では、活性化関数として、正規化線形関数(rectified linear unit function)を用いる。正規化線形関数は以下の(式6)で表される。


ニューラルネットワークを用いて表現される関数をy(x:w)とおくと、関数y(x:w)は、ニューラルネットワークのパラメータwを変化させると変化する。入力xに対してニューラルネットワークがより好適なパラメータwを選択するように、関数y(x:w)を調整することを、ニューラルネットワークの訓練または学習と呼ぶ。ニューラルネットワークを用いて表現される関数の入力と出力との組が複数与えられているとする。ある入力xに対する望ましい出力をdとすると、入出力の組は、{(x1、d1)、(x2、d2)、・・・、(xn、dn)}と与えられる。(x、d)で表される各組の集合を、訓練データと呼ぶ。具体的には、図3に示す、波形データ(前方散乱光波形データ、側方散乱光波形データ、蛍光波形データ)の集合が、図3に示す訓練データである。







健常血液試料として健常人から採血した血液を測定し、非健常血液試料としてXN CHECK Lv2(ストレック社のコントロール血液(固定などの処理が行われている))をSysmex XN-1000でそれぞれ測定した。蛍光染色試薬にはシスメックス株式会社製のフルオロセルWDFを用いた。また溶血剤にはシスメックス株式会社製のライザセルWDFを用いた。それぞれの生体試料に含まれる細胞毎に、前方散乱光の測定開始から10ナノ秒間隔で前方散乱光、側方散乱光、及び側方蛍光の波形データを1024ポイントについて取得した。健常血液試料に関しては、8名の健常者から採血した血液中の細胞の波形データをデジタル信号としてプールした。それぞれの細胞の波形データに対して好中球(NEUT)、リンパ球(LYMPH)、単球(MONO)、好酸球(EO)、好塩基球(BASO)、幼若顆粒球(IG)の分類を手動にて実施し、それぞれの波形データに細胞種別のアノテーション(ラベル付け)を付した。前方散乱光の信号強度が閾値を超えた時点を測定開始時点とし、前方散乱光、側方散乱光、側方蛍光の波形データの取得時点を同期させ、訓練データを生成した。またコントロール血液についてもコントロール血液由来細胞(CONT)とアノテーションを行った。深層学習アルゴリズムに訓練データを入力し、学習させた。
細胞分析装置として画像分析装置を用いた実施形態を説明する。画像分析装置である第3の細胞分析装置4000''は、撮像された画像データを分析することにより、撮像された細胞の細胞種別を推定する。
集光レンズ730~733は、光源720~723から出射された波長λ11~λ14の光をそれぞれ集光する。ダイクロイックミラー740は、波長λ11の光を透過させ、波長λ12の光を屈折させる。ダイクロイックミラー741は、波長λ11及びλ12の光を透過させ、波長λ13の光を屈折させる。こうして、波長λ11~λ14の光が、フローセル710の流路711を流れる試料701に照射される。なお、測定ユニット700が備える半導体レーザ光源の数は1以上であれば制限されない。半導体レーザ光源の数は、例えば、1、2、3、4、5又は6の中から選択することができる。
以下、本実施形態における訓練データの生成例を説明する。
図50を例として、ニューラルネットワークの訓練の概要を説明する。ニューラルネットワーク50は、畳み込みニューラルネットワークであることが好ましい。ニューラルネットワーク50における入力層50aのノード数は、入力される訓練データ75の画素数と画像に含まれる輝度と色相の数(例えば上記例では、輝度72y、第1の色相72cb、及び第2の色相72crの3つ)との積に対応している。色調ベクトルデータ74はその集合76としてニューラルネットワーク50の入力層50aに入力される。訓練データ75の各画素のラベル値77を、ニューラルネットワークの出力層50bとして、ニューラルネットワーク50を訓練する。
図52に画像の分析方法の例を示す。画像の分析方法では、分析対象の細胞を撮像した分析用画像から分析データ81を生成する。分析用画像は、分析対象の細胞を撮像した画像である。
以上、本発明を概要及び特定の実施形態によって説明したが、本発明は上記した概要及び各実施形態に限定されるものではない。
60 訓練済み深層学習アルゴリズム
400、400a、500、500a、700 測定ユニット
410 FCM検出部
450 検体吸引部
482、507、3008、6009 A/D変換部
3001、4831、6001、8111 プロセッサ(ホストプロセッサ)
3002、4833、6002、8112 並列処理プロセッサ
4000、4000’、4000'' 細胞分析装置
3200、6200、4836 演算ユニット
Claims (34)
- ホストプロセッサと、並列処理プロセッサとを含む細胞分析装置において、
前記ホストプロセッサによる制御に基づいて、検体中の複数の細胞の各々に関するデータを取得し、
前記並列処理プロセッサによって、前記データに関する並列処理を実行し、
前記並列処理の結果に基づき、前記複数の細胞の各々について細胞種別に関する情報を生成する、
ことを含む細胞分析方法。 - 前記並列処理は、人工知能アルゴリズムに従って実行される処理の少なくとも一部である、
請求項1に記載の細胞分析方法。 - 前記データを、前記細胞分析装置が備える伝送路を介して前記並列処理プロセッサに伝送する、
請求項1または2に記載の細胞分析方法。 - 前記データを、インターネットまたはイントラネットとは異なる伝送路を介して前記並列処理プロセッサに伝送する、請求項1または2に記載の細胞分析方法。
- 前記伝送路は、1ギガビット/秒以上の通信帯域を備える、請求項3に記載の細胞分析方法。
- 前記伝送路はバスであり、前記バスを介して、前記並列処理プロセッサに前記データを伝送する、請求項3に記載の細胞分析方法。
- フローサイトメータによって測定された前記複数の細胞に関するアナログ信号から変換された前記データが、前記伝送路を介して前記並列処理プロセッサに伝送される、請求項3から6のいずれか1項に記載の細胞分析方法。
- 前記情報は、前記細胞種別を識別するための識別子を含む、
請求項1から7のいずれか1項に記載の細胞分析方法。 - 前記情報は、前記細胞が複数の前記細胞種別の各々に属する確率を含む、
請求項1から8のいずれか1項に記載の細胞分析方法。 - 前記細胞種別を識別するための識別子を含む分析結果を、当該分析結果の分析を行う処理ユニットに送信する、
請求項1から9のいずれか1項に記載の細胞分析方法。 - 前記細胞が複数の前記細胞種別の各々に属する確率を含む分析結果を、当該分析結果の分析を行う処理ユニットに送信する、
請求項1から10のいずれか1項に記載の細胞分析方法。 - 前記並列処理プロセッサは、前記並列処理として、前記データの分析に関する複数の演算処理を並列に実行する、
請求項1から11のいずれか1項に記載の細胞分析方法。 - 前記並列処理プロセッサは、
前記データの分析に関する演算処理を実行可能な演算ユニットを複数有し、
前記並列処理として、前記演算ユニットの各々による前記演算処理を並列に実行する、
請求項1から12のいずれか1項に記載の細胞分析方法。 - 前記人工知能アルゴリズムは、深層学習アルゴリズムである、
請求項2、または、請求項2を引用する請求項3から13のいずれか1項に記載の細胞分析方法。 - 前記並列処理プロセッサは、前記並列処理として、前記データの特徴を抽出するためのフィルタリング処理を並列に実行する、
請求項1から14のいずれか1項に記載の細胞分析方法。 - 前記人工知能アルゴリズムは、深層学習アルゴリズムであり、
前記並列処理プロセッサは、前記並列処理として、前記深層学習アルゴリズムにおける畳み込み層における複数の演算処理を並列に実行する、
請求項2、または、請求項2を引用する請求項3から15のいずれか1項に記載の細胞分析方法。 - 前記並列処理プロセッサは、単一の命令に従って前記並列処理を実行する、
請求項1から16のいずれか1項に記載の細胞分析方法。 - 前記データは、前記細胞に光を照射することにより検出される信号に基づくデータである、
請求項1から17のいずれか1項に記載の細胞分析方法。 - 前記細胞を測定して得られる信号を所定のレートでサンプリングしたサンプリングデータを前記データとして前記並列処理プロセッサに入力し、
前記並列処理プロセッサは、前記並列処理を実行することにより前記サンプリングデータを分析する、
請求項1から18のいずれか1項に記載の細胞分析方法。 - 前記細胞に光を照射して取得された画像データを前記データとして前記並列処理プロセッサに入力し、
前記並列処理プロセッサは、前記並列処理を実行することにより前記画像データを分析する、
請求項1から18のいずれか1項に記載の細胞分析方法。 - 前記並列処理プロセッサは、前記データの各々について複数の行列演算を実行する、
請求項1から20のいずれか1項に記載の細胞分析方法。 - 前記並列処理プロセッサは、前記データの各々について少なくとも100の行列演算を実行する、
請求項1から21のいずれか1項に記載の細胞分析方法。 - 前記並列処理プロセッサは、前記データの各々について少なくとも1000の行列演算を実行する、
請求項1から22のいずれか1項に記載の細胞分析方法。 - 前記並列処理プロセッサは、少なくとも100個の前記細胞の各々に対応する前記データを分析する、
請求項1から23のいずれか1項に記載の細胞分析方法。 - 前記並列処理プロセッサは、少なくとも1000個の前記細胞の各々に対応する前記データを分析する、
請求項1から24のいずれか1項に記載の細胞分析方法。 - 前記並列処理プロセッサは、各々が、少なくとも1ギガバイトの容量を有する前記データを分析する、
請求項1から25のいずれか1項に記載の細胞分析方法。 - 前記並列処理プロセッサは、
前記データの分析に関する演算処理を実行可能な演算ユニットを少なくとも10個有し、
前記並列処理として、前記演算ユニットの各々による前記演算処理を並列に実行する、
請求項1から26のいずれか1項に記載の細胞分析方法。 - 前記並列処理プロセッサは、
前記データの分析に関する演算処理を実行可能な演算ユニットを少なくとも100個有し、
前記並列処理として、前記演算ユニットの各々による前記演算処理を並列に実行する、
請求項1から27のいずれか1項に記載の細胞分析方法。 - 前記並列処理プロセッサは、
前記データの分析に関する演算処理を実行可能な演算ユニットを少なくとも1000個有し、
前記並列処理として、前記演算ユニットの各々による前記演算処理を並列に実行する、
請求項1から28のいずれか1項に記載の細胞分析方法。 - 前記並列処理プロセッサは、少なくとも1ギガバイトの容量を有するメモリから読み出された前記データを入力とし、前記並列処理を実行する、
請求項1から29のいずれか1項に記載の細胞分析方法。 - 検体中の細胞に関するデータは、細胞から得られる複数種類の信号に基づくデータの組み合わせである、請求項1から30のいずれか1項に記載の細胞分析方法。
- 測定ユニットによって細胞を測定し、
前記測定ユニットとインターネットまたはイントラネットを介さずに接続された並列処理プロセッサによって、前記測定に基づく細胞に関するデータの並列処理を実行し、
前記並列処理の結果に基づき、前記細胞の細胞種別に関する情報を生成する、
ことを含む細胞分析方法。 - 細胞分析装置に搭載された測定ユニットによって検体を吸引し、
吸引された前記検体中の細胞に関するデータを生成し、
前記データに関する並列処理を、前記細胞分析装置に搭載された並列処理プロセッサで実行し、
前記並列処理プロセッサが実行する前記並列処理の結果に基づき、前記細胞の細胞種別に関する情報を生成する、
ことを含む細胞分析方法。 - 検体に含まれる複数の細胞を測定する測定ユニットと、
前記複数の細胞の分析に関する情報処理を行うプロセッサと、
並列処理プロセッサと、を備え、
前記測定ユニットは、前記複数の細胞の各々に関するデータを取得し、
前記並列処理プロセッサは、前記データに関する並列処理を実行し、
前記プロセッサは、前記並列処理の結果に基づいて生成された、前記複数の細胞の各々の細胞種別に関する情報を処理する、
細胞分析装置。
Priority Applications (4)
| Application Number | Priority Date | Filing Date | Title |
|---|---|---|---|
| CN202180049471.XA CN115867637A (zh) | 2020-09-18 | 2021-08-30 | 细胞分析方法以及细胞分析装置 |
| EP25189825.0A EP4610651A3 (en) | 2020-09-18 | 2021-08-30 | Cell analysis method and cell analyzer |
| EP21869154.1A EP4215901A4 (en) | 2020-09-18 | 2021-08-30 | CELL ANALYSIS METHOD AND CELL ANALYSIS DEVICE |
| US18/185,589 US20230314300A1 (en) | 2020-09-18 | 2023-03-17 | Cell analysis method and cell analyzer |
Applications Claiming Priority (2)
| Application Number | Priority Date | Filing Date | Title |
|---|---|---|---|
| JP2020157930A JP7688484B2 (ja) | 2020-09-18 | 2020-09-18 | 細胞分析方法及び細胞分析装置 |
| JP2020-157930 | 2020-09-18 |
Related Child Applications (1)
| Application Number | Title | Priority Date | Filing Date |
|---|---|---|---|
| US18/185,589 Continuation US20230314300A1 (en) | 2020-09-18 | 2023-03-17 | Cell analysis method and cell analyzer |
Publications (1)
| Publication Number | Publication Date |
|---|---|
| WO2022059467A1 true WO2022059467A1 (ja) | 2022-03-24 |
Family
ID=80776154
Family Applications (1)
| Application Number | Title | Priority Date | Filing Date |
|---|---|---|---|
| PCT/JP2021/031651 Ceased WO2022059467A1 (ja) | 2020-09-18 | 2021-08-30 | 細胞分析方法及び細胞分析装置 |
Country Status (5)
| Country | Link |
|---|---|
| US (1) | US20230314300A1 (ja) |
| EP (2) | EP4610651A3 (ja) |
| JP (3) | JP7688484B2 (ja) |
| CN (1) | CN115867637A (ja) |
| WO (1) | WO2022059467A1 (ja) |
Cited By (1)
| Publication number | Priority date | Publication date | Assignee | Title |
|---|---|---|---|---|
| JP2025513952A (ja) * | 2022-03-29 | 2025-05-01 | アヘッド メディシン コーポレーション | サイトメトリックデータを処理する方法及びデバイス |
Families Citing this family (2)
| Publication number | Priority date | Publication date | Assignee | Title |
|---|---|---|---|---|
| IL311201A (en) * | 2021-11-17 | 2024-05-01 | Becton Dickinson Co | Methods for dynamic real-time adjustment of a data acquisition parameter in a flow cytometer |
| WO2025128436A1 (en) * | 2023-12-14 | 2025-06-19 | Beckman Coulter, Inc. | Particle type identification using flow cytometry |
Citations (8)
| Publication number | Priority date | Publication date | Assignee | Title |
|---|---|---|---|---|
| JPH0743307A (ja) * | 1993-07-26 | 1995-02-14 | Toa Medical Electronics Co Ltd | イメージングフローサイトメータ |
| JPH0886736A (ja) * | 1994-09-19 | 1996-04-02 | Hitachi Ltd | 粒子画像の解析方法 |
| US5891733A (en) | 1994-10-20 | 1999-04-06 | Toa Medical Electronics Co., Ltd. | Reagent for analyzing solid components in urine and method for analyzing solid components by employing the same |
| EP1136563A2 (en) | 2000-03-22 | 2001-09-26 | Sysmex Corporation | Method of staining, and detecting and counting bacteria |
| JP2003512605A (ja) * | 1999-10-21 | 2003-04-02 | サイトメーション, インコーポレイテッド | 一時的動的フローサイトメータ分析システム |
| US7309581B2 (en) | 2000-11-01 | 2007-12-18 | Sysmex Corporation | Method of staining, detection and counting bacteria, and a diluent for bacterial stain |
| JP2012519848A (ja) | 2009-03-04 | 2012-08-30 | ベックマン コールター, インコーポレイテッド | 細胞集団識別のための機器間の方法およびシステム |
| JP6685057B1 (ja) * | 2019-07-30 | 2020-04-22 | 株式会社Cybo | イメージングフローサイトメーター、ソート方法、及び、キャリブレーション方法 |
Family Cites Families (10)
| Publication number | Priority date | Publication date | Assignee | Title |
|---|---|---|---|---|
| US8060353B2 (en) * | 2008-05-02 | 2011-11-15 | Iguran LLC | Flow cytometer remote monitoring system |
| WO2016196220A1 (en) * | 2015-05-29 | 2016-12-08 | Beckman Coulter, Inc. | System and method for defining and utilizing flow cytometry protocols |
| US11098275B2 (en) * | 2015-10-28 | 2021-08-24 | The University Of Tokyo | Analysis device |
| US20170270245A1 (en) * | 2016-01-11 | 2017-09-21 | Edico Genome, Corp. | Bioinformatics systems, apparatuses, and methods for performing secondary and/or tertiary processing |
| JP6903494B2 (ja) * | 2017-06-09 | 2021-07-14 | シスメックス株式会社 | 感染症を識別するための粒子分析方法 |
| WO2019173233A1 (en) * | 2018-03-05 | 2019-09-12 | Anixa Diagnostics Corporation | Methods for using artificial neural network analysis on flow cytometry data for cancer diagnosis |
| JP7678424B2 (ja) * | 2018-05-10 | 2025-05-16 | 学校法人順天堂 | 画像解析方法、装置、コンピュータプログラム、及び深層学習アルゴリズムの生成方法 |
| CN108802332A (zh) * | 2018-05-31 | 2018-11-13 | 深圳森阳环保材料科技有限公司 | 土壤污染智能监测系统 |
| EP4306931B1 (en) * | 2018-06-13 | 2025-09-24 | ThinkCyte K.K. | Methods and systems for cytometry |
| CN209485938U (zh) * | 2019-01-08 | 2019-10-11 | 广西师范大学 | 一种流式细胞仪数据采集系统 |
-
2020
- 2020-09-18 JP JP2020157930A patent/JP7688484B2/ja active Active
-
2021
- 2021-08-30 EP EP25189825.0A patent/EP4610651A3/en active Pending
- 2021-08-30 WO PCT/JP2021/031651 patent/WO2022059467A1/ja not_active Ceased
- 2021-08-30 CN CN202180049471.XA patent/CN115867637A/zh active Pending
- 2021-08-30 EP EP21869154.1A patent/EP4215901A4/en active Pending
-
2023
- 2023-03-17 US US18/185,589 patent/US20230314300A1/en active Pending
-
2025
- 2025-05-23 JP JP2025086217A patent/JP2025122122A/ja active Pending
- 2025-05-23 JP JP2025086218A patent/JP2025122123A/ja active Pending
Patent Citations (8)
| Publication number | Priority date | Publication date | Assignee | Title |
|---|---|---|---|---|
| JPH0743307A (ja) * | 1993-07-26 | 1995-02-14 | Toa Medical Electronics Co Ltd | イメージングフローサイトメータ |
| JPH0886736A (ja) * | 1994-09-19 | 1996-04-02 | Hitachi Ltd | 粒子画像の解析方法 |
| US5891733A (en) | 1994-10-20 | 1999-04-06 | Toa Medical Electronics Co., Ltd. | Reagent for analyzing solid components in urine and method for analyzing solid components by employing the same |
| JP2003512605A (ja) * | 1999-10-21 | 2003-04-02 | サイトメーション, インコーポレイテッド | 一時的動的フローサイトメータ分析システム |
| EP1136563A2 (en) | 2000-03-22 | 2001-09-26 | Sysmex Corporation | Method of staining, and detecting and counting bacteria |
| US7309581B2 (en) | 2000-11-01 | 2007-12-18 | Sysmex Corporation | Method of staining, detection and counting bacteria, and a diluent for bacterial stain |
| JP2012519848A (ja) | 2009-03-04 | 2012-08-30 | ベックマン コールター, インコーポレイテッド | 細胞集団識別のための機器間の方法およびシステム |
| JP6685057B1 (ja) * | 2019-07-30 | 2020-04-22 | 株式会社Cybo | イメージングフローサイトメーター、ソート方法、及び、キャリブレーション方法 |
Non-Patent Citations (1)
| Title |
|---|
| See also references of EP4215901A4 |
Cited By (1)
| Publication number | Priority date | Publication date | Assignee | Title |
|---|---|---|---|---|
| JP2025513952A (ja) * | 2022-03-29 | 2025-05-01 | アヘッド メディシン コーポレーション | サイトメトリックデータを処理する方法及びデバイス |
Also Published As
| Publication number | Publication date |
|---|---|
| EP4610651A2 (en) | 2025-09-03 |
| JP2022051447A (ja) | 2022-03-31 |
| JP2025122123A (ja) | 2025-08-20 |
| CN115867637A (zh) | 2023-03-28 |
| EP4215901A1 (en) | 2023-07-26 |
| JP2025122122A (ja) | 2025-08-20 |
| EP4610651A3 (en) | 2025-10-15 |
| US20230314300A1 (en) | 2023-10-05 |
| EP4215901A4 (en) | 2024-08-21 |
| JP7688484B2 (ja) | 2025-06-04 |
Similar Documents
| Publication | Publication Date | Title |
|---|---|---|
| JP7637736B2 (ja) | 細胞の分析方法、深層学習アルゴリズムの訓練方法、細胞分析装置、深層学習アルゴリズムの訓練装置、細胞の分析プログラム及び深層学習アルゴリズムの訓練プログラム | |
| US20230314300A1 (en) | Cell analysis method and cell analyzer | |
| US20260071950A1 (en) | Cell analysis method and cell analyzer | |
| CN115078228A (zh) | 分析方法以及分析装置 | |
| EP4246123B1 (en) | Specimen analyzer, specimen analysis method, and program | |
| RU2839415C1 (ru) | Способ анализа клеток и анализатор клеток | |
| RU2839419C1 (ru) | Способ анализа клеток и анализатор клеток | |
| JP7813165B2 (ja) | 検体分析装置、検体分析方法およびプログラム | |
| EP4439571A1 (en) | Analysis method, specimen analyzer, and program | |
| JP2023137000A (ja) | 検体分析装置、検体分析方法およびプログラム | |
| RU2820983C2 (ru) | Способ клеточного анализа, способ обучения для алгоритма глубокого обучения, устройство клеточного анализа, обучающее устройство для алгоритма глубокого обучения, программа клеточного анализа и обучающая программа для алгоритма глубокого обучения | |
| JP7721289B2 (ja) | 分析方法および分析装置 | |
| JP7774966B2 (ja) | 分析方法および分析装置 | |
| JP7824031B2 (ja) | 分析方法および分析装置 |
Legal Events
| Date | Code | Title | Description |
|---|---|---|---|
| 121 | Ep: the epo has been informed by wipo that ep was designated in this application |
Ref document number: 21869154 Country of ref document: EP Kind code of ref document: A1 |
|
| WWE | Wipo information: entry into national phase |
Ref document number: 202317016710 Country of ref document: IN |
|
| WWE | Wipo information: entry into national phase |
Ref document number: 2023106372 Country of ref document: RU |
|
| NENP | Non-entry into the national phase |
Ref country code: DE |
|
| ENP | Entry into the national phase |
Ref document number: 2021869154 Country of ref document: EP Effective date: 20230418 |
|
| WWG | Wipo information: grant in national office |
Ref document number: 2023106372 Country of ref document: RU |