WO2022064639A1 - 異常検出装置、異常検出方法及び異常検出システム - Google Patents
異常検出装置、異常検出方法及び異常検出システム Download PDFInfo
- Publication number
- WO2022064639A1 WO2022064639A1 PCT/JP2020/036301 JP2020036301W WO2022064639A1 WO 2022064639 A1 WO2022064639 A1 WO 2022064639A1 JP 2020036301 W JP2020036301 W JP 2020036301W WO 2022064639 A1 WO2022064639 A1 WO 2022064639A1
- Authority
- WO
- WIPO (PCT)
- Prior art keywords
- abnormality
- distribution
- gradient
- region
- abnormality detection
- Prior art date
- Legal status (The legal status is an assumption and is not a legal conclusion. Google has not performed a legal analysis and makes no representation as to the accuracy of the status listed.)
- Ceased
Links
Images


Classifications
-
- G—PHYSICS
- G06—COMPUTING OR CALCULATING; COUNTING
- G06T—IMAGE DATA PROCESSING OR GENERATION, IN GENERAL
- G06T7/00—Image analysis
- G06T7/0002—Inspection of images, e.g. flaw detection
- G06T7/0004—Industrial image inspection
-
- G—PHYSICS
- G06—COMPUTING OR CALCULATING; COUNTING
- G06T—IMAGE DATA PROCESSING OR GENERATION, IN GENERAL
- G06T7/00—Image analysis
- G06T7/0002—Inspection of images, e.g. flaw detection
-
- G—PHYSICS
- G06—COMPUTING OR CALCULATING; COUNTING
- G06T—IMAGE DATA PROCESSING OR GENERATION, IN GENERAL
- G06T2207/00—Indexing scheme for image analysis or image enhancement
- G06T2207/10—Image acquisition modality
- G06T2207/10016—Video; Image sequence
-
- G—PHYSICS
- G06—COMPUTING OR CALCULATING; COUNTING
- G06T—IMAGE DATA PROCESSING OR GENERATION, IN GENERAL
- G06T2207/00—Indexing scheme for image analysis or image enhancement
- G06T2207/10—Image acquisition modality
- G06T2207/10024—Color image
-
- G—PHYSICS
- G06—COMPUTING OR CALCULATING; COUNTING
- G06T—IMAGE DATA PROCESSING OR GENERATION, IN GENERAL
- G06T2207/00—Indexing scheme for image analysis or image enhancement
- G06T2207/20—Special algorithmic details
- G06T2207/20021—Dividing image into blocks, subimages or windows
Definitions
- This disclosure relates to an abnormality detection device, an abnormality detection method, and an abnormality detection system.
- Non-Patent Document 1 describes a means for supporting inspection work of a transmission line by analyzing an image acquired by a flying object such as a helicopter with AI and identifying damage or deterioration of the transmission line.
- a robot that runs on the transmission line photographs the appearance of the transmission line, and the captured image is analyzed by an AI developed independently to "break" the part that does not have a linear shape.
- a means for detecting an abnormality caused by a lightning strike or snow is described.
- Non-Patent Document 3 discloses a method of detecting an abnormality in a transmission line by analyzing a deviation from a change in color or an average luminance value of a normal portion by image analysis.
- Non-Patent Documents 1 and 2 all depend on image analysis by AI, a large amount of teacher data for learning this AI is required to realize good detection accuracy. Therefore, it costs a lot of shooting and correct answering by a professional worker.
- the luminance value and the color which are the materials for determining the abnormality, greatly change depending on the weather, the time zone, and the surrounding environment, so that the detection accuracy is limited and the luminance value is limited. It is difficult to apply to an environment where the color is liable to change.
- an object of the present disclosure is to provide a means for detecting the presence or absence of an abnormality from an input image to be analyzed with high accuracy even in an environment where the luminance value and the color are likely to fluctuate without using AI. ..
- one of the representative abnormality detection devices of the present disclosure is a video input unit for inputting an image of an abnormality detection target, and the image is divided into a predetermined area for each area.
- a gradient distribution generation unit that generates a gradient distribution showing the distribution of the brightness in the gradient direction of the region and an abnormality determination unit that determines the presence or absence of an abnormality by analyzing the gradient distribution generated for each region.
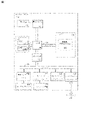
- FIG. 1 is a block diagram of a computer system for implementing the embodiments of the present disclosure.
- FIG. 2 is a diagram showing an example of the configuration of the abnormality detection system according to the embodiment of the present disclosure.
- FIG. 3 is a diagram showing an input image showing an abnormality detection object according to the embodiment of the present disclosure and a luminance gradient in the input image.
- FIG. 4 is a diagram showing an example of the notation of the luminance gradient according to the embodiment of the present disclosure.
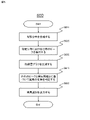
- FIG. 5 is a flowchart showing an example of a process showing the flow of the first half of the abnormality detection method according to the embodiment of the present disclosure.
- FIG. 6 is a flowchart showing an example of a process showing the flow of the latter half of the abnormality detection method according to the embodiment of the present disclosure.
- FIG. 7 is a diagram showing an example of a gradient distribution according to an embodiment of the present disclosure.
- FIG. 8 is a flowchart showing another example of the process showing the flow of the latter half of the abnormality detection method according to the embodiment of the present disclosure.
- FIG. 9 is a diagram for showing the concept of the process shown in FIG.
- abnormality detection target a means for accurately detecting whether or not an abnormality exists in an object (hereinafter, “abnormality detection target”) appearing in the video. ing.
- AI methods such as machine learning are being studied to suppress the effects of different shooting conditions, but many AI methods require a high-performance computer, and in addition to normal images, a large amount of abnormal image data is required. Need to collect.
- the abnormality is determined based on the gradient of the brightness of the input image showing the abnormality detection target. Since the gradient direction of the brightness does not change even if the brightness changes due to changes in the weather, it is possible to detect abnormalities more robustly than using the change in brightness value or color as an index, and to learn AI. There is no need to collect large amounts of teacher data.
- the anomaly detection object here means an object to be anomalous detection, and may be any object such as a silicon wafer used for manufacturing an electronic circuit, a power transmission line, an outer wall of a building, or the like. It is good, but as will be described later, it is preferable that the object has a periodic pattern.
- the abnormality here means a property different from the normal property in the abnormality detection object, which is an object to be detected, and various abnormalities can be considered depending on the type of the abnormality detection target. Be done. For example, if the anomaly detection target is a transmission line, scratches, melting due to lightning strikes, disconnection, shape change, etc. can be considered, and if the abnormality detection target is a substrate, cracks, chips, distortion, etc. Can be considered. (Hardware configuration)
- the main components of the computer system 300 include one or more processors 302, memory 304, terminal interface 312, storage interface 314, I / O (input / output) device interface 316, and network interface 318. These components may be interconnected via a memory bus 306, an I / O bus 308, a bus interface unit 309, and an I / O bus interface unit 310.
- the computer system 300 may include one or more general purpose programmable central processing units (CPUs) 302A and 302B collectively referred to as processors 302.
- processors 302. the computer system 300 may include a plurality of processors, and in another embodiment, the computer system 300 may be a single CPU system.
- Each processor 302 may execute an instruction stored in memory 304 and include an onboard cache.
- the memory 304 may include a random access semiconductor memory, a storage device, or a storage medium (either volatile or non-volatile) for storing data and programs.
- the memory 304 may store all or part of the programs, modules, and data structures that perform the functions described herein.
- the memory 304 may store the abnormality detection application 350.
- the anomaly detection application 350 may include instructions or descriptions that perform the functions described below on the processor 302.
- the anomaly detection application 350 replaces or in addition to a processor-based system a semiconductor device, chip, logic gate, circuit, circuit card, and / or other physical hardware device. It may be implemented in hardware via. In certain embodiments, the anomaly detection application 350 may include data other than instructions or descriptions. In certain embodiments, a camera, sensor, or other data input device (not shown) may be provided to communicate directly with the bus interface unit 309, processor 302, or other hardware of the computer system 300. ..
- the computer system 300 may include a processor 302, a memory 304, a display system 324, and a bus interface unit 309 that communicates between the I / O bus interface units 310.
- the I / O bus interface unit 310 may be coupled to an I / O bus 308 for transferring data to and from various I / O units.
- the I / O bus interface unit 310, via the I / O bus 308, is a plurality of I / O interface units 312, 314, 316, also known as I / O processors (IOPs) or I / O adapters (IOAs). And 318 may be communicated.
- IOPs I / O processors
- IOAs I / O adapters
- the display system 324 may include a display controller, display memory, or both.
- the display controller can provide video, audio, or both data to the display device 326.
- the computer system 300 may also include devices such as one or more sensors configured to collect the data and provide the data to the processor 302.
- the computer system 300 includes a biometric sensor that collects heart rate data, stress level data, etc., an environment sensor that collects humidity data, temperature data, pressure data, etc., and a motion sensor that collects acceleration data, exercise data, etc. May include. Other types of sensors can also be used.
- the display system 324 may be connected to a display device 326 such as a stand-alone display screen, television, tablet, or portable device.
- the I / O interface unit has a function of communicating with various storages or I / O devices.
- the terminal interface unit 312 may be a user output device such as a video display device or a speaker TV, or a user input device such as a keyboard, mouse, keypad, touchpad, trackball, button, light pen, or other pointing device. It is possible to attach such a user I / O device 320.
- the user inputs input data and instructions to the user I / O device 320 and the computer system 300 by operating the user input device using the user interface, and receives output data from the computer system 300. May be good.
- the user interface may be displayed on the display device via the user I / O device 320, reproduced by the speaker, or printed via the printer, for example.
- the storage interface 314 is one or more disk drives or an array of disk drives or other storage devices configured to appear as a single disk drive, usually a magnetic disk drive storage device, but a direct access storage device 322. It may be). In certain embodiments, the storage device 322 may be implemented as any secondary storage device. The contents of the memory 304 are stored in the storage device 322 and may be read out from the storage device 322 as needed.
- the I / O device interface 316 may provide an interface to other I / O devices such as printers and fax machines.
- the network interface 318 may provide a communication path so that the computer system 300 and other devices can communicate with each other. This communication path may be, for example, network 330.
- the computer system 300 is a device that receives a request from another computer system (client) that does not have a direct user interface, such as a multi-user mainframe computer system, a single user system, or a server computer. There may be.
- the computer system 300 may be a desktop computer, a portable computer, a laptop computer, a tablet computer, a pocket computer, a telephone, a smartphone, or any other suitable electronic device.
- FIG. 2 is a diagram showing an example of the configuration of the abnormality detection system 200 according to the embodiment of the present disclosure.
- the abnormality detection system 200 includes a sensor device 205, a client terminal 210, and an abnormality detection device 230. Further, the sensor device 205, the client terminal 210, and the abnormality detection device 230 are interconnected via the communication network 225.
- the communication network 225 may be, for example, the Internet or a LAN (Local Area Network).
- the sensor device 205 is a sensor that acquires an image showing the appearance of an abnormality detection object, which is an object to be detected for abnormality.
- the video acquired by the sensor device 205 (hereinafter, “input video” input to the abnormality detection device) may be directly transmitted to the abnormality detection device 230 or may be transmitted to the client terminal 210.
- the number, type, and arrangement of the sensor devices 205 may be appropriately selected depending on the abnormality detection target.
- the sensor device 205 may be a camera mounted on a self-propelled robot moving along the power transmission line, and the abnormality detection target may be used for manufacturing an electronic circuit.
- the sensor device 205 may be a camera mounted on the device for processing the silicon wafer.
- the sensor device 205 may acquire object identification information for identifying the abnormality detection object in addition to the image showing the appearance of the abnormality detection object. Thereby, for example, when an abnormality is detected in the abnormality detection target, a user such as a worker who confirms the detected abnormality can easily identify the abnormality detection target.
- the client terminal 210 is a device for requesting an abnormality detection device 230 for an abnormality detection process for an abnormality detection object and confirming an abnormality notification output by the abnormality detection system 200.
- the client terminal 210 may be, for example, a portable terminal such as a smartphone or a tablet, or may be a fixed terminal such as a desktop personal computer.
- the client terminal 210 may be a terminal used by a user such as a worker in the field who confirms an abnormality detected in an abnormality detection object.
- the client terminal 210 selects an image that clearly shows the appearance of the abnormality detection target object, which is an object to be detected for abnormality, from the received images. Then, the selected image and the abnormality detection request requesting the abnormality detection processing for the abnormality detection object may be transmitted to the abnormality detection device 230 via the communication network 225. After that, when an abnormality is determined for the abnormality detection target as a result of the determination by the abnormality detection device 230, a user such as a worker at the site uses the client terminal 210 to transmit the abnormality from the abnormality detection device 230. You may check the notification and perform inspection, maintenance, etc. on the object to be detected for abnormality.
- the abnormality detection device 230 is a device for performing an abnormality detection process according to the embodiment of the present disclosure on an input image received from the sensor device 205 or the client terminal 210 and detecting the presence or absence of an abnormality. As shown in FIG. 2, the abnormality detection device 230 includes a video input unit 232, a preprocessing unit 233, a gradient distribution generation unit 234, an abnormality determination unit 236, an output unit 238, and a storage unit 240.
- the video input unit 232 is a functional unit for inputting an input video indicating an abnormality detection target.
- the video input unit 232 may receive and input an input video showing the appearance of the abnormality detection target object, which is an abnormality detection target object, from the sensor device 205 or the client terminal 210 via the communication network 225. good.
- the pre-processing unit 233 performs pre-processing (area extraction, grayscale conversion) for facilitating the abnormality detection processing according to the embodiment of the present disclosure on the input video received by the video input unit 232. It is a functional part. The details of the preprocessing performed by the preprocessing unit 233 will be described later with reference to FIG.
- the gradient distribution generation unit 234 is a functional unit for dividing the input video into regions of a predetermined size and generating a gradient distribution showing the distribution of the luminance in the region in the gradient direction for each region.
- the gradient distribution expresses the distribution of the luminance in the gradient direction, and includes various representation forms such as maps and drawings.
- the gradient distribution generated here even in an environment where the brightness value and color are likely to fluctuate without using AI, the presence or absence of abnormalities in the object shown in the target image is highly accurate. Can be detected with.
- the abnormality determination unit 236 is a functional unit for determining the presence or absence of an abnormality by analyzing the gradient distribution generated for each region.
- the abnormality determination unit 236 detects, for example, a gradient satisfying a predetermined frequency standard as a distribution peak from each gradient distribution generated for each region, and sets the detected peak of the distribution in advance.
- the presence or absence of an abnormality may be determined based on a predetermined abnormality threshold value.
- the abnormality determination unit generates an average gradient distribution obtained by averaging each gradient distribution generated for each region, and detects a gradient satisfying a predetermined frequency criterion as a distribution peak in the average gradient distribution. Then, the presence or absence of an abnormality may be determined based on the detected peak of the distribution and a predetermined abnormality threshold value set in advance.
- the abnormality determination unit has a first gradient distribution corresponding to the first region and a second region adjacent to the first region from the respective gradient distributions generated for each region.
- the degree of distribution deviation between the first gradient distribution and the second gradient distribution is determined.
- the presence or absence of an abnormality may be determined based on the determined distribution deviation degree and a predetermined distribution deviation degree threshold value set in advance. The details of the processing of the abnormality determination unit 236 will be described later.
- the output unit 238 is a functional unit for outputting the result of the abnormality determination by the abnormality determination unit. For example, when an abnormality is determined by the determination of the presence or absence of an abnormality in the abnormality determination unit, the output unit 238 may output an abnormality notification including an image showing a region determined to be an abnormality.
- the abnormality notification output here may be transmitted to the client terminal 210 via the communication network 225. In this way, a user such as a worker at the site may use the client terminal 210 to confirm the abnormality notification transmitted from the abnormality detection device 230, and perform inspection, maintenance, or the like on the abnormality detection object.
- the storage unit 240 is a storage device for storing various information used by the abnormality detection device 230.
- the storage unit 240 may store, for example, information on input video received from the sensor device 205 or the client terminal 210, information on abnormality notification, and the like.
- the storage unit 240 may be, for example, a storage device such as a hard disk drive or a solid state drive mounted on the abnormality detection device 230, or may be a cloud-type storage area accessible from the abnormality detection device 230.
- the presence or absence of anomalies in the object reflected in the target input image can be detected with high accuracy even in an environment where the luminance value and the color are likely to fluctuate without using AI.
- a means of detection can be provided.
- FIG. 3 is a diagram showing an input image 360 showing an abnormality detection object according to the embodiment of the present disclosure and a luminance gradient direction 365 in the input image 360. Further, the enlarged view 361 shown in FIG. 3 is an enlarged view of a predetermined area 362 in the input video 360.
- the input video 360 is a video showing the appearance of the power transmission line, for example, taken by the sensor device 205 described with reference to FIG. Further, as will be described later, the input video 360 shown in FIG. 3 has already undergone preprocessing (area extraction, grayscale conversion, contrast correction, area division) for facilitating the abnormality detection means according to the embodiment of the present disclosure. It is an image that was given.
- Each pixel in the input video 360 has a luminance value of 0 to 255 as a value representing the luminance (brightness) of the pixel.
- the direction from the higher brightness value to the lower brightness value is referred to as "luminance gradient" or "luminance gradient”.
- luminance gradient direction 365 of the block is shown for each of the plurality of blocks constituting the predetermined region 362 in the input video 360.
- the appearance of the anomaly detection object has a periodic and uniform pattern, and the region 362 here is large enough to accommodate at least one cycle in this pattern. Area of.
- the luminance gradient is 0 degrees in the horizontal axis direction of the input image, the counterclockwise direction is a positive value, and the clockwise direction is a negative value.
- the angle of the luminance gradient for each of a plurality of blocks constituting a specific area in an arbitrary input video can be expressed by a consistent notation.
- the abnormality determination in the abnormality detection object is performed based on the gradient of the brightness of the input image showing the abnormality detection object.
- the distribution of the brightness gradient in the input video showing the abnormality detection target it is possible to grasp whether or not an abnormality appears in the appearance of the abnormality detection target. For example, it is abnormal when the distribution of the luminance gradient for each of a plurality of blocks constituting a specific region in the input video is dispersed over various angles, or when the distribution between adjacent regions greatly deviates. It is determined that there is an abnormality such as damage or deterioration in the appearance of the object to be detected.
- the present disclosure can provide a means for detecting the presence or absence of an abnormality in an object appearing in a target image with high accuracy even in an environment where the luminance value and the color are likely to fluctuate without using AI. can.
- FIG. 5 is a flowchart showing an example of the process 500 showing the flow of the first half of the abnormality detection method according to the embodiment of the present disclosure.
- the process 500 shown in FIG. 5 is a process performed by, for example, the video input unit 232, the preprocessing unit 233, and the gradient distribution generation unit 234 in the abnormality detection device 230 shown in FIG. 2.
- the video input unit (for example, the video input unit 232 shown in FIG. 2) inputs the input video.
- the video input unit receives and inputs an input video showing the appearance of the abnormality detection target object, which is an abnormality detection target object, from the sensor device or the client via the communication network. May be good.
- the input video here may be, for example, an RGB video.
- the preprocessing unit may extract an area showing the appearance of the abnormality detection target from the input video received in step S510. ..
- the preprocessing unit obtains the appearance of an abnormality detection object based on a preset preset in the sensor device such as the camera.
- the indicated area may be extracted.
- the pretreatment unit may extract the area by using the existing background removing means, segmentation means, or object recognition means.
- step S530 the preprocessing unit performs grayscale conversion on the area of the input video extracted in step S520.
- the pretreatment unit may use any existing method, and is not particularly limited in the present disclosure.
- the case of converting a color image to gray scale will be described as an example, but the present disclosure is not limited to this, and if the color information is characteristic, it will be described later for each RGB color channel. It is also possible to perform a gradient analysis.
- step S540 the preprocessing unit performs contrast correction on the image subjected to grayscale conversion in step S530.
- This contrast correction is a process performed to improve the visibility of the image by emphasizing the lightness and darkness of the image and clarifying the shading, and is not essential in the gradient analysis described later. Therefore, if the computing resources are limited, step S540 here may be skipped. However, it is desirable to perform contrast correction because it makes it easier to visually confirm the result of abnormality determination.
- the gradient distribution generation unit analyzes the gradient.
- the gradient analysis may be performed by an existing method such as a Sobel filter, and is an analysis for expressing the magnitude relationship of pixel values between adjacent pixels.
- the luminance gradient analysis process is performed on the image that has undergone preprocessing such as area extraction and gray scale conversion, a good abnormality determination result can be obtained.
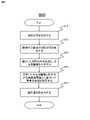
- FIG. 6 is a flowchart showing an example of the process 600 showing the flow of the latter half of the abnormality detection method according to the embodiment of the present disclosure.
- the process 600 shown in FIG. 6 is a process of determining the presence or absence of an abnormality based on the peak of the distribution of the luminance gradient of the input image showing the abnormality detection target. For example, in the first half process 500 of the abnormality detection method shown in FIG. This is a process performed following step S550.
- FIG. 7 is a diagram showing an example of a gradient distribution according to the embodiment of the present disclosure.
- the process 600 shown in FIG. 6 is a process performed by, for example, the gradient distribution generation unit 234, the abnormality determination unit 236, and the output unit 238 in the abnormality detection device 230 shown in FIG.
- the gradient distribution generation unit divides the input video into a plurality of regions, and generates a gradient distribution showing the distribution of the luminance in the region in the gradient direction for each region.
- the gradient distribution here is a data structure showing the distribution of frequencies in which a predetermined gradient angle appears in a specific region, and differs in the range of ⁇ 180 degrees to 180 degrees, for example, as in the gradient distribution 710 shown in FIG. It may be expressed as a histogram showing the frequency for each bin corresponding to the gradient angle. This results in a number of histograms equal to the number of regions, for example, set 720 of the gradient distribution shown in FIG.
- the input video is divided into N areas, and the areas are divided. Histogram showing the distribution of the brightness of the region in the gradient direction for each May be generated.
- T means transpose
- B is the number of bins in the histogram.
- the size of the area here needs to include a pattern such as a pattern of the anomaly detection object in the area for one cycle or more, and by including several cycles in the area, the anomaly detection object depends on the gradient distribution. It can represent the characteristics of the normal state. If the size of the region is too large, it becomes difficult to detect the abnormality when there is a minute abnormality, and it becomes difficult to detect the abnormality.
- the gradient distribution is expressed as a histogram
- the width of the bin of the histogram can be set arbitrarily, but if the width of the bin is too small, the distortion of the sensor device such as a camera, the lighting conditions, and the abnormality detection target object. Since it is easily affected by tolerances, the characteristics of the normal state are less likely to appear. On the other hand, if the width of the bin is too coarse, the difference between normal and abnormal characteristics becomes ambiguous. From the above, it is important to appropriately set the size of the area and the width of the bin in order to obtain a good abnormality determination result.
- the abnormality determination unit detects the peak of the distribution in the gradient distribution.
- the peak of the distribution here means the gradient angle having the highest frequency in the gradient distribution, and is a feature for determining whether or not an abnormality exists in the abnormality detection target.
- the peak of the distribution in the gradient distribution can be obtained by various methods, and is not particularly limited here. As an example, from each gradient distribution generated for each region, a gradient angle satisfying a predetermined frequency criterion may be used as the peak of the distribution.
- the predetermined frequency reference may be a predetermined frequency set arbitrarily, a reference for designating the gradient angle having the highest frequency, or the like (that is, the gradient direction at which the peak of the histogram is obtained for each region). Is obtained, and among the gradient directions that become peaks, the one with the highest frequency is taken as the peak).
- an average gradient distribution is generated by averaging each gradient distribution generated for each region, and the gradient satisfying a predetermined frequency standard is distributed in the average gradient distribution. It may be detected as a peak.
- the gradient distribution is expressed as a histogram, the average histogram obtained by averaging the histograms of each region as shown in Equations 3 to 6 below. Peak bin using May be detected.
- the abnormality determination unit calculates the degree of abnormality in each region based on the value corresponding to the gradient of the peak detected in step S620.
- the degree of abnormality in each region is a value indicating the degree of deviation (distribution deviation degree) of the gradient distribution of a specific region from the normal distribution, and as a method of calculating the degree of abnormality, for example, the following formula 7 , The feature amount graph g obtained by 8 may be used.
- the abnormality determination unit determines the presence or absence of an abnormality in each region of the input video based on the abnormality degree calculated based on the peak of the distribution in step S630 and a predetermined abnormality threshold value set in advance. judge.
- the abnormality threshold value here is a value that defines a boundary line between normal and abnormality, and may be set by the user or automatically determined by the abnormality determination unit based on the previous abnormality determination data. good.
- the abnormality determination unit may be used. It is determined that an abnormality exists in the region, and when the abnormality degree calculated for the specific region is a value less than a predetermined abnormality threshold set in advance, it is determined that there is no abnormality in the region.
- the output unit (for example, the output unit 238 shown in FIG. 2) outputs an abnormality notification indicating the result of the abnormality determination in step S640.
- the abnormality notification here may be a video showing the degree of abnormality calculated for each region in the input video.
- the anomaly notification may include an image showing a region determined to be anomalous.
- the anomaly notification may include a heat map 730 that aggregates the set 720 of the gradient distribution shown in FIG. In this heat map 730, the degree of abnormality of each region in the input video is indicated by the color gradation.
- the abnormality notification generated in step S650 may be transmitted to the client terminal via the communication network.
- FIG. 8 is a flowchart showing an example of the process 800 showing the flow of the latter half of the abnormality detection method according to the embodiment of the present disclosure.
- the process 800 shown in FIG. 8 is a process for detecting an abnormality by a method different from the process 600 shown in FIG. 6, and is the same as the process 600 shown in FIG. 6, for example, step S550 in the process 500 shown in FIG. This is the process that follows.
- FIG. 9 is a diagram for showing the concept of the process 800 shown in FIG. More specifically, the process 800 shown in FIG. 8 is a process of determining the presence or absence of an abnormality by comparing the gradient distributions of adjacent regions in the input video showing the abnormality detection target, and is shown in FIG. 2, for example. It is performed by the gradient distribution generation unit 234, the abnormality determination unit 236, and the output unit 238.
- the gradient distribution generation unit divides the input video into a plurality of regions, and generates a gradient distribution showing the distribution of the luminance in the region in the gradient direction for each region.
- the gradient distribution here is a data structure showing the distribution of frequencies in which a predetermined gradient angle appears in a specific region, for example, from ⁇ 180 degrees to 180 degrees as in the gradient distribution 710 shown in FIG. It may be expressed as a histogram showing the degrees per bin corresponding to different gradient angles in the range of degrees. This results in a number of histograms equal to the number of regions, for example, set 720 of the gradient distribution shown in FIG. Since step S810 in process 800 is substantially the same as step S610 in process 600 described with reference to FIG. 6, the description thereof will be omitted here.
- the abnormality determination unit extracts the gradient distribution corresponding to the adjacent (adjacent) region (hereinafter, “adjacent region”) from the respective gradient distributions generated for each region.
- the abnormality determination unit may extract a first gradient distribution corresponding to the first region and a second gradient distribution corresponding to the second region adjacent to the first region. ..
- step S830 the abnormality determination unit compares the gradient distributions of the adjacent regions extracted in step S830, and determines the degree of distribution deviation of these gradient distributions.
- the degree of distribution deviation here is a value indicating the distance of the gradient distribution, and the larger the degree of distribution deviation of the gradient direction distribution, the larger the difference from the gradient direction distribution in other regions.
- the gradient distribution 911 and the gradient distribution 912 are compared, and the gradient distribution 913 and the gradient distribution 914 are compared from the gradient distribution set 910.
- the gradient direction distribution between adjacent regions (histogram, etc.)
- the gradient direction distribution (histogram, etc.)
- the probability distribution Represents the width of the area (number of pixels or number of blocks) Represents the height of the area (number of pixels or number of blocks).
- the Kullback-Leibler Divergence D can be obtained by the mathematical formula 15 as the value of the degree of distribution deviation.
- adjacent areas are used as comparison targets.
- the reason why adjacent areas are used as comparison targets is that there is a high possibility that the distortion and lighting conditions of the cameras are the same in the adjacent areas, and the appearance pattern is the same under normal conditions. Any combination may be used as long as it is a comparison between regions that are presumed to exist.
- the abnormality determination unit determines the presence or absence of an abnormality based on the distribution deviation degree determined in step S830 and a predetermined distribution deviation degree threshold value set in advance.
- the distribution deviation threshold here is a value that defines the boundary line between the normal distribution deviation and the abnormal distribution deviation, and may be set by the user, and the abnormality is determined based on the previous abnormality determination data. It may be determined automatically by the department.
- the distribution deviation degree calculated for a specific adjacent region is a value equal to or higher than a predetermined distribution deviation degree threshold value set in advance
- the abnormality determination unit determines that an abnormality exists in the adjacent region, and determines that a specific abnormality exists.
- the distribution deviation degree calculated for the adjacent region is less than a predetermined distribution deviation degree threshold value set in advance, it is determined that there is no abnormality in the adjacent region.
- step S850 the output unit (for example, the output unit 238 shown in FIG. 2) outputs an abnormality notification indicating the result of the abnormality determination in step S840. Since step S850 in process 800 is substantially the same as step S650 in process 600 described with reference to FIG. 6, the description thereof will be omitted here.
- the presence or absence of an abnormality in the abnormality detection object can be detected with high accuracy based on the peak of the distribution of the luminance gradient of the input image showing the abnormality detection object.
- 200 Abnormality detection system
- 205 Sensor device
- 210 Client terminal
- 225 Communication network
- 230 Abnormality detection device
- 232 Video input unit
- 233 Preprocessing unit
- 234 Gradient distribution generation unit
- 236 Abnormality determination 238: Output section
- 240 Storage section
Landscapes
- Engineering & Computer Science (AREA)
- Quality & Reliability (AREA)
- Computer Vision & Pattern Recognition (AREA)
- Physics & Mathematics (AREA)
- General Physics & Mathematics (AREA)
- Theoretical Computer Science (AREA)
- Image Analysis (AREA)
Abstract
Description
非特許文献2には、送電線の上を自走するロボットで送電線の外観を撮影し、撮影した映像を独自開発のAIで解析することで、直線形状になっていない箇所を「断線」と判断することで、落雷や雪によって発生する異常を検出する手段が記載されている。
非特許文献3には、画像解析によって正常部分の平均輝度値や色の変化からの偏差を解析することで送電線の異常を検出する方法が示されている。
また、上述した非特許文献3に記載されている手段では、異常の判断材料となる輝度値や色は天候や時間帯、周辺の環境によって大きく変わるため、検出精度が限定されてしまい、輝度値や色が変動しやすい環境への適用が難しい。
上記した以外の課題、構成及び効果は、以下の実施例の説明により明らかにされる。
(本開示の背景及び概要)
しかし、近年では、製造現場などの固定画角・固定照明条件が保証される環境での検査が求められている。例えば、送電線、橋、道路、トンネルなどのインフラの外観検査についても、映像処理の適用が検討されている。検査にはロボットやドローンなどの活用が進んでいるが、工場での外観検査とは異なり、画角や照明などの撮影条件を一定に保つことは非常に難しい。
また、ここでの異常とは、異常検出の対象となる物体である異常検出対象物において、通常の性質とは違う性質を意味するものであり、異常検出対象物の種類によって様々な異常が考えられる。例えば、異常検出対象物が送電線の場合には、当該送電線における傷、落雷による溶解、断線、形状変化等が考えられ、異常検出対象物が基板の場合には、ひび割れ、欠け、歪み等が考えられる。
(ハードウェア構成)
通信ネットワーク225は、例えばインターネットやLAN(Local Area Network)であってもよい。
センサ装置205の数、種類、及び配置は、異常検出対象物によって適宜に選択されてもよい。例えば、異常検出対象物が送電線の場合には、センサ装置205は、送電線に沿って移動する自走ロボットに搭載されるカメラであってもよく、異常検出対象物が電子回路の製造に用いられるシリコンウエハーの場合には、センサ装置205は、当該シリコンウエハーを加工する装置に搭載されるカメラであってもよい。
なお、前処理部233によって行われる前処理の詳細については、図5を参照して後述する。
ここで、異常判定部236は、例えば、領域毎に生成したそれぞれの勾配分布の中から、所定の度数基準を満たす勾配を分布のピークとして検出し、検出した分布のピークと、予め設定される所定の異常閾値とに基づいて、異常の有無を判定してもよい。
なお、異常判定部236の処理の詳細については後述する。
ストレージ部240は、例えば、異常検出装置230に搭載されるハードディスクドライブ、ソリッドステートドライブなどのストレージ装置であってもよく、異常検出装置230からアクセス可能なクラウド型のストレージ領域であってもよい。
なお、本開示では、異常検出対象物の外観には、周期性のある、一様な模様が存在することを前提としており、ここでの領域362は、この模様における少なくとも1周期が収まる大きさの領域である。
なお、本開示では、カラー映像をグレースケールに変換する場合を一例として説明するが、本開示はこれに限定されず、カラー情報に特徴がある場合には、RGBそれぞれのカラーチャネルに対して後述する勾配解析を行うことも可能である。
なお、図6に示す処理600は、例えば図2に示す異常検出装置230における勾配分布生成部234、異常判定部236、及び出力部238によって行われる処理である。
一例として、以下の数式1及び数式2に示すように、入力映像をN個の領域に分割し、領域
ここでは、Tは転置を意味し、Bはヒストグラムのビンの数である。
なお、領域のサイズが大きすぎると、微小な異常があった場合に異常を検出することが困難となり、検知をすることが難しくなる。また、勾配分布をヒストグラムとして表現した場合、ヒストグラムのビンの幅は、任意に設定可能であるが、ビンの幅が細かすぎると、カメラ等のセンサ装置の歪みや照明条件、異常検出対象物の公差などの影響を受けやすくなるため、正常状態の特徴が表れにくくなる。一方、ビンの幅が粗すぎると、正常と異常の特徴の違いが曖昧になる。以上のことから、領域のサイズやビンの幅を適度に設定することは、良好な異常判定結果を得るために重要である。
勾配分布における分布のピークは、様々な手法によって求めることが可能であり、ここでは特に限定されない。一例として、領域毎に生成したそれぞれの勾配分布の中から、所定の度数基準を満たす勾配角度を分布のピークとしてもよい。この所定の度数基準は、任意に設定される所定の度数であってもよく、度数が最も高い勾配角度を指定する基準等であってもよい(つまり、各領域についてヒストグラムのピークとなる勾配方向を求め、ピークとなる勾配方向のうち、度数が最も多いものをピークとする)。
例えば、勾配分布をヒストグラムとして表現した場合、以下の数式3~6で示すように、各領域のヒストグラムを平均化することで得られた平均ヒストグラム
また、上述したように、ステップS650で生成される異常通知は、通信ネットワークを介してクライアント端末に送信されてもよい。
より具体的には、図8に示す処理800は、異常検出対象物を示す入力映像において隣接する領域同士の勾配分布を比較することで異常の有無を判定する処理であり、例えば図2に示す勾配分布生成部234、異常判定部236、及び出力部238によって行われる。
なお、処理800におけるステップS810は、図6を参照して説明した処理600におけるステップS610と実質的に同様であるため、ここではその説明を省略する。
以下、隣接領域同士の勾配方向分布(ヒストグラム等)
なお、処理800におけるステップS850は、図6を参照して説明した処理600におけるステップS650と実質的に同様であるため、ここではその説明を省略する。
Claims (8)
- 異常検出装置であって、
前記異常検出装置は、
異常検出対象物の映像を入力する映像入力部と、
前記映像を所定の領域に分割し、前記領域毎に、当該領域の輝度の勾配方向の分布を示す勾配分布を生成する勾配分布生成部と、
前記領域毎に生成した前記勾配分布を解析することで、異常の有無を判定する異常判定部と、
を含むことを特徴とする異常検出装置。 - 前記異常判定部は、
前記領域毎に生成したそれぞれの前記勾配分布の中から、所定の度数基準を満たす勾配方向を分布のピークとして検出し、
検出した前記分布のピークと、予め設定される所定の異常閾値とに基づいて、異常の有無を判定する、
ことを特徴とする、請求項1に記載の異常検出装置。 - 前記異常判定部は、
前記領域毎に生成したそれぞれの前記勾配分布を平均化した平均勾配分布を生成し、
前記平均勾配分布において、所定の度数基準を満たす勾配方向を分布のピークとして検出し、
検出した前記分布のピークと、予め設定される所定の異常閾値とに基づいて、異常の有無を判定する、
ことを特徴とする、請求項1に記載の異常検出装置。 - 前記異常判定部は、
前記領域毎に生成したそれぞれの前記勾配分布の中から、第1の領域に対応する第1の勾配分布と、前記第1の領域に隣接する第2の領域に対応する第2の勾配分布とを抽出し、
前記第1の勾配分布と前記第2の勾配分布とを比較することで、前記第1の勾配分布と前記第2の勾配分布との分布乖離度を判定し、
判定した前記分布乖離度と、予め設定される所定の分布乖離度閾値とに基づいて、異常の有無を判定する、
ことを特徴とする、請求項1に記載の異常検出装置。 - 前記異常検出装置は、
前記異常判定部の異常の有無の判定により、異常が判定された場合、
異常と判定された領域を示す映像を含む異常通知を出力する出力部を更に含む、
ことを特徴とする、請求項1に記載の異常検出装置。 - 異常検出対象物は、
周期性のある模様を含み、
前記勾配分布生成部は、
前記入力映像を、前記周期性のある模様における少なくとも1周期が前記領域に収まる大きさの領域に分割する、
ことを特徴とする、請求項1に記載の異常検出装置。 - 異常検出方法であって、
前記異常検出方法は、
異常検出対象物を示す入力映像を入力する工程と、
前記入力映像を所定の大きさの領域に分割し、前記領域毎に、当該領域の輝度の勾配方向の分布を示す勾配分布を生成する工程と、
前記領域毎に生成したそれぞれの前記勾配分布の中から、第1の領域に対応する第1の勾配分布と、前記第1の領域に隣接する第2の領域に対応する第2の勾配分布とを抽出する工程、
前記第1の勾配分布と前記第2の勾配分布とを比較することで、前記第1の勾配分布と前記第2の勾配分布との分布乖離度を判定する工程と、
判定した前記分布乖離度と、予め設定される所定の分布乖離度閾値とに基づいて、異常の有無を判定する工程と、
異常の有無の判定により、異常が判定された場合、異常と判定された領域を示す映像を含む異常通知を出力する工程と、
を含むことを特徴とする異常検出方法。 - 異常検出対象物を撮影し、前記異常検出対象物を示す入力映像を取得するためのセンサ装置と、
前記異常検出対象物に関する異常検出処理を依頼するためのクライアント端末と、
前記異常検出対象物に関する異常検出処理を行うための異常検出装置とが通信ネットワークを介して接続されている異常検出システムであって、
前記異常検出装置は、
前記異常検出対象物を示す前記入力映像を前記センサ装置から入力する映像入力部と、
前記入力映像を所定の大きさの領域に分割し、前記領域毎に、当該領域の輝度の勾配方向の分布を示す勾配分布を生成する勾配分布生成部と、
前記領域毎に生成した前記勾配分布を解析することで、異常の有無を判定する異常判定部と、
前記異常判定部の異常の有無の判定により、異常が判定された場合、異常と判定された領域を示す映像を含む異常通知を前記クライアント端末に転送する出力部と、
を含むことを特徴とする異常検出システム。
Priority Applications (4)
| Application Number | Priority Date | Filing Date | Title |
|---|---|---|---|
| EP20955233.0A EP4220545A4 (en) | 2020-09-25 | 2020-09-25 | ANOMALY DETECTION DEVICE, ANOMALY DETECTION METHOD AND ANOMALY DETECTION SYSTEM |
| JP2022551522A JP7410323B2 (ja) | 2020-09-25 | 2020-09-25 | 異常検出装置、異常検出方法及び異常検出システム |
| US18/022,427 US12561783B2 (en) | 2020-09-25 | 2020-09-25 | Abnormality detection device, abnormality detection method, and abnormality detection system |
| PCT/JP2020/036301 WO2022064639A1 (ja) | 2020-09-25 | 2020-09-25 | 異常検出装置、異常検出方法及び異常検出システム |
Applications Claiming Priority (1)
| Application Number | Priority Date | Filing Date | Title |
|---|---|---|---|
| PCT/JP2020/036301 WO2022064639A1 (ja) | 2020-09-25 | 2020-09-25 | 異常検出装置、異常検出方法及び異常検出システム |
Publications (1)
| Publication Number | Publication Date |
|---|---|
| WO2022064639A1 true WO2022064639A1 (ja) | 2022-03-31 |
Family
ID=80846340
Family Applications (1)
| Application Number | Title | Priority Date | Filing Date |
|---|---|---|---|
| PCT/JP2020/036301 Ceased WO2022064639A1 (ja) | 2020-09-25 | 2020-09-25 | 異常検出装置、異常検出方法及び異常検出システム |
Country Status (4)
| Country | Link |
|---|---|
| US (1) | US12561783B2 (ja) |
| EP (1) | EP4220545A4 (ja) |
| JP (1) | JP7410323B2 (ja) |
| WO (1) | WO2022064639A1 (ja) |
Cited By (1)
| Publication number | Priority date | Publication date | Assignee | Title |
|---|---|---|---|---|
| CN115389624A (zh) * | 2022-10-27 | 2022-11-25 | 智能网联汽车(山东)协同创新研究院有限公司 | 一种加工用声波测试系统 |
Families Citing this family (3)
| Publication number | Priority date | Publication date | Assignee | Title |
|---|---|---|---|---|
| CN117611578B (zh) * | 2024-01-17 | 2024-06-11 | 深圳市新良田科技股份有限公司 | 一种图像处理方法及图像处理系统 |
| CN118552548B (zh) * | 2024-07-30 | 2024-10-25 | 江西省交通工程集团有限公司 | 一种基于图像数据分析的钢混组合梁质量检测方法及系统 |
| CN120912602B (zh) * | 2025-10-09 | 2026-01-27 | 江苏蔚蓝数智科技有限公司 | 基于计算机视觉的变压器铁芯检测方法 |
Citations (4)
| Publication number | Priority date | Publication date | Assignee | Title |
|---|---|---|---|---|
| JP2011096081A (ja) * | 2009-10-30 | 2011-05-12 | Fujitsu Ltd | 画像処理方法及び装置並びにプログラム |
| JP2014010544A (ja) * | 2012-06-28 | 2014-01-20 | Kyushu Institute Of Technology | 画像特徴抽出及び画像処理のためのシステム、方法及びプログラム |
| JP2019003575A (ja) * | 2017-06-20 | 2019-01-10 | 東日本旅客鉄道株式会社 | 画像分析装置及び鉄道設備部品の保守管理方法 |
| JP2020046928A (ja) * | 2018-09-19 | 2020-03-26 | キヤノン株式会社 | 情報処理装置、情報処理システム、情報処理方法及びプログラム |
Family Cites Families (6)
| Publication number | Priority date | Publication date | Assignee | Title |
|---|---|---|---|---|
| JP2009079979A (ja) * | 2007-09-26 | 2009-04-16 | Toppan Printing Co Ltd | 周期性パターン試料検査装置 |
| CN105574871A (zh) | 2015-12-16 | 2016-05-11 | 深圳市智影医疗科技有限公司 | 在放射图像中检测肺部局部性病变的分割分类方法和系统 |
| JP6932947B2 (ja) * | 2017-03-02 | 2021-09-08 | コニカミノルタ株式会社 | 不良画像発生予測システム及び不良画像発生予測プログラム |
| KR20190078685A (ko) * | 2017-12-13 | 2019-07-05 | (주) 엠투유테크널러지 | 점진적 군집화를 이용한 센서 데이터의 이상 패턴 감지 방법 |
| CN108109145A (zh) | 2018-01-02 | 2018-06-01 | 中兴通讯股份有限公司 | 图像质量检测方法、装置、存储介质和电子装置 |
| US11544499B2 (en) | 2018-09-18 | 2023-01-03 | Microsoft Technology Licensing, Llc | Classification of synthetic data tasks and orchestration of resource allocation |
-
2020
- 2020-09-25 US US18/022,427 patent/US12561783B2/en active Active
- 2020-09-25 JP JP2022551522A patent/JP7410323B2/ja active Active
- 2020-09-25 EP EP20955233.0A patent/EP4220545A4/en active Pending
- 2020-09-25 WO PCT/JP2020/036301 patent/WO2022064639A1/ja not_active Ceased
Patent Citations (4)
| Publication number | Priority date | Publication date | Assignee | Title |
|---|---|---|---|---|
| JP2011096081A (ja) * | 2009-10-30 | 2011-05-12 | Fujitsu Ltd | 画像処理方法及び装置並びにプログラム |
| JP2014010544A (ja) * | 2012-06-28 | 2014-01-20 | Kyushu Institute Of Technology | 画像特徴抽出及び画像処理のためのシステム、方法及びプログラム |
| JP2019003575A (ja) * | 2017-06-20 | 2019-01-10 | 東日本旅客鉄道株式会社 | 画像分析装置及び鉄道設備部品の保守管理方法 |
| JP2020046928A (ja) * | 2018-09-19 | 2020-03-26 | キヤノン株式会社 | 情報処理装置、情報処理システム、情報処理方法及びプログラム |
Non-Patent Citations (5)
| Title |
|---|
| AI IS THE KEY TO SOLVING THE PROBLEM OF HOW TO INSPECT TRANSMISSION LINES SPANNING A TOTAL LENGTH OF APPROXIMATELY 14,000 KM, 25 October 2018 (2018-10-25) |
| KUDO YOSHIYASU: "Fundamental development of monitoring for signal bonds", JR EAST TECHNICAL REVIEW, 1 January 2019 (2019-01-01), pages 25 - 28, XP055922172, Retrieved from the Internet <URL:https://www.jreast.co.jp/e/development/tech/pdf_39/tec-39-53-56eng.pdf> [retrieved on 20220517] * |
| NIKKEI BUSINESS, COUNTERMEASURES FOR BIG DATA AND AGING ELECTRIC CABLES IN LOT, 31 May 2017 (2017-05-31) |
| RYUICHI ISHINOFUJIO TSUTSUMIYOSHIYUKI UENO: "Detection of Damaged Cables Using Aerial Video for Inspection of Transmission Lines", TRANSACTIONS OF THE INSTITUTE OF ELECTRICAL ENGINEERS OF JAPAN B, vol. 126, no. 4, July 2006 (2006-07-01), pages 407 - 414 |
| See also references of EP4220545A4 |
Cited By (2)
| Publication number | Priority date | Publication date | Assignee | Title |
|---|---|---|---|---|
| CN115389624A (zh) * | 2022-10-27 | 2022-11-25 | 智能网联汽车(山东)协同创新研究院有限公司 | 一种加工用声波测试系统 |
| CN115389624B (zh) * | 2022-10-27 | 2023-02-10 | 智能网联汽车(山东)协同创新研究院有限公司 | 一种加工用声波测试系统 |
Also Published As
| Publication number | Publication date |
|---|---|
| US20230342903A1 (en) | 2023-10-26 |
| EP4220545A4 (en) | 2024-07-17 |
| JPWO2022064639A1 (ja) | 2022-03-31 |
| US12561783B2 (en) | 2026-02-24 |
| JP7410323B2 (ja) | 2024-01-09 |
| EP4220545A1 (en) | 2023-08-02 |
Similar Documents
| Publication | Publication Date | Title |
|---|---|---|
| JP7410323B2 (ja) | 異常検出装置、異常検出方法及び異常検出システム | |
| CN112669344B (zh) | 一种运动物体的定位方法、装置、电子设备及存储介质 | |
| JP7292979B2 (ja) | 画像処理装置及び画像処理方法 | |
| KR101548928B1 (ko) | 불변적인 시각적 장면 및 객체 인식 | |
| WO2022105019A1 (zh) | 一种车辆卡口设备抓拍质量评估方法、装置及可读介质 | |
| CN106839976B (zh) | 一种检测镜头中心的方法及装置 | |
| CN112101138B (zh) | 基于深度学习的桥梁拉索表面缺陷实时识别系统及方法 | |
| CN113255590A (zh) | 一种缺陷检测模型训练方法、缺陷检测方法、装置及系统 | |
| CN115639248A (zh) | 一种用于建筑外墙质量检测的系统及方法 | |
| CN114782822A (zh) | 电力设备的状态检测方法、装置、电子设备及存储介质 | |
| CN110462634A (zh) | 标志检测视频分析法 | |
| CN114581365A (zh) | 一种螺栓检测模型构建及螺栓松动检测方法 | |
| CN108286948A (zh) | 一种基于图像处理的桥梁挠度检测方法 | |
| US20150023599A1 (en) | Optical Match Character Classification | |
| US9747511B2 (en) | Image recognition device, image recognition method, program, and recording medium | |
| US20060067569A1 (en) | Image inspection device, image inspection method, and image inspection program | |
| CN114418968A (zh) | 一种基于深度学习的输电线路小目标缺陷检测方法 | |
| KR100734935B1 (ko) | 화상의 영역분할 | |
| CN113052089A (zh) | 一种表面裂纹的识别系统、方法、装置、设备及存储介质 | |
| JP4796535B2 (ja) | 画像処理による多導体電線の追跡方法、装置及びプログラム並びにこれを用いた多導体電線の異常検出方法、装置及びプログラム | |
| US9378428B2 (en) | Incomplete patterns | |
| WO2025138741A1 (zh) | 确定缆绳松紧状态的方法、装置、设备及存储介质 | |
| TW201809671A (zh) | 一種光流測速模組與其測速方法 | |
| KR20240109225A (ko) | 구조물 점검을 위한 제어 장치 및 그 동작 방법 | |
| JP2024179730A (ja) | 積雪判定装置、積雪判定方法及び積雪判定プログラム |
Legal Events
| Date | Code | Title | Description |
|---|---|---|---|
| 121 | Ep: the epo has been informed by wipo that ep was designated in this application |
Ref document number: 20955233 Country of ref document: EP Kind code of ref document: A1 |
|
| ENP | Entry into the national phase |
Ref document number: 2022551522 Country of ref document: JP Kind code of ref document: A |
|
| NENP | Non-entry into the national phase |
Ref country code: DE |
|
| ENP | Entry into the national phase |
Ref document number: 2020955233 Country of ref document: EP Effective date: 20230425 |
|
| WWG | Wipo information: grant in national office |
Ref document number: 18022427 Country of ref document: US |