WO2022085591A1 - 非破壊検査装置と非破壊検査方法 - Google Patents
非破壊検査装置と非破壊検査方法 Download PDFInfo
- Publication number
- WO2022085591A1 WO2022085591A1 PCT/JP2021/038273 JP2021038273W WO2022085591A1 WO 2022085591 A1 WO2022085591 A1 WO 2022085591A1 JP 2021038273 W JP2021038273 W JP 2021038273W WO 2022085591 A1 WO2022085591 A1 WO 2022085591A1
- Authority
- WO
- WIPO (PCT)
- Prior art keywords
- ratio
- detection position
- inspection object
- neutron
- forming portion
- Prior art date
- Legal status (The legal status is an assumption and is not a legal conclusion. Google has not performed a legal analysis and makes no representation as to the accuracy of the status listed.)
- Ceased
Links
Images


Classifications
-
- G—PHYSICS
- G01—MEASURING; TESTING
- G01N—INVESTIGATING OR ANALYSING MATERIALS BY DETERMINING THEIR CHEMICAL OR PHYSICAL PROPERTIES
- G01N23/00—Investigating or analysing materials by the use of wave or particle radiation, e.g. X-rays or neutrons, not covered by groups G01N3/00 – G01N17/00, G01N21/00 or G01N22/00
- G01N23/20—Investigating or analysing materials by the use of wave or particle radiation, e.g. X-rays or neutrons, not covered by groups G01N3/00 – G01N17/00, G01N21/00 or G01N22/00 by using diffraction of the radiation by the materials, e.g. for investigating crystal structure; by using scattering of the radiation by the materials, e.g. for investigating non-crystalline materials; by using reflection of the radiation by the materials
- G01N23/203—Measuring back scattering
- G01N23/204—Measuring back scattering using neutrons
-
- G—PHYSICS
- G01—MEASURING; TESTING
- G01N—INVESTIGATING OR ANALYSING MATERIALS BY DETERMINING THEIR CHEMICAL OR PHYSICAL PROPERTIES
- G01N23/00—Investigating or analysing materials by the use of wave or particle radiation, e.g. X-rays or neutrons, not covered by groups G01N3/00 – G01N17/00, G01N21/00 or G01N22/00
- G01N23/20—Investigating or analysing materials by the use of wave or particle radiation, e.g. X-rays or neutrons, not covered by groups G01N3/00 – G01N17/00, G01N21/00 or G01N22/00 by using diffraction of the radiation by the materials, e.g. for investigating crystal structure; by using scattering of the radiation by the materials, e.g. for investigating non-crystalline materials; by using reflection of the radiation by the materials
- G01N23/20008—Constructional details of analysers, e.g. characterised by X-ray source, detector or optical system; Accessories therefor; Preparing specimens therefor
-
- G—PHYSICS
- G01—MEASURING; TESTING
- G01N—INVESTIGATING OR ANALYSING MATERIALS BY DETERMINING THEIR CHEMICAL OR PHYSICAL PROPERTIES
- G01N23/00—Investigating or analysing materials by the use of wave or particle radiation, e.g. X-rays or neutrons, not covered by groups G01N3/00 – G01N17/00, G01N21/00 or G01N22/00
- G01N23/20—Investigating or analysing materials by the use of wave or particle radiation, e.g. X-rays or neutrons, not covered by groups G01N3/00 – G01N17/00, G01N21/00 or G01N22/00 by using diffraction of the radiation by the materials, e.g. for investigating crystal structure; by using scattering of the radiation by the materials, e.g. for investigating non-crystalline materials; by using reflection of the radiation by the materials
- G01N23/203—Measuring back scattering
-
- G—PHYSICS
- G01—MEASURING; TESTING
- G01N—INVESTIGATING OR ANALYSING MATERIALS BY DETERMINING THEIR CHEMICAL OR PHYSICAL PROPERTIES
- G01N2223/00—Investigating materials by wave or particle radiation
- G01N2223/30—Accessories, mechanical or electrical features
- G01N2223/316—Accessories, mechanical or electrical features collimators
-
- Y—GENERAL TAGGING OF NEW TECHNOLOGICAL DEVELOPMENTS; GENERAL TAGGING OF CROSS-SECTIONAL TECHNOLOGIES SPANNING OVER SEVERAL SECTIONS OF THE IPC; TECHNICAL SUBJECTS COVERED BY FORMER USPC CROSS-REFERENCE ART COLLECTIONS [XRACs] AND DIGESTS
- Y02—TECHNOLOGIES OR APPLICATIONS FOR MITIGATION OR ADAPTATION AGAINST CLIMATE CHANGE
- Y02E—REDUCTION OF GREENHOUSE GAS [GHG] EMISSIONS, RELATED TO ENERGY GENERATION, TRANSMISSION OR DISTRIBUTION
- Y02E30/00—Energy generation of nuclear origin
- Y02E30/30—Nuclear fission reactors
Definitions
- the present invention relates to an apparatus and a method for inspecting an inspection object using a neutron beam. More specifically, the present invention is based on a neutron beam incident on an inspection object made of, for example, concrete or steel, and as a result, scattered neutrons scattered inside the inspection object and returned. It relates to a device and a method for inspecting the presence or absence and type of defects in an object.
- Infrastructure structures such as airport runways, motorways (for example, highways), tunnels, and bridges (hereinafter referred to as infrastructure structures) may be defective due to their use and deterioration over time. For example, as defects, water retention points, iron rust, cavities, etc. may occur inside the infrastructure structure.
- Patent Document 1 discloses a technique for inspecting the presence or absence of such defects using a neutron beam.
- a pulsed neutron beam is applied to an inspection object such as an infrastructure structure, scattered neutrons scattered and returned in the inspection object are detected, and the number of scattered neutrons detected is expressed with respect to time.
- Detection number data is generated, and the presence or absence of defects inside the inspection object is determined based on the detection number data.
- an object of the present invention is to enable detection of even a small defect (for example, a defect of about 3 mm) in a non-destructive inspection of an inspection object.
- the non-destructive inspection device is A neutron irradiation device that irradiates a neutron beam to a local irradiation point on the surface of the inspection object, As a result of irradiating the irradiation point with the neutron beam, scattered neutrons returned from the inspection object are detected at each detection position facing the surface, and the number of scattered neutrons detected is measured at each detection position.
- a ratio calculation unit for obtaining and outputting the ratio of the number of detections at the detection position to the reference value of the detection position is provided. The reference value is set for each detection position as the number of detections when it is assumed that there are no defects in the inspection object.
- a neutron beam is applied to a local irradiation point on the surface of the inspection object.
- B As a result of the above (A), the scattered neutrons returned from the inspection object are detected at each detection position facing the surface, and the number of scattered neutrons detected is measured at each detection position.
- C For each detection position, the ratio calculation unit obtains and outputs the ratio of the number of detections at the detection position to the reference value of the detection position. The reference value is set for each detection position as the number of detections when it is assumed that there are no defects in the inspection object.
- a neutron beam is irradiated to a local irradiation point on the surface of the inspection target, and as a result, when scattered neutrons are returned from the inspection target, at each detection position facing the surface of the inspection target. Scattered neutrons are detected, and the number of scattered neutrons detected is measured at each detection position. Further, for each detection position, the ratio of the number of detections of the detection position to the reference value of the detection position is obtained.
- the defect causes one or both of the increase peak forming portion and the decreasing peak forming portion of the ratio. Therefore, even if the defect in the inspection target is small, the presence or absence of the defect can be detected based on the above ratio of each detection position.
- the configuration of the non-destructive inspection apparatus according to the embodiment of the present invention is shown. It is 1B-1B arrow view of FIG. 1A.
- the ratio distribution obtained when a low-density portion (for example, a void) is present inside the inspection object is schematically shown.
- the ratio distribution obtained when there is a stagnant part inside the inspection object is schematically shown.
- the cross section of the inspection object in Example 1 is shown. 5B-5B arrow view of FIG. 5A.
- the dimensions of each part in FIG. 5A are shown.
- Example 1 The two-dimensional distribution of the reference value in the case of selectively detecting thermal neutrons in Example 1 is shown.
- the one-dimensional distribution of the reference value in the case of selectively detecting thermal neutrons in Example 1 is shown.
- the two-dimensional distribution of the ratio in the detection plane when the thermal neutron is selectively detected in Example 1 is shown.
- the two-dimensional distribution of the ratio in the detection plane when the medium-speed neutron is selectively detected in Example 1 is shown.
- the inspection result in Example 1 is shown.
- the cross section of the inspection object in Example 2 is shown. 9B-9B arrow view of FIG. 9A.
- Example 2 the two-dimensional distribution of the ratio on the detection surface when the defect is a void is shown.
- Example 2 the x-axis direction distribution of the ratio on the detection surface when the defect is a void is shown.
- the values of Sp / Sn obtained by the beam scan when the defect is a void in Example 2 are shown.
- Example 2 the two-dimensional distribution of the ratio on the detection surface when the defect is water is shown.
- Example 2 the x-axis direction distribution of the ratio on the detection surface when the defect is water is shown.
- the value of Sn / Sp obtained by the beam scan when the defect is water in Example 2 is shown.
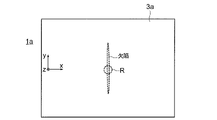
- FIG. 1A schematically shows the configuration of the non-destructive inspection device 10 according to the embodiment of the present invention.
- FIG. 1B is a view taken along the line 1B-1B of FIG. 1A.
- the non-destructive inspection device 10 irradiates the inspection object 1 with a neutron beam, and as a result, detects scattered neutrons returned from the inspection object 1, and based on the detection result, determines the presence or absence of defects, the type, and the like. It is a device for detection.
- the inspection target 1 may be the above-mentioned infrastructure structure or another structure.
- the inspection object 1 may be a structure containing one or both of concrete and a metal member such as a steel member (for example, a plurality or a plurality of metal members) as a component.
- the inspection object 1 may include an organic substance formed of polyethylene. This organic substance is, for example, a waterproof sheet or a cover (sheath) of an optical fiber cable provided in an inspection object 1 (for example, a structure forming a road surface).
- the non-destructive inspection device 10 includes a neutron irradiation device 2, a detection device 3, a ratio calculation unit 5, a data processing unit 7, a determination value calculation unit 8, and a determination unit 9.
- the neutron irradiation device 2 irradiates the local irradiation point R on the surface 1a of the inspection object 1 (substantially only to the irradiation point R) with a neutron beam.
- the irradiation point R may be an irradiation spot.
- the shape of the irradiation point R may be, for example, a circle, an ellipse, or a rectangle, but is not limited thereto.
- the size of the irradiation point R may be 100 mm or less, 70 mm or less, or 50 mm or less.
- the lower limit of the dimension of the irradiation point R may not be particularly limited, but may be as small as possible (for example, the lower limit may be a value within the range of 0.3 mm or more and 10 mm or less).
- the dimension of the irradiation point R is the dimension of the cross section of the neutron beam on the surface 1a. Further, the dimension of the irradiation point R may mean the smallest dimension among the dimensions in each direction of the cross section of the neutron beam on the surface 1a.
- the neutron irradiation device 2 has a neutron source 2a that emits neutrons and a collimator 2b.
- the neutron source 2a may, for example, have a target that emits neutrons when irradiated with a charged particle beam.
- the target may be, but is not limited to, lithium.
- the neutron source 2a may be a portable DD fusion reaction neutron source (DD tube).
- the neutron source 2a may be a radioactive source (RI (radioactive isotope) source) that emits neutrons.
- the radioactive source may be, but is not limited to, 252 Cf.
- the collimator 2b shapes the neutrons from the neutron source 2a into a neutron beam with a narrow cross section. By narrowing the cross section of the neutron beam in this way, the neutron beam is irradiated to the local irradiation point R on the surface 1a.
- the collimator 2b may be formed by partitioning the passage path through which the neutron beam passes with a material that is difficult for neutrons to pass through.
- the collimator 2b may be, for example, a cylindrical one in which the internal space is the above-mentioned passage path.
- the neutron irradiation device 2 may be configured to emit a pulsed neutron beam to the irradiation point R, or may be configured to emit a temporally continuous neutron beam to the irradiation point R as described later. May be good.
- the pulse time width of the pulsed neutron beam (duration of the neutron beam) is, for example, about 0.1 ms or smaller than 0.1 ms, and the repetition frequency of the pulsed neutron beam (inspection object 1).
- the irradiation frequency of the neutron beam to the neutron beam is, for example, about 100 Hz, but is not limited to this as long as it does not interfere with the presence / absence of defects and the detection of types.
- the neutron irradiation device 2 emits a pulsed neutron beam because the above-mentioned charged particle beam is a pulsed particle beam, but the neutron irradiation device 2 emits a pulsed neutron beam by another method. It may be configured in.
- the neutron beam emitted by the neutron irradiation device 2 to the irradiation point R may contain, for example, mainly fast neutrons, or may contain fast neutrons and thermal neutrons, or mainly heat. It may contain neutrons, but is not limited to these.
- the detection device 3 detects scattered neutrons returned from the inspection target as a result of irradiation of the irradiation point R with the neutron beam at each detection position (continuously arranged plurality) facing the surface 1a of the inspection target 1. It is detected at each of the detection positions of), and the number of scattered neutrons detected is measured at each detection position.
- the detection device 3 has a detection surface 3a1 on which scattered neutrons are incident. Each position on the detection surface 3a1 is each of the above-mentioned detection positions, and the number of detections at each detection position is the number of scattered neutrons incident on the detection position.
- the detection device 3 outputs the number of detections measured for each detection position to the ratio calculation unit 5.
- the detection surface 3a1 may have a rectangular shape as shown in FIG. 1B, or may have another shape.
- the detection surface 3a1 may be an elongated surface.
- the measurement of the number of detections by the detection device 3 may be performed over a predetermined time.
- This predetermined time is, for example, a period from immediately after the neutron irradiation device 2 irradiates the neutron beam until the number of scattered neutrons incident on the detection surface 3a1 per unit time decreases (for example, becomes less than or equal to the lower limit). It may be there.
- This predetermined time may be, for example, a value of 10 seconds or more and 10 minutes or less.
- the predetermined time is not limited to this, and when a defect such as a stagnant part or a low density part (for example, a void) is present in the inspection object 1, an increasing peak forming portion and a decreasing peak forming portion are formed in the ratio distribution described later. It suffices if at least one of the parts is set to occur.
- the number of detections may mean the number of neutrons detected over the predetermined time.
- the stagnant part may be a place where water is simply present, or in the case of the inspection object 1 containing metal, it is a place where metal rust (for example, iron rust) is progressing due to moisture. You may.
- the low density part is the part that is less dense than the normal part of the inspection object (if the inspection object is concrete, the low density part is the part that is less dense than the normal concrete part. ).
- the low density portion may be a portion of 1/3 or less, 1/5 or less, or 1/10 or less of the density of the normal portion of the inspection object.
- voids may be assumed as the low density portion.
- the present invention is not limited to this, and as the low-density portion, low-density wood mixed in the inspection object (for example, concrete) may be assumed, or other parts may be assumed.
- the detection device 3 has a detector 3a and a measurement unit 3b.
- the term “inspection” means when a neutron beam is applied to the irradiation point R on the surface 1a of the inspection object 1 in order to inspect the presence or absence of defects in the inspection object 1 (when performing step S3 described later). ) Means. Further, in the following, the inspection means inspecting the presence or absence of defects in the inspection object 1 by irradiating the neutron beam in this way (performing steps S3 to S8 or beam scanning described later).
- the detector 3a (detection surface 3a1) is arranged so as to face the surface 1a of the inspection object 1 at the time of inspection.
- a part of a large number of detection positions in the detector 3a (for example, the center of the detector 3a (detection surface 3a1)) faces the irradiation point R.
- the neutron beam from the neutron irradiation device 2 passes through the detector 3a (detection surface 3a1) and irradiates the surface 1a of the inspection object 1.
- the surface having a two-dimensional spread (for example, virtual) in the detector 3a is the above-mentioned detection surface 3a1.
- FIG. 1A shows an xyz coordinate system having x-axis, y-axis, and z-axis orthogonal to each other, and in the example of FIG. 1A, the detection surface 3a1 is parallel to the xy plane.
- the xyz coordinate system of FIG. 1A is for convenience of explanation, and in actual operation, any coordinate axis may indicate which direction (the same applies to the xyz coordinate system in other figures).
- the detector 3a (detection surface 3a1) is arranged at a position close to or in contact with the surface 1a.
- the position close to the surface 1a may be, for example, a position within 30 mm, within 50 mm, within 100 mm, or within 300 mm from the surface 1a, but is not limited thereto.
- the detection surface 3a1 may be parallel to the surface 1a of the inspection object 1.
- the detector 3a may be a position-sensitive detector (PSD: Position Sensitive Detector). Each time a neutron is incident on the detection surface 3a1, the detector 3a outputs a detection signal corresponding to the detection position of the detection surface 3a1 on which the neutron is incident.
- PSD Position Sensitive Detector
- the detector 3a may be configured to selectively detect thermal neutrons and not to detect neutrons other than thermal neutrons.
- the detector 3a may be a detector using a helium- 3 (3He) proportional coefficient tube, or may be a detector in which a scintillator containing lithium 6 ( 6 Li) and an optical sensor are combined. good.
- the detector 3a may be configured to selectively detect medium-speed neutrons and not to detect neutrons other than medium-speed neutrons.
- the detector 3a may be a detector in which a scintillator containing at least one of chlorine ( 35 Cl) and bromine ( 79 Br, 81 Br) and an optical sensor are combined.
- the detector 3a may be a detector in which a scintillator containing CLYC or LaBr 3 and an optical sensor are combined.
- the detector 3a is not limited to the above, and may be a detector in which a scintillator including, for example, 155 Gd, 157 Gd, 10 B, etc. and an optical sensor are combined. Further, each of the above-mentioned optical sensors may be a photomultiplier tube or a SiPM (Silicon Photomultiplier), but is not limited thereto.
- Thermal neutrons generally refer to neutrons having an energy value of around 25 meV or less at room temperature, and medium-speed neutrons have energies sufficiently higher than thermal neutrons (energy of several keV or more and less than several hundred keV). ), And fast neutrons indicate neutrons having several hundred keV or more.
- a thermal neutron may be a neutron having an energy of several tens of meV (for example, 50 meV) or less, and a medium-speed neutron is a medium-speed neutron.
- a neutron having an energy of several keV (for example, 5 keV) or more and an energy of several hundred keV (for example, 500 keV) or more, and a fast neutron may be a neutron having an energy of several hundred keV (for example, 500 keV) or more.
- the measuring unit 3b measures the number of scattered neutrons detected at each detection position based on a large number of detection signals output from the detector 3a.
- the measuring unit 3b may be incorporated in the above-mentioned optical sensor such as SiPM.
- the ratio calculation unit 5 obtains the ratio of the number of detections of the detection position to the reference value of the detection position (hereinafter, also simply referred to as a ratio) for each detection position in the detector 3a.
- the reference value is set for each detection position as the number of detections when it is assumed that the inspection object 1 does not have a defect. That is, the reference value is the number of detections obtained when the inspection object 1 having no defect is tentatively inspected.
- Such a reference value may differ depending on the detection position. That is, the reference value may differ between at least some of the detection positions.
- the reference value of each detection position on the detector 3a (detection surface 3a1) is set in advance according to the positional relationship between the irradiation point R and the detection position, the neutron scattering characteristic of the inspection object 1, and the like.
- the reference value of each detection position may be set for each irradiation point of the inspection object 1, or when the configuration (material) of the inspection object 1 is uniform, different irradiation points may be set. May be common to.
- the above-mentioned reference value may be preset for each detection position in the detector 3a as follows. That is, when the inspection object 1 having no defect is inspected under the following detection conditions (a) to (c), it is detected at each detection position of the detector 3a for a predetermined time.
- the number of neutrons (for example, the estimated number of detections) may be set as a reference value for the detection position.
- the positional relationship and the attitude relationship (orientation relationship) between the detector 3a (detection surface 3a1), the inspection object 1 (irradiation point R), and the neutron irradiation device 2 become a preset positional relationship and attitude relationship.
- the spectrum of the neutron beam emitted from the neutron irradiation device 2 to the inspection object 1 is defined.
- the spectrum of the neutron beam is the energy distribution of a large number of neutrons irradiated from the neutron irradiation device 2 to the inspection object 1 per unit time (for example, in the case of a pulsed neutron beam, in the pulse time width), and this distribution. In, for each energy, the number of neutrons having that energy is represented.
- the intensity of the neutron beam is defined.
- the intensity of the neutron beam is the number of neutrons irradiated from the neutron irradiation device 2 to the irradiation point R (or the unit area in the irradiation point R) in the inspection object 1 per unit time.
- one irradiation point R in the actual inspection object 1 (for example, the inspection object 1 in which the probability of existence of a defect is assumed to be low) is irradiated with neutrons.
- the device 2 irradiates neutrons, and the number of detections at each detection position in the detector 3a is obtained.
- the irradiation point R is changed and the same treatment is performed again.
- the number of detections of each detection position in the detector 3a is obtained for each of the plurality of irradiation points R.
- the average value of the plurality of detections of the detection position obtained for the plurality of irradiation points R is set as the reference value of the detection position.
- a specimen having the same composition (material, etc.) as the actual inspection object 1 for example, the inspection object 1 which is assumed to have a high probability of existence of defects
- the neutron irradiation device 2 irradiates the irradiation point R in the specimen with neutrons under the above detection conditions (a) to (c), and the detector 3a detects each detection position. The number is obtained, and the detected number is set as the reference value of the detected position.
- the number of detections obtained for each detection position of the detector 3a when the inspection object 1 having no defect is inspected is simulated. Obtain and set the number of detections as the reference value of the detection position. Such a simulation may be performed, for example, on the inspection object 1 which is assumed to have a high probability of existence of a defect.
- the reference value of each detection position on the detector 3a (detection surface 3a1) is , The detection position becomes smaller as the detection position moves away from the irradiation point of the neutron beam on the surface 1a (see, for example, FIGS. 6A and 6B described later).
- the reference value of each detection position in the detector 3a may be stored in the storage unit 6 of the non-destructive inspection device 10.
- the ratio calculation unit 5 calculates the ratio for each detection position in the detector 3a based on the reference value of the storage unit 6 and the above-mentioned number of detections.
- the data processing unit 7 performs data processing on the ratio of each detection position of the detector 3a output by the ratio calculation unit 5.
- the data processing unit 7 specifies an increasing peak forming portion and a decreasing peak forming portion of the ratio in the distribution of the ratio (hereinafter, also simply referred to as a ratio distribution) regarding the detection position on the detector 3a. Further, the data processing unit 7 obtains the size of the specified increasing peak forming portion and the size of the decreasing peak forming portion.
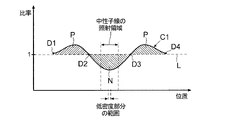
- FIGS. 2A and 2B show the case where a low-density portion (for example, a void) exists as a defect inside the inspection object 1
- FIGS. 2C and 2D show water as a defect inside the inspection object 1.
- Show the case. 2A and 2C show the case where the defect in the inspection object 1 exists on the extension line of the neutron beam irradiated to the inspection object 1
- FIGS. 2B and 2D show the case where the defect in the inspection object 1 exists in the inspection object 1.
- the defect in is present at a position deviated from the extension line of the neutron beam irradiated to the inspection object 1.
- the horizontal axis indicates the detection position (x coordinate) on the detector 3a in the x-axis direction (left-right direction) of FIG. 1A
- the vertical axis indicates the above ratio of the number of detections.
- the ratio distribution of FIGS. 2A to 2D shows the distribution at the same constant y-coordinate (see FIG. 1B) as the irradiation point R.
- 2A to 2D show the case where the number of detections is the number of detections of thermal neutrons.
- the tendency of the ratio distribution is the same as in FIGS. 2A to 2D.
- the decrease peak forming portion is a portion where the ratio is smaller than 1, and is a portion where a decrease peak (peak in the negative direction) of the ratio is formed.
- the increase peak forming portion is a portion where the ratio is larger than 1, and is a portion where an increase peak (positive direction peak) of the ratio is formed.
- the decreasing peak forming portion is a portion from the point D2 to the point D3 on the ratio curves C1 and C2 representing the ratio distribution
- the increasing peak forming portion is a point from the point D1 on the ratio curves C1 and C2.
- the decreasing peak forming portion is the portion from the point D1 to the point D2 on the ratio curves C3 and C4 and the portion from the point D3 to the point D4 on the ratio curves C3 and C4, and the increasing peak forming portion. Is a portion from the point D2 to the point D3 on the ratio curves C3 and C4.
- each "void” may be read as a low density portion.
- the defect existing inside the inspection object 1 is a low density portion, as shown in FIG. 2A, in the detector 3a, in the vicinity of the region facing the void (that is, near the same x coordinate as the void), in the ratio distribution. , A decrease in the ratio Peak formation part occurs.
- This decrease peak forming part is formed for the following reasons. Since the neutrons do not scatter in the voids, the neutrons irradiated to the inspection object 1 do not scatter from the voids to the detector 3a when passing through the voids to the side away from the surface 1a of the inspection object 1. .. Therefore, the number of scattered neutrons detected decreases in the vicinity of the region facing the void on the detection surface 3a1, and a reduced peak forming portion is generated. Further, the fast neutrons incident on the inspection object are converted into thermal neutrons while passing through the inspection object (for example, concrete), but the presence of voids in the inspection object 1 generates thermal neutrons accordingly. It means that it will disappear. Therefore, the number of detected scattered thermal neutrons decreases in the vicinity of the region facing the void on the detection surface 3a1.
- This increased peak forming part is formed for the following reasons. Scattered neutrons incident on the region adjacent to the region facing the void (decreased peak forming portion) on the detection surface 3a1 are scattered at a position deeper than the void and scattered through the void toward the adjacent region. Contains neutrons. This "scattered neutron that passes through the void" does not scatter in the other direction in the void, and is difficult to be absorbed by the inspection object (for example, concrete) due to the presence of the void. Therefore, the number of scattered neutrons detected increases in the adjacent region by that amount, so that the increased peak forming portion is generated.
- FIG. 2B even if the position of the void is slightly deviated from the extension line of the neutron beam irradiated to the irradiation point R, the same ratio distribution as in the case of FIG. 2A can be obtained.
- a relatively large increase peak forming portion is generated on the left side. This is because, in FIG. 2B, among the neutron beams incident on the inspection object 1, more scattered neutrons pass through the void and are detected at the position corresponding to the increasing peak forming portion on the left side.
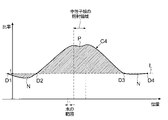
- the scattered neutrons incident on the region of the detection surface 3a1 facing the stagnant portion include the scattered neutrons from the stagnant portion.
- the scattered neutrons incident on the region of the detection surface 3a1 facing the stagnant portion include the scattered neutrons from the stagnant portion.
- many scattered neutrons from stagnant points are reacted with water to become thermal neutrons. Therefore, on the detection surface 3a1, the number of detected scattered thermal neutrons increases in the region facing the stagnant portion, so that an increased peak forming portion is generated.
- the reason why the dent in the negative direction is generated at the top of the increase peak forming portion is as follows.
- the number of thermal neutrons detected decreases in the center of the region of the detection surface 3a1 facing the stagnant portion, so that the above-mentioned depression occurs.
- the determination value calculation unit 8 receives the size of the increasing peak forming unit and the size of the decreasing peak forming unit from the data processing unit 7 as Sp and Sn, respectively.
- the determination value calculation unit 8 obtains the sum (Sp + Sn) of the size of the increasing peak forming portion and the size of the decreasing peak forming portion, and divides the size of the decreasing peak forming portion by the size of the increasing peak forming portion ( Sn / Sp) is calculated. Further, the determination value calculation unit 8 outputs the obtained Sp + Sn and Sn / Sp.
- Sp may be the sum of the sizes of the plurality of increased peak forming portions.
- Sn may be the sum of the sizes of the plurality of decreasing peak forming portions.
- the determination unit 9 determines the presence / absence of a defect and the type of defect in the inspection object 1 based on Sp + Sn and Sn / Sp output by the data processing unit 7.
- FIG. 3 shows a two-dimensional coordinate system for this determination. In FIG. 3, the horizontal axis represents Sp + Sn and the vertical axis represents Sn / Sp.
- the determination unit 9 makes a determination as follows. When Sp + Sn is equal to or less than the first threshold value, the determination unit 9 determines that there is no defect in the inspection object 1 and outputs a defect absence signal to that effect.
- the determination unit 9 determines that a defect exists in the inspection object 1 and outputs a defect existence signal to that effect.
- the signal may include information indicating the type of defect as follows.
- the determination unit 9 determines that a void exists in the inspection object 1, and to that effect.
- the first defect signal of is output.
- the determination unit 9 determines that water (water retention location) is present in the inspection object 1. Judgment is made, and a second defect signal to that effect is output.
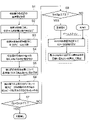
- FIG. 4 is a flowchart showing a non-destructive inspection method according to an embodiment of the present invention. This non-destructive inspection method is performed using the non-destructive inspection apparatus 10 described above, and includes steps S1 to S8.
- step S1 the reference value of each detection position of the detector 3a is set as described above.
- step S2 the neutron irradiation device 2 and the detector 3a are arranged with respect to the inspection object 1.
- step S3 the neutron irradiation device 2 causes the neutron beam to be incident on the local irradiation point R on the surface 1a of the inspection object 1.
- steps S2 and S3 are performed under the above-mentioned detection conditions (a) to (c).
- the traveling direction of the neutron beam irradiated to the irradiation point R may be a direction perpendicular to the surface 1a or an oblique direction with respect to the direction perpendicular to the surface 1a. ..
- step S4 as a result of step S3, the scattered neutrons returned from the inspection object 1 are detected by the detection device 3 at each detection position on the detection surface 3a1 facing the surface 1a, and the detection position is detected by the detection device 3. The number of scattered neutrons detected is measured each time.
- step S5 based on the reference value of each detection position set in step S1 and the number of detections of each detection position measured in step S4, the ratio calculation unit 5 detects the detection position on the detection surface 3a1. The ratio of the number of detected detection positions to the reference value of the position is calculated and output.
- step S6 the data processing unit 7 identifies an increasing peak forming portion and a decreasing peak forming portion of the ratio in the distribution regarding the detection position of the ratio calculated in step S5, and the size Sp and the decreasing peak of the increasing peak forming portion.
- the size Sn of the forming portion is obtained.
- step S7 the determination value calculation unit 8 obtains Sp + Sn, and the determination unit 9 determines whether or not there is a defect inside the inspection object 1 based on Sp + Sn.
- step S7 when Sp + Sn is equal to or less than the first threshold value T1, the determination unit 9 determines that there is no defect inside the inspection object 1 and outputs a defect absence signal to that effect.
- the determination unit 9 determines that a defect exists inside the inspection object 1 and proceeds to step S8.
- step S8 the determination value calculation unit 8 obtains Sn / Sp, and the determination unit 9 determines the type of defect based on Sn / Sp.
- step S8 when Sn / Sp is equal to or higher than the second threshold value T2, the determination unit 9 determines that a low-density portion (for example, a void) as a defect exists inside the inspection object 1 and determines that the inspection object 1 has a low density portion (for example, a void). The first defect signal to that effect is output.
- step S8 when Sn / Sp is less than the second threshold value T2, the determination unit 9 determines that water (water retention location) as a defect exists inside the inspection object 1. A second defect signal to that effect is output.
- step S8 the irradiation points R in step S3 may be changed and steps S3 to S6 may be repeated. That is, in step S3, the irradiation points R to which the neutron beam is incident on the surface 1a of the inspection object 1 are made to be different from each other between the repeated plurality of steps S3. In this case, a plurality of steps S3 may be performed so as to scan the inspection object 1 with a neutron beam.
- step S3 to S6 as one cycle, Sp / Sn or Sn / Sp is obtained from Sp and Sn obtained in step S6 of the cycle for each cycle.
- step S8 if it is determined in step S8 above that a low-density portion is present as a defect, Sp / Sn is obtained, and if it is determined in step S8 above that water is present as a defect, Sn / Sp is obtained. May be sought.
- the minimum Sp / Sn or Sn / Sp is specified.
- the irradiation point R corresponding to the specified minimum Sp / Sn or Sn / Sp (that is, the irradiation point R in the cycle in which the Sp / Sn or Sn / Sp was obtained) is the low density portion (void) or the water. Identify as the closest location to. Such a beam scan will be described in more detail in Example 2 described later.
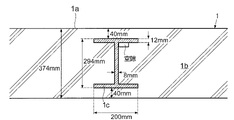
- FIG. 5A shows a cross section of the inspection object 1 inspected
- FIG. 5B is a view taken along the line 5B-5B of FIG. 5A.
- the inspection object 1 of FIG. 5A has a concrete 1b and an H steel 1c embedded inside the concrete 1b.
- FIG. 5C is a diagram showing the dimensions of each part in FIG. 5A.
- x, y, and z indicate an x-axis, a y-axis, and a z-axis that are orthogonal to each other in the xyz coordinate system.
- step S3 the irradiation point R shown in FIG. 5B was irradiated with a neutron beam composed of 108 neutrons.
- the irradiation point R is a square having a side of 50 mm (a region surrounded by a broken line indicated by the symbol R in FIG. 5B).
- FIGS. 6A and 6B show reference values used in step S5 for the case of selective detection of thermal neutrons. That is, FIGS. 6A and 6B are specific examples of the number of detections (that is, reference values) of each detection position in the detector 3a when there are no defects such as voids in the inspection object 1 of FIG. 5A.
- 6A and 6B show the distribution of reference values set using the specimen as described above when the detector 3a is a helium- 3 (3He) proportional coefficient tube.
- FIG. 6A shows the distribution of the reference values on the irradiation point R surrounded by the alternate long and short dash line and the surface having a two-dimensional spread (detection surface 3a1)
- FIG. 6B shows the center of the irradiation point R of the neutron beam on the surface 1a.
- the reference value (detection number) of each x-axis coordinate with respect to the same y-axis coordinate is shown.
- the reference value becomes smaller in the order of regions A to H.
- the reference value when shown as a rough value, is 2.7 ⁇ 10 3 / cm 2 or more in the area A, and 1.9 ⁇ 10 3 / cm 2 or more 2.7 ⁇ 10 3 in the area B.
- a cross mark indicates a reference value
- a circle mark, a square mark, and a triangle mark indicate the number of detections when the above-mentioned voids are present in FIG. 5A.
- These circles, squares, and triangles indicate the cases where the dimensions of the voids in the z-axis direction are 3 mm, 10 mm, and 30 mm, respectively.
- the marks of each type are substantially overlapped with each other at each position separated from the origin of the x-axis coordinates by about 200 mm or more, and the difference between them becomes smaller as the distance from the origin increases.
- the above experiment was performed using the detector 3a that selectively detects medium-speed neutrons under the same other conditions.
- the reference value the value when the medium-speed neutron was selectively detected was used.
- FIGS. 7A and 7B show a two-dimensional distribution of the ratio on the detection surface 3a1 when the dimension of the void in the z-axis direction is 10 mm.
- FIG. 7A shows a case where a detector 3a for selectively detecting thermal neutrons is used
- FIG. 7B shows a case where a detector 3a for selectively detecting medium-speed neutrons is used.
- the horizontal axis and the vertical axis indicate the coordinates of the x-axis and the y-axis shown in FIG. 5A, and the origin of each coordinate is the center of the irradiation point R.
- the broken line indicates the range in which the void exists when viewed in the z-axis direction.
- the rough distribution of the ratio on the detection surface 3a1 is shown by each region A to E surrounded by a solid line.
- the ratio is less than 0.93 in region A, 0.93 or more and less than 0.97 in region B, 0.97 or more and less than 1.00 in region C, and 1.00 or more and less than 1.00 in region D. It is less than 13.
- the region E is a region having a large error.
- the distribution of the rough ratio on the detection surface 3a1 is shown by each region A to D surrounded by a solid line.
- the ratio is less than 0.97 in region A, 0.97 or more and less than 1.00 in region B, 1.00 or more and less than 1.09 in region C, and 1.09 or more and less than 1.09 in region D. It is less than 19.
- the region E is a region having a large error.
- the existence of voids can be detected regardless of whether the neutrons to be detected are thermal neutrons or medium-speed neutrons.
- the neutrons to be detected are thermal neutrons or medium-speed neutrons.
- the Sp + Sn value is larger when medium-speed neutrons are detected. That is, the detection of medium-speed neutrons can increase the sensitivity of the Sp + Sn value to the presence of voids.
- FIG. 8 shows the values of Sp + Sn in each case in the above experiment.
- the horizontal axis represents the dimension of the void in the z-axis direction
- the vertical axis represents the obtained Sp + Sn value.
- a circle indicates a case where thermal neutrons are selectively detected
- a square mark indicates a case where medium-speed neutrons are selectively detected.
- Example 2 beam scan
- a detector 3a that selectively detects thermal neutrons was used.
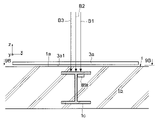
- 9A shows a cross section of the inspection object 1 subjected to the beam scan
- FIG. 9B is a view taken along the line 9B-9B of FIG. 9A.
- the inspection object 1 in FIG. 9A is the same as in the case of FIG. 5A, and the dimensions of each part are also the same as in the case of FIG. 5C.
- the dimensions of the void existing as a defect inside the inspection object 1 in the x-axis direction, the y-axis direction, and the z-axis direction are 50 mm, 300 mm, and 3 mm, respectively.
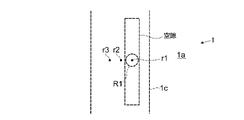
- steps S3 to S6 were regarded as one cycle of the beam scan, and in each of the three cycles (step S3), the surface 1a of the inspection object 1 was irradiated with the neutron beam. Further, the neutron beams irradiated in the three cycles are shown by B1 to B3 in FIG. 9A, respectively. Further, the irradiation site in the three cycles is a circle having a diameter of 40 mm.
- FIG. 9B shows the irradiation point R1 and its center r1 in the first cycle, the center r2 of the irradiation point in the second cycle, and the center r3 of the irradiation point in the third cycle.
- the z-axis direction dimension of the void was changed to 10 mm, and the other conditions were the same, and the above-mentioned beam scan was performed three times. Further, the z-axis direction dimension of the void was changed to 30 mm, and the other conditions were the same, and the above-mentioned beam scan was performed three times.
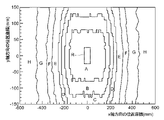
- FIG. 10 shows the result of the second cycle when the dimension of the void in the z-axis direction is 10 mm, and shows the two-dimensional distribution of the ratio on the detection surface 3a1.
- the horizontal axis and the vertical axis indicate the coordinates of the x-axis and the y-axis shown in FIG. 9A, and the origin of each coordinate is the above-mentioned center r2 (see FIG. 9B).
- the ellipse R shown by the broken line is the irradiation point, and another broken line indicates the range in which the void exists when viewed in the z-axis direction.
- the distribution of the rough ratio on the detection surface 3a1 is shown by each region A to D surrounded by a solid line.
- the ratio is less than 0.95
- the ratio is 0.95 or more and less than 1.00
- the ratio is 1.00 or more and less than 1.10
- the region D is. This is the area where the error is large.
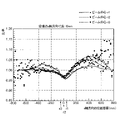
- FIG. 11 shows the result when the dimension of the void in the z-axis direction is 10 mm, and shows the x-axis direction distribution of the ratio on the detection surface 3a1.
- the horizontal axis indicates the position coordinates in the x-axis direction
- the vertical axis indicates the ratio (number of detections / reference value).
- the triangular mark indicates the case where the center of the irradiation point of the neutron beam on the surface 1a of the inspection object 1 is r1 in FIG. 9B
- the square mark indicates the case where the center is r2 in FIG. 9B.
- the circle indicates the case where the center is r3 in FIG. 9B.
- the ratio at each position coordinate shows the ratio at the same y-axis coordinate as the center of the irradiation point R1 of the neutron beam on the surface 1a.
- the obtained ratio has a large error, but on both ends of the position coordinates in the x-axis direction, as the distance from the center of the irradiation site increases. Tends to approach 1. Therefore, Sn and Sp may be obtained within a range of position coordinates in which the error does not exceed the permissible limit.
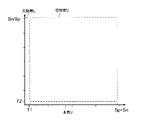
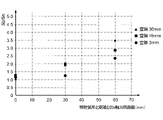
- FIG. 12 shows Sp / Sn values obtained by beam scanning.
- the horizontal axis shows the distance in the x-axis direction between the center of the irradiation point R and the center of the void
- the vertical axis shows the Sp / Sn value obtained in each cycle of the beam scan.
- Sn and Sp are obtained in the range of ⁇ 300 mm ⁇ x ⁇ 500 mm in consideration of the error.
- the circle mark indicates the case where the z-axis direction dimension of the void is 3 mm
- the square mark indicates the case where the z-axis direction dimension of the void is 10 mm
- the triangular mark indicates the z-axis direction dimension of the void. Is 30 mm.
- the irradiation point R in the cycle in which the minimum Sp / Sn was obtained is the closest to the void in the inspection object 1. Therefore, the irradiation point R corresponding to the minimum Sp / Sn can be specified as the point closest to the void. For example, when the surface 1a of the inspection object 1 is irradiated with a neutron beam from directly above the void in the inspection object 1, many neutrons pass through the void in the direction away from the surface 1a. Neutrons do not scatter toward the detector 3a in the void. As a result, it is considered that the number of detections is greatly reduced in the region directly above the void on the detection surface 3a1. In addition, thermal neutrons are not generated in the voids. Therefore, it is considered that the closer the irradiation point R is to the void (immediately above the void), the larger the Sn and the smaller the Sp / Sn.
- the above-mentioned beam scan was performed for the case where the defect is a water retention point instead of the void.
- the stagnant portion is at the same position as in the case of the above-mentioned void, and its dimensions in the x-axis direction, the y-axis direction, and the z-axis direction are 50 mm, 300 mm, and 10 mm, respectively.
- a detector 3a that selectively detects thermal neutrons was used.
- Other points are the same as in the above-mentioned beam scan in which the defect was a void.
- FIG. 13 shows a two-dimensional distribution of the ratio on the detection surface 3a1 obtained in the second cycle of such a beam scan.
- the horizontal axis and the vertical axis indicate the coordinates of the x-axis and the y-axis shown in FIG. 9A in which the void is replaced with the water retention point, and the origin of each coordinate is the center of the irradiation point R in the second cycle.
- the ellipse R shown by the broken line is the irradiation point
- another broken line shows the range in which the water retention point exists when viewed in the z-axis direction.
- the distribution of the ratio on the detection surface 3a1 is shown by each region A to D surrounded by a solid line.
- the ratio is roughly 1.20 or more in region A, 1.15 or more and less than 1.20 in region B, 1.10 or more and less than 1.15 in region C, and 1.05 in region D. It is less than 1.10, 1.00 or more and less than 1.05 in the region E, 0.90 or more and less than 1.00 in the region F, and the region G is a region having a large error.
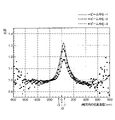
- FIG. 14 shows the x-axis direction distribution of the ratio on the detection surface 3a1.
- the horizontal axis indicates the position coordinates in the x-axis direction
- the vertical axis indicates the ratio (number of detections / reference value).
- the triangular mark indicates the case where the center of the irradiation point of the neutron beam on the surface 1a of the inspection object 1 is r1 in FIG. 9B
- the square mark indicates the case where the center is r2 in FIG. 9B.
- the circle indicates the case where the center is r3 in FIG. 9B.
- the ratio at each position coordinate shows the ratio at the same y-axis coordinate as the center of the irradiation point R of the neutron beam.
- the obtained ratio has a large error, but on both ends of the position coordinates in the x-axis direction, 1 as the distance from the center of the irradiation site increases. Tends to approach.
- FIG. 15 shows the Sn / Sp value obtained by the beam scan when the dimension in the z-axis direction is 10 mm with a square mark.
- the horizontal axis shows the distance in the x-axis direction between the center of the irradiation point R and the center of the stagnant part
- the vertical axis shows the Sn / Sp value obtained in each cycle of the beam scan.
- the irradiation point R in the cycle in which the minimum Sn / Sp is obtained is the closest to the water retention point in the inspection object 1. This is based on the following reasons. Neutrons tend to react with water in stagnant areas to become thermal neutrons. Therefore, it is considered that the closer the irradiation point R is to the water retention point (directly above the water retention point), the larger the number of thermal neutrons to be detected, and as a result, the Sp becomes larger and the Sn / Sp becomes smaller.
- the neutron beam is irradiated to the local irradiation point R on the surface 1a of the inspection object 1, and as a result, the number of scattered neutrons incident on the detection position is detected for each detection position on the detector 3a. It is measured as a number, and for each detection position, the ratio of the number of detections of the detection position to the reference value of the detection position is obtained.
- the ratio distribution regarding the detection position obtained in this way contains information indicating the presence / absence and type of defects. Therefore, the presence / absence and type of defects can be detected based on the ratio (ratio distribution) of each detection position in the detector 3a.
- the sizes of the increasing peak forming portion and the decreasing peak forming portion of the ratio in the ratio distribution are set to Sp and Sn, respectively, and when Sp + Sn is larger than the first threshold value T1, water or a low density portion (for example, a void) is used. ) Can be determined to be present.
- the irradiation point R as a local place (for example, a spot), when a defect exists in the inspection object 1, the above-mentioned increased peak forming portion and decreasing peak forming portion are more prominent in the ratio distribution. Is more likely to occur.
- the detector 3a When detecting the presence or absence of a low-density portion (for example, a void), the detector 3a selectively detects medium-speed neutrons, so that Sp + Sn having high sensitivity to the low-density portion can be obtained.
- a low-density portion for example, a void
- Sp / Sn or Sn / Sp can be obtained for each irradiation point R, and it can be determined that the irradiation point R corresponding to the minimum Sp / Sn or Sn / Sp is the closest to the low density part or the stagnant part. ..
- the present invention is not limited to the above-described embodiment, and it goes without saying that various modifications can be made within the scope of the technical idea of the present invention.
- the non-destructive inspection device 10 according to the embodiment of the present invention may not have all of the above-mentioned effects.
- the non-destructive inspection apparatus 10 according to the embodiment of the present invention may not have all of the above-mentioned plurality of components, or may have only a part of the above-mentioned plurality of components.
- any one of the following modified examples 1 to 8 may be adopted alone, or two or more of the modified examples 1 to 8 may be arbitrarily combined and adopted. In this case, the points not described below are the same as described above.
- the neutron irradiation device 2 irradiates the irradiation point R with the pulsed neutron beam, but the irradiation point R may be irradiated with the continuous neutron beam continuously in time.
- the detection device 3 has a time interval in which an increasing peak forming portion and a decreasing peak forming portion are generated in the above-mentioned ratio distribution when a defect such as a stagnant portion or a low density portion is present in the inspection object 1. Over (predetermined time), the number of detections at each detection position in the detector 3a may be measured.
- the non-destructive inspection device 10 may further include a display 11.
- the ratio calculation unit 5 may output the ratio of each detection position in the detector 3a to the display 11 as a ratio distribution regarding the detection position.
- the output ratio distribution is displayed on the display 11, and a person may determine the presence or absence and type of defects by looking at the displayed ratio distribution.
- the ratio distribution displayed on the display 11 is represented by a two-dimensional coordinate system having a coordinate axis indicating each detection position (for example, the x-axis of FIG. 1A) and a coordinate axis indicating the ratio, as shown in FIGS. 2A to 2D. It may be the one that has been done.
- the ratio distribution displayed on the display 11 is represented by a three-dimensional coordinate system having two coordinate axes (for example, x-axis and y-axis in FIG. 1A) indicating each detection position and orthogonal to each other and a coordinate axis indicating the ratio. It may be an orthogonal one.
- the ratio distribution displayed on the display 11 is the magnitude of the ratio at each detection position in the two-dimensional surface (detection surface 3a1) displayed on the display 11 as shown in FIGS. 7A and 7B. It may be represented by a plurality of compartments (for example, compartments A to E in FIG. 7A), colors, shades, and the like. It should be noted that the range of the ratio value is different from each other among the plurality of compartments, and the upper limit and the lower limit of the ratio range of each compartment may also be displayed on the display 11.
- the determination value calculation unit 8 may output Sp + Sn and Sn / Sp as the obtained determination values to the display 11.
- each output determination value is displayed on the display 11, and a person may determine the presence or absence or type of a defect by looking at each of the displayed determination values.
- the display 11 may further display the ratio distribution as described above.
- the display 11 when the display 11 is provided, only the determination value calculation unit 8 and the determination unit 9 may be omitted from the data processing unit 7, the determination value calculation unit 8, and the determination unit 9.
- the data processing unit 7 may output Sp and Sn to the display 11.
- the output Sp and Sn values are displayed on the display 11, and a person may determine the presence or absence and type of defects by looking at the displayed values.
- the display 11 may further display the ratio distribution as described above.
- the size of the increased peak forming portion in the ratio distribution is expressed by the area, but it may be the maximum value of the ratio (the peak value in the positive direction) in the increased peak forming portion.
- the size of the decreasing peak forming portion in the ratio distribution may be the minimum value (negative peak value) of the ratio in the decreasing peak forming portion.
- the ratio distribution (ratio of each detection position in the detector 3a) output by the ratio calculation unit 5 is a distribution represented with respect to one-dimensional coordinates (x coordinates) as shown in FIGS. 2A to 2D, that is, with the x-axis. It may be a distribution represented by a two-dimensional coordinate system having an axis of ratio, or a distribution represented by two-dimensional coordinates (x-axis coordinate and y-axis coordinate), that is, a ratio between x-axis and y-axis. It may be represented by a three-dimensional coordinate system having an axis of.
- the size of the decreasing peak forming portion may also be the volume of the region sandwiched between the portion where the ratio is 1 and the decreasing peak forming portion. That is, ⁇ ⁇ 1-f (x, y) ⁇ dxdy may be the size of the decreasing peak forming portion, as in the case of the increasing peak forming portion.
- the data processing unit 7 when the ratio distribution is represented by the two-dimensional coordinate system as described above, the data processing unit 7 generates a curve (for example, the ratio curve C1 in FIG. 2A) that approximates the ratio distribution in the two-dimensional coordinate system. , The above-mentioned Sp and Sn may be obtained based on the curve.
- the data processing unit 7 When the ratio distribution is represented by the three-dimensional coordinate system as described above, the data processing unit 7 generates a curved surface (for example, f (x, y) described above) that approximates the ratio distribution in the three-dimensional space. The above-mentioned Sp and Sn may be obtained based on the curved surface.
- step S8 was performed under the assumption that the defect in the inspection object 1 is either a low-density portion (for example, a void) or a stagnant portion (or iron rust), but this assumption is not made. If not, if the determination in step S7 is negative, it may be determined that another expected defect exists. For example, when the deterioration determination object (for example, the above-mentioned waterproof sheet or optical fiber cable) exists in the inspection object 1, if the determination in step S7 is negative, the deterioration determination object (for example, the waterproof sheet) is present.
- the deterioration determination object for example, the above-mentioned waterproof sheet or optical fiber cable
- the deterioration of the cover (sheath) of the optical fiber cable may be regarded as a defect, and it may be determined that such a defect exists. That is, it may be assumed that the negative determination result in step S7 indicates such deterioration.
- the detector 3a has a detection surface 3a1 having a two-dimensional spread, but the present invention is not limited thereto.
- the detector 3a may extend in a rod shape (for example, in the x-axis direction of FIG. 1A).
- a rod-shaped detector 3a has a plurality of (for example, a large number) detection positions arranged in a rod shape.
- the rod-shaped detector 3a may be used to perform steps S2 to S4 a plurality of times.
- the position of the detector 3a is different between the plurality of times, and the other conditions are the same.
- the number of detections at a large number of detection positions over a range having a two-dimensional spread may be acquired, and the ratio at each of these detection positions may be obtained as in step S5 described above.
- the presence or absence and type of defects may be determined as in steps S7 and S8 described above based on the ratio (ratio distribution) at these detection positions, or this ratio distribution may be displayed on the display 11. good.
- the position and orientation of the detector 3a at each time of steps S2 to S4 are input to the detector 3 by an appropriate means (for example, by operating an input device by a person), and the detector 3 is based on this input. May grasp the correspondence between each detection position and the number of detections.
- the detector 3a may be a point-shaped detector in which one detection position exists. In this case, steps S2 to S4 are performed many times. In this case, the position of the detector 3a is different among the multiple times, and the other conditions are the same. Thereby, the number of detections at a large number of detection positions over a range having a one-dimensional or two-dimensional spread may be acquired, and the ratio at each of these detection positions may be obtained. In this case, the other points are the same as in the case where steps S2 to S4 are performed a plurality of times using the rod-shaped detector 3a.
- the ratio calculation unit 5 may obtain the above-mentioned ratio by using the normalized reference value and the normalized number of detections as follows.
- the reference value of each detection position i (i is an identifier of the detection position; the same applies hereinafter) is detected at the detection position i as a result of injecting Na neutrons into the inspection object 1 in a state where there is no internal defect.
- the ratio calculation unit 5 calculates the ratio at each detection position i by Di / Ri.
- the above-mentioned Na and Nb may be different from each other, and the time for irradiating the inspection object 1 (irradiation point R) with the neutron beam in step S3 corresponds to the setting of the reference value. It may be different from the time (irradiation time of the neutron beam).
- the time for measuring the number of detected neutrons emitted in step S4 and the corresponding measurement time for setting the reference value are both the neutrons emitted from the inspection object 1 per unit time. It may be the time until the number of neutrons becomes sufficiently small (for example, substantially zero).
- Inspection object 1a Surface 1b Concrete 1c H steel 2 Neutron irradiation device 2a Neutron source 2b Collimeter 3 Detection device 3a Detector 3a 1 Detection surface 3b Measurement unit 5 Ratio calculation unit 6 Storage unit 7 Data processing unit 8 Judgment value calculation unit 9 Judgment Part 10 Non-destructive inspection device 11 Display R Irradiation point
Landscapes
- Chemical & Material Sciences (AREA)
- Crystallography & Structural Chemistry (AREA)
- Physics & Mathematics (AREA)
- Health & Medical Sciences (AREA)
- Life Sciences & Earth Sciences (AREA)
- Analytical Chemistry (AREA)
- Biochemistry (AREA)
- General Health & Medical Sciences (AREA)
- General Physics & Mathematics (AREA)
- Immunology (AREA)
- Pathology (AREA)
- Analysing Materials By The Use Of Radiation (AREA)
Abstract
Description
検査対象物の表面における局所的な照射箇所に中性子ビームを照射する中性子照射装置と、
前記照射箇所への前記中性子ビームの照射の結果、検査対象物から戻って来た散乱中性子を、前記表面に対向する各検出位置で検出し、検出位置毎に散乱中性子の検出数を計測する検出装置と、
各検出位置について、当該検出位置の基準値に対する当該検出位置の前記検出数の比率を求めて出力する比率算出部と、を備え、
前記基準値は、前記検査対象物に欠陥が存在しないと仮定した場合の検出数として前記検出位置毎に設定されている。
(A)検査対象物の表面における局所的な照射箇所に中性子ビームを照射し、
(B)前記(A)の結果、検査対象物から戻って来た散乱中性子を、前記表面に対向する各検出位置で検出し、検出位置毎に散乱中性子の検出数を計測し、
(C)各検出位置について、比率算出部により、当該検出位置の基準値に対する当該検出位置の前記検出数の比率を求めて出力し、
前記基準値は、前記検査対象物に欠陥が存在しないと仮定した場合の検出数として前記検出位置毎に設定されている。
図1Aは、本発明の実施形態による非破壊検査装置10の構成を模式的に示す。図1Bは、図1Aの1B-1B矢視図である。非破壊検査装置10は、中性子ビームを検査対象物1に照射し、その結果、検査対象物1から戻って来た散乱中性子を検出し、その検出結果に基づいて、欠陥の有無、種類などを検出するための装置である。
上述の基準値は、以下のように、検出器3aにおける検出位置毎に予め設定されていてよい。すなわち、以下の検出条件(a)~(c)の下で、欠陥が存在しない検査対象物1に対して検査を行った場合に、所定の時間にわたって検出器3aの各検出位置で検出される中性子の数(例えば推定される検出数)を、当該検出位置の基準値として設定してよい。
(b)中性子照射装置2から検査対象物1へ放出される中性子ビームのスペクトルが、定められたものとなっている。中性子ビームのスペクトルは、単位時間あたりに(例えば、パルス中性子ビームの場合には、パルス時間幅において)中性子照射装置2から検査対象物1に照射される多数の中性子のエネルギー分布であり、この分布において、各エネルギーについて、当該エネルギーを有する中性子の数が表される。
(c)中性子ビームの強度が、定められたものとなっている。中性子ビームの強度は、単位時間あたりに、中性子照射装置2から検査対象物1における照射箇所R(又は照射箇所Rにおける単位面積)に照射される中性子の数である。
図2A~図2Dは、検出位置に関する比率分布を示す比率曲線C1~C4を模式的に示している。
以下で、低密度部分の欠陥として空隙を想定して説明するが、以下の内容は、他の低密度部分の欠陥を想定する場合にも当てはまる。この場合、以下において、各「空隙」は、低密度部分に読み替えられてよい。
検査対象物1の内部に存在する欠陥が水(滞水箇所)である場合に、図2Cのように、比率分布において、滞水箇所に対向する領域付近(すなわち滞水箇所と同じx座標付近)では、比率の増大ピーク形成部が生じる。
図4は、本発明の実施形態による非破壊検査方法を示すフローチャートである。この非破壊検査方法は、上述の非破壊検査装置10を用いて行われ、ステップS1~S8を有する。
ステップS8の次に、ステップS3での照射箇所Rを変えてステップS3~S6を繰り返し行ってもよい。すなわち、ステップS3で検査対象物1の表面1aにおいて中性子ビームが入射する照射箇所Rを、繰り返される複数回のステップS3の間で互いに異なるようにする。この場合、検査対象物1を中性子ビームでスキャンするように複数回のステップS3を行ってよい。
欠陥としての空隙の位置と寸法が既知である検査対象物1(供試体)に対して非破壊検査装置10を用いて検査を行った。図5Aは、検査を行った検査対象物1の断面を示し、図5Bは、図5Aの5B-5B矢視図である。図5Aの検査対象物1は、コンクリート1bと、コンクリート1bの内部に埋め込まれているH鋼1cとを有する。図5Cは、図5Aにおける各部の寸法を記載した図である。
<欠陥が空隙の場合>
非破壊検査装置10を用いて上述のビームスキャンを行った。この実施例2では、熱中性子を選択的に検出する検出器3aを用いた。図9Aは、ビームスキャンを行った検査対象物1の断面を示し、図9Bは、図9Aの9B-9B矢視図である。図9Aの検査対象物1は、図5Aの場合と同じであり、各部の寸法も図5Cの場合と同じである。
図9Aにおいて、欠陥が空隙の代わりに滞水箇所である場合について、上述のビームスキャンを行った。このビームスキャンでは、滞水箇所は、上述の空隙の場合と同じ位置にあり、そのx軸方向とy軸方向とz軸方向の寸法は、それぞれ、50mmと300mmと10mmである。また、このビームスキャンでは、熱中性子を選択的に検出する検出器3aを用いた。他の点は、欠陥が空隙であった上述のビームスキャンの場合と同じである。
上述のように、検査対象物1の表面1aにおける局所的な照射箇所Rに中性子ビームを照射し、その結果、検出器3a上の検出位置毎に当該検出位置へ入射した散乱中性子の数を検出数として計測し、各検出位置について、当該検出位置の基準値に対する当該検出位置の検出数の比率を求める。このように得た、検出位置に関する比率分布は、欠陥の有無や種類を示す情報が含まれている。したがって、検出器3aにおける各検出位置の比率(比率分布)に基づいて、欠陥の有無や種類を検出できる。
上述では、中性子照射装置2は、パルス中性子ビームを照射箇所Rに照射したが、時間的に連続する連続中性子ビームを照射箇所Rに照射してもよい。この場合、検出装置3は、検査対象物1内に滞水箇所又は低密度部分等の欠陥が存在する場合に上述した比率分布において増大ピーク形成部と減少ピーク形成部が生じるようになる時間区間(所定の時間)わたって、検出器3aにおける各検出位置での検出数を計測してよい。
欠陥の種類を判定しない場合には、判定値算出部8は、Sn/Spを算出しなくてもよい。
上述では説明しなかったが、図1Aに示すように、非破壊検査装置10は、ディスプレイ11を更に備えていてもよい。
上述では、比率分布における増大ピーク形成部の大きさは、面積で表されたが、増大ピーク形成部における比率の最大値(正方向のピーク値)であってもよい。この場合、比率分布における減少ピーク形成部の大きさは、減少ピーク形成部における比率の最小値(負方向のピーク値)であってもよい。
比率算出部5が出力する比率分布(検出器3aにおける各検出位置の比率)は、図2A~図2Dのように1次元座標(x座標)に対して表される分布、すなわち、x軸と比率の軸を有する2次元座標系で表される分布であってもよいし、2次元座標(x軸座標とy軸座標)に対して表される分布、すなわち、x軸とy軸と比率の軸を有する3次元座標系で表されるものであってもよい。
上述のステップS8は、検査対象物1内の欠陥が低密度部分(例えば空隙)と滞水箇所(あるいは鉄錆)のいずれかであるとの想定の下で行われたが、当該想定がなされない場合には、ステップS7での判定が否定となったら、想定される他の欠陥が存在すると判定してもよい。例えば、検査対象物1内に劣化判定対象物(例えば、上述した防水シート又は光ファイバーケーブル)が存在する場合には、ステップS7での判定が否定となったら、劣化判定対象物(例えば、防水シート又は光ファイバーケーブルの覆い(シース))の劣化を欠陥として、このような欠陥が存在すると判定してもよい。すなわち、ステップS7での否定の判定結果が、このような劣化を示していると仮定してもよい。
上述では、検出器3aは、2次元的な広がりを有する検出面3a1を有するものであったが、本発明は、これに限定されない。例えば、検出器3aは、棒状に(例えば図1Aのx軸方向)に延びていてもよい。この場合、このような棒状の検出器3aには、棒状に配列された複数(例えば多数)の検出位置が存在する。棒状の検出器3aを用いて、ステップS2~S4を行うことにより、1次元的な(棒状の)広がりを有する範囲にわたる多数の検出位置での検出数が取得される。
比率算出部5は、以下のように、正規化された基準値と正規化された検出数とを用いて上述の比率を求めてもよい。
1a 表面
1b コンクリート
1c H鋼
2 中性子照射装置
2a 中性子源
2b コリメータ
3 検出装置
3a 検出器
3a1 検出面
3b 計測部
5 比率算出部
6 記憶部
7 データ処理部
8 判定値算出部
9 判定部
10 非破壊検査装置
11 ディスプレイ
R 照射箇所
Claims (11)
- 検査対象物の表面における局所的な照射箇所に中性子ビームを照射する中性子照射装置と、
前記照射箇所への前記中性子ビームの照射の結果、検査対象物から戻って来た散乱中性子を、前記表面に対向する各検出位置で検出し、検出位置毎に散乱中性子の検出数を計測する検出装置と、
各検出位置について、当該検出位置の基準値に対する当該検出位置の前記検出数の比率を求めて出力する比率算出部と、を備え、
前記基準値は、前記検査対象物に欠陥が存在しないと仮定した場合の検出数として前記検出位置毎に設定されている、非破壊検査装置。 - 前記照射箇所は照射スポットである、請求項1に記載の非破壊検査装置。
- 前記中性子照射装置は、中性子を放出する中性子源と、中性子源からの中性子を断面が絞られた中性子ビームに整形するコリメータとを有する、請求項1又は2に記載の非破壊検査装置。
- 検出位置に関する前記比率の分布を表示するディスプレイを備える、請求項1~3のいずれか一項に記載の非破壊検査装置。
- 各検出位置の前記比率に対してデータ処理を行うデータ処理部を備え、
前記データ処理部は、
検出位置に関する前記比率の分布において、前記比率の増大ピーク形成部と減少ピーク形成部を特定し、
前記増大ピーク形成部の大きさと前記減少ピーク形成部の大きさを求めて出力する、請求項1~4のいずれか一項に記載の非破壊検査装置。 - 前記増大ピーク形成部の大きさをSpとし、前記減少ピーク形成部の大きさをSnとした場合に、Sp+SnとSn/Spを判定値として求めて出力する判定値算出部を備える、請求項5に記載の非破壊検査装置。
- 前記判定値算出部が出力したSp+SnとSn/Spに基づいて、検査対象物における欠陥の有無と欠陥の種類を判定する判定部を備え、
前記判定部は、
Sp+Snが第1しきい値T1以下である場合には、欠陥不存在信号を出力し、
Sp+Snが前記第1しきい値T1よりも大きく、且つ、Sn/Spが第2しきい値T2以上である場合には、第1欠陥信号を出力し、
Sp+Snが前記第1しきい値T1よりも大きく、且つ、Sn/Spが前記第2しきい値T2未満である場合には、第2欠陥信号を出力する、請求項6に記載の非破壊検査装置。 - 前記増大ピーク形成部の大きさをSpとし、前記減少ピーク形成部の大きさをSnとした場合に、Sp+Snを判定値として求めて出力する判定値算出部と、
Sp+Snが第1しきい値T1より大きい場合には、欠陥存在信号を出力する判定部と、を備える、請求項5に記載の非破壊検査装置。 - 前記検出装置は、各検出位置で、散乱中性子である熱中性子と中速中性子の一方を選択的に検出し、検出位置毎に当該一方の検出数を計測する、請求項1~8のいずれか一項に記載の非破壊検査装置。
- (A)検査対象物の表面における局所的な照射箇所に中性子ビームを照射し、
(B)前記(A)の結果、検査対象物から戻って来た散乱中性子を、前記表面に対向する各検出位置で検出し、検出位置毎に散乱中性子の検出数を計測し、
(C)各検出位置について、比率算出部により、当該検出位置の基準値に対する当該検出位置の前記検出数の比率を求めて出力し、
前記基準値は、前記検査対象物に欠陥が存在しないと仮定した場合の検出数として前記検出位置毎に設定されている、非破壊検査方法。 - (D)検出位置に関する前記比率の分布において、前記比率の増大ピーク形成部と減少ピーク形成部を特定し、前記増大ピーク形成部の大きさと前記減少ピーク形成部の大きさをそれぞれSpとSnとして求め、Sp/Sn又はSn/Spを求め、
前記(A)において中性子ビームを入射する照射箇所を変えて、前記(A)~(D)を繰り返し行い、
複数回の前記(D)でそれぞれ求めた複数のSp/Sn又はSn/Spのうち最も小さい値に対応する前記照射箇所を、欠陥としての低密度部分又は滞水箇所に最も近い箇所として特定し、
前記低密度部分は、検査対象物の正常な部分よりも密度が低い部分である、請求項10に記載の非破壊検査方法。
Priority Applications (3)
| Application Number | Priority Date | Filing Date | Title |
|---|---|---|---|
| US18/031,745 US12259340B2 (en) | 2020-10-19 | 2021-10-15 | Nondestructive inspecting device, and nondestructive inspecting method |
| JP2022557487A JP7804328B2 (ja) | 2020-10-19 | 2021-10-15 | 非破壊検査装置と非破壊検査方法 |
| EP21882732.7A EP4231002A4 (en) | 2020-10-19 | 2021-10-15 | NON-DESTRUCTIVE TESTING DEVICE AND NON-DESTRUCTIVE TESTING METHOD |
Applications Claiming Priority (2)
| Application Number | Priority Date | Filing Date | Title |
|---|---|---|---|
| JP2020175252 | 2020-10-19 | ||
| JP2020-175252 | 2020-10-19 |
Publications (1)
| Publication Number | Publication Date |
|---|---|
| WO2022085591A1 true WO2022085591A1 (ja) | 2022-04-28 |
Family
ID=81290430
Family Applications (1)
| Application Number | Title | Priority Date | Filing Date |
|---|---|---|---|
| PCT/JP2021/038273 Ceased WO2022085591A1 (ja) | 2020-10-19 | 2021-10-15 | 非破壊検査装置と非破壊検査方法 |
Country Status (4)
| Country | Link |
|---|---|
| US (1) | US12259340B2 (ja) |
| EP (1) | EP4231002A4 (ja) |
| JP (1) | JP7804328B2 (ja) |
| WO (1) | WO2022085591A1 (ja) |
Cited By (1)
| Publication number | Priority date | Publication date | Assignee | Title |
|---|---|---|---|---|
| JP2023049629A (ja) * | 2021-09-29 | 2023-04-10 | 国立研究開発法人理化学研究所 | 合成床版の非破壊検査装置と非破壊検査方法 |
Citations (8)
| Publication number | Priority date | Publication date | Assignee | Title |
|---|---|---|---|---|
| US2549176A (en) * | 1947-05-31 | 1951-04-17 | Texas Co | Detection of scattered neutrons |
| JPH04504310A (ja) * | 1990-01-10 | 1992-07-30 | サイエンス・アプリケーションズ・インターナショナル・コーポレーション | 高速中性子放射化を使用した禁輸品を検出する装置および方法 |
| US20060226369A1 (en) * | 2003-03-14 | 2006-10-12 | Pedersen Hald N | Method and an aparatus for detecting water on a ship's deck |
| WO2017043581A1 (ja) | 2015-09-09 | 2017-03-16 | 国立研究開発法人理化学研究所 | 非破壊検査装置と方法 |
| CN110320564A (zh) * | 2019-06-03 | 2019-10-11 | 中国工程物理研究院核物理与化学研究所 | 一种基于概率矩阵溯源的中子背散射塑性地雷成像方法 |
| CN110333547A (zh) * | 2019-07-24 | 2019-10-15 | 中国工程物理研究院核物理与化学研究所 | 一种用于塑性地雷探测的中子背散射成像装置 |
| JP2019190848A (ja) * | 2018-04-18 | 2019-10-31 | キヤノン電子管デバイス株式会社 | 放射線位置検出器 |
| JP2020139806A (ja) * | 2019-02-27 | 2020-09-03 | 株式会社トプコン | 非破壊検査システム及び非破壊検査方法 |
Family Cites Families (1)
| Publication number | Priority date | Publication date | Assignee | Title |
|---|---|---|---|---|
| JP7223992B2 (ja) * | 2019-02-27 | 2023-02-17 | 株式会社トプコン | 非破壊検査システム及び非破壊検査方法 |
-
2021
- 2021-10-15 EP EP21882732.7A patent/EP4231002A4/en active Pending
- 2021-10-15 WO PCT/JP2021/038273 patent/WO2022085591A1/ja not_active Ceased
- 2021-10-15 US US18/031,745 patent/US12259340B2/en active Active
- 2021-10-15 JP JP2022557487A patent/JP7804328B2/ja active Active
Patent Citations (8)
| Publication number | Priority date | Publication date | Assignee | Title |
|---|---|---|---|---|
| US2549176A (en) * | 1947-05-31 | 1951-04-17 | Texas Co | Detection of scattered neutrons |
| JPH04504310A (ja) * | 1990-01-10 | 1992-07-30 | サイエンス・アプリケーションズ・インターナショナル・コーポレーション | 高速中性子放射化を使用した禁輸品を検出する装置および方法 |
| US20060226369A1 (en) * | 2003-03-14 | 2006-10-12 | Pedersen Hald N | Method and an aparatus for detecting water on a ship's deck |
| WO2017043581A1 (ja) | 2015-09-09 | 2017-03-16 | 国立研究開発法人理化学研究所 | 非破壊検査装置と方法 |
| JP2019190848A (ja) * | 2018-04-18 | 2019-10-31 | キヤノン電子管デバイス株式会社 | 放射線位置検出器 |
| JP2020139806A (ja) * | 2019-02-27 | 2020-09-03 | 株式会社トプコン | 非破壊検査システム及び非破壊検査方法 |
| CN110320564A (zh) * | 2019-06-03 | 2019-10-11 | 中国工程物理研究院核物理与化学研究所 | 一种基于概率矩阵溯源的中子背散射塑性地雷成像方法 |
| CN110333547A (zh) * | 2019-07-24 | 2019-10-15 | 中国工程物理研究院核物理与化学研究所 | 一种用于塑性地雷探测的中子背散射成像装置 |
Non-Patent Citations (1)
| Title |
|---|
| See also references of EP4231002A4 |
Cited By (2)
| Publication number | Priority date | Publication date | Assignee | Title |
|---|---|---|---|---|
| JP2023049629A (ja) * | 2021-09-29 | 2023-04-10 | 国立研究開発法人理化学研究所 | 合成床版の非破壊検査装置と非破壊検査方法 |
| JP7691698B2 (ja) | 2021-09-29 | 2025-06-12 | 国立研究開発法人理化学研究所 | 合成床版の非破壊検査方法 |
Also Published As
| Publication number | Publication date |
|---|---|
| JP7804328B2 (ja) | 2026-01-22 |
| US20230393082A1 (en) | 2023-12-07 |
| EP4231002A1 (en) | 2023-08-23 |
| JPWO2022085591A1 (ja) | 2022-04-28 |
| US12259340B2 (en) | 2025-03-25 |
| EP4231002A4 (en) | 2024-04-24 |
Similar Documents
| Publication | Publication Date | Title |
|---|---|---|
| CN101506688B (zh) | 散射衰减断层成像 | |
| JP7735001B2 (ja) | 非破壊検査方法と装置 | |
| JP6712418B2 (ja) | 非破壊検査装置と方法 | |
| JP5347896B2 (ja) | 非破壊検査方法及びその装置 | |
| WO2020175654A1 (ja) | 非破壊検査システム及び非破壊検査方法 | |
| Priyada et al. | Intercomparison of gamma scattering, gammatography, and radiography techniques for mild steel nonuniform corrosion detection | |
| JP7804328B2 (ja) | 非破壊検査装置と非破壊検査方法 | |
| Silva et al. | Tube defects inspection technique by using Compton gamma-rays backscattering | |
| WO2011046148A1 (ja) | 非破壊検査方法及びその装置 | |
| US8976936B1 (en) | Collimator for backscattered radiation imaging and method of using the same | |
| JP7223992B2 (ja) | 非破壊検査システム及び非破壊検査方法 | |
| JP6518939B2 (ja) | コンクリート構造物の水分推定方法及びコンクリート構造物の水分推定システム | |
| JP7691698B2 (ja) | 合成床版の非破壊検査方法 | |
| JP5030056B2 (ja) | 非破壊検査方法及び装置 | |
| JP6598205B2 (ja) | 非破壊検査方法および装置 | |
| Stepanov et al. | Application of gamma-ray imager for non-destructive testing | |
| Tondon et al. | A Compton scattering technique to determine wood density and locating defects in it | |
| CZ308631B6 (cs) | Způsob nedestruktivního zkoumání vrstevnaté struktury | |
| Tanaka | Monte Carlo modeling of a cosmic ray imaging system for non-destructive evaluation of a reinforced concrete column | |
| Bose et al. | Gamma scattering scanning of concrete block for detection of voids | |
| Zhuravskiy et al. | Analysis of the Aperture Function of the Scattering Volume of the Collimation System of the Scattering Computed Tomography of Steel Products with a Ring Detector | |
| RU2502087C2 (ru) | Способ обнаружения объектов ядерных технологий радиозондированием | |
| Boldo et al. | Positioning of steel rods inclusions in reinforced concrete simulant by Compton backscattering | |
| JP2006177798A (ja) | 陽電子消滅を利用した非破壊検査法 | |
| Shivaramu et al. | 5th Pan American Conference for NDT |
Legal Events
| Date | Code | Title | Description |
|---|---|---|---|
| 121 | Ep: the epo has been informed by wipo that ep was designated in this application |
Ref document number: 21882732 Country of ref document: EP Kind code of ref document: A1 |
|
| ENP | Entry into the national phase |
Ref document number: 2022557487 Country of ref document: JP Kind code of ref document: A |
|
| WWE | Wipo information: entry into national phase |
Ref document number: 18031745 Country of ref document: US |
|
| NENP | Non-entry into the national phase |
Ref country code: DE |
|
| ENP | Entry into the national phase |
Ref document number: 2021882732 Country of ref document: EP Effective date: 20230519 |
|
| WWG | Wipo information: grant in national office |
Ref document number: 18031745 Country of ref document: US |