WO2022149425A1 - 繊維を含む製品の画像の解析方法、そのプログラムおよび解析装置 - Google Patents
繊維を含む製品の画像の解析方法、そのプログラムおよび解析装置 Download PDFInfo
- Publication number
- WO2022149425A1 WO2022149425A1 PCT/JP2021/046269 JP2021046269W WO2022149425A1 WO 2022149425 A1 WO2022149425 A1 WO 2022149425A1 JP 2021046269 W JP2021046269 W JP 2021046269W WO 2022149425 A1 WO2022149425 A1 WO 2022149425A1
- Authority
- WO
- WIPO (PCT)
- Prior art keywords
- fiber
- particles
- analysis
- fibers
- analysis method
- Prior art date
- Legal status (The legal status is an assumption and is not a legal conclusion. Google has not performed a legal analysis and makes no representation as to the accuracy of the status listed.)
- Ceased
Links
Images




Classifications
-
- G—PHYSICS
- G06—COMPUTING OR CALCULATING; COUNTING
- G06T—IMAGE DATA PROCESSING OR GENERATION, IN GENERAL
- G06T7/00—Image analysis
- G06T7/70—Determining position or orientation of objects or cameras
- G06T7/73—Determining position or orientation of objects or cameras using feature-based methods
-
- G—PHYSICS
- G01—MEASURING; TESTING
- G01N—INVESTIGATING OR ANALYSING MATERIALS BY DETERMINING THEIR CHEMICAL OR PHYSICAL PROPERTIES
- G01N33/00—Investigating or analysing materials by specific methods not covered by groups G01N1/00 - G01N31/00
- G01N33/36—Textiles
-
- G—PHYSICS
- G06—COMPUTING OR CALCULATING; COUNTING
- G06T—IMAGE DATA PROCESSING OR GENERATION, IN GENERAL
- G06T17/00—Three-dimensional [3D] modelling for computer graphics
-
- G—PHYSICS
- G06—COMPUTING OR CALCULATING; COUNTING
- G06T—IMAGE DATA PROCESSING OR GENERATION, IN GENERAL
- G06T7/00—Image analysis
- G06T7/0002—Inspection of images, e.g. flaw detection
- G06T7/0004—Industrial image inspection
-
- G—PHYSICS
- G06—COMPUTING OR CALCULATING; COUNTING
- G06T—IMAGE DATA PROCESSING OR GENERATION, IN GENERAL
- G06T7/00—Image analysis
- G06T7/60—Analysis of geometric attributes
-
- G—PHYSICS
- G06—COMPUTING OR CALCULATING; COUNTING
- G06T—IMAGE DATA PROCESSING OR GENERATION, IN GENERAL
- G06T7/00—Image analysis
- G06T7/60—Analysis of geometric attributes
- G06T7/64—Analysis of geometric attributes of convexity or concavity
-
- G—PHYSICS
- G06—COMPUTING OR CALCULATING; COUNTING
- G06T—IMAGE DATA PROCESSING OR GENERATION, IN GENERAL
- G06T7/00—Image analysis
- G06T7/70—Determining position or orientation of objects or cameras
-
- G—PHYSICS
- G06—COMPUTING OR CALCULATING; COUNTING
- G06T—IMAGE DATA PROCESSING OR GENERATION, IN GENERAL
- G06T2200/00—Indexing scheme for image data processing or generation, in general
- G06T2200/04—Indexing scheme for image data processing or generation, in general involving 3D image data
-
- G—PHYSICS
- G06—COMPUTING OR CALCULATING; COUNTING
- G06T—IMAGE DATA PROCESSING OR GENERATION, IN GENERAL
- G06T2207/00—Indexing scheme for image analysis or image enhancement
- G06T2207/10—Image acquisition modality
- G06T2207/10028—Range image; Depth image; 3D point clouds
-
- G—PHYSICS
- G06—COMPUTING OR CALCULATING; COUNTING
- G06T—IMAGE DATA PROCESSING OR GENERATION, IN GENERAL
- G06T2207/00—Indexing scheme for image analysis or image enhancement
- G06T2207/10—Image acquisition modality
- G06T2207/10072—Tomographic images
- G06T2207/10081—Computed x-ray tomography [CT]
-
- G—PHYSICS
- G06—COMPUTING OR CALCULATING; COUNTING
- G06T—IMAGE DATA PROCESSING OR GENERATION, IN GENERAL
- G06T2207/00—Indexing scheme for image analysis or image enhancement
- G06T2207/10—Image acquisition modality
- G06T2207/10072—Tomographic images
- G06T2207/10088—Magnetic resonance imaging [MRI]
-
- G—PHYSICS
- G06—COMPUTING OR CALCULATING; COUNTING
- G06T—IMAGE DATA PROCESSING OR GENERATION, IN GENERAL
- G06T2207/00—Indexing scheme for image analysis or image enhancement
- G06T2207/30—Subject of image; Context of image processing
- G06T2207/30108—Industrial image inspection
-
- G—PHYSICS
- G06—COMPUTING OR CALCULATING; COUNTING
- G06T—IMAGE DATA PROCESSING OR GENERATION, IN GENERAL
- G06T2207/00—Indexing scheme for image analysis or image enhancement
- G06T2207/30—Subject of image; Context of image processing
- G06T2207/30108—Industrial image inspection
- G06T2207/30124—Fabrics; Textile; Paper
-
- G—PHYSICS
- G06—COMPUTING OR CALCULATING; COUNTING
- G06T—IMAGE DATA PROCESSING OR GENERATION, IN GENERAL
- G06T2210/00—Indexing scheme for image generation or computer graphics
- G06T2210/56—Particle system, point based geometry or rendering
Definitions
- the present disclosure relates to image analysis, and more specifically to analysis of images containing fibers.
- a product containing fibers has a structure in which a plurality of fibers are intricately entwined, and analysis of the structure of a product containing fibers includes, for example, analysis of the shape of each fiber itself such as thickness and length, and fiber. Includes analysis of entanglement between.
- Patent Document 1 states that "a step of acquiring a two-dimensional or three-dimensional image of a product containing a plurality of curved fibers, a fiber portion in an image". Discloses an image analysis method for a product containing a plurality of curved fibers, which comprises a step of packing virtual particles and analyzes the fibers as an aggregate of particles (see [Summary]). ..
- Patent Document 1 it is not possible to estimate the fiber structure independent of the image of the product containing the fiber. Therefore, there is a need for techniques for estimating fiber structures that are independent of the image of the product containing the fibers.
- the present disclosure has been made in view of the above background, and an object in a certain aspect is to provide a technique for estimating a fiber structure independent of an image of a product containing the fiber.
- a method of analyzing an image of a product containing fibers includes a step of acquiring a three-dimensional image of the product containing fibers, a step of converting the fibers in the three-dimensional image into a collection of particles, and a step of converting particles. It includes a step of estimating the structure of the fiber based on the positional relationship of each particle contained in the assembly.
- the step of estimating the structure of the fiber includes the step of generating data imitating the structure of the fiber in the region where the fiber exists, based on the positional relationship of each particle contained in the set of particles.
- the set of particles is a set of points that do not have a radius.
- the data that mimics the structure of a fiber is either a set of polyhedra with a plurality of particles contained in the set of particles as vertices, a string-like object, or a tubular object.
- the steps of estimating the structure of a fiber include increasing the radius of the particle, obtaining the first parameter of the particle when a cavity is created by contact of multiple particles with each other, and the cavity. Includes a step of obtaining a second parameter of the particle when it disappears, and a step of selecting the particle in the region where the fiber is presumed to be present, based on the first parameter and the second parameter. ..
- the step of selecting particles in a region where fibers are presumed to be present constitutes a cavity that has formed or disappeared when the cavity is created or disappeared when the radius of the particle is within a predetermined range.
- the analysis method further includes the step of calculating the set of circumscribed circles of the polyhedron consisting of the selected particles and the step of estimating the position of the center line of the fiber from the set of circumscribed circles.
- the analysis method further includes the step of performing curve fitting on the set of circumscribed circles.
- the analysis method involves calculating the coordinates of a set of points evenly distributed on the centerline and the contact points of adjacent first and second fibers based on the coordinates of the set of points. Further includes an estimation step.
- the step of estimating the contact points of adjacent first and second fibers based on the coordinates of the set of points is part of the set of points in the first fiber and in the second fiber. It includes a step of estimating the position of the circumscribed circle of a triangle that is part of a set of points, and a step of performing curve fitting on the circumscribed circles of multiple triangles.
- a program for causing one or more processors to execute the above method is provided.
- an analysis device includes one or more processors and a memory that stores a program for causing the processors to execute the above method.
- PH Persistent Homology
- the technical concept of the present disclosure is applicable to products and fibers containing fibers. From now on, as an example of a product containing fibers, a network structure having a three-dimensional random loop bonding structure composed of continuous striatum of a thermoplastic elastomer is used, and as an example of fibers, a continuous striatum is used. , The technical idea relating to this disclosure will be described. The technical idea according to the present disclosure is also applicable to products containing other arbitrary fibers and other arbitrary fibers.
- FIG. 1 is a diagram showing an example of an image of fiber network structure analysis.
- Network structure analysis of fibers includes thinning and thickening processes.
- the thinning process is a process of extracting individual fibers as one line.
- the thinning process reveals the structure of the individual fibers.
- the fiber structure 120 can be obtained by thinning the CT (Computed Tomography) scan data 110.
- the thickening process is a process of estimating the contact points of adjacent fibers by giving thickness to individual fibers obtained by the thinning process.
- the thickening process reveals the contacts of adjacent fibers.
- a topology 130 including contact information of adjacent fibers can be obtained.
- the analysis device can perform the above-mentioned fiber network structure analysis, that is, the fiber thinning process and the fiber thinning process.
- the configuration of the analysis device and the flow of network structure analysis will be described.
- FIG. 2 is a diagram showing an example of the hardware configuration of the analysis device 200 according to the present embodiment.
- the analyzer 200 may execute a program that realizes a method for analyzing an image of a product containing fibers, which will be described with reference to FIGS. 3 and 3.
- the analysis device 200 includes a CPU (Central Processing Unit) 201, a primary storage device 202, a secondary storage device 203, an external device interface 204, an input interface 205, an output interface 206, and a communication interface 207. ..
- CPU Central Processing Unit
- the CPU 201 can execute a program for realizing various functions of the analysis device 200.
- the CPU 201 is composed of, for example, at least one integrated circuit.
- the integrated circuit may be composed of, for example, at least one CPU, at least one FPGA (Field Programmable Gate Array), or a combination thereof.
- the primary storage device 202 stores the program executed by the CPU 201 and the data referenced by the CPU 201.
- the primary storage device 202 may be realized by a DRAM (Dynamic Random Access Memory), a SRAM (Static Random Access Memory), or the like.
- the secondary storage device 203 is a non-volatile memory and may store a program executed by the CPU 201 and data referenced by the CPU 201. In that case, the CPU 201 executes the program read from the secondary storage device 203 to the primary storage device 202, and refers to the data read from the secondary storage device 203 to the primary storage device 202.
- the secondary storage device 203 is realized by an HDD (Hard Disk Drive), SSD (Solid State Drive), EPROM (Erasable Programmable Read Only Memory), EPROM (Electrically Erasable Programmable Read Only Memory), flash memory, or the like. You may.
- the external device interface 204 can be connected to any external device such as a printer, scanner and external HDD.
- the external device interface 204 may be realized by a USB (Universal Serial Bus) terminal or the like.
- the input interface 205 can be connected to any input device such as a keyboard, mouse, touchpad or gamepad.
- the input interface 205 may be implemented by a USB terminal, a PS / 2 terminal, a Bluetooth® module, and the like.
- the output interface 206 may be connected to any output device such as a cathode ray tube display, a liquid crystal display or an organic EL (Electro-Luminescence) display.
- the output interface 206 may be realized by a USB terminal, a D-sub terminal, a DVI (Digital Visual Interface) terminal, an HDMI (registered trademark) (High-Definition Multimedia Interface) terminal, or the like.
- the communication interface 207 is connected to a wired or wireless network device.
- the communication interface 207 may be realized by a wired LAN (Local Area Network) port, a Wi-Fi (registered trademark) (Wireless Fidelity) module, or the like.
- the communication interface 207 may transmit and receive data using a communication protocol such as TCP / IP (Transmission Control Protocol / Internet Protocol) and UDP (User Datagram Protocol).
- FIG. 3 is a diagram showing an example of an outline of an image analysis method of a product containing fibers according to the present embodiment. With reference to FIG. 3, a series of procedures for analyzing an image of a product containing fibers according to the present embodiment will be described.
- the analysis method shown in FIG. 3 may be executed as a program by, for example, a computer having a well-known configuration or an analysis device 200.
- the analysis device 200 acquires an image 310 of the product containing the fiber to be analyzed.
- the image 310 is a three-dimensional image of the product containing the fiber to be analyzed, and may include a plurality of slice images.
- the image 310 may be a CT scan image.
- the image 310 may be a three-dimensional image taken by using an arbitrary device such as MRI (Magnetic Resonance Imaging).
- the analysis device 200 converts each fiber in the image 310 into a point cloud 320, which is a collection of virtual particles.
- the set of particles is a set of points having no radius.
- the aggregate of particles may have a radius.
- the analysis device 200 may, for example, execute a conversion process to a point cloud for each slice image in the CT scan image. In that case, the analysis device 200 can generate the point cloud 320 by superimposing the results of the conversion processing of each slice image into the point cloud.
- step 3 the analysis device 200 executes PH analysis on a set of a plurality of particles and obtains plot data 330 which is an analysis result.
- the details of step 3 will be described later.
- the analyzer 200 can estimate the region with fibers and the region without fibers in the image 310 by referring to the plot data 330.
- the analysis results obtained by the PH analysis method represent the characteristics of the distribution of each particle. Therefore, it can be said that the analyzer 200 estimates the fiber structure based on the positional relationship of each particle included in the particle set (state of distribution of each particle).
- the analysis device 200 generates data 340 that imitates the structure of the fiber by using the analysis result by PH analysis (by PH inverse analysis).
- the analysis results obtained by the PH analysis method represent the characteristics of the distribution of each particle. Therefore, it can be said that the analyzer 200 generates data imitating the structure of the fiber based on the positional relationship of each particle included in the set of particles.
- the data that mimics the structure of a fiber places a set of objects such as a point or sphere representing a particle or a polyhedron consisting of a plurality of particles in a region where the fiber exists or a region on the surface of the fiber. It may be a thing.
- the data imitating the structure of the fiber may be a string-shaped object or a tube-shaped object having a hollow inside.
- the product containing the fiber to be analyzed may include, for example, a product containing any fiber such as a network structure having a random loop structure, a non-woven fabric, felt, papermaking, acrylic, polyester, nylon and rayon.
- FIG. 4 is a diagram showing an example of an outline of a manufacturing process of a product containing fibers.
- the product containing fibers here is, for example, a network structure having a three-dimensional random loop bonding structure composed of continuous striatum of a thermoplastic elastomer.
- the fiber-containing product may be a product made of any other fiber.
- the manufacturing apparatus 400 for the product 410 containing fibers has, for example, manufacturing conditions for the product 410 containing fibers.
- the manufacturing conditions include the orifice shape and hole diameter of the nozzle that discharges the resin, the distance between the vertical and horizontal nozzles, the discharge temperature, the discharge amount, the air gap (distance from the discharge to the water landing), and the like.
- Product developers may manufacture products 410 containing fibers with different properties by changing these manufacturing conditions so that the product 410 has the random loop structure required to achieve the desired quality. ..
- the person in charge of product development sets different manufacturing conditions for the manufacturing apparatus 400 and prototypes the product 410 containing fibers twice.
- the person in charge of product development refers to the result of analyzing the three-dimensional image of each product with the analyzer 200, so that the product 410 manufactured under any manufacturing condition is necessary to obtain the target quality. It is possible to confirm whether or not it has a random loop structure.
- the analysis device 200 may output feedback data of the analysis result of the product 410 containing the fiber to the manufacturing device 400.
- the manufacturing apparatus 400 may automatically change the settings based on the feedback data, or may output a display prompting the person in charge of product development to change the settings on a display or the like.
- FIG. 5 is a diagram showing an example of conversion of an image of a product containing fibers into a point cloud.
- the analysis device 200 may receive an image 310, which is a three-dimensional image of a product containing fibers, from a CT scanning device or the like.
- the analyzer 200 may acquire the image 310 via a network, a storage medium, or the like.
- the analysis device 200 analyzes the image 310 and generates a point cloud 320 that expresses the fibers as a set of virtual particles.
- Particles can be represented as points that have no radius. Also, in certain aspects, the particles may be represented as spheres with radii.
- the analysis device 200 can analyze, for example, one of the slice images included in the image 310, and arrange the particles at regular intervals in the region where the fibers are presumed to be present, based on the luminance information in the image and the like. More specifically, the analyzer 200 may generate the point cloud 320 based on either or both of the first processing procedure 510 and the second processing procedure 520.
- the first processing procedure 510 is a procedure for generating the point cloud 320 of the solid fiber.
- the analysis device 200 acquires a two-dimensional slice image of the image 310.
- the analysis device 200 extracts the contour of the two-dimensional slice image.
- the analysis device 200 generates the point cloud 320 based on the contour of the two-dimensional slice image.
- the second processing procedure 520 is a procedure for generating the point cloud 320 of hollow fibers.
- the analysis device 200 acquires a two-dimensional slice image of the image 310.
- the analysis device 200 binarizes the two-dimensional slice image.
- the analysis device 200 generates the point cloud 320 based on the binarized two-dimensional slice image.
- the analyzer 200 can generate a point cloud 320 representing the cavity structure of the fiber.
- the point cloud 320 may represent the solid structure of the fiber.
- the analysis device 200 can generate a point cloud for each slice image, and finally generate a point cloud 320 for a three-dimensional image by superimposing the point cloud for each slice image.
- the analysis device 200 By arranging the fine particles as described above in slice image units, the analysis device 200 accurately arranges the particles in the region where the fibers are present even in an image such as the image 310 in which the fibers appear to overlap. be able to.
- FIG. 6 is a diagram showing an outline of the PH analysis process of the point cloud.
- the PH analysis process includes a one-dimensional PH analysis process (PH1 analysis) and a two-dimensional analysis process (PH2 analysis).
- the processing procedure 610 shows an example of the procedure of the one-dimensional PH analysis method.
- the analysis device 200 regards each particle contained in the point cloud as a set data of spheres (points) having no radius, and gradually inflates each sphere (increases the radius of each sphere). When the analyzer 200 continues to inflate each sphere, the spheres come into contact with each other at a certain timing, so that a cavity 630 (for example, a two-dimensional hole surrounded by a plurality of spheres) is generated in the center of each sphere. ..
- the analyzer 200 continues to inflate each sphere, the cavity 630 is closed and disappears.
- the analyzer 200 acquires parameters (for example, the radius of the sphere) in the generation timing (Birth) and the extinction timing (Death) of the cavity 630.
- the radius of each sphere when the cavity 630 is generated is "b"
- the radius of the sphere when the cavity 630 disappears is "d”.
- the processing procedure 620 shows an example of the procedure of the two-dimensional PH analysis method.
- the analysis device 200 regards each particle contained in the point cloud as a set data of spheres (points) having no radius, and gradually inflates each sphere (increases the radius of each sphere).
- the analyzer 200 continues to inflate each sphere, the spheres come into contact with each other at a certain timing, so that a cavity 640 (a three-dimensional space surrounded by a plurality of spheres) is generated at the center of each sphere. Further, as the analyzer 200 continues to inflate each sphere, the cavity 640 is closed and disappears.
- the analyzer 200 acquires parameters (for example, the radius of the sphere) in the generation timing (Birth) and the extinction timing (Death) of the cavity 640.
- parameters for example, the radius of the sphere
- the radius of each sphere when the cavity 640 is generated is “b”
- the radius of the sphere when the cavity 640 disappears is “d”.
- the one-dimensional PH analysis process acquires parameters at the generation timing and disappearance timing of the two-dimensional hole (cavity).
- the two-dimensional PH analysis process acquires parameters at the generation timing and disappearance timing of the three-dimensional space (cavity).
- multiple cavities can be generated depending on the position and number of spheres (particles).
- cavities A to C are generated during PH analysis.
- the analysis device 200 acquires the radius of each sphere forming the cavity A at the timing of the occurrence of the cavity A.
- the analysis device 200 acquires the radius of each sphere forming the cavity B at the timing of occurrence of the cavity B, and acquires the radius of each sphere forming the cavity C at the timing of occurrence of the cavity C.
- the cavities A to C have disappeared.
- the analysis device 200 acquires the radius of each sphere forming the cavity A until the disappearance timing of the cavity A.
- the analyzer 200 acquires the radius of each sphere that formed each of the cavities B and C until the disappearance timing of the cavities B and C. Then, the analyzer 200 plots the radius of each sphere at the time of each occurrence of the cavities A to C and the radius of each sphere at the time of each extinction of the cavities A to C in two-dimensional coordinates.
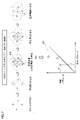
- FIG. 7 is a diagram showing an example of the procedure for plotting the analysis result of the point cloud of the fiber by the PH analysis method.
- the horizontal axis shows the generation parameter (a function represented by the radius of the sphere at the timing when the cavity is generated), and the vertical axis shows the disappearance parameter (a function represented by the radius of the sphere at the timing when the cavity disappears). show.
- the generation and extinction parameters of the cavity 640 are plotted at coordinates P (b, d).
- the unit of coordinates may be any value.
- FIG. 8 is a diagram showing an example of the characteristics of the PH analysis method.
- the PH analysis method has a feature that even if the position of each sphere (each particle constituting the fiber converted into a point cloud) to be analyzed moves to some extent, the influence on the cavity is small and it is resistant to noise. Further, in the PH analysis method, as shown in FIG. 8, a large ring structure 820A and a small ring structure 820B can be generated.
- the large ring structure 820A is included in the region 810A where the difference between the generation parameter and the extinction parameter is large.
- the small ring structure is included in the region 810B where the difference between the generation parameter and the extinction parameter is small.
- the analyzer 200 can exclude particles 830, 840 and the like constituting only the small ring structure 820B from the point cloud as particles that do not affect the fiber structure, for example.
- FIG. 9 is a diagram showing an example of plot data 330 obtained by PH analysis of fibers converted into a point cloud 320.
- the analysis device 200 generates plot data 330 by performing PH analysis on the point cloud 320 based on the procedure described with reference to FIGS. 6 and 7.
- the analyzer 200 can estimate the structure of the fiber, the region where the fiber exists, and the like based on the plot data 330. For example, it can be seen that the majority of cavities in the plot data 330 occur within the radius of occurrence "4-8". In this case, it is highly possible that the spheres (particles) forming the cavity at the generation radius “4 to 8” are densely arranged inside the fiber. In addition, some cavities are generated even when the radius of occurrence is "8" or more. In this case, the particles arranged near each surface of the overlapping fibers may have formed cavities. For example, the analyzer 200 selects particles whose generation parameters and / or extinction parameters satisfy specific conditions with reference to the plot data 330, and determines that the region in which the selected particles are present is the region in which the fibers are present. Can be determined.
- the analyzer 200 includes only spheres that form cavities in which the sphere radii occur within a predetermined range (eg, occurrence radii "4-8") and include these spheres.
- the region may be presumed to be the region where the fibers are present.
- the analyzer 200 selects only the spheres that form the cavities in which the spheres have disappeared within a predetermined range (eg, the radius of occurrence "4-8") and selects these spheres.
- the region containing the fiber may be presumed to be the region where the fiber is present.
- the analyzer 200 selects only spheres that form cavities in which the radius of the sphere is within a predetermined range (eg, radius of occurrence "4-8") and / or disappears. Therefore, the region containing these spheres may be presumed to be the region where the fibers are present.
- a predetermined range eg, radius of occurrence "4-8"
- the analyzer 200 selects particles at positions where fibers are presumed to be present, based on the radius of the sphere when the cavity is created and / or the radius of the sphere when the cavity disappears.
- the structure of the fiber and the region where the fiber is present can be estimated based on the selected particles.
- the analyzer 200 may select only the particles that make up the large ring structure 820A shown in FIG.
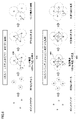
- FIG. 10 is a diagram showing an example of a procedure for generating data imitating a fiber structure based on plot data 330.
- the analyzer 200 analyzes the plot data 330 to form a polyhedron composed of one or more tetrahedra including a plurality of particles 1010 to a tetrahedron 1020.
- the analyzer 200 may select particles 1010 existing in the region 810A or the like shown in FIG. 8 to form a polyhedron.
- the analyzer 200 may select particles 1010 based on generation and extinction parameters and form a polyhedron from the selected particles 1010.
- the analyzer 200 calculates the coordinates of the center (circumcenter) 1040 of the circumscribed circle 1030 of the tetrahedron 1020.
- step 2 the analysis device 200 repeatedly executes the process of step 1 to arrange the tetrahedron 1020 in the region where the fiber 1000 is located.
- the set of these tetrahedrons 1020 becomes data 1050 that imitates the structure of the fiber. Further, the analysis device 200 calculates the coordinates of the circumcenter 1040 of each tetrahedron 1020.
- the analyzer 200 estimates the position of the center line 1060 of the fiber 1000 from each circumcenter 1040.
- the analyzer 200 can estimate the position of the centerline 1060 by performing curve fitting for each circumcenter 1040 plotted in a three-dimensional space.
- step 4 the analysis device 200 obtains the coordinates of the points arranged at equal intervals on the center line 1060.
- the spacing between points can be determined arbitrarily.
- the analyzer 200 may estimate the contacts of adjacent fibers based on these points.
- FIG. 11 is a diagram showing an example of the first procedure of the process of estimating the contact points of adjacent fibers (thickening process).
- the analyzer 200 calculates the coordinates of a plurality of points 1070A evenly arranged on the center line 1060A of the fiber 1000A. Further, the analysis device 200 calculates the coordinates of a plurality of points 1070B evenly arranged on the center line 1060B of the fiber 1000B.
- step 2 the analysis device 200 obtains plot data 1120 by one-dimensional PH analysis of these points.
- step 3 the analysis device 200 selects a point from the plot data 1120 where the generation parameter and the extinction parameter satisfy certain conditions.
- the analyzer 200 selects a polygon composed of one or more triangles including the triangle 1140.
- the conditions under which the generation parameter and the extinction parameter are constant can be determined by the range of the generation parameter and the range of the extinction parameter.
- the range of each parameter can be determined in advance based on experimental results and the like.
- the analyzer 200 may form a polygon composed of one or more triangles including the triangle 1140 based on the selected points. For example, of the vertices of the triangle 1140, one may be selected from the point 1070A of the fiber 1000A and two may be selected from the point 1070B of the fiber 1000B. The larger the contact area of adjacent fibers 1000A, 1000B, the more the number of triangles 1140 can increase.
- FIG. 12 is a diagram showing an example of a second procedure of the process of estimating the contact points of adjacent fibers (thickening process).
- the procedure shown in FIG. 12 is a continuation of the procedure shown in FIG.
- the analyzer 200 calculates the center (circumcenter) 1260 of the circumscribed circle 1250 of the triangle 1140.
- the analyzer 200 repeatedly executes the process of step 4 to obtain a set of circumscribed circles 1270.
- step 6 the analyzer 200 selects the set of circumscribed circles 1270.
- step 7 the analyzer 200 performs curve fitting on the set of circumscribed circles 1270 and estimates the contacts of the fibers 1000A and 1000B.
- the contacts of fibers 1000A and 1000B can be represented as curves 1280.
- the analysis device 200 obtains the coordinates of the points 1290 arranged at equal intervals on the curve 1280. The spacing between points can be determined arbitrarily.
- the analyzer 200 can estimate the fiber structure (center line and a set of points evenly arranged on the center line) by the process shown in FIG. Further, the analyzer 200 estimates the contact points of adjacent fibers (a curve indicating the position where the two fibers contact and a set of points evenly arranged on the curve) by the processes shown in FIGS. 11 and 12. obtain.
- a person in charge of developing a product containing fibers can refer to information on the structure of these fibers and the contact points of adjacent fibers to see the structure of individual fibers contained in the product containing fibers and the degree of entanglement between the fibers. Etc. can be grasped.
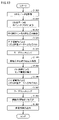
- FIG. 13 is a diagram showing an example of a procedure for analyzing an image of a product containing fibers.
- the CPU 201 may read the program for performing the process of FIG. 13 from the secondary storage device 203 into the primary storage device 202 and execute the program.
- some or all of the processing may also be realized as a combination of circuit elements configured to perform the processing.
- the CPU 201 acquires 3D image data from an external device.
- the 3D image data may be a CT scan image.
- the three-dimensional image data may be three-dimensional image data taken by using an arbitrary device such as MRI.
- the CPU 201 may acquire the three-dimensional image data via an arbitrary network or storage medium.
- step S1310 the CPU 201 converts the acquired 3D image data into a point cloud. More specifically, the CPU 201 analyzes two-dimensional image data, which is slice data of three-dimensional image data, as an example, and creates a point cloud of each two-dimensional image data. The CPU 201 can create a point cloud of 3D image data by synthesizing a point cloud of each 2D image data. The process of this step corresponds to the analysis method described with reference to FIG.
- step S1315 the CPU 201 executes a secondary PH analysis process (PH2 analysis) on the point cloud. Further, the CPU 201 generates data obtained by plotting the results of PH2 analysis in two-dimensional coordinates.
- the process of this step corresponds to the analysis method described with reference to FIGS. 6 to 9.
- step S1320 the CPU 201 executes a particle fitting process to the three-dimensional data by PH2 inverse analysis. More specifically, as an example, the CPU 201 generates data imitating the structure of a fiber by arranging a polyhedron composed of a plurality of (for example, four) particles included in a point cloud in a three-dimensional space. Further, the CPU 201 calculates the circumscribed circle of each polyhedron. In one aspect, instead of arranging the polyhedron in three-dimensional space, the CPU 201 has string-like data or a tube-like hollow inside at a position where fibers are presumed to be present, based on the analysis result of the process of step S1315. Data may be placed.
- step S1325 the CPU 201 executes curve fitting with respect to the set of circumscribed circles obtained in step S1320.
- step S1330 the CPU 201 obtains a curve representing the center line of the fiber. Further, the CPU 201 calculates the coordinates of the points arranged at equal intervals on the center line.
- the processing of steps S1320 and S1325 corresponds to the analysis method described with reference to FIG.
- step S1335 the CPU 201 executes one-dimensional PH analysis (PH1 analysis) on the point set arranged on the center line calculated in step S1325, and extracts a ring structure (cavity composed of a plurality of points). ..
- step S1340 the CPU 201 executes a point fitting process to three-dimensional data by PH1 inverse analysis. More specifically, the CPU 201 obtains a triangle consisting of a set of points arranged on the center line and the circumcenter of the triangle. In step S1345, the CPU 201 executes curve fitting with respect to the set of circumcenters of the triangles obtained in step S1340.
- step S1350 the CPU 201 obtains a curve representing the contact points of adjacent fibers. Further, the CPU 201 calculates the coordinates of the points arranged at equal intervals on the curve representing the contact points of the adjacent fibers.
- the processing of this step corresponds to the analysis method described with reference to FIGS. 11 and 12 in the processing of steps S1335 to S1350.
- step S1355 the CPU 201 outputs analysis data (data imitating the structure of the fiber, information on the center line of the fiber, information on the contact points of adjacent fibers, etc.) obtained in the processes up to step S1350.
- the CPU 201 may output the analysis data to the display.
- the CPU 201 may transmit analysis data to another device. Further, in another aspect, the CPU 201 may input analysis data into another analysis program.
- the three-dimensional image data of the product containing fibers is converted into a point cloud, the converted data is PH-analyzed, and the analysis result is obtained. Generates data that mimics the structure of the fiber based on.
- a person in charge of developing a product containing fibers can analyze the individual structure of the fibers contained in the manufactured product, the degree of entanglement between the fibers, and the like.
- the structure of the fiber and the position of the center line are estimated based on the position of the circumscribed circle of the polyhedron composed of a plurality of particles constituting the point cloud.
- the analysis method can acquire information on the contact points of adjacent fibers based on the center line of the adjacent fibers.
- the person in charge of development analyzes the shape of the fiber by using the analysis technique of the image of the product containing the fiber according to the present embodiment, so that the orientation of the fiber, the length of the fiber, and the curvature of the fiber can be analyzed.
- the spatial position of the fiber, the density of the fiber, or the distribution of the pores of the fiber can be quantified and evaluated.
- the person in charge of development analyzes the entanglement of the fibers by using the method of analyzing the image of the product containing the fibers according to the present embodiment, and thereby the size of the contact / contact group (Side-by-side).
- Contact / contact group distribution, contact / contact group orientation, contact position (distribution) along the fiber, curvature between contacts, length between contacts, orientation between contacts, etc. are quantified and evaluated. obtain.
- 110 scan data, 120 fiber structure, 130 topology, 200 analysis device, 201 CPU, 202 primary storage device, 203 secondary storage device, 204 external device interface, 205 input interface, 206 output interface, 207 communication interface, 310 image, 320 point cloud, 330,720,810,1120 plot data, 340,1050 data imitating fiber structure, 400 manufacturing equipment, 410 products, 510 first processing procedure, 520 second processing procedure, 610,620 processing Procedure, 630,640, A, B, C cavity, 810A, 810B region, 820A, 820B ring structure, 1000, 1000A, 1000B fiber, 1010 particles, 1020 tetrahedron, 1030, 1250 circumscribed circle, 1040, 1260 circumscribed circle. 1070, 1290 points, 1060 center line, 1140 triangle, 1270 circumscribed circle set, 1280 curve.
Landscapes
- Engineering & Computer Science (AREA)
- Physics & Mathematics (AREA)
- General Physics & Mathematics (AREA)
- Theoretical Computer Science (AREA)
- Computer Vision & Pattern Recognition (AREA)
- Geometry (AREA)
- Life Sciences & Earth Sciences (AREA)
- Chemical & Material Sciences (AREA)
- Health & Medical Sciences (AREA)
- Computer Graphics (AREA)
- Software Systems (AREA)
- Immunology (AREA)
- Pathology (AREA)
- Food Science & Technology (AREA)
- Medicinal Chemistry (AREA)
- Analytical Chemistry (AREA)
- Biochemistry (AREA)
- General Health & Medical Sciences (AREA)
- Textile Engineering (AREA)
- Quality & Reliability (AREA)
- Image Analysis (AREA)
- Analysing Materials By The Use Of Radiation (AREA)
- Image Processing (AREA)
- Manufacture, Treatment Of Glass Fibers (AREA)
- Testing Of Coins (AREA)
Abstract
Description
ある局面において、繊維の構造を模したデータは、粒子の集合に含まれる複数の粒子を頂点とする多面体の集合、紐状のオブジェクト、または、チューブ状のオブジェクトのいずれかである。
Claims (12)
- 繊維を含む製品の画像の解析方法であって、
前記繊維を含む製品の3次元画像を取得するステップと、
前記3次元画像の中の前記繊維を粒子の集合に変換するステップと、
前記粒子の集合に含まれる各粒子の位置関係に基づいて、前記繊維の構造を推定するステップとを含む、解析方法。 - 前記繊維の構造を推定するステップは、前記粒子の集合に含まれる各粒子の位置関係に基づいて、前記繊維が存在する領域に前記繊維の構造を模したデータを生成するステップを含む、請求項1に記載の解析方法。
- 前記粒子の集合は、半径を持たない点の集合である、請求項1または2に記載の解析方法。
- 前記繊維の構造を模したデータは、前記粒子の集合に含まれる複数の前記粒子を頂点とする多面体の集合、紐状のオブジェクト、または、チューブ状のオブジェクトのいずれかである、請求項2または3に記載の解析方法。
- 前記繊維の構造を推定するステップは、
前記粒子の半径を増加させるステップと、
複数の前記粒子が互いに接触することにより空洞が発生するときの前記粒子の第1のパラメータを取得するステップと、
前記空洞が消滅するときの前記粒子の第2のパラメータを取得するステップと、
前記第1のパラメータと、前記第2のパラメータとに基づいて、前記繊維が存在すると推定される領域にある前記粒子を選択するステップとを含む、請求項2~4のいずれかに記載の解析方法。 - 前記繊維が存在すると推定される領域にある前記粒子を選択するステップは、前記粒子の半径が予め定められた範囲内である場合に前記空洞が発生または消滅したとき、発生または消滅した前記空洞を構成する前記粒子が存在する領域を前記繊維が存在する領域であると判定するステップを含む、請求項5に記載の解析方法。
- 選択された前記粒子からなる多面体の外心の集合を算出するステップと、
前記外心の集合から、前記繊維の中心線の位置を推定するステップとをさらに含む、請求項5または6に記載の解析方法。 - 前記外心の集合にカーブフィッティングを実行するステップをさらに含む、請求項7に記載の解析方法。
- 前記中心線上に均等に配置された点の集合の座標を算出するステップと、
前記点の集合の座標に基づいて、隣接する第1の繊維および第2の繊維の接点を推定するステップとをさらに含む、請求項7に記載の解析方法。 - 前記点の集合の座標に基づいて、隣接する第1の繊維および第2の繊維の接点を推定するステップは、
前記第1の繊維における前記点の集合の一部と、前記第2の繊維における前記点の集合の一部とからなる三角形の外心の位置を推定するステップと、
複数の前記三角形の外心にカーブフィッティングを実行するステップとを含む、請求項9に記載の解析方法。 - 請求項1~10のいずれかに記載の方法を1または複数のプロセッサに実行させるためのプログラム。
- 1または複数のプロセッサと、
請求項11に記載の方法を前記プロセッサに実行させるためのプログラムを格納したメモリとを備える、解析装置。
Priority Applications (5)
| Application Number | Priority Date | Filing Date | Title |
|---|---|---|---|
| EP21917646.8A EP4276740A4 (en) | 2021-01-06 | 2021-12-15 | ANALYSIS METHOD FOR IMAGES OF FIBROUS PRODUCTS AND PROGRAM AND ANALYSIS DEVICE THEREFOR |
| JP2022529089A JP7188644B2 (ja) | 2021-01-06 | 2021-12-15 | 繊維を含む製品の画像の解析方法、そのプログラムおよび解析装置 |
| CN202180089327.9A CN116745806A (zh) | 2021-01-06 | 2021-12-15 | 含有纤维的制品的图像的分析方法及其程序、以及分析装置 |
| US18/270,759 US20240054675A1 (en) | 2021-01-06 | 2021-12-15 | Method for analyzing image of product including fiber, non-transitory computer-readable medium therefor, and analysis device |
| KR1020237026264A KR20230128522A (ko) | 2021-01-06 | 2021-12-15 | 섬유를 포함하는 제품의 화상의 해석 방법, 그 프로그램및 해석 장치 |
Applications Claiming Priority (2)
| Application Number | Priority Date | Filing Date | Title |
|---|---|---|---|
| JP2021-000899 | 2021-01-06 | ||
| JP2021000899 | 2021-01-06 |
Publications (1)
| Publication Number | Publication Date |
|---|---|
| WO2022149425A1 true WO2022149425A1 (ja) | 2022-07-14 |
Family
ID=82357264
Family Applications (1)
| Application Number | Title | Priority Date | Filing Date |
|---|---|---|---|
| PCT/JP2021/046269 Ceased WO2022149425A1 (ja) | 2021-01-06 | 2021-12-15 | 繊維を含む製品の画像の解析方法、そのプログラムおよび解析装置 |
Country Status (7)
| Country | Link |
|---|---|
| US (1) | US20240054675A1 (ja) |
| EP (1) | EP4276740A4 (ja) |
| JP (1) | JP7188644B2 (ja) |
| KR (1) | KR20230128522A (ja) |
| CN (1) | CN116745806A (ja) |
| TW (1) | TWI811914B (ja) |
| WO (1) | WO2022149425A1 (ja) |
Families Citing this family (1)
| Publication number | Priority date | Publication date | Assignee | Title |
|---|---|---|---|---|
| JP2024139245A (ja) | 2023-03-27 | 2024-10-09 | 国立大学法人大阪大学 | 条件予測方法、プログラム、および装置 |
Citations (7)
| Publication number | Priority date | Publication date | Assignee | Title |
|---|---|---|---|---|
| JP2004052212A (ja) * | 2002-07-20 | 2004-02-19 | Truetzschler Gmbh & Co Kg | 繊維素材を検査および評価するための装置 |
| JP2006146536A (ja) * | 2004-11-19 | 2006-06-08 | Daicel Chem Ind Ltd | 解析プログラム |
| US20160024699A1 (en) * | 2014-07-25 | 2016-01-28 | Illinois Tool Works, Inc. | Particle-filled fiber and articles formed from the same |
| JP2016045141A (ja) | 2014-08-26 | 2016-04-04 | 国立大学法人京都工芸繊維大学 | 繊維の画像解析方法及び画像解析システム |
| WO2016052489A1 (ja) * | 2014-09-29 | 2016-04-07 | 株式会社Ihi | 画像解析装置、画像解析方法及びプログラム |
| JP2017507327A (ja) * | 2014-01-15 | 2017-03-16 | ボリュームグラフィックス ゲーエムベーハーVolume Graphics Gmbh | 不織繊維複合布又は織繊維複合布を含む部材の検査装置及び方法 |
| JP2020139239A (ja) * | 2019-02-27 | 2020-09-03 | 株式会社島津製作所 | 繊維長測定方法、繊維長測定装置及び繊維長測定プログラム |
Family Cites Families (16)
| Publication number | Priority date | Publication date | Assignee | Title |
|---|---|---|---|---|
| JPH04363044A (ja) * | 1991-01-08 | 1992-12-15 | Toshiba Corp | 半導体素子評価方法における二次元形状認識方法 |
| JPH0737097A (ja) * | 1993-07-22 | 1995-02-07 | Olympus Optical Co Ltd | 複数の画数を有する図形の認識方法 |
| JP3581506B2 (ja) * | 1996-11-28 | 2004-10-27 | 日本電信電話株式会社 | 形状処理方法 |
| JP2008163535A (ja) * | 2007-01-05 | 2008-07-17 | Nano Carbon Technologies Kk | 炭素繊維複合構造体および炭素繊維複合構造体の製造方法 |
| TWI345013B (en) * | 2007-12-21 | 2011-07-11 | Taiwan Textile Res Inst | Method for joining textile and joined textile thereof |
| JP4688902B2 (ja) * | 2008-06-06 | 2011-05-25 | 花王株式会社 | 繊維の形状評価方法 |
| JP2013080433A (ja) * | 2011-10-05 | 2013-05-02 | Nippon Telegr & Teleph Corp <Ntt> | ジェスチャ認識装置及びそのプログラム |
| JP6198104B2 (ja) * | 2013-03-15 | 2017-09-20 | 株式会社三次元メディア | 3次元物体認識装置及び3次元物体認識方法 |
| WO2015024580A1 (en) * | 2013-08-19 | 2015-02-26 | Universidad De Burgos | Computer implemented method to obtain the orientations of fibres inside composite materials using computed tomography scan |
| US11542634B2 (en) * | 2014-07-25 | 2023-01-03 | Illinois Tool Works Inc. | Particle-filled fiber and articles formed from the same |
| CN104200526B (zh) * | 2014-09-19 | 2017-08-11 | 中国科学院合肥物质科学研究院 | 一种数字纸张纤维网络结构的生成方法及其应用 |
| JP6209506B2 (ja) * | 2014-11-25 | 2017-10-04 | ラトックシステムエンジニアリング株式会社 | 繊維の解析用メッシュ形成方法及びプログラム |
| JP6586852B2 (ja) * | 2015-10-15 | 2019-10-09 | サクサ株式会社 | 画像処理装置 |
| DE102019115138B3 (de) * | 2019-06-05 | 2020-12-10 | TRüTZSCHLER GMBH & CO. KG | Karde, Vliesleitelement, Spinnereivorbereitungsanlage und Verfahren zur Erfassung von störenden Partikeln |
| CN110443785A (zh) * | 2019-07-18 | 2019-11-12 | 太原师范学院 | 一种持久同调下三维点云的特征提取方法 |
| WO2022094591A1 (en) * | 2020-10-30 | 2022-05-05 | The Procter & Gamble Company | Structures comprising particles and processes for making same |
-
2021
- 2021-12-15 KR KR1020237026264A patent/KR20230128522A/ko not_active Withdrawn
- 2021-12-15 EP EP21917646.8A patent/EP4276740A4/en not_active Withdrawn
- 2021-12-15 CN CN202180089327.9A patent/CN116745806A/zh active Pending
- 2021-12-15 US US18/270,759 patent/US20240054675A1/en active Pending
- 2021-12-15 JP JP2022529089A patent/JP7188644B2/ja active Active
- 2021-12-15 WO PCT/JP2021/046269 patent/WO2022149425A1/ja not_active Ceased
- 2021-12-24 TW TW110148566A patent/TWI811914B/zh active
Patent Citations (7)
| Publication number | Priority date | Publication date | Assignee | Title |
|---|---|---|---|---|
| JP2004052212A (ja) * | 2002-07-20 | 2004-02-19 | Truetzschler Gmbh & Co Kg | 繊維素材を検査および評価するための装置 |
| JP2006146536A (ja) * | 2004-11-19 | 2006-06-08 | Daicel Chem Ind Ltd | 解析プログラム |
| JP2017507327A (ja) * | 2014-01-15 | 2017-03-16 | ボリュームグラフィックス ゲーエムベーハーVolume Graphics Gmbh | 不織繊維複合布又は織繊維複合布を含む部材の検査装置及び方法 |
| US20160024699A1 (en) * | 2014-07-25 | 2016-01-28 | Illinois Tool Works, Inc. | Particle-filled fiber and articles formed from the same |
| JP2016045141A (ja) | 2014-08-26 | 2016-04-04 | 国立大学法人京都工芸繊維大学 | 繊維の画像解析方法及び画像解析システム |
| WO2016052489A1 (ja) * | 2014-09-29 | 2016-04-07 | 株式会社Ihi | 画像解析装置、画像解析方法及びプログラム |
| JP2020139239A (ja) * | 2019-02-27 | 2020-09-03 | 株式会社島津製作所 | 繊維長測定方法、繊維長測定装置及び繊維長測定プログラム |
Non-Patent Citations (4)
| Title |
|---|
| MICHIAKI NOBUYUKI, ET AL.: "Measurement of Fabrics in Three Dimension by Optical Microscope Tomography - Simulation with Test Phantom -", JOURNAL OF TEXTILES, vol. 63, no. 3, 10 March 2007 (2007-03-10), pages 74 - 80, XP055949376, DOI: 10.2115/fiber.63.74 * |
| See also references of EP4276740A4 |
| TOMOKO KANATANI, YUMIKO ISOGAI, KENJI FURUICHI, KATSUHISA YAMASHITA, CHISATO NONOMURA, AI KAWASAKI, TAKESHI NISIWAKI, MASANOBU MUR: "Deformation behavior of notched thermo-plastic elastomer specimen (1) - Observation of true strain during tensile test by Digital Image Correlation Method ", PREPRINTS OF SEIKEI-KAKOU ANNUAL MEETING 2014, SOCIETY OF PLASTICS PROCESSING, JP, vol. 25, 27 May 2014 (2014-05-27), JP, pages 203 - 204, XP009538078 * |
| UEHARA, FUMIYA: "Three dimensional observation and quantitative analysis of fiber materials", SENI GAKKAISHI = JOURNAL OF THE SOCIETY OF FIBER SCIENCE AND TECHNOLOGY, vol. 76, no. 8, 20 August 2020 (2020-08-20), pages 337 - 342, XP009538073, ISSN: 0037-9875, DOI: 10.2115/fiber.76.P-337 * |
Also Published As
| Publication number | Publication date |
|---|---|
| KR20230128522A (ko) | 2023-09-05 |
| JP7188644B2 (ja) | 2022-12-13 |
| US20240054675A1 (en) | 2024-02-15 |
| TWI811914B (zh) | 2023-08-11 |
| CN116745806A (zh) | 2023-09-12 |
| TW202244843A (zh) | 2022-11-16 |
| EP4276740A1 (en) | 2023-11-15 |
| EP4276740A4 (en) | 2024-08-07 |
| JPWO2022149425A1 (ja) | 2022-07-14 |
Similar Documents
| Publication | Publication Date | Title |
|---|---|---|
| Cholewo et al. | Gamut boundary determination using alpha-shapes | |
| CN106202728B (zh) | 基于Micro-CT三维编织复合材料非均匀Voxel网格离散方法 | |
| US20050068317A1 (en) | Program, method, and device for comparing three-dimensional images in voxel form | |
| JP2007523402A (ja) | 内部個別要素を用いるメッシュモデル | |
| EP3035291B1 (en) | Rendering based generation of occlusion culling models | |
| JP2017503236A (ja) | 3d印刷のためのボリュームレンダリング多角形 | |
| Stojanovic et al. | Generation of Approximate 2D and 3D Floor Plans from 3D Point Clouds. | |
| US10650587B2 (en) | Isosurface generation method and visualization system | |
| US10832095B2 (en) | Classification of 2D images according to types of 3D arrangement | |
| CN104077987A (zh) | 基于阿尔法形态的显示器三维色域体积快速算法 | |
| CN108491677A (zh) | 基于改进最大球法的微观孔隙模型的孔隙特征统计方法 | |
| WO2022149425A1 (ja) | 繊維を含む製品の画像の解析方法、そのプログラムおよび解析装置 | |
| JPWO2006013813A1 (ja) | 情報処理装置およびプログラム | |
| CN116740259A (zh) | 一种流光效果的渲染方法、装置、以及电子设备 | |
| KR20240086085A (ko) | 시맨틱 맵에 기초하여 프레임 이미지를 복원하는 방법 및 장치 | |
| CN114218837A (zh) | 一种仿三维屈曲模态变形的负泊松比结构设计方法 | |
| US12597210B2 (en) | Generating polygon meshes approximating surfaces with sub-cell features | |
| US8941680B2 (en) | Volumetric image motion-based visualization | |
| KR20060028044A (ko) | 2차원 의료영상을 이용한 3차원 유한요소 모델링 방법 및기록매체 | |
| JP2014120005A (ja) | 肌形状生成装置、肌形状生成方法、及び肌形状生成プログラム | |
| CN110047127A (zh) | 一种三维几何体的消隐方法及显示方法 | |
| JP4810395B2 (ja) | 医用画像生成装置及びその方法 | |
| JP2017102592A (ja) | 複合材料に含まれる物質の解析用メッシュ形成方法及びプログラム | |
| Lin et al. | Visualizing mathematical knot equivalence | |
| Muniz et al. | Polygonal mesh extraction from digital voxel art |
Legal Events
| Date | Code | Title | Description |
|---|---|---|---|
| ENP | Entry into the national phase |
Ref document number: 2022529089 Country of ref document: JP Kind code of ref document: A |
|
| 121 | Ep: the epo has been informed by wipo that ep was designated in this application |
Ref document number: 21917646 Country of ref document: EP Kind code of ref document: A1 |
|
| WWE | Wipo information: entry into national phase |
Ref document number: 18270759 Country of ref document: US |
|
| WWE | Wipo information: entry into national phase |
Ref document number: 202317045019 Country of ref document: IN Ref document number: 202180089327.9 Country of ref document: CN |
|
| ENP | Entry into the national phase |
Ref document number: 20237026264 Country of ref document: KR Kind code of ref document: A |
|
| WWE | Wipo information: entry into national phase |
Ref document number: 1020237026264 Country of ref document: KR |
|
| NENP | Non-entry into the national phase |
Ref country code: DE |
|
| ENP | Entry into the national phase |
Ref document number: 2021917646 Country of ref document: EP Effective date: 20230807 |
|
| WWW | Wipo information: withdrawn in national office |
Ref document number: 2021917646 Country of ref document: EP |